Note: Descriptions are shown in the official language in which they were submitted.
CA 03148386 2022-01-21
WO 2021/015755
PCT/US2019/043212
CONTAMINATION DETERMINATION OF BIOSENSORS USED IN ANALYTE
MEASUREMENT SYSTEMS
TECHNIC AL F ____________________________ LD
[0001] This
application is generally directed to analyte measurement systems, and
more specifically to methods for determining contamination, e.g., moisture
contamination
of a biosensor used in analyte measurement systems.
BACKGROUND
[0002]
Analyte detection in physiological fluids, e.g., blood or blood derived
products, is of ever increasing importance to today's society. Analyte
detection assays
find use in a variety of applications, including clinical laboratory testing,
home testing,
etc., where the results of such testing play a prominent role in periodic
diagnosis and
management in a variety of disease conditions. Analytes of interest include
glucose for
diabetes management and cholesterol, among others. In response to the growing
importance of analyte detection, a variety of testing protocols and devices
for both
clinical and home use have been developed.
[0003] One
method that is employed for analyte detection of a liquid sample is
the electrochemical method. In such a method, an aqueous liquid sample such as
a blood
sample is deposited onto a biosensor and filled into a sample-receiving
chamber of an
electrochemical cell that includes two electrodes, e.g., a counter and working
electrode.
The analyte is allowed to react with a redox reagent to form an oxidizable (or
reducible)
substance in an amount corresponding to the analyte concentration. The
quantity of the
oxidizable (or reducible) substance present is then estimated
electrochemically and
related to the amount of analyte present in the deposited sample.
[0004] For
example, one of the blood glucose measurement systems
manufactured by LifeScan Inc., and marketed as One-Touch Verio ("Verio") has
shown
remarkably good overall performance and accuracy.
1
100051
However, any analyte measurement system may be susceptible to various
modes of inefficiency and/or error. For
example, biosensors used in analyte
measurement systems, such as disposable test strips, may become contaminated
or
damaged when stored by patients for self-administered blood tests, such as
blood glucose
tests. Unfortunately, contaminated or damaged test strips may lead to
erroneous, or
higher than expected, analyte concentration measurements. These
erroneous
measurements can mislead a subject into administering the wrong dosage of
medicine
with potentially catastrophic results. Therefore, an urgent need exists to
determine
whether or not a critical amount of contamination or damage of a biosensor has
in fact
occurred before reporting an analyte measurement result.
SUMMARY
10005A1 In
one embodiment, there is provided a method for determining the
presence of contamination of a biosensor. The method includes: loading the
biosensor
into a test meter and applying a sample having an analyte of interest to the
biosensor, the
biosensor having an electrochemical cell defined by a pair of spaced
electrodes; applying
a first predetermined voltage between the spaced electrodes of the
electrochemical cell
for a first predetermined time interval, and a second predetermined voltage
between the
spaced electrodes during a second predetermined time interval after the first
predetermined time interval; measuring first current values during the first
predetermined
time interval; determining a first reference value based on a sum of the first
current
values during the first predetermined time interval; measuring second current
values
during the second predetermined time interval; determining a second reference
value
based on a peak current value of the second current values measured during the
second
predetermined time interval and a third reference value based on the rate of
change in the
second current values that have been measured after the peak current value
during the
second time interval; determining whether the biosensor is contaminated based
on one or
more of the first through the third reference values; and suppressing
reporting of the
concentration of the analyte in the sample upon the determination that the
biosensor is
contaminated based on the one or more of the first through the third reference
values.
2
Date Recue/Date Received 2023-03-22
10005B1 In
one embodiment, there is provided a test meter for determining the
presence of contamination of a biosensor. The test meter includes: a voltage
source; a
user interface; and a controller. The controller is configured to: apply with
the voltage
source, a first predetermined voltage between the spaced electrodes of an
electrochemical
cell of a biosensor having an applied fluidic sample for a first predetermined
time
interval; measure first current values during the first predetermined time
interval;
determine a first reference value that is a sum of the first current values
during the first
predetermined time interval; apply with the voltage source a second
predetermined
voltage between the spaced electrodes during a second predetermined time
interval after
the first predetermined time interval; measure second current values during
the second
predetermined time interval; determine a second reference value based on a
peak current
value of the second current values measured during the second predetermined
time
interval and a third reference value based on the rate of change in the second
current
values that have been measured after the peak current value during the second
time
interval; and display on the user interface whether the biosensor is
contaminated based on
one or more of the first through the third reference values.
BRIFT DESCRIPTION OF THE DRAWINGS
[0006] So
that the manner in which the features of the disclosure can be
understood, a Detailed Description may be had by reference to certain
embodiments,
some of which are illustrated in the accompanying drawings. It is to be noted,
however,
that the drawings illustrate only certain embodiments and are therefore not to
be
considered limiting of its scope, for the scope of the disclosed subject
matter
encompasses other embodiments as well. The drawings are not necessarily to
scale,
emphasis generally being placed upon illustrating the features of certain
embodiments.
In the drawings, like numerals are used to indicate like parts throughout the
various
views.
2a
Date Recue/Date Received 2023-03-22
100071 FIG. 1 illustrates a perspective view of an analyte measurement
system
including a test meter and biosensor (test strip), in accordance with aspects
set forth
herein;
[0008] FIG. 2 is a top facing view of a circuit board disposed in the
test meter of
FIG. 1, depicting various components in accordance with aspects set forth
herein;
[0009] FIG. 3A is a perspective view of an assembled test strip
suitable for use in
the analyte measurement system of FIGS. 1 and 2;
2b
Date Recue/Date Received 2023-03-22
CA 03148386 2022-01-21
WO 2021/015755
PCT/US2019/043212
[0010] FIG. 3B is an exploded perspective view of the test strip of FIG.
3A;
[0011] FIG. 3C is an expanded perspective view of a proximal portion of
the test
strip of FIGS. 3A and 3B;
[0012] FIG. 3D is a bottom plan view of the test strip of FIGS. 3A-3C;
[0013] FIG. 3E is a side elevational view of the test strip of FIGS. 3A-
3D;
[0014] FIG. 3F is a top plan view of the test strip of FIGS. 3A-3E;
[0015] FIG. 3G is a partial side elevational view of a proximal portion
of the test
strip of FIGS. 3A-3F;
[0016] FIG. 4 is a simplified schematic diagram showing a test meter
electrically
interfacing with portions of a test strip, such as the test strip depicted in
FIGS. 3A-3F;
[0017] FIG. 5A shows an example of a test waveform applied by the test
meter of
FIG. 4 to the working and counter electrodes of a test strip for prescribed
time intervals
for the determination of an analyte in a sample applied to the test strip;
[0018] FIG. 5B depicts measured current over time based on the waveform
of
FIG. 5A for a nominal test strip;
[0019] FIG. 5C is a flowchart representing a method for determining
analyte
concentration in a test strip;
[0020] FIG. 6A depicts a graphical comparison illustrating measured
current
values between a nominal test strip and contaminated test strip over time
based upon a
portion of the waveform of FIG. 5A; and
[0021] FIG. 6B is a flowchart representing a method for determining the
presence
of contamination in a test strip in accordance with aspects set forth herein.
3
CA 03148386 2022-01-21
WO 2021/015755
PCT/US2019/043212
DETAILED DESCRIPTION
[0022] The
following Detailed Description should be read with reference to the
drawings, in which like elements in different drawings are identically
numbered. The
drawings, which are not necessarily to scale, depict selected embodiments and
are not
intended to limit the scope of the invention. The Detailed Description
illustrates by way
of example, not by way of limitation, the principles of the invention. This
description will
clearly enable one skilled in the art to make and use the invention, and
describes several
embodiments, adaptations, variations, alternatives and uses of the invention,
including
what is presently believed to be the best mode of carrying out the invention.
[0023] As
used herein, the terms "about" or "approximately" for any numerical
values or ranges indicate a suitable dimensional tolerance that allows the
part or
collection of components to function for its intended purpose as described
herein. In
addition, as used herein, the terms "patient," "host," "user," and "subject"
refer to any
human or animal subject and are not intended to limit the systems or methods
to human
use, although use of the subject techniques in a human patient represents a
preferred
embodiment.
[0024] The
present disclosure relates, in part, to techniques for determining, with
a biosensor such as a disposable test strip, whether the biosensor has been
contaminated
or damaged prior to the conduction of a test for determining analyte
concentration of an
applied sample. In addition to moisture contamination, these techniques may be
applied
to test strips that have been exposed to extreme temperatures (e.g., well
above typical
room temperatures), excessive light, higher levels of humidity, etc. Such
contamination
or exposure, which may result from improper storage, can lead to a certain
amount of the
mediator on a test strip electrode being converted, e.g., from potassium
ferricyanide to
potassium ferrocyanide. In one example, a moisture contaminated blood glucose
test
strip may have an erroneously higher than expected result which is
approximately 80
mg/dL (or greater) higher than the actual blood glucose value. In such a case,
this higher
than expected measurement could lead to an incorrectly high dose of insulin
being
administered to a patient, resulting in a severe impact on the health of the
patient.
4
CA 03148386 2022-01-21
WO 2021/015755
PCT/US2019/043212
[0025]
Conversely, if a small amount of moisture contaminates a test strip, such
that the test strip may still give results that are within an acceptable range
of accuracy, the
test result should be displayed to the patient. Thus, simple methods that only
determine
that some unknown level of moisture has contaminated a test strip do not solve
the
problem of only eliminating higher than expected results, and would reduce
patient
outcomes by increasing the cost of blood glucose testing. In addition, a
technique that
requires a new test meter or additional physical test strips would be
incompatible with
previously deployed units, also increasing costs. Further, any testing of a
test strip to
determine contamination would only be effective if that testing did not itself
damage or
impede the use of the test strip to perform an analyte measurement.
[0026] While
the Verio system discussed previously has very good overall
performance, testing has shown, however, that biosensors are not completely
impervious
to contamination, such as contamination that may occur as a result of improper
storage of
the test strips. Such contamination may include moisture contamination or
contamination
by other external cause or stimulus (temperature, light, humidity). In
attempts to find
ways to reduce the impact of contamination, a technique is herein provided to
alert users
of test strips that will produce erroneous results due to contamination based
on storage
and environmental conditions. Consequently, various aspects of a method of
determining
if the biosensor has been contaminated are presented herein. In one example of
the
present technique, an analyte measurement may be made simultaneously along
with a
contamination detemiination, so that if the biosensor is not deemed
contaminated or
damaged, the test result can be released (displayed) to the patient. And, if
the test strip is
deemed to be contaminated, the test result can be suppressed so as to avoid
giving a
higher than expected analyte reading to the patient which could lead to
improper
medication dosing.
[0027]
Generally stated and according to at least one embodiment, a method is
provided for determining contamination of a biosensor. The biosensor is loaded
into the
test meter and a sample is applied to the biosensor. A first predetermined
voltage is
applied between the spaced electrodes of the electrochemical cell for a first
CA 03148386 2022-01-21
WO 2021/015755
PCT/US2019/043212
predetermined time interval, and a second predetermined voltage between the
spaced
electrodes during a second predetermined time interval after the first
predetermined time
interval. First current values are measured during the first predetermined
time interval.
A first reference value is determined based on a sum of the first current
values during the
first predetermined time interval. Second current values are measured during
the second
predetermined time interval. A second reference value is determined based on a
peak
current value measured during the second predetermined time interval. A third
reference
value is determined based on the rate of change in current values measured
after the peak
current value during the second time interval. Whether the biosensor is
contaminated is
determined can be based on one or more of the first through the third
reference values.
Reporting of the concentration of the analyte is suppressed upon the
determination that
the biosensor is contaminated. In another embodiment, a test meter is
presented that
performs the steps of the method noted above.
[0028] The above embodiments are intended to be merely examples. It will
be
readily apparent from the following discussion that other embodiments are
within the
scope of the disclosed subject matter.
[0029] Specific working examples will now be described with respect to
FIGS. 1-
6.
[0030] FIG. 1 illustrates a diabetes management system that includes a
portable
test meter 10 and a biosensor, the latter being provided in the form of a
disposable test
strip 62 that is configured for the detection of blood glucose. For purposes
of the
following discussion, the portable test meter is synonymously referred to
throughout as
an analyte measurement and management unit, a glucose meter, a meter, and/or a
meter
unit. Though not shown in this view and in at least one embodiment, the
portable test
meter may be combined with an insulin delivery device, an additional analyte
testing
device, and a drug delivery device. The portable test meter may be connected
to a remote
computer or remote server via a cable or a suitable wireless technology such
as, for
example, GSM, CDMA, Bluetooth, WiFi and the like. Such analyte measurement
systems are described in United States Patent No. 8,709,232 B2, issued April
29, 2014,
RECTIFIED SHEET (RULE 91) ISA/EP
6
and entitled "Analyte Measurement Technique and System," and International
Patent
Publication No. WO 2012/012341 Al, published January 26, 2012, and entitled
"System
and Method for Measuring an Analyte in a Sample,".
[0031] Still referring to FIG. 1, the portable test meter 10 is defined
by a housing
11 having a plurality of user interface buttons (16, 18, and 20) that are
disposed on a
facing surface. A display 14 is provided in addition to a strip port opening
22 that is
configured to receive a biosensor (test strip 62). The user interface buttons
(16, 18, and
20) may be configured to allow the entry of data, navigation of menus, and
execution of
commands. It will be readily apparent that the configuration and functionality
of the user
interface buttons of the portable test meter 10 is intended to be an example
and
modifications and variations are possible. According to this specific
embodiment, the
user interface button 18 may be in the form of a two way toggle switch. Data
may
include values representative of analyte concentration, and/or information,
which are
related to the everyday lifestyle of an individual. Information, which is
related to the
everyday lifestyle, may include food intake, medication use, occurrence of
health check-
ups, and general health condition and exercise levels of an individual.
[0032] As represented in FIG. 2 and shown in simplified schematic form,
the
electronic components of the portable test meter 10 may be disposed on a
circuit board 34
contained within the interior of the housing 11, FIG. 1. According to this
embodiment,
the electronic components include a strip port connector 23, an operational
amplifier
circuit 35, a microcontroller 38, a display connector 14a, a non-volatile
memory 40, a
clock 42, and a first wireless module 46. On an opposing bottom surface of the
circuit
board 34, the electronic components may include a battery connector (not
shown) and a
data port 13. It will be understood that the relative position of the various
electronic
components can be varied and the configuration herein described is exemplary.
7
Date Recue/Date Received 2023-03-22
CA 03148386 2022-01-21
WO 2021/015755
PCT/US2019/043212
[0033] The
microcontroller 38 may be electrically connected to the strip port
connector 23 aligned with the strip port opening 22 (FIG. 1), the operational
amplifier
circuit 35, the first wireless module 46, the display 14, the non-volatile
memory 40, the
clock 42, at least one battery (not shown), a data port 13, and the user
interface buttons
(16, 18, and 20).
[0034] The
operational amplifier circuit 35 may include two or more operational
amplifiers configured to provide a portion of the potentiostat function and
the current
measurement function. The potentiostat function may refer to the application
of a test
voltage between at least two electrodes of a test strip. The current function
may refer to
the measurement of a test current resulting from the applied test voltage. The
current
measurement may be performed with a current-to-voltage converter. The
microcontroller
38 may be in the folin of a mixed signal microprocessor (MSP) 430 such as, for
example,
the Texas Instruments (TI) MSP. The MSP 430 may be configured to also perform
a
portion of the potentiostat function and the current measurement function. In
addition, the
430 may also include volatile and non-volatile memory. In another embodiment,
many of
the electronic components may be integrated with the microcontroller in the
form of an
application specific integrated circuit (ASIC).
[0035] The
strip port connector 23 may be configured to form an electrical
connection to the test strip 62. The display connector 14a may be configured
to attach to
the display 14. For purposes of this description, the display 14 may be in the
form of a
liquid crystal display for reporting measured glucose levels, and for
facilitating entry of
lifestyle related information. The display 14 may optionally include a
backlight. The
data port 13 may accept a suitable connector attached to a connecting lead,
thereby
allowing the test meter 10 to be linked to an external device, such as a
personal computer
(not shown). For purposes of this description, the data port 13 may be any
port that
allows for transmission of data such as, for example, a serial, USB, or a
parallel port.
The data port 13 can be accessed through the housing 11 of the portable test
meter 10.
The clock 42 may be configured to keep current time related to the geographic
region in
which the user is located and also for measuring time. The test meter may be
configured
8
CA 03148386 2022-01-21
WO 2021/015755
PCT/US2019/043212
to be electrically connected to a power supply such as, for example, at least
one contained
battery (not shown).
[0036] FIGS.
3A ¨ 3G show various views of a test strip 62 suitable for use with
the methods and systems described herein. In an exemplary embodiment, the test
strip 62
is defined by an elongate body extending from a distal end 80 to an opposing
proximal
end 82, and having lateral edges 56, 58, as illustrated in FIG. 3A. As shown
in FIG. 3B,
the test strip 62 also includes a first electrode layer 66, a second electrode
layer 64, and a
spacer 60 sandwiched in between the two electrode layers 64 and 66 at the
distal end 80
of the test strip 62. The first electrode layer 66 may include a first
electrode 66, a first
connection track 76, and a first contact pad 67, where the first connection
track 76
electrically connects the first electrode 66 to the first contact pad 67, as
shown in FIGS.
3B and 3C. Note that the first electrode 66 is a portion of the first
electrode layer 66 that
is immediately beneath the reagent layer 72, as indicated by FIGS. 3A and 3B.
Similarly,
the second electrode layer 64 may include a second electrode 64, a second
connection
track 78, and a second contact pad 63, where the second connection track 78
electrically
connects the second electrode 64 with the second contact pad 63, as shown in
FIGS. 3A-
3C. Note that the second electrode 64 is a portion of the second electrode
layer 64 that is
disposed above the reagent layer 72, as best shown in FIGS. 3B and 3C.
[0037] As
shown, a sample-receiving chamber 61 (e.g., an electrochemical cell) is
defined by the first electrode 66, the second electrode 64, and the spacer 60
proximate to
the distal end 80 of the test strip 62, as shown in FIGS. 3B-3E. The first
electrode 66 and
the second electrode 64 may define the bottom and the top of sample-receiving
chamber
61, respectively, as illustrated in FIG. 3G. A cutout area 68 of the spacer 60
may define
the sidewalls of the sample-receiving chamber 61, as illustrated in FIG. 3G.
In one
aspect, the sample-receiving chamber 61 may include ports 70 that provide a
sample inlet
and/or a vent, as shown in FIGS. 3A - 3C. For example, one of the ports 70 may
allow a
fluid sample to ingress and the other port 70 may allow air to egress.
9
CA 03148386 2022-01-21
WO 2021/015755
PCT/US2019/043212
[0038] In an
exemplary embodiment, the sample-receiving chamber 61 may have
a small volume. For example, the chamber 61 may have a volume in the range of
from
about 0.1 microliters to about 5 microliters, about 0.2 microliters to about 3
microliters,
or, preferably, about 0.3 microliters to about 1 microliter. To provide the
small sample
volume, the cutout 68 may have an area ranging from about 0.01 cm2 to about
0.2 cm2,
about 0.02 cm2 to about 0.15 cm2, or, preferably, about 0.03 cm2 to about 0.08
cm2. In
addition, first electrode 66 and second electrode 64 may be spaced apart in
the range of
about 1 micron to about 500 microns, preferably between about 10 microns and
about
400 microns, and more preferably between about 40 microns and about 200
microns. The
relatively close spacing of the electrodes may also allow redox cycling to
occur, where
oxidized mediator generated at the first electrode 66, may diffuse to the
second electrode
64 to become reduced, and subsequently diffuse back to the first electrode 66
to become
oxidized again. Those skilled in the art will appreciate that various such
volumes, areas,
and/or spacing of electrodes is within the spirit and scope of the present
disclosure.
[0039] In
one embodiment, the first electrode 66 and the second electrode 64 may
each include an electrode layer. The electrode layer may include a conductive
material
formed from materials such as gold, palladium, carbon, silver, platinum, tin
oxide,
iridium, indium, or combinations thereof (e.g., indium doped tin oxide). In
addition, the
electrode layers may be formed by disposing a conductive material onto an
insulating
sheet (not shown) by a sputtering, electroless plating, or a screen-printing
process. In one
exemplary embodiment, the first electrode 66 and the second electrode 64 may
each
include electrode layers made from sputtered palladium and sputtered gold,
respectively.
Suitable materials that may be employed as spacer 60 include a variety of
insulating
materials, such as, for example, plastics (e.g., PET, PETG, polyimide,
polycarbonate,
polystyrene), silicon, ceramic, glass, adhesives, and combinations thereof.
CA 03148386 2022-01-21
WO 2021/015755
PCT/US2019/043212
[0040] In
one embodiment, the spacer 60 may be in the form of a double sided
adhesive coated on opposing sides of a polyester sheet where the adhesive may
be
pressure sensitive or heat activated. Applicants note that various other
materials for the
first electrode layer 66, the second electrode layer 64, and/or the spacer 60
are within the
spirit and scope of the present disclosure.
[0041]
Either the first electrode 66 or the second electrode 64 may perform the
function of a working electrode depending on the magnitude and/or polarity of
at least
one applied test voltage. The working electrode may measure a limiting test
current that
is proportional to the reduced mediator concentration. For example, if the
current limiting
species is a reduced mediator (e.g., potassium ferrocyanide), then it may be
oxidized at
the first electrode 66 as long as the test voltage is sufficiently greater
than the redox
mediator potential with respect to the second electrode 64. In this situation,
the first
electrode 66 performs the function of the working electrode and the second
electrode 64
performs the function of a counter/reference electrode. Applicants note that
one may
refer to a counter/reference electrode simply as a reference electrode or a
counter
electrode. A limiting oxidation occurs when all of the reduced mediator has
been
depleted at the working electrode surface such that the measured oxidation
current is
proportional to the flux of reduced mediator diffusing from the bulk solution
towards the
working electrode surface. The term "bulk solution" as used herein refers to a
portion of
the solution sufficiently far away from the working electrode where the
reduced mediator
is not located within a depletion zone. It should be noted that unless
otherwise stated for
the test strip 62, all potentials applied by the test meter 10 will
hereinafter be stated with
respect to the second electrode 64.
[0042]
Similarly, if the test voltage is sufficiently less than the redox mediator
potential, then the reduced mediator may be oxidized at the second electrode
64 as a
limiting current. In such a situation, the second electrode 64 performs the
function of the
working electrode and the first electrode 66 performs the function of the
counter/reference electrode.
11
CA 03148386 2022-01-21
WO 2021/015755
PCT/US2019/043212
[0043] Initially, an analysis may include introducing a quantity of a
fluid sample
into the sample-receiving chamber 61 via one of the ports 70. In one aspect,
the port 70
and/or the sample-receiving chamber 61 may be configured such that capillary
action
causes the fluid sample to fill the sample-receiving chamber 61. The first
electrode 66
and/or second electrode 64 may be coated with a hydrophilic reagent to promote
the
capillarity of the sample-receiving chamber 61. For example, thiol derivatized
reagents
having a hydrophilic moiety, such as 2-mercaptoethane sulfonic acid, may be
coated onto
the first electrode and/or the second electrode.
[0044] In the analysis of the test strip 62 above, the reagent layer 72
can include
glucose dehydrogenase (GDH) based on the PQQ co-factor and ferricyanide, In
another
embodiment, the enzyme GDH based on the PQQ co-factor may be replaced with the
enzyme GDH based on the FAD co-factor. When blood or control solution is dosed
into a
sample reaction chamber 61, glucose is oxidized by GDH(0,c) and in the
process, converts
GDH(0x) to GDH(red), as shown in the chemical transformation T.1 below. Note
that
GDH(0) refers to the oxidized state of GDH, and GDH(red) refers to the reduced
state of
GDR
[0045] T.1 D-Glucose+GDH(Ox) Gluconic acid+GDH(red)
[0046] Next, GDH(red) is regenerated back to its active oxidized state by
ferricyanide (i.e. oxidized mediator or Fe(CN)63-, such as potassium
ferricyanide) as
shown in chemical transformation T.2 below. In the process of regenerating
GDH(ox),
ferrocyanide (i.e. reduced mediator or Fe(CN)64-, such as potassium
ferrocyanide) is
generated from the reaction as shown in T.2:
[0047] T.2 GDH(red)+2Fe(CN)63- GDH0,0+2Fe(CN)64-
[0048] FIG. 4 provides a simplified schematic showing a test meter 10
interfacing
with a first contact pad 67a, 67b and a second contact pad 63 of the test
strip 62. The
second contact pad 63 may be used to establish an electrical connection to the
test meter
through a U-shaped notch 65, as illustrated in FIG. 3B. In one embodiment, the
test
12
CA 03148386 2022-01-21
WO 2021/015755
PCT/US2019/043212
meter 10 may include a second electrode connector 101, first electrode
connectors (102a,
102b), a test voltage unit 106, a current measurement unit 107, a processor
212, a
memory unit 210, and a visual display 202, as schematically shown in FIG. 4.
The first
contact pad 67 may include two prongs denoted as 67a and 67b. In one exemplary
embodiment, the first electrode connectors 102a and 102b separately connect to
prongs
67a and 67b, respectively. The second electrode connector 101 may connect to
the
second contact pad 63. The test meter 10 may measure the resistance or
electrical
continuity between the prongs 67a and 67b to determine whether the test strip
62 is
electrically connected to the test meter 10.
[0049] In
one embodiment, the test meter 10 may apply a test voltage and/or a
current between the first contact pad 67 and the second contact pad 63. Once
the test
meter 10 recognizes that the strip 62 has been inserted, the test meter 10 is
powered on
and initiates a fluid detection mode. In one embodiment, the fluid detection
mode causes
the test meter 10 to apply a constant current of about 1 microampere between
the first
electrode 66 and the second electrode 64. Because the test strip 62 is
initially dry, the test
meter 10 measures a relatively large voltage. When the fluid sample bridges
the gap
between the first electrode 66 and the second electrode 64 during the dosing
process, the
test meter 10 will measure a decrease in measured voltage that is below a
predetermined
threshold causing the test meter 10 to automatically initiate a glucose test.
[0050]
Referring to FIGS. 5A-5C, a method for determining an analyte
concentration, using a test strip 62 and the test meter 10, will now be
described. By way
of overview, first, application of the test voltages and measurement of
current values will
be discussed, followed by an explanation of analyte concentration measurement.
[0051]
First, with respect to the application of voltages to the test strip, example
meter 10 and example test strip 62 are references. The test meter 10 may
include
electronic circuitry that can be used to apply a plurality of voltages to the
test strip 62 and
to measure a current transient output resulting from an electrochemical
reaction in a test
chamber of the test strip 62. The test meter 10 also may include a signal
processor with a
13
CA 03148386 2022-01-21
WO 2021/015755
PCT/US2019/043212
set of instructions for the method of determining an analyte concentration in
a fluid
sample as disclosed herein. In one embodiment, the analyte is blood glucose.
[0052]
Continuing with the discussion of application of test voltages, FIG. 5A
sets forth an exemplary waveform consisting of a plurality of test voltages
applied to the
test strip 62 for prescribed time intervals. The plurality of test voltages
according to this
waveform include a first test voltage El that is applied for a first time
interval t1, a second
test voltage E2 that is applied for a second time interval t2, and a third
test voltage E3
applied for a third time interval t3. The third voltage E3 may be different in
the magnitude
of the electromotive force, in polarity, or combinations of both with respect
to the second
test voltage E2. In the preferred embodiments and as shown, E3 may be of the
same
magnitude as E2 but opposite in polarity. A glucose test time interval tG
represents an
amount of time to perform the glucose test (but not necessarily all the
calculations
associated with the glucose test). Glucose test time interval tG may range
from about 1.1
seconds to about 5 seconds. Further, as illustrated in FIG. 5A, the second
test voltage E2
may include a constant (DC) test voltage component and a superimposed
alternating
(AC), or alternatively oscillating, test voltage component applied for a short
time interval.
More specifically, the superimposed alternating or oscillating test voltage
component
may be applied for a time interval indicated by t.,ap at the initiation of the
second time
interval.
[0053] The
plurality of test current values measured during any of the time
intervals may be performed at a frequency ranging from about 1 measurement per
microsecond to about one measurement per 100 milliseconds and preferably at
about 50
milliseconds. While an embodiment using three test voltages in a serial manner
is
described, the glucose test may include different numbers of open-circuit and
test
voltages. For example, as an alternative embodiment, the glucose test could
include an
open-circuit for a first time interval, a second test voltage for a second
time interval, and
a third test voltage for a third time interval. It should be noted that the
reference to "first,"
"second," and "third" are chosen for convenience and do not necessarily
reflect the order
in which the test voltages are applied. For instance, an embodiment may have a
potential
14
CA 03148386 2022-01-21
WO 2021/015755
PCT/US2019/043212
waveform where the third test voltage may be applied before the application of
the first
and second test voltage.
[0054] FIG.
5C is a flowchart representing a method 500 for determining analyte
concentration in a nominal or uncontaminated test strip, based on the waveform
of FIG.
5A and measured currents as shown in FIG. 5B. In exemplary step 510, the
glucose
assay is initiated by inserting a test strip 62 into the test meter 10 and by
depositing a
sample on the test strip 62. In exemplary step 520, the test meter 10 may
apply a first test
voltage El (e.g., approximately 20 mV in FIG. 5A) between the first electrode
66 and the
second electrode 64 for a first time interval ti (e.g., 1 second in FIG. 5A).
The first time
interval ti may range from about 0.1 seconds to about 3 seconds and preferably
range
from about 0.2 seconds to about 2 seconds, and most preferably range from
about 0.3
seconds to about 1.1 seconds.
[0055] The
first time interval t1 may be sufficiently long so that the sample-
receiving chamber 61 may fully fill with sample and also so that the reagent
layer 72 may
at least partially dissolve or solvate. In one aspect, the first test voltage
El may be a value
relatively close to the redox potential of the mediator so that a relatively
small amount of
a reduction or oxidation current is measured. FIG. 5B shows that a relatively
small
amount of current is observed during the first time interval ti compared to
the second and
third time intervals t2 and t3. For example, when using potassium ferricyanide
and/or
potassium ferrocyanide as the mediator, the first test voltage El in FIG. 5A
may range
from about 1 mV to about 100 mV, preferably range from about 5 mV to about 50
mV,
and most preferably range from about 10 mV to about 30 mV. Although the
applied
voltages are given as positive values in the preferred embodiments, the same
voltages in
the negative domain could also be utilized to accomplish the intended purpose
of the
claimed invention. During this interval, the first current output may be
sampled by the
processor to collect current values over this interval in step 530.
CA 03148386 2022-01-21
WO 2021/015755
PCT/US2019/043212
[0056] In exemplary step 540, after applying the first test voltage El
(step 520)
and sampling the output (step 530), the test meter 10 applies a second test
voltage E2
between first electrode 66 and second electrode 64 (e.g., approximately 300
millivolts in
FIG. 5A), for a second time interval t2 (e.g., about 3 seconds in FIG. 5A).
The second test
voltage E2 may be a value different than the first test voltage El and may be
sufficiently
negative of the mediator redox potential so that a limiting oxidation current
is measured
at the second electrode 64. For example, when using potassium ferricyanide
and/or
potassium ferrocyanide as the mediator, the second test voltage E2 may range
from about
zero mV to about 600 mV, preferably range from about 100 mV to about 600 mV,
and
more preferably is about 300 mV.
[0057] The second time interval t2 should be sufficiently long so that
the rate of
generation of reduced mediator (e.g., potassium ferrocyanide) may be monitored
based
on the magnitude of a limiting oxidation current. Reduced mediator is
generated by
enzymatic reactions with the reagent layer 72. During the second time interval
t2, a
limiting amount of reduced mediator is oxidized at second electrode 64 and a
non-
limiting amount of oxidized mediator is reduced at first electrode 66 to form
a
concentration gradient between the first electrode 66 and the second electrode
64.
[0058] In an exemplary embodiment, the second time interval t2 should
also be
sufficiently long so that a sufficient amount of potassium ferricyanide may be
diffused to
the second electrode 64 or diffused from the reagent on the first electrode. A
sufficient
amount of potassium ferricyanide is required at the second electrode 64 so
that a limiting
current may be measured for oxidizing potassium ferrocyanide at the first
electrode 66
during the third test voltage E3. The second time interval t2 may be less than
about 60
seconds, and preferably may range from about 1.1 seconds to about 10 seconds,
and more
preferably range from about 2 seconds to about 5 seconds. Likewise, the time
interval
indicated as -Lap in FIG. 5A may also last over a range of times, but in one
exemplary
embodiment it has a duration of about 20 milliseconds. In one exemplary
embodiment,
the superimposed alternating test voltage component is applied after about 0.3
seconds to
about 0.4 seconds after the application of the second test voltage E2, and
induces a sine
16
CA 03148386 2022-01-21
WO 2021/015755
PCT/US2019/043212
wave having a frequency of about 109 Hz with an amplitude of about +/-50 mV.
During
this interval, a second current output may be sampled by the processor to
collect current
values over this interval in step 550.
[0059] FIG.
5B shows a relatively small peak ipb after the beginning of the second
time interval t2 followed by a gradual increase of an absolute value of an
oxidation
current during the second time interval t2. The small peak ipb occurs due
oxidation of
endogenous or exogenous reducing agents after a transition from first voltage
El to
second voltage E2 leading to a gradual increase of an absolute value of an
oxidation
current during the second time interval t2. The small peak ipb occurs due to
an initial
depletion of reduced mediator after a transition from the first voltage El to
the second
voltage E2, referenced here as transition line TL. Thereafter, there is a
gradual absolute
decrease in oxidation current after the small peak ipb is caused by the
generation of
potassium ferrocyanide by reagent layer 72, which then diffuses to the second
electrode
64.
[0060] In
exemplary step 560, after applying the second test voltage E2 (step 540)
and sampling the output (step 550), the test meter 10 applies a third test
voltage E3
between the first electrode 66 and the second electrode 64 (e.g., about -300
millivolts in
FIG. 5A) for a third time interval t3 (e.g., 1 second in FIG. 5A). The third
test voltage E3
may be a value sufficiently positive of the mediator redox potential so that a
limiting
oxidation current is measured at the first electrode 66. For example, when
using
potassium ferricyanide and/or potassium ferrocyanide as the mediator, the
third test
voltage E3 may range from about zero mV to about -600 mV, preferably range
from
about -100 mV to about -600 mV, and more preferably is about -300 mV.
[0061] After
applying the third test voltage E3, in step 570 current values are
measured in the third time interval t3. The third time interval t3 may be
sufficiently long
to monitor the diffusion of reduced mediator (e.g., potassium ferrocyanide)
near the first
electrode 66 based on the magnitude of the oxidation current. During the third
time
interval t3, a limiting amount of reduced mediator is oxidized at the first
electrode 66 and
a non-limiting amount of oxidized mediator is reduced at the second electrode
64. The
17
CA 03148386 2022-01-21
WO 2021/015755
PCT/US2019/043212
third time interval t3 may range from about 0.1 seconds to about 5 seconds and
preferably
range from about 0.3 seconds to about 3 seconds, and more preferably range
from about
0.5 seconds to about 2 seconds.
[0062] FIG.
5B shows a relatively large peak ip, at the beginning of the third time
interval t3 followed by a decrease to a steady-state current is, value, for a
nominal test
strip. In one embodiment, the second test voltage E2 may have a first polarity
and the
third test voltage E3 may have a second polarity that is opposite to the first
polarity. In
another embodiment, the second test voltage E2 may be sufficiently negative of
the
mediator redox potential and the third test voltage E3 may be sufficiently
positive of the
mediator redox potential. The third test voltage E3 may be applied immediately
after the
second test voltage E2. However, one skilled in the art will appreciate that
the magnitude
and polarity of the second and third test voltages may be chosen depending on
the
manner in which analyte concentration is determined.
[0063] Next,
glucose concentration determination is described for the
embodiments described herein, and as set forth in step 580 of FIG. 5C. FIGS.
5A and 5B
show the sequence of events in the test strip transient. At approximately 1.1
seconds after
initiation of the test sequence (and shortly after making the second electrode
the working
electrode due to application of the second voltage E2), when no reagent has
yet reached
the first electrode, and current is due presumably to only interfering
reducing agents in
plasma (in the absence of mediator), a current measurement is taken to later
correct for
interferences. Between about 1.4 seconds and about 4 seconds, when (at least
in the latter
part of this interval when a second voltage E2 is applied) mediator and
oxidized mediator
have been able to diffuse to the second electrode, a first glucose-
proportional current,
is measured. Shortly after making the first electrode the working electrode
via application
of the third voltage E3, 2 single-point measurements (at approximately 4.1 and
5 seconds
according to this embodiment) and one integrated measurement i1 are taken. The
measurements sampled respectively at 1.1, 4.1 and 5 seconds according to this
specific
embodiment are used to correct ir for additive current from interfering
reducing agents
18
(i2corr). The ratio of ii to ir is used to correct 12corr for the interfering
effects of
hem atocrit.
[0064] In one embodiment, the following equation is then used to
determine the
glucose concentration:
G basic it = (.1)P (a' 12corrl Zgr), where:
Gbasic is the analyte concentration;
is the sum of the third current values during the third time interval;
is the sum of the second current values during the second time interval;
livci+bliss1-2lipb1
i2corr
= l i ir, ' and
p cl+blissi
a, b,p and zgr are predetermined coefficients.
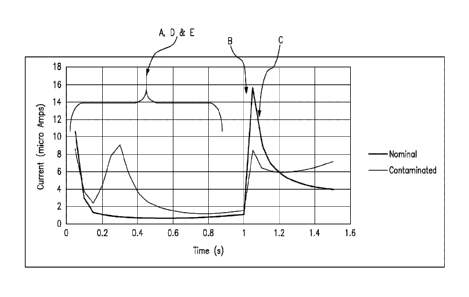
ii(4.1s)I-Fbli(5 s)1-21/(1.1s)1
[0065] In one specific example,
i2corr = li(4.1 s)l-Fbli(5 s)I r =
[0066] In another example, different test strip chemistries may be
used, in which
the times that appear in the current evaluation are changed in accordance with
the above
generic relation.
Additional details relating to the applied waveform and the
determination of analyte concentration of a test strip are provided in United
States Patent
No. 8,709,232 B2 and International Patent Publication No. WO 2012/012341 Al.
[0067] As noted, FIG. 6A details an enlarged partial view of the
relationship
between current versus time based on the waveform of FIG. 5A. In this figure,
the
current response of FIG. 5B is reproduced for a nominal (uncontaminated) test
strip, such
as test strip 62, FIG. 1, as compared to a current response of moisture
contaminated test
strips. As clearly demonstrated in this figure, there are a number of
characteristic
anomalies between nominal and aberrant/defective test strips over portions of
the current
transient. More specifically, contaminated test strips include a plurality of
spiked current
19
Date Recue/Date Received 2023-03-22
CA 03148386 2022-01-21
WO 2021/015755
PCT/US2019/043212
transients exhibited between approximately 0 and 1 second (during the
predetermined
first time interval). In addition, contaminated test strips demonstrate a
reduced peak
value ipb after application of the test voltage at the initiation of the
second time interval at
about 1 second after initiation of the test sequence.
[0068] Without being limited to any particular theory, the physical
mechanism of
moisture contamination appears to be that the introduction of moisture (from
storage
conditions or other cause) causes conversion of potassium ferricyanide in the
reagent
layer of the test strip to potassium ferrocyanide. In such a case, the reagent
layer has a
higher concentration of potassium ferrocyanide, which may diffuse and be
consumed at
both the first and second electrode surfaces during an analyte concentration
measurement.
Thus, the analyte signal will be amplified, leading to a higher than expected
glucose
measurement when the test strip is contaminated.
[0069] As verified by experimentation, described in a later portion,
there are a
number of discrete and identifiable anomalies in the first and second time
intervals of the
test waveform that are attributable to contamination (moisture) effects. These
effects are
comparatively illustrated in FIG. 6A. This contamination may be characterized
both by
physical changes and chemical changes to the test strip. For instance,
physical changes
occur because the test strip, which before contamination or damage included an
electrode
coated with a uniform layer of mediator, may now effectively appear as a rough
or
inconsistent layer of unconverted mediator. In such a case, when a blood
sample is
applied to the test strip, transient currents such as those observed in the
first time interval
may be created due to the inconsistency of this layer of the test strip.
[0070] In addition, the test strip may also experience chemical changes.
These
chemical changes may be due to the overall amount of mediator that has been
converted
leading to tangible and perceivable changes in the expected current response
of the test
strip upon an applied voltage and more specifically the second test voltage.
The
combination of both physical and chemical changes to contaminated or damaged
test
strips has been described in general terms, but the technique for determining
contamination is not limited by any particular aspects of this discussion.
CA 03148386 2022-01-21
WO 2021/015755
PCT/US2019/043212
[0071] As a
result of the perceivable differences between expected current
response of a nominal test strip and that exhibited by contaminated test
strips, a number
of reference values labeled for convenience as A-E according to FIG. 6A, may
be
adduced when a test strip is inserted into a portable test meter for purposes
of analyte
measurement. According to one embodiment, it has been determined that
identification
of specific aspects of the aberrant current response (depicted as reference
values A, B and
C) may be sufficient to determine the presence of a contaminated test strip.
100721
According to one embodiment, reference value A is the total summed
value of measured current values during the first time interval, e.g., between
0.20 and
0.75 seconds. As noted above, contaminated test strips exhibit physical
changes leading
to a greater current response in the first time interval due to the mediator
layer becoming
physically less consistent. Thus, the summation of current values during the
first time
interval is indicative of the magnitude of these physical changes to the test
strip due to the
contamination, and serves as reference value A. In one specific example,
contaminated
test strips exhibit a sum of current values between 0.20 and 0.75 seconds in
an amount
greater than 6.5 p.A.
[0073] As
noted above, contaminated test strips exhibit a smaller peak current ib,
at 1.0 seconds, due to chemical changes in the test strip caused by
contamination. Such
contamination leads to a deviation in the peak current. In one specific
example, if the
measured peak current value ipb during the second time interval is less than
12.5 tiA, the
chemical changes consistent with contamination is indicated, and this peak
value
represents reference value B.
[0074]
Further, the chemical changes also lead to a slower negative rate of change
in measured current following the peak current. As such, if the peak is at
1.05 seconds,
the difference in value between 1.10 seconds and 1.05 seconds is a measure of
this rate of
change, which herein is referred to as reference value C. Thus, a strip may be
further
characterized with reference value C being the difference between the current
value at
1.10 seconds and the current value at 1.05 seconds. In one specific example,
this
difference may be between 0 and -3.5 p.A. In another example, this difference
may be
21
CA 03148386 2022-01-21
WO 2021/015755
PCT/US2019/043212
divided by the time difference of the two values (e.g., 1.10 seconds ¨ 1.05
seconds = 0.05
seconds), to give the time rate of change of the current. With reference to
FIG. 6B,
reference values B and C can be determined at step 660.
[0075] In
one embodiment, the reference values B and C may be used in
conjunction with the reference values A, in order to determine contamination
of the test
strip, e.g., at step 670 of FIG. 6B. Upon detel ________________________
mining that the test strip is contaminated, at
step 670 of FIG. 6, the meter may display or annunciate a message indicating
contamination of the test strip. Advantageously, determination of
contamination of test
strips allows for education of the user of the test meter. Information may be
provided to
the user that educates the user on the proper storage of the test strips,
including the need
for storing the test strips in the provided sealed container and away from
extreme heat or
light.
[0076] In
one embodiment, upon the determination of contamination of a
particular test strip using Flags noted above, the test measurement system can
invalidate
the test result from the contaminated biosensor and a new biosensor should be
loaded for
testing. And, if the new biosensor does not exhibit the waveform
characteristics
associated with contamination, the test measurement system can annunciate the
result of
the testing to the patient. In other embodiments, an automated delivery of
insulin may be
made to the patient only if the biosensor was not contaminated as determined
by the
technique noted above.
[0077] In
another embodiment, a further refinement makes use of the observation
that contaminated test strips are characterized as having a greater range of
current values
during the first interval than nominal test strips. Specifically, a range is
defined as the
difference between the largest current value and the smallest current value of
the transient
currents that are exhibited in the contaminated test strips, in the first time
interval. Thus,
a reference value D is defined as the difference between the largest current
value and the
smallest current value during the first time interval. In one specific
example, for
contaminated test strips, this range of difference, i.e., reference value D,
is greater than
0.57 A, and for nominal test strips this range is less than 0.57 A.
22
CA 03148386 2022-01-21
WO 2021/015755
PCT/US2019/043212
[0078] In an
additional embodiment, another refinement eliminates false positive
contamination determinations by checking whether the contaminated test strips
exhibit
currents that are consistent with test strip movement within the meter during
testing. For
example, movement of the finger against the test strip during testing can
cause some
current deviations during the testing process. Thus, a reference value E may
be defined
that is the minimum of the currents in the first time interval is greater than
0 A. With
reference to FIG. 6B, reference values A, D and E can be determined at step
640.
[0079] Given
the definitions of the reference values A-E, a set of flags (FlagA ¨
FlagE) may be defined for purposes of an analyte measurement system as based
on the
perceivable and representative differences between nominal test strips (FIGS.
5B and 6A)
and aberrant test strips (FIG. 6A). Each of the flags is a Boolean flag that
may be either
true or false, and each flag A-E is based on comparing respective reference
value A-E to
a respective range or value that is defined by a respective target value A-E.
[0080] FlagA
is TRUE if reference value A, defined as the total summed value in
a portion of the first time interval, e.g., between 0.20 and 0.75 seconds, is
greater than a
target value A. The target value A in this specific example is 6.5 A.
However, it has
been determined that a target value A in the range of 5 - 10 A provides
adequate
efficacy.
[0081] FlagB
is TRUE if reference value B, defined as the measured peak current
value ipb during the second time interval is less than about a target value B.
The target
value B in this specific example is 12.5 A. However, it has been determined
that a
target value B in the range of 12 - 12.5 A provides adequate efficacy for the
purposes of
identifying an aberrant test strip.
[0082] Flagc
is TRUE if reference value C, defined as the difference in current
value between the measured peak current value ipb (e.g., at 1.05 seconds) and
the current
value at 1.10 seconds is between 0 and a target value C. The target value C is
-3.5 A in
this specific example. However, it has been determined that a target value C
in the range
23
CA 03148386 2022-01-21
WO 2021/015755
PCT/US2019/043212
of about 0 - -4.5 A provides adequate efficacy for purposes of identifying a
contaminated test strip.
[0083]
Flag]) is TRUE if reference value D, defined as the difference between the
largest current value and the smallest current value in the first time
interval is greater than
about a target value D. It has been determined that a target value D in the
range of about
0.4 - 0.65 A provides adequate efficacy. According to this specific example,
the target
value D is 0.57 A.
[0084]
Finally, FlagE is TRUE if reference value E, defined as the minimum
transient current in the first time interval is greater than about a target
value E, such as for
example about 0 A as in this specific example.
[0085] In
one embodiment, the determination of contamination or damage of the
test strips may be made when one or more of FlagA ¨ FlagE evaluate as true,
for example
only FlagA, FlagB and FlagE. In another embodiment, determination of
contamination or
damage of test strips may be made when all of FlagA ¨ FlagE evaluate as true.
For
example, Flags A, D and E may be viewed as representing the physical changes
due to
contamination noted above, and Flags B and C may be viewed as representing the
chemical changes due to the contamination noted above. In such a case, the
combination
of at least one flag from each group, i.e., one of Flags A, D and E and one of
Flags B and
C, may be used to determine contamination through a combination of physical
changes
and chemical changes to the test strip.
[0086] Of further note, Flags A, D and E occur earlier in the test sequence
than Flags B
and C, and thus may be more susceptible to false positives due to blood fill
issues from a
finger, or movement/nudging of the test strip during the test. As an
advantage, the
present technique may combine flags from each group in order to eliminate such
false
positives, so that uncontaminated test strips are not wasted due to these
false positives. In
addition, the selection of target values A-E in the ranges noted above
advantageously
provide a balance between the desired outcome of catching as many true
positives as
possible while avoiding as many false positives as possible.
24
100871 Unexpectedly, during testing of test strips which were
deliberately
exposed to moisture, a variety of deviations occur in the output waveform,
including the
transient current values, which are described above with respect to FIG. 6A.
While there
is some potential variation that can be experienced based on application of
sample from a
fingertip as opposed to a pipette due to variabilities in fill rate, for
example, there may
also be observed a demonstrated change in current response from the nominal
current
response of Fig. 5B due to physical characteristic changes in the reagent
layer, as
described above.
[0088] To verify confidence in the above-described technique, tests
were
conducted on 92 contaminated test strips. The test strips were determined to
be
contaminated because the test strips were stored in containers that included a
dessicant,
and the dessicant was examined and found to include moisture. A test meter was
used to
apply voltages to the test strips and captured the output currents as
described herein.
First, traditional techniques for detecting test errors were applied to the
captured currents,
and a total of 39 of the contaminated test strips were identified as having
errors related to
other factors, such as filling, etc. When the present technique was applied to
the captured
transients, using a combination of Flags A, B, C, D and E, all 92 contaminated
test strips
were properly identified based on the above described reference values.
[0089] While the invention has been described in terms of particular
variations
and illustrative figures, those of ordinary skill in the art will recognize
that the invention
is not limited to the variations or figures described. In addition, where
methods and steps
described above indicate certain events occurring in certain order, those of
ordinary skill
in the art will recognize that the ordering of certain steps may be modified
and that such
modifications are in accordance with the variations of the invention.
Additionally, certain
of the steps may be performed concurrently in a parallel process when
possible, as well as
performed sequentially as described above.
[0090] To the extent that the claims recite the phrase "at least one or
in reference
to a plurality of elements, this is intended to mean at least one or more of
the listed
elements, and is not limited to at least one of each element. For example, "at
least one of
Date Recue/Date Received 2023-03-22
an element A, element B, and element C," is intended to indicate element A
alone, or
element B alone, or element C alone, or any combination thereof. "At least one
of
element A, element B, and element C" is not intended to be limited to at least
one of an
element A, at least one of an element B, and at least one of an element C.
[0091] This written description uses examples to disclose the
invention, including
the best mode, and also to enable any person skilled in the art to practice
the invention,
including making and using any devices or systems and performing any methods.
The
patentable scope of the invention is defined by the claims, and may include
other
examples that occur to those skilled in the art.
[0092] The terminology used herein is for the purpose of describing
particular
embodiments only and is not intended to be limiting. As used herein, the
singular forms
"a," "an," and "the" are intended to include the plural forms as well, unless
the context
clearly indicates otherwise. It will be further understood that the terms
"comprise" (and
any form of comprise, such as "comprises" and "comprising"), "have" (and any
form of
have, such as "has" and "having"), "include" (and any form of include, such as
"includes" and "including"), and "contain" (and any form of contain, such as
"contains"
and "containing") are open-ended linking verbs. As a result, a method or
device that
"comprises," "has," "includes," or "contains" one or more steps or elements
possesses
those one or more steps or elements, but is not limited to possessing only
those one or
more steps or elements. Likewise, a step of a method or an element of a device
that
"comprises," "has," "includes," or "contains" one or more features possesses
those one or
more features, but is not limited to possessing only those one or more
features.
Furthermore, a device or structure that is configured in a certain way is
configured in at
least that way, but may also be configured in ways that are not listed.
[0093] The description set forth herein has been presented for purposes
of
illustration and description, but is not intended to be exhaustive or limited
to the form
disclosed. Many modifications and variations will be apparent to those of
ordinary skill
in the art without departing from the scope and spirit of the disclosure. The
embodiment
was chosen and described in order to best explain the principles of one or
more aspects
26
Date Recue/Date Received 2023-03-22
set forth herein and the practical application, and to enable others of
ordinary skill in the
art to understand one or more aspects as described herein for various
embodiments with
various modifications as are suited to the particular use contemplated.
27
Date Recue/Date Received 2023-03-22