Note: Descriptions are shown in the official language in which they were submitted.
WO 2021/108654
PCT/US2020/062350
SYSTEMS AND METHODS FOR EVALUATING LONGITUDINAL BIOLOGICAL
FEATURE DATA
CROSS-REFERENCE TO RELATED APPLICATIONS
[0001] This application claims the benefit of U.S. Provisional Application No.
62/941,012, filed on
November 27, 2020, which is expressly incorporated herein by reference in its
entirety for all purposes.
TECHNICAL FIELD
100021 This disclosure relates to methods for evaluating the disease status of
a subject based on
changes in genotypic characteristics of the subject over time.
BACKGROUND
[0003] Cancer represents a prominent worldwide public health problem. The
United States alone in
2015 had a total of 1,658,370 cases reported. Screening programs and early
diagnosis have an
important impact in improving disease-free survival and reducing mortality in
cancer patients. For
example, early screening of colorectal cancer (CRC) has led to almost a 50%
decrease in CRC
incidence and mortality in the U.S. This reduction is consistent with stage-
dependent survival rates for
the cancer, which decrease from 94% in stage 1 CRC to 11% in stage 4 CRC.
However, there are two
major challenges with early cancer detection: patient compliance and poor
sensitivity.
[0004] Advantageously, increasing knowledge of the molecular pathogenesis of
cancer and the rapid
development of next generation sequencing techniques are advancing the study
of early molecular
alterations involved in cancer development in body fluids. Specific genetic
and epigenetic alterations
associated with such cancer development are found in cell-free DNA (cfDNA) in
plasma, serum, and
urine. Such alterations can potentially be used as diagnostic biomarkers for
several types of cancers.
Advantageously, non-invasive sampling methods, such as so-called 'liquid
biopsies,' can foster patient
compliance, as they are easier, quicker, and less expensive to perform.
[0005] Cell-free DNA (cfDNA) can be found in serum, plasma, urine, and other
body fluids enabling
the 'liquid biopsy,' which represents a snapshot of the genomic makeup of many
different tissues in
the subject, including diseased tissues. cfDNA originates from necrotic or
apoptotic cells, and it is
generally released by all types of cells. cIDNA contains specific tumor-
related alterations, such as
1
CA 03158101 2022-5-11
WO 2021/108654
PCT/US2020/062350
mutations, methylation, and copy number variations (CNVs), thus comprising
circulating tumor DNA
(ctDNA)
[0006] However, because cIDNA represents DNA released from a wide range of
tissues, including
healthy tissues and white blood cells undergoing hematopoiesis, the challenge
remains to be able to
differentiate the signal originating from a disease tissue, such as cancer,
from signals originating from
germline cells. In fact, in most cancer patients, the majority of cfDNA is
from healthy cells, e.g.,
greater than 80%, 90%, 95%, or more. cfDNA signals can be enriched, for
example, bioinformatically
by identifying variant alleles having allele fractions that do not adhere to
typical 1:1 ratios, as seen for
heterozygous alleles in the gennline. cfDNA signals can also be enriched based
on the size of the
cfDNA being sequenced, because it has been observed that cfDNA originating
from cancerous tumor
is, on average, shorter in length than cfDNA originating from gennline cells.
[0007] Unfortunately, to date, the majority of cfDNA diagnostic studies are
focused on advanced
tumor stages. The application of cfDNA-based diagnostic assays for
identification of early malignant
disease stages is less well documented. Although early stage cancer detection
works on the same
principals as later stage cancer detection, there are several impediments that
are unique to early stage
detection. These include lower frequency and volume of aberrations,
potentially confounding
phenomena such as clonal expansions of non-tumorous tissues or the
accumulation of cancer-
associated mutations with age, and the incomplete insight into driver
alterations.
100081 In blood, apoptosis is a frequent event that determines the amount of
cfDNA. In cancer
patients, however, the amount of cfDNA can also be influenced by necrosis.
Since apoptosis seems to
be the main release mechanism, circulating cfDNA has a size distribution that
reveals an enrichment in
short fragments of about 167 bp, corresponding to nucleosomes generated by
apoptotic cells.
SUMMARY
100091 Generally, the systems and methods described herein can facilitate
earlier detection of a disease
state than is possible using conventional classification methods, by
accounting for individualized
variance in the subject's biological signatures. Conventional methods for
classifying the disease status
of a subject can involve taking a snapshot of one or more biological
signatures of the subject at a single
time point, and evaluating the subject's information against a predetermined
disease profile or trained
classifier. While this approach is sufficient for identifying the presence of
a disease when it has
sufficiently progressed in a subject, it typically cannot allow for confident
detection pre-disease states
2
CA 03158101 2022-5-11
WO 2021/108654
PCT/US2020/062350
or even early stages of the disease. For instance, several classifiers have
been developed for
diagnosing cancer in a subject by interrogating sequence reads of cell-free
DNA (cfDNA) isolated
from the blood plasma of the subject. However, because blood plasma contains
cfDNA from healthy
germline cells and hematopoietic cells, these classifiers use a minimum amount
of circulating tumor
DNA (ctDNA), referred to as a minimum tumor fraction, that is present in the
blood plasma in order to
detect a cancerous signature in the cfDNA sequence reads. However, because
there is a strong
correlation between the stage at which a disease is diagnosed and treatment
outcomes, more sensitive
methods that can identify the presence of a disease at an earlier stage are
needed
100101 Advantageously, the present disclosure provides such methods for
earlier disease identification,
at least in part, by interrogating the changes in a subject's biological
signatures over time, as opposed
to at a single time point. Specifically, by using data across multiple
biological samples from a subject
overtime, personalized variance in biological characteristics of the subject
can be accounted for when
monitoring for a disease state.
[0011] In one aspect, the present disclosure provides a method for determining
the disease state of a
subject by comparing a change, over time, in a modeled probability that the
subject has the disease
state to a population distribution of changes in modeled probability over
time. In some embodiments,
the method includes determining a first genotypic data construct for the test
subject, the first genotypic
data construct including values for a plurality of genotypic characteristics
based on a first plurality of
sequence reads, in electronic form, of a first plurality of nucleic acid
molecules in a first biological
sample obtained from the test subject at a first test time point. The method
can include inputting the
first genotypic data construct into a model for the disease condition, thereby
generating a first model
score set for the disease condition. The method can include determining a
second genotypic data
construct for the test subject, the second genotypic data construct including
values for the plurality of
genotypic characteristics based on a second plurality of sequence reads, in
electronic form, of a second
plurality of nucleic acid molecules in a second biological sample obtained
from the test subject at a
second test time point occurring after the first test time point. The method
can include inputting the
second genotypic data construct into the model, thereby generating a second
model score set for the
disease condition. The method can include determining a test delta score set
based on a difference
between the first and second model score set. Then the method can include
evaluating the test delta
score set against a plurality of reference delta score sets, thereby
determining the disease condition of
3
CA 03158101 2022-5-11
WO 2021/108654
PCT/US2020/062350
the test subject, where each reference delta score set in the plurality of
reference delta scores sets is for
a respective reference subject in a plurality of reference subjects.
[0012] In another aspect, the present disclosure provides a method for
determining the disease state of
a subject by evaluating changes, over time, in a modeled probability that the
subject has the disease
state using a temporal trend test. In some embodiments, the method includes
determining, for each
respective test time point in a plurality of test time points, a corresponding
genotypic data construct for
the test subject, the corresponding genotypic data construct including values
for a plurality of
genotypic characteristics based on a corresponding plurality of sequence
reads, in electronic form, of a
corresponding plurality of nucleic acid molecules in a corresponding
biological sample obtained from
the test subject at the respective test time point. The method can include
inputting the corresponding
genotypic data construct into a model for the disease condition (which is
described separately herein)
to generate a corresponding time stamped model score set for the disease
condition at the respective
test time point, thereby obtaining a plurality of time stamped test model
score sets for the test subject,
where each respective time stamped test model score set is coupled to a
different test time point in the
plurality of test time points. The method can include fitting the plurality of
time stamped test model
score sets with a temporal trend test, thereby obtaining a test trend
parameter set for the test subject.
The method can include evaluating the test trend parameter set for the test
subject against a plurality of
reference trend parameter sets for a plurality of reference subjects thereby
determining the disease
condition of the test subject, where each respective reference trend parameter
set in the plurality of
reference trend parameter sets is for a corresponding reference subject in the
plurality of reference
subjects.
100131 The method can include creating a classifier based on data from all
time-points to leverage all
the time-points at once to learn disease conditions rather than applying a
classifier marginally to each
time-point (e.g., applying a pre-trained single time-point classifier to test
samples collected from
multiple time-points) and post-hoc analyzing model scores with temporal
information (e.g., analyzing
a significant trend or difference in cancer probabilities/scores with respect
to a distribution of reference
delta scores). For example, a joint model for detecting disease conditions
(e.g., cancer signals) through
time can be created. The joint model can be a multiple time-point classifier
which is trained and tested
on time-series data (e.g., time-series genotypic data construct). The joint
model can improve the
inference or results of the cancer probability and overall trend because data
(e.g., the time-series data)
is shared across multiple time-points. The joint model can include an
asymptotic dimension for time
4
CA 03158101 2022-5-11
WO 2021/108654
PCT/US2020/062350
space and can be trained jointly both for time space (e.g., time-series data)
and feature space (e.g.,
other genotypic data constructs). In this situation, the joint model can
include information that a
genotypic data construct contributing to a cancer can be time-variant. The
input to the multiple time-
point classifier can include genotypic data construct (e.g., genomic features)
and disease conditions
(e.g., output-labels for cancer or non-cancer or tissue of origins) measured
at two or more time points,
and the multiple time-point classifier can include a logit transformation of
probability of cancer
corresponding to each sample and time point. During the process of determining
disease conditions for
new samples, the genotypic data construct of the new samples from previous
time points can be used to
estimate cancer probabilities for later time points, and vice versa. The joint
model can be further
trained and applied to test examples for classification by thresholding the
estimated cancer
probabilities to make predictions about the test samples' cancer states at
their corresponding time-
points (e.g., the current time-point). The joint model can also forecast
cancer probability trends in the
future, with or without medical interventions, based on the rate of change in
the estimated cancer
probability. To better improve classification and provide interpretability,
different regularization
approaches through probabilistic models or penalties can be used, such as
encouraging the latent
cancer probabilities to smoothly evolve through time, or enforcing a monotonic
increase in cancer
probability with stage.
INCORPORATION BY REFERENCE
[0014] All publications, patents, and patent applications herein are
incorporated by reference in their
entireties. In the event of a conflict between a term herein and a term in an
incorporated reference, the
term herein controls.
BRIEF DESCRIPTION OF THE DRAWINGS
[0015] The implementations disclosed herein are illustrated by way of example,
and not by way of
limitation, in the figures of the accompanying drawings. Like reference
numerals refer to
corresponding parts throughout the several views of the drawings.
[0016] Figures 1A and 18 collectively illustrate a block diagram for an
example of a computing
system for determining the disease state of a subject, in accordance with
various embodiments of the
present disclosure.
[0017] Figure 2 illustrates an example of a workflow for determining the
disease state of a subject, in
accordance with various embodiments of the present disclosure.
CA 03158101 2022-5-11
WO 2021/108654
PCT/US2020/062350
[0018] Figures 3A, 3B, 3C, 3D, 3E, 3F, and 3G collectively illustrate an
example process for
determining the disease state of a subject, in accordance with various
embodiments of the present
disclosure.
[0019] Figures 4A, 4B, 4C, 4D, 4E, and 4F collectively illustrate an example
process for determining
the disease state of a subject, in accordance with various embodiments of the
present disclosure.
[0020] Figures 5A and 5B illustrate changes in cancer probabilities for a
series of in silico augmented
normal samples, as described in Example 1.
[0021] Figure 6 illustrates distributions of cancer probabilities calculated
for samples from age-
matched and young healthy subjects without cancer, using a copy number-based
cancer classifier.
[0022] Figures 7A and 7B illustrate in silico regression of copy number
variation data, between a
tumor fraction of 0.0 and 1.0 (Figure 7A), and examples of cancer
probabilities calculated from three
simulated tumor fraction series, as a function of tumor fraction (Figure 7B).
[0023] Figure 8 shows cancer probabilities generated for samples collected and
amplified using five
different techniques from eight healthy reference subjects.
[0024] Figure 9 shows the sensitivity of various cancer detection models
achieved for each cancer
stage, as defined by simulated tumor fraction.
[0025] Figure 10 illustrates the distribution of changes in cancer
probabilities determined for
individuals using a cfDNA-based methylation cancer classifier, between first
and second time points
spaced from 12 to 40 months apart.
[0026] Figure 11 illustrates a plot of cancer probabilities determined for
individuals using a cfDNA-
based methylation cancer classifier at first (abscissa) and second (ordinate)
time points spaced from 12
to 40 months apart.
[0027] Figure 12 illustrates changes in cancer probabilities determined for
individuals using a cIDNA-
based methylation cancer classifier, between first and second time points
spaced from 12 to 40 months
apart, plotted as a function of the time period between blood draws.
[0028] Figure 13 illustrates a plot of cancer probabilities determined for
select individuals using a
cfDNA-based methylation cancer classifier at first (abscissa) and second
(ordinate) time points spaced
from 12 to 40 months apart.
6
CA 03158101 2022-5-11
WO 2021/108654
PCT/US2020/062350
DETAILED DESCRIPTION
[0029] Reference will now be made in detail to embodiments, examples of which
are illustrated in the
accompanying drawings. In the following detailed description, numerous
specific details are set forth
in order to provide a thorough understanding of the present disclosure.
However, it will be apparent to
one of ordinary skill in the art that the present disclosure may be practiced
without these specific
details. In other instances, well-known methods, procedures, components,
circuits, and networks have
not been described in detail so as not to obscure aspects of the embodiments.
[0030] The present disclosure provides, among other aspects, systems and
methods for identifying the
disease status of a subject by evaluating changes in biological
characteristics of the subject over time,
as opposed to at a single time point as is done for convention disease
detection assays. Specifically, by
using data across multiple biological samples from a subject over time,
personalized variance in
biological characteristics of the subject can be accounted for when monitoring
for a disease state.
[0031] For instance, conventional cancer diagnostics, whether using solid
tumor samples or blood-
based liquid biopsies, compare a subject's genomic aberrations attributable to
cancerous tissue,
identified from a single sample or a plurality of samples obtained at the same
time, to genomic
aberrations observed across a panel of controls. One limitation of this
approach is that individuals may
differ in their baseline level of aberration, making a generic cutoff on
genomic anomalies restrictive.
The theory underlying the systems and methods described herein can instead
posit that each individual
can be compared to a baseline state of themselves. This result can be improved
sensitivity and
specificity when detecting genomic aberrations, including novel genomic
changes. This may be
accomplished in a number of ways. For example, in one embodiment, intra-
individual differences in a
calculated probability of cancer are compared across time to intra-individual
differences in a similarly-
calculated probability of cancer in a panel of reference control subjects. In
another embodiments,
cancer probabilities determined from new samples from an individual are
compared to cancer
probabilities determined from previous samples from the individual, e.g.,
using a t-test which may or
may not allow for incorporation of prior information from the panel of
reference control subjects. In
another embodiment, for more than two longitudinal samples, a trend test is
performed on a series of
calculated cancer probabilities, which may or may not be further compared to
similar trend test results
obtained for the panel of reference control subjects.
7
CA 03158101 2022-5-11
WO 2021/108654
PCT/US2020/062350
100321 Advantageously, by accounting for some level of personal variance, the
methods provided
herein can increase the sensitivity and specificity of any underlying disease
model, e.g., that provides a
probability that the subject is afflicted with a particular disease state
based on biological features
measured from a single sample, For example, as described in Example 2, in
sidle experiments in
which time series data for the progression of cancer was simulated using
regression analysis
demonstrates that the comparative methods described herein have the potential
of increasing the
sensitivity of stage 0 cancer detection by at least 100%, the sensitivity of
stage I cancer detection by at
least 70%, and the sensitivity of stage II cancer detection by at least 40%
100331 Definitions.
[0034] As used herein, the term "about" or "approximately" can mean within an
acceptable error range
for the particular value as determined by one of ordinary skill in the art,
which can depend in part on
how the value is measured or determined, e.g., the limitations of the
measurement system. For
example, "about" can mean within 1 or more than 1 standard deviation, per the
practice in the art.
"About" can mean a range of 20%, 10%, 5%, or 1% of a given value. The term
"about" or
"approximately" can mean within an order of magnitude, within 5-fold, or
within 2-fold, of a value.
Where particular values are described in the application and claims, unless
otherwise stated the term
"about" meaning within an acceptable error range for the particular value can
be assumed. The term
"about" can have the meaning as commonly understood by one of ordinary skill
in the art. The term
"about" can refer to 10%. The term "about" can refer to 5%.
[0035] As used herein, the term "genotypic" refers to a characteristic of the
genome of an organism.
Non-limiting examples of genotypic characteristics include those relating to
the primary nucleic acid
sequence of all or a portion of the genome (e.g., the presence or absence of a
nucleotide
polymorphism, indel, sequence rearrangement, mutational frequency, etc.), the
copy number of one or
more particular nucleotide sequences within the genome (e.g., copy number,
allele frequency fractions,
single chromosome or entire genome ploidy, etc.), the epigenetic status of all
or a portion of the
genome (e.g., covalent nucleic acid modifications such as methylation, histone
modifications,
nucleosome positioning, etc.), the expression profile of the organism's genome
(e.g., gene expression
levels, isotype expression levels, gene expression ratios, etc.). Accordingly,
a "genotypic data
construct" refers to a data construct, es., an electronic data file, that
includes values for one or more
genotypic characteristics of a subject. In some embodiments, a genotypic data
construct includes one
or more genotypic characteristics determined from a biological sample
collected at a single time. In
8
CA 03158101 2022-5-11
WO 2021/108654
PCT/US2020/062350
other embodiments, a genotypic data construct includes one or more genotypic
characteristics
determined from biological samples collected at several time points.
[0036] As used herein, the term "biological sample," "patient sample," or
"sample" refers to any
sample taken from a subject, which can reflect a biological state associated
with the subject, and that
includes cell free DNA. Examples of biological samples include, but are not
limited to, blood, whole
blood, plasma, serum, urine, cerebrospinal fluid, fecal, saliva, sweat, tears,
pleural fluid, pericardial
fluid, or peritoneal fluid of the subject. A biological sample can include any
tissue or material derived
from a living or dead subject. A biological sample can be a cell-free sample.
A biological sample can
comprise a nucleic acid (e.g., DNA or RNA) or a fragment thereof. The term
"nucleic acid" can refer
to deoxyribonucleic acid (DNA), ribonucleic acid (RNA) or any hybrid or
fragment thereof. The
nucleic acid in the sample can be a cell-free nucleic acid. A sample can be a
liquid sample or a solid
sample (e.g., a cell or tissue sample). A biological sample can be a bodily
fluid, such as blood, plasma,
serum, urine, vaginal fluid, fluid from a hydrocele (e.g., of the testis),
vaginal flushing fluids, pleural
fluid, ascitic fluid, cerebrospinal fluid, saliva, sweat, tears, sputum,
bronchoalveolar lavage fluid,
discharge fluid from the nipple, aspiration fluid from different parts of the
body (e.g., thyroid, breast),
etc. A biological sample can be a stool sample. In various embodiments, the
majority of DNA in a
biological sample that has been enriched for cell-free DNA (e.g., a plasma
sample obtained via a
centrifugation protocol) can be cell-free (e.g., greater than 50%, 60%, 70%,
80%, 90%, 95%, or 99%
of the DNA can be cell-free). A biological sample can be treated to physically
disrupt tissue or cell
structure (e.g., centrifugation and/or cell lysis), thus releasing
intracellular components into a solution
which can further contain enzymes, buffers, salts, detergents, and the like
which can be used to prepare
the sample for analysis.
100371 As used herein, the term "cancer" or "tumor" refers to an abnormal mass
of tissue in which the
growth of the mass surpasses and is not coordinated with the growth of normal
tissue A cancer or
tumor can be defined as "benign" or "malignant" depending on the following
characteristics: degree of
cellular differentiation including morphology and functionality, rate of
growth, local invasion and
metastasis. A "benign" tumor can be well differentiated, have
characteristically slower growth than a
malignant tumor and remain localized to the site of origin. In addition, in
some cases a benign tumor
does not have the capacity to infiltrate, invade or metastasize to distant
sites. A "malignant" tumor can
be a poorly differentiated (anaplasia), have characteristically rapid growth
accompanied by progressive
9
CA 03158101 2022-5-11
WO 2021/108654
PCT/US2020/062350
infiltration, invasion, and destruction of the surrounding tissue.
Furthermore, a malignant tumor can
have the capacity to metastasize to distant sites.
[0038] As used herein, the term "cancer condition" refers to breast cancer,
lung cancer, prostate
cancer, colorectal cancer, renal cancer, uterine cancer, pancreatic cancer,
cancer of the esophagus, a
lymphoma, head/neck cancer, ovarian cancer, a hepatobiliary cancer, a
melanoma, cervical cancer,
multiple myeloma, leukemia, thyroid cancer, bladder cancer, and gastric
cancer. A cancer condition
can be a predetermined stage of a breast cancer, a predetermined stage of a
lung cancer, a
predetermined stage of a prostate cancer, a predetermined stage of a
colorectal cancer, a predetermined
stage of a renal cancer, a predetermined stage of a uterine cancer, a
predetermined stage of a pancreatic
cancer, a predetermined stage of a cancer of the esophagus, a predetermined
stage of a lymphoma, a
predetermined stage of a head/neck cancer, a predetermined stage of a ovarian
cancer, a predetermined
stage of a hepatobiliary cancer, a predetermined stage of a melanoma, a
predetermined stage of a
cervical cancer, a predetermined stage of a multiple myeloma, a predetermined
stage of a leukemia, a
predetermined stage of a thyroid cancer, a predetermined stage of a bladder
cancer, or a predetermined
stage of a gastric cancer. A cancer condition can also be a survival metric,
which can be a
predetermined likelihood of survival for a predetermined period of time.
[0039] As used herein, the term "Circulating Cell-free Genome Atlas" or "CCGA"
is defined as an
observational clinical study that prospectively collects blood and tissue from
newly diagnosed cancer
patients as well as blood from subjects who do not have a cancer diagnosis.
The purpose of the study
is to develop a pan-cancer classifier that distinguishes cancer from non-
cancer and identifies tissue of
origin. Example 1 provides further details of the CCGA study.
100401 The term "classification" can refer to any number(s) or other
characters(s) that are associated
with a particular property of a sample. For example, a "-F" symbol (or the
word "positive") can signify
that a sample is classified as having deletions or amplifications. In another
example, the term
"classification" can refer to an amount of tumor tissue in the subject and/or
sample, a size of the tumor
in the subject and/or sample, a stage of the tumor in the subject, a tumor
load in the subject and/or
sample, and presence of tumor metastasis in the subject. The classification
can be binary (e.g., positive
or negative) or have more levels of classification (e.g., fall into some
numeric range supported or
outputted by the classifier). The terms "cutoff' and "threshold" can refer to
predetermined numbers
used in an operation. For example, a cutoff size can refer to a size above
which fragments are
CA 03158101 2022-5-11
WO 2021/108654
PCT/US2020/062350
excluded. A threshold value can be a value above or below which a particular
classification applies.
Either of these terms can be used in either of these contexts
[0041] As used herein, the terms "nucleic acid" and "nucleic acid molecule"
are used interchangeably.
The terms refer to nucleic acids of any composition form, such as
deoxyribonucleic acid (DNA, e.g.,
complementary DNA (cDNA), genomic DNA (gDNA) and the like), and/or DNA analogs
(e.g.,
containing base analogs, sugar analogs and/or a non-native backbone and the
like), all of which can be
in single- or double-stranded form. Unless otherwise limited, a nucleic acid
can comprise known
analogs of natural nucleotides, some of which can function in a similar manner
as naturally occurring
nucleotides. A nucleic acid can be in any form useful for conducting processes
herein (e.g., linear,
circular, supercoiled, single-stranded, double-stranded and the like). A
nucleic acid in some
embodiments can be from a single chromosome or fragment thereof (e.g., a
nucleic acid sample may
be from one chromosome of a sample obtained from a diploid organism). In
certain embodiments
nucleic acids comprise nucleosomes, fragments or parts of nucleosomes or
nucleosome-like structures.
Nucleic acids can comprise protein (e.g., histones, DNA binding proteins, and
the like). Nucleic acids
analyzed by processes described herein can be substantially isolated and are
not substantially
associated with protein or other molecules. Nucleic acids can also include
derivatives, variants and
analogs of DNA synthesized, replicated or amplified from single-stranded
("sense" or "antisense,"
"plus" strand or "minus" strand, "forward" reading frame or "reverse" reading
frame) and double-
stranded polynucleotides. Deoxyribonucleotides can include deoxyadenosine,
deoxycytidine,
deoxyguanosine and deoxythymidine. A nucleic acid may be prepared using a
nucleic acid obtained
from a subject as a template.
[0042] As used herein, the term "cell-free nucleic acids" refers to nucleic
acid molecules that can be
found outside cells, in bodily fluids such as blood, whole blood, plasma,
serum, urine, cerebrospinal
fluid, fecal, saliva, sweat, sweat, tears, pleural fluid, pericardial fluid,
or peritoneal fluid of a subject.
Cell-free nucleic acids originate from one or more healthy cells and/or from
one or more cancer cells
Cell-free nucleic acids are used interchangeably as circulating nucleic acids.
Examples of the cell-free
nucleic acids include but are not limited to RNA, mitochondria] DNA, or
genomic DNA. As used
herein, the terms "cell free nucleic acid," "cell free DNA," and "cfDNA" are
used interchangeably.
[0043] As used herein, the terms "control," "control sample," "reference,"
"reference sample,"
"normal," and "normal sample" describe a sample from a subject that does not
have a particular
condition, or is otherwise healthy. In an example, a method as disclosed
herein can be performed on a
11
CA 03158101 2022-5-11
WO 2021/108654
PCT/US2020/062350
subject having a tumor, where the reference sample is a sample taken from a
healthy tissue of the
subject. A reference sample can be obtained from the subject, or from a
database. The reference can
be, e.g., a reference genome that is used to map sequence reads obtained from
sequencing a sample
from the subject. A reference genome can refer to a haploid or diploid genome
to which sequence
reads from the biological sample can be aligned and compared. An example of
control sample can be
DNA of white blood cells obtained from the subject. For a haploid genome,
there can be one
nucleotide at each locus. For a diploid genome, heterozygous loci can be
identified; each heterozygous
locus can have two alleles, where either allele can allow a match for
alignment to the locus.
100441 As used herein, the phrase "healthy" refers to a subject possessing
good health. A healthy
subject can demonstrate an absence of any malignant or non-malignant disease.
A "healthy
individual" can have other diseases or conditions, unrelated to the condition
being assayed, which can
normally not be considered "healthy."
100451 As used here, the term "high-signal cancer" means cancers with greater
than 50% 5-year
cancer-specific mortality. Examples of high-signal cancer include anorectal,
colorectal, esophageal,
head & neck, hepatobiliary, lung, ovarian, and pancreatic cancers, as well as
lymphoma and multiple
myeloma. High-signal cancers can be more aggressive and typically have an
above-average cell-free
nucleic acid concentration in test samples obtained from a patient. In some
embodiments, "high signal
cancers" refer to cancers that do not fall within the group of low signal
cancers (e.g., uterine cancer,
thyroid cancer, prostate cancer, and hormone-receptor-positive stage I/II
breast cancer).
100461 As used herein, the term "stage of cancer" (where the term "cancer" is
either cancer generally
or an enumerated cancer type) refers to whether cancer (or the enumerated
cancer type when indicated)
exists (e.g., presence or absence), a level of a cancer, a size of tumor,
presence or absence of
metastasis, the total tumor burden of the body, and/or other measure of a
severity of a cancer (e.g.,
recurrence of cancer). The stage of cancer can be a number or other indicia,
such as symbols, alphabet
letters, and colors. The stage can be zero. The stage of cancer can also
include premalignant or
precancerous conditions (states) associated with mutations or a number of
mutations. The stage of
cancer can be used in various ways. For example, screening can check if cancer
is present in someone
who is not known previously to have cancer. Assessment can investigate someone
who has been
diagnosed with cancer to monitor the progress of cancer overtime, study the
effectiveness of therapies
or to determine the prognosis. In one embodiment, the prognosis can be
expressed as the chance of a
subject dying of cancer, or the chance of the cancer progressing after a
specific duration or time, or the
12
CA 03158101 2022-5-11
WO 2021/108654
PCT/US2020/062350
chance of cancer metastasizing. Detection can comprise 'screening' or can
comprise checking if
someone, with suggestive features of cancer (e.g., symptoms or other positive
tests), has cancer. A
"level of pathology" can refer to level of pathology associated with a
pathogen, where the level can be
as described above for cancer. When the cancer is associated with a pathogen,
a level of cancer can be
a type of a level of pathology.
[0047] As used herein, the term "reference genome" refers to any particular
known, sequenced or
characterized genome, whether partial or complete, of any organism or virus
that may be used to
reference identified sequences from a subject. Exemplary reference genomes
used for human subjects
as well as many other organisms are provided in the on-line genome browser
hosted by the National
Center for Biotechnology Information ("NCBI") or the University of California,
Santa Cruz (UCSC).
A "genome" refers to the complete genetic information of an organism or virus,
expressed in nucleic
acid sequences. As used herein, a reference sequence or reference genome can
be an assembled or
partially assembled genomic sequence from an individual or multiple
individuals. In some
embodiments, a reference genome is an assembled or partially assembled genomic
sequence from one
or more human individuals. The reference genome can be viewed as a
representative example of a
species' set of genes. In some embodiments, a reference genome comprises
sequences assigned to
chromosomes. Exemplary human reference genomes include but are not limited to
NCBI build 34
(UCSC equivalent: hg16), NCBI build 35 (UCSC equivalent: hg17), NCBI build
36.1 (UCSC
equivalent: hg18), GRCh37 (UCSC equivalent: hg19), and GRCh38 (UCSC
equivalent: hg38).
[0048] As used herein, the terms "sequencing," "sequence determination," and
the like as used herein
refers generally to any and all biochemical processes that may be used to
determine the order of
biological macromolecules such as nucleic acids or proteins. For example,
sequencing data can
include all or a portion of the nucleotide bases in a nucleic acid molecule
such as a DNA fragment
[0049] As used herein, the term "sequence reads" or "reads" refers to
nucleotide sequences produced
by any sequencing process described herein or known in the art. Reads can be
generated from one end
of nucleic acid fragments ("single-end reads"), and sometimes are generated
from both ends of nucleic
acids (e.g., paired-end reads, double-end reads). In some embodiments,
sequence reads (e.g., single-
end or paired-end reads) can be generated from one or both strands of a
targeted nucleic acid fragment.
The length of the sequence read can be associated with the particular
sequencing technology. High-
throughput methods, for example, can provide sequence reads that can vary in
size from tens to
hundreds of base pairs (bp). In some embodiments, the sequence reads are of a
mean, median or
13
CA 03158101 2022-5-11
WO 2021/108654
PCT/US2020/062350
average length of about 15 bp to 900 bp long (e.g., about 20 bp, about 25 bp,
about 30 bp, about 35 bp,
about 40 bp, about 45 bp, about 50 bp, about 55 bp, about 60 bp, about 65 bp,
about 70 bp, about 75
bp, about 80 bp, about 85 bp, about 90 bp, about 95 bp, about 100 bp, about
110 bp, about 120 bp,
about 130, about 140 bp, about 150 bp, about 200 bp, about 250 bp, about 300
bp, about 350 bp, about
400 bp, about 450 bp, or about 500 bp. In some embodiments, the sequence reads
are of a mean,
median or average length of about 1000 bp, 2000 bp, 5000 bp, 10,000 bp, or
50,000 bp or more.
Nanopore sequencing, for example, can provide sequence reads that can vary in
size from tens to
hundreds to thousands of base pairs. Illumina parallel sequencing can provide
sequence reads that do
not vary as much, for example, most of the sequence reads can be smaller than
200 bp. A sequence
read (or sequencing read) can refer to sequence information corresponding to a
nucleic acid molecule
(e.g., a string of nucleotides). For example, a sequence read can correspond
to a string of nucleotides
(e.g., about 20 to about 150) from part of a nucleic acid fragment, can
correspond to a string of
nucleotides at one or both ends of a nucleic acid fragment, or can correspond
to nucleotides of the
entire nucleic acid fragment. A sequence read can be obtained in a variety of
ways, e.g., using
sequencing techniques or using probes, e.g., in hybridization arrays or
capture probes, or amplification
techniques, such as the polymerase chain reaction (PCR) or linear
amplification using a single primer
or isothermal amplification.
[0050] As used herein the term "sequencing breadth" refers to what fraction of
a particular reference
genome (e.g., human reference genome) or part of the genome has been analyzed.
The denominator of
the fraction can be a repeat-masked genome, and thus 100% can correspond to
all of the reference
genome minus the masked parts. A repeat-masked genome can refer to a genome in
which sequence
repeats are masked (e.g., sequence reads align to unmasked portions of the
genome). Any parts of a
genome can be masked, and thus one can focus on any particular part of a
reference genome. Broad
sequencing can refer to sequencing and analyzing at least 0.1% of the genome.
[0051] As used herein, the term "sequencing depth," is interchangeably used
with the term "coverage"
and refers to the number of times a genomic location is surveyed during a
sequencing process. For
example, it can be reflected by the number of times that a locus is covered by
a consensus sequence
read corresponding to a unique nucleic acid target molecule aligned to the
locus; e.g., the sequencing
depth is equal to the number of unique nucleic acid target molecules coveting
the locus. The genomic
location can be as small as a nucleotide, or as large as a chromosome arm, or
as large as an entire
genome. Sequencing depth can be expressed as "Yx", e.g., 50x, 100x, etc.,
where "V" refers to the
14
CA 03158101 2022-5-11
WO 2021/108654
PCT/US2020/062350
number of times a genomic location is covered with a sequence corresponding to
a nucleic acid target;
e g , the number of times independent sequence information is obtained
covering the particular
genomic location. In some embodiments, the sequencing depth corresponds to the
number of genomes
that have been sequenced. Sequencing depth can also be applied to multiple
loci, or the whole
genome, in which case Y can refer to the mean or average number of times a
loci or a haploid genome,
or a whole genome, respectively, is independently sequenced. When a mean depth
is quoted, the
actual depth for different loci included in the dataset can span over a range
of values. In some
embodiments, deep sequencing can refer to at least 100x in sequencing depth at
a locus. In some
embodiments, a sequencing depth of 10,000x or higher can be adopted in order
to identify rare
mutations.
[0052] As used herein, the term "sensitivity" or "true positive rate" (TPR)
refers to the number of true
positives divided by the sum of the number of true positives and false
negatives. Sensitivity can
characterize the ability of an assay or method to correctly identify a
proportion of the population that
truly has a condition. For example, sensitivity can characterize the ability
of a method to correctly
identify the number of subjects within a population having cancer. In another
example, sensitivity can
characterize the ability of a method to correctly identify the one or more
markers indicative of cancer.
[0053] As used herein, the term "specificity" or "true negative rate" (TNR)
refers to the number of true
negatives divided by the sum of the number of true negatives and false
positives. Specificity can
characterize the ability of an assay or method to correctly identify a
proportion of the population that
truly does not have a condition. For example, specificity can characterize the
ability of a method to
correctly identify the number of subjects within a population not having
cancer. In another example,
specificity characterizes the ability of a method to correctly identify one or
more markers indicative of
cancer.
[0054] As used herein, the term "true positive" (TP) refers to a subject
having a condition. "True
positive' can refer to a subject that has a tumor, a cancer, a precancerous
condition (e.g., a
precancerous lesion), a localized or a metastasized cancer, or a non-malignant
disease. "True positive"
can refer to a subject having a condition, and is identified as having the
condition by an assay or
method of the present disclosure.
[0055] As used herein, the term "true negative" (TN) refers to a subject that
does not have a condition
or does not have a detectable condition. True negative can refer to a subject
that does not have a
CA 03158101 2022-5-11
WO 2021/108654
PCT/US2020/062350
disease or a detectable disease, such as a tumor, a cancer, a precancerous
condition (e.g., a
precancerous lesion), a localized or a metastasized cancer, a non-malignant
disease, or a subject that is
otherwise healthy. True negative can refer to a subject that does not have a
condition or does not have
a detectable condition, or is identified as not having the condition by an
assay or method of the present
disclosure.
[0056] As used herein, the term "single nucleotide variant" or "SNV" refers to
a substitution of one
nucleotide at a position (e.g., site) of a nucleotide sequence, e.g., a
sequence corresponding to a target
nucleic acid molecule from an individual, to a nucleotide that is different
from the nucleotide at the
corresponding position in a reference genome. A substitution from a first
nucleobase X to a second
nudeobase Y may be denoted as "X>Y." For example, a cytosine to thymine SNV
may be denoted as
"C>T." In some embodiments, an SNV does not result in a change in amino acid
expression (a
synonymous variant). In some embodiments, an SNV results in a change in amino
acid expression (a
non-synonymous variant).
[0057] As used herein, the term "methylation" refers to a modification of
deoxyribonucleic acid
(DNA) where a hydrogen atom on the pyrimidine ring of a cytosine base is
converted to a methyl
group, forming 5-methylcytosine. Methylation can occur at dinucleofides of
cytosine and guanine
referred to herein as "CpG sites". In other instances, methylation may occur
at a cytosine not part of a
CpG site or at another nucleotide that's not cytosine; however, these are
rarer occurrences. In this
present disclosure, methylation can be discussed in reference to CpG sites for
the sake of clarity.
Anomalous cfDNA methylation can be identified as hypermethylation or
hypomethylation, both of
which may be indicative of cancer status. As is well known in the art, DNA
methylation anomalies
(compared to healthy controls) can cause different effects, which may
contribute to cancer.
[0058] Various challenges arise in the identification of anomalously
methylated cfDNA fragments.
First, determining a subject's cfDNA to be anomalously methylated can hold
weight in comparison
with a group of control subjects, such that if the control group is small in
number, the determination
can lose confidence with the small control group. Additionally, among a group
of control subjects'
methylation status can vary which can be difficult to account for when
determining a subject's cfDNA
to be anomalously methylated. On another note, methylation of a cytosine at a
CpG site can causally
influence methylation at a subsequent CpG site.
16
CA 03158101 2022-5-11
WO 2021/108654
PCT/US2020/062350
100591 The principles described herein can be equally applicable for the
detection of methylation in a
non-CpG context, including non-cytosine methylation. Further, the methylation
state vectors may
contain elements that are generally vectors of sites where methylation has or
has not occurred (even if
those sites are not CpG sites specifically). With that substitution, the
remainder of the processes
described herein are the same, and consequently, the inventive concepts
described herein are applicable
to those other forms of methylation.
00601 As used herein the term "methylation index" for each genomic site (e.g.,
a CpG site, a region of
DNA where a cytosine nucleotide is followed by a guanine nucleotide in the
linear sequence of bases
along its 5' ¨) 3' direction) can refer to the proportion of sequence reads
showing methylation at the
site over the total number of reads covering that site. The "methylation
density" of a region can be the
number of reads at sites within a region showing methylation divided by the
total number of reads
covering the sites in the region. The sites can have specific characteristics,
(e.g., the sites can be CpG
sites). The "CpG methylation density" of a region can be the number of reads
showing CpG
methylation divided by the total number of reads covering CpG sites in the
region (e.g., a particular
CpG site, CpG sites within a CpG island, or a larger region). For example, the
methylation density for
each 100-kb bin in the human genome can be determined from the total number of
unconverted
cytosines (which can correspond to methylated cytosine) at CpG sites as a
proportion of all CpG sites
covered by sequence reads mapped to the 100-kb region. In some embodiments,
this analysis is
performed for other bin sizes, e.g., 50-kb or 1-Mb, etc. In some embodiments,
a region is an entire
genome or a chromosome or part of a chromosome (e.g., a chromosomal arm). A
methylation index of
a CpG site can be the same as the methylation density for a region when the
region includes that CpG
site. The "proportion of methylated cytosines" can refer the number of
cytosine sites, "C's," that are
shown to be methylated (for example unconverted after bisulfite conversion)
over the total number of
analyzed cytosine residues, e.g., including cytosines outside of the CpG
context, in the region. The
methylation index, methylation density and proportion of methylated cytosines
are examples of
"methylation levels."
100611 As used herein, the term "methylation profile" (also called methylation
status) can include
information related to DNA methylation for a region. Information related to
DNA methylation can
include a methylation index of a CpG site, a methylation density of CpG sites
in a region, a distribution
of CpG sites over a contiguous region, a pattern or level of methylation for
each individual CpG site
within a region that contains more than one CpG site, and non-CpG methylation.
A methylation
17
CA 03158101 2022-5-11
WO 2021/108654
PCT/US2020/062350
profile of a substantial part of the genome can be considered equivalent to
the methylome. "DNA
methylation" in mammalian genotnes can refer to the addition of a methyl group
to position 5 of the
heterocyclic ring of cytosine (e.g., to produce 5-methylcytosine) among CpG
dinucleotides.
Methylation of cytosine can occur in cytosines in other sequence contexts, for
example, 5'-CHG-3'
and 5'-CHH-3', where H is adenine, cytosine or thymine. Cytosine methylation
can also be in the
form of 5-hydroxymethylcytosine. Methyl ation of DNA can include methylation
of non-cytosine
nucleotides, such as N6-methyladenine.
100621 As used herein, the terms "size profile" and "size distribution" can
relate to the sizes of DNA
fragments in a biological sample. A size profile can be a histogram that
provides a distribution of an
amount of DNA fragments at a variety of sizes. Various statistical parameters
(also referred to as size
parameters or just parameter) can distinguish one size profile to another. One
parameter can be the
percentage of DNA fragment of a particular size or range of sizes relative to
all DNA fragments or
relative to DNA fragments of another size or range.
100631 As used herein, the term "subject" refers to any living or non-living
organism, including but not
limited to a human (e.g., a male human, female human, fetus, pregnant female,
child, or the like), a
non-human animal, a plant, a bacterium, a fungus or a protist. Any human or
non-human animal can
serve as a subject, including but not limited to mammal, reptile, avian,
amphibian, fish, ungulate,
ruminant, bovine (e.g., cattle), equine (e.g., horse), caprine and ovine
(e.g., sheep, goat), swine (e.g.,
pig), camelid (e.g., camel, llama, alpaca), monkey, ape (e.g., gorilla,
chimpanzee), ursid (e.g., bear),
poultry, dog, cat, mouse, rat, fish, dolphin, whale and shark. In some
embodiments, a subject is a male
or female of any age (e.g., a man, a women or a child).
100641 As used herein, the term "tissue" refers to a group of cells that
function together as a functional
unit. More than one type of cell can be found in a single tissue. Different
types of tissue may include
different types of cells (e.g., hepatocytes, alveolar cells or blood cells),
but also can correspond to
tissue from different organisms (mother vs. fetus) or to healthy cells vs.
tumor cells_ The term "tissue"
can generally refer to any group of cells found in the human body (e.g., heart
tissue, lung tissue, kidney
tissue, nasopharyngeal tissue, oropharyngeal tissue). In some aspects, the
term "tissue" or "tissue
type" can be used to refer to a tissue from which a cell-free nucleic acid
originates. In one example,
viral nucleic acid fragments can be derived from blood tissue. In another
example, viral nucleic acid
fragments can be derived from tumor tissue.
18
CA 03158101 2022-5-11
WO 2021/108654
PCT/US2020/062350
[0065] The terminology used herein is for the purpose of describing particular
cases and is not
intended to be limiting As used herein, the singular forms "a," "an" and "the"
are intended to include
the plural forms as well, unless the context clearly indicates otherwise
Furthermore, to the extent that
the terms "including," "includes," "having," "has," "with," or variants
thereof are used in either the
detailed description and/or the claims, such terms are intended to be
inclusive in a manner similar to
the term "comprising."
[0066] Several aspects are described below with reference to example
applications for illustration.
Numerous specific details, relationships, and methods are set forth to provide
a full understanding of
the features described herein. The features described herein can be practiced
without one or more of
the specific details or with other methods. The features described herein are
not limited by the
illustrated ordering of acts or events, as some acts can occur in different
orders and/or concurrently
with other acts or events. Furthermore, not all illustrated acts or events are
used to implement a
methodology in accordance with the features described herein.
[0067] Plural instances may be provided for components, operations or
structures described herein as a
single instance. Finally, boundaries between various components, operations,
and data stores are
somewhat arbitrary, and particular operations are illustrated in the context
of specific illustrative
configurations. Other allocations of functionality are envisioned and may fall
within the scope of the
implementation(s). In general, structures and functionality presented as
separate components in the
example configurations may be implemented as a combined structure or
component. Similarly,
structures and functionality presented as a single component may be
implemented as separate
components. These and other variations, modifications, additions, and
improvements fall within the
scope of the implementation(s).
[0068] Although the terms first, second, etc. may be used herein to describe
various elements, these
elements should not be limited by these terms. These terms are used to
distinguish one element from
another. For example, a first subject could be termed a second subject, and,
similarly, a second subject
could be termed a first subject, without departing from the scope of the
present disclosure. The first
subject and the second subject are both subjects, but they are not the same
subject.
[0069] As used herein, the term "if' may be construed to mean "when" or "upon"
or "in response to
determining" or "in response to detecting," depending on the context.
Similarly, the phrase "if it is
determined" or "if [a stated condition or event] is detected" may be construed
to mean "upon
19
CA 03158101 2022-5-11
WO 2021/108654
PCT/US2020/062350
determining" or "in response to determining" or "upon detecting (the stated
condition or event (" or "in
response to detecting (the stated condition or event)," depending on the
context.
[0070] System Embodiments.
100711 A detailed description of a system 100 for determining the disease
state of a subject is
described in conjunction with Figures IA and 1B. As such, Figures IA and IB
collectively illustrate
the topology of a system, in accordance with an embodiment of the present
disclosure.
[0072] Referring to Figure 1A, in some embodiments, system 100 includes one or
more computers.
For purposes of illustration in Figure 1A, system 100 is represented as a
single computer that includes
all of the functionality for identifying interactions within complex
biological systems using data from a
cell-based assay. However, in some embodiments, the functionality for
determining the disease state
of a subject is spread across any number of networked computers and/or resides
on each of several
net-worked computers and/or is hosted on one or more virtual machines at a
remote location accessible
across the communications network 105. Any of a wide array of different
computer topologies can be
used for the application and all such topologies are within the scope of the
present disclosure.
[0073] Details of an exemplary system are now described in conjunction with
Figure 1. Figure 1 is a
block diagram illustrating a system 100 in accordance with some
implementations. The device 100 in
some implementations includes at least one or more processing units CPU(s) 102
(also referred to as
processors), one or more network interfaces 104, a user interface 106, e.g.,
including a display 108
and/or keyboard 110, a memory 111, and one or more communication buses 114 for
interconnecting
these components. The one or more communication buses 114 optionally include
circuitry (sometimes
called a chipset) that interconnects and controls communications between
system components. The
memory 111 may be a non-persistent memory, a persistent memory, or any
combination thereof. The
non-persistent memory can include high-speed random access memory, such as
DRAM, SRAM, DDR
RAM, ROM, EEPROM, flash memory, whereas the persistent memory can include CD-
ROM, digital
versatile disks (DVD) or other optical storage, magnetic cassettes, magnetic
tape, magnetic disk
storage or other magnetic storage devices, magnetic disk storage devices,
optical disk storage devices,
flash memory devices, or other non-volatile solid state storage devices.
Regardless of its specific
implementation, the memory 111 comprises at least one non-transitory computer
readable storage
medium, and it stores thereon computer-executable executable instructions
which can be in the form of
programs, modules, and data structures.
CA 03158101 2022-5-11
WO 2021/108654
PCT/US2020/062350
[0074] In some embodiments, as shown in Figure 1, the memory 111 stores:
= instructions, programs, data, or information associated with an optional
operating
system 116, which includes procedures for handling various basic system
services and for
performing hardware-dependent tasks;
= instructions, programs, data, or information associated with an optional
network
communication module (or instructions) 118 for connecting the system 100 with
other devices
and/or to a communication network 105;
= a test genotypic data construct database 120 for storing sets 122 of
genotypic data
constructs 124 for test subjects, where each genotypic data construct 124
includes genotypic
features acquired from sequencing cell-free DNA for the subject, e.g., one or
more of genomic
copy number data 124, e.g., bin read counts 126 for different regions of the
genome of the
subject, variant allele data 128, e.g., allele statuses 130 for different
alleles within the genome
of the subject, allelic ratio data 132, e.g., allele fractions 134 for
different alleles within the
genome of the subject, and genomic methylation data 136, e.g., CpG methylation
statuses 138
for different genomic regions of the genome of the subject;
= instructions, programs, data, or information associated with a disease
class evaluation
module 140 for interrogating one or more genotypic data constructs 124 for a
test subject 122
using a disease classification model 142, to provide a disease class module
score set 146 for a
test subject 144; and
= instructions, programs, data, or information associated with a delta
score evaluation
module 150 for evaluating a plurality of disease class model score sets 146
for a test subject
against a reference delta score set 154, to provide a test subject
classification 162, the delta
score evaluation module 150 optionally applying one or more reference delta
score set
covariates 158 to either or both of a disease class model score set 146 and a
reference delta
score set 154 prior to evaluation and/or including a normalization sub-module
to normalize
either or both of a disease class model score set 146 and a reference delta
score set 154 prior to
evaluation.
[0075] In some implementations, modules 118, 140, and/or 150 and/or data
stores 122, 144, 152,
and/or 160 are accessible within any browser (e.g., installed on a phone,
tablet, or laptop/desktop
system). In some embodiments, modules 118, 140, and/or 150 run on native
device frameworks, and
21
CA 03158101 2022-5-11
WO 2021/108654
PCT/US2020/062350
are available for download onto the system 100 running an operating system
116, such as Windows,
macOS, a Linux operating system, Android OS, or i0S.
[0076] In some implementations, one or more of the above identified data
elements or modules of the
system 100 for determining the disease state of a subject are stored in one or
more of the previously
described memory devices, and correspond to a set of instructions for
performing a function described
above. The above-identified data, modules or programs (e.g., sets of
instructions) may not be
implemented as separate software programs, procedures or modules, and thus
various subsets of these
modules may be combined or otherwise re-arranged in various implementations.
In some
implementations, the memory 111 optionally stores a subset of the modules and
data structures
identified above. Furthermore, in some embodiments the memory 111 stores
additional modules and
data structures not described above. In some embodiments, one or more of the
above identified
elements is stored in a computer system, other than that of system 100, that
is addressable by system
100 so that system 100 may retrieve all or a portion of such data.
[0077] Although Figure 1 depicts a "system 100," the figure is intended as a
functional description of
the various features which may be present in computer systems than as a
structural schematic of the
implementations described herein. In practice, items shown separately can be
combined and some
items can be separated. Moreover, although Figure 1 depicts certain data and
modules in the memory
111 (which can be non-persistent or persistent memory), it can be appreciated
that these data and
modules, or portion(s) thereof, may be stored in more than one memory.
[0078] Any of the disclosed methods can make use of any of the assays or
algorithms disclosed in US
Pat. No. 9,121,069 entitled "Diagnosing cancer using genomic sequencing," US
Pat. Pub, No.
2017/0218450A1 entitled "Detecting genetic aberrations associated with cancer
using genomic
sequencing," US Pat. No 9,965,585 entitled "Detection of genetic or molecular
aberrations associated
with cancer," US Pat. No. 9,892,230 entitled "Size-based analysis of fetal or
tumor DNA fraction in
plasma," US Pat. Pub. No. 2016/0201142A1 entitled "Using size and number
aberrations in plasma
DNA for detecting cancer," US App. No. 62/642, 461 entitled "Method and system
for selecting,
managing and analyzing data of high dimensionality," US App. No. 62/679,746
entitled
"convolutional neural network systems and methods for data classification," US
App. No. 62/777,693
entitled "Systems and Methods for Classifying Patients with Respect to
Multiple Cancer Classes," the
disclosures of which are incorporated herein by reference, in their
entireties, for all purposes.
22
CA 03158101 2022-5-11
WO 2021/108654
PCT/US2020/062350
Accordingly, in some embodiments, system 100 disclosed herein may include any
of the modules or
data stores described in any of the above patents and patent applications.
[0079] Now that details of a system 100 for determining the disease state of a
subject have been
disclosed, details regarding processes and features of the system, in
accordance with various
embodiment of the present disclosure, are disclosed below. Specifically,
example processes are
described below with reference to Figures 2, 3A-3G, and 4A-4F. In some
embodiments, such
processes and features of the system are carried out by modules 118, 140,
and/or 150, as illustrated in
Figure 1. Referring to these methods, the systems described herein (e.g.,
system 100) can include
instructions for performing the methods for determining the disease state of a
subject.
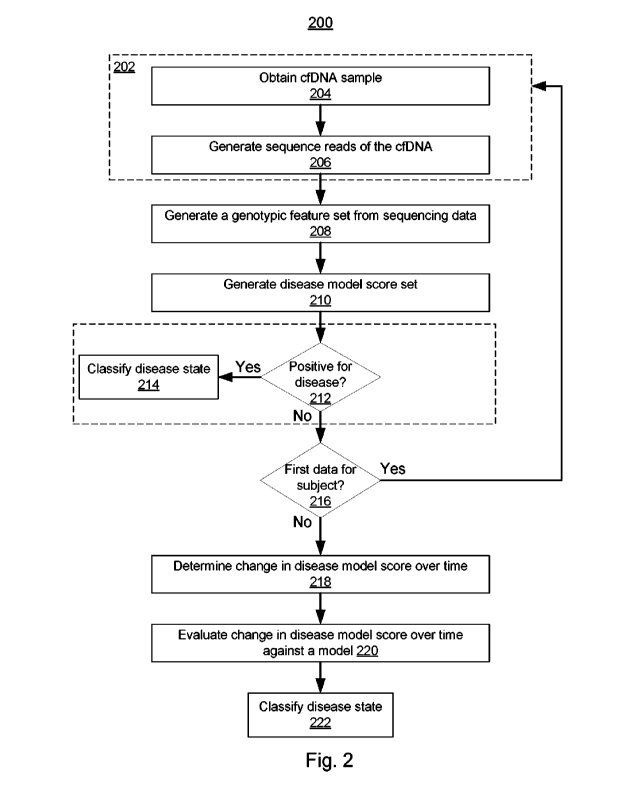
[0080] Figure 2 illustrates an example workflow 200 for determining the
disease state of a subject, by
evaluating changes in one or more biological signatures of the subject over
time, in accordance with
various embodiments of the present disclosure. Further details on various
implementation of the steps
illustrated in workflow 200 are described with more particularity below, e.g.,
in conjunction with the
descriptions of examples methods 300 and 400. However, methods 300 and 400 can
be example
implementations of workflow 200, which can be suitable alternatives for
performing each of the steps
shown in workflow 200.
100811 In some embodiments, the first step of workflow 200 is collection (202)
of the underlying
biological data from the subject at a first time A biological sample can be
collected (204) from the
subject, e.g., at multiple time points. In some embodiments, as illustrated in
Figure 2, the biological
sample used in the methods described herein includes cell-free nucleic acids,
e.g., cfDNA.
Advantageously, cell-free nucleic acids can be obtained by a minimally-
invasive, small-volume blood
draw from the subject, or possibly from non-invasive sampling of other bodily
fluids such as saliva or
urine. However, the systems and methods described herein can be suitable for
evaluating any type of
biological data that can be used to detect a disease state in a subject, e.g.,
cell-free or cellular genomic
data, transcriptomic data, epigenetic data, proteomic data, metabolomic data,
etc.
100821 The biological samples can be processed to obtain biological
information about the subject
(206), e.g., one or more biological signatures for the subject at a given time
point. In some
embodiments, as illustrated in Figure 2, cell-free nucleic acids (e.g., cfDNA)
in the sample are
sequenced to generate cfDNA sequence reads. For instance, many methods for
next generation
sequencing, which can be used for either DNA or RNA sequencing, can be used to
isolate and
23
CA 03158101 2022-5-11
WO 2021/108654
PCT/US2020/062350
sequence cell-free nucleic acid. These methods can include sequencing-by-
synthesis technology
(illumina), pyrosequencing (454 Life Sciences), ion semiconductor technology
(Ion Torrent
sequencing), single-molecule real-time sequencing (Pacific Biosciences),
sequencing by ligation
(SOLiD sequencing), nanopore sequencing (Oxford Nanopore Technologies), or
paired-end
sequencing. However, as the methods described herein can be performed using
other types of
biological information, e.g., cell-free or cellular genomic data,
transcriptomic data, epigenetic data,
metabolomic data, etc., other methods for extracting biological features can
also be contemplated
herein, e.g., hybridization, qPCR, mass spectroscopy, immuno-affinity based
detection methods, etc.
[0083] Although workflow 200 illustrates optional steps of collecting a
biological sample (e.g.,
obtaining a cfDNA sample 204) and biological feature extraction (e.g.,
generating cfDNA sequence
reads 206), in some embodiments the methods for determining the disease state
of a subject described
herein begin by obtaining previously extracted biological features (e.g.,
sequence reads), e.g., by
receiving the biological features (e.g., sequence reads) in electronic form,
e.g., over network 105.
[0084] Workflow 200 includes a step of generating (208) a biological feature
set, based on the
biological information collected at step 206. In some embodiments, as
illustrated in Figure 2, the
biological feature set includes genotypic features (e.g., genotypic data
constructs 122) acquired from
sequence reads of a cell-free nucleic acid (e.g., cfDNA) sample. Examples of
genotypic features useful
for the methods described herein include read counts (e.g., bin read counts
126) which provide
information about the relative abundance of particular sequences (e.g.,
genomic or exomic loci) in the
test biological sample, the presence of variant alleles (e.g., allele statuses
130) which provide
information about differences in the genome of the subject (e.g., in either or
both of the germline or a
diseased tissue) relative to a reference genome(s) for the species of the
subject, allele frequencies (e.g.,
allele fractions 134) which provide information about the relative abundance
of variant alleles, relative
to non-variant alleles, in the test biological sample, and methylation
statuses (e.g., CpG methylation
statuses 138) which provide information about the methylation states of
different genomic regions in
the test biological sample. The particular features included in, and the
formatting of, the data construct
can be dictated by the classifier used in step 210 of workflow 200.
[0085] Accordingly, the biological feature set (e.g., a genotypic data
construct 124) generated in step
208 can be applied (210) to a disease classifier (e.g., disease classification
model 140) to generate a
disease model score set (e.g., disease class model score set 146) for the
subject at the first time. For
24
CA 03158101 2022-5-11
WO 2021/108654
PCT/US2020/062350
instance, a probability that the subject has the disease condition (e.g.,
cancer, a particular type of
cancer, a cardiovascular disease, etc.) at the time the biological sample was
collected.
[0086] In some embodiments, as illustrated in workflow 200, the disease model
score is used to
initially classify (212) the subject as either having the disease state or not
having the disease state (e.g.,
having cancer or not having cancer, having cardiovascular disease or not
having cardiovascular
disease, etc.). When the disease model score set indicates the disease state
is present in the subject
(e.g., the subject has cancer, the subject has cardiovascular disease, etc.),
the subject can be classified
(214) as having the disease condition, and evaluation of changes in a disease
model score set for the
subject over time are not used, because the subject has already been
positively identified as having the
disease state. However, when the disease model score set indicates the disease
state is not present in
the subject (e.g., the subject does not have cancer, the subject does not have
cardiovascular disease,
etc.), the methods described herein can be useful for identifying subjects who
have the disease state, or
are developing the disease state, but in which the disease state has not yet
progressed sufficiently to
enable identification via the disease classifier. For instance, cancer
classifiers based on genotypic data
acquired from cell-free DNA can use a minimal tumor fraction, in order to have
enough signal to
confidently identify a cancer signature. Advantageously, the methods described
herein can be able to
identify changes in biological data that indicate early disease states, even
before the disease signal is
strong enough for confident identification using conventional classifiers,
e.g., that are based on data
acquired at a single time point.
[0087] When the disease model score set (e.g., disease class model score set
146 generated at step 210)
indicates the subject does not have the disease state, or indicates that the
subject cannot be positively
classified as having the disease state, the methods described herein can be
used to compare changes in
disease model score sets overtime, to further interrogate whether the subject
has a disease state that is
not discernible by the single-time point classifier. However, the methods
described herein can use
biological data acquired from the subject at at least two different time
points. Thus, when it is
determined (216) that the disease model score set generated at step 210 of
workflow 200 is the first
such disease model score generated for the subject, biological data from
another sample, acquired at a
second time, can be used, as indicated by the arrow back to collection step
202 in Figure 2.
100881 In some embodiments, although a second disease model score set may not
have been
previously generated using the same classifier as used in step 210, biological
data from the subject may
be available from a different test, e.g., that was previously used in a
different classifier. In some
CA 03158101 2022-5-11
WO 2021/108654
PCT/US2020/062350
embodiments, there may be substantial overlap in the biological data collected
for the two different
assay to allow both data sets to be evaluated using a common classifier, e.g.,
either of the two
classifiers previously used, or a third classifier that had not yet been
employed. In this fashion, disease
model scores can be generated for the subject at two different time points,
allowing for a comparison to
be performed, as described herein.
[0089] Accordingly, when one or more previously generated disease model score
sets are available for
the subject, e.g., generated using the same classifier, a different classifier
with a known
correspondence to the classifier used in step 210, or a classifier using
biological data having substantial
overlap with the biological data collected at step 202 to allow for generation
of disease model scores
for at least two time points, workflow 200 can proceed by determining a change
(218) in the disease
model score over time (e.g., delta score set 148 determined using disease
class evaluation module 140).
For instance, if a first disease model score set indicated a 12% chance of a
disease state in the subject
at a first time point and a second disease model score set indicated a 14%
chance of a disease state in
the subject at a second time point, a 2% change in the probability of the
subject having the disease state
occurred between the first and second time point. As described further below,
in some embodiments,
the change in disease model score over time is normalized or otherwise
adjusted (e.g. as a covariate)
for a parameter, such as the length of the period of time between the first
and second time points, or a
personal characteristic of the test subject (e.g., age, gender/biological sex,
ethnicity, smoking status,
familial history, etc.). The change in the disease model score over time
determined in step 218 can be
evaluated (220) against a model of change over time (e.g., using delta score
evaluation module 150).
[00901 In some embodiments, as described fttrther below in connection with
method 300, the model
includes a statistical test used to determine the probability of whether the
change in the subject's
disease model score over time (e.g., delta score set 148) belongs to a
distribution of changes in disease
model score over time determined from a population of reference subjects
(e.g., reference delta score
sets 152) that were classified as not having the disease state (or that could
not be positively classified
as having the disease state) using the same classifier as used in step 210 of
workflow 200. In some
embodiments, as described further below, this reference distribution is
normalized against one or more
parameters, such as the length of the period of time between the first and
second time points, or a
personal characteristic of the test subject (e.g., age, gender, ethnicity,
smoking status, familial history,
etc.), e.g., by application of one or more priors to the reference
distribution, prior to evaluation of the
test delta score set 148.
26
CA 03158101 2022-5-11
WO 2021/108654
PCT/US2020/062350
[0091] In other embodiments, as described further below in connection with
method 400, when more
than two delta score sets have been generated for the subject, that is the
subject has been tested for the
disease state at three or more points in time, the model includes application
of a temporal trend test to
all of the previous delta score sets 148 for the subject, to generate a test
temporal trend test statistic,
e.g., a measure of whether there is a statistically significant trend in the
change of the delta score sets
for the subject over time. The temporal trend test statistic for the subject
can be compared, e.g., using
a statistical hypothesis test, to a distribution of temporal trend test
statistics (e.g., reference statistics
154) from a population of reference subjects that were classified as not
having the disease state. In
some embodiments, as described further below, this reference distribution is
normalized against one or
more parameter, such as a personal characteristic of the test subject (e.g.,
age, gender, ethnicity,
smoking status, familial history, etc.), e.g., by application of one or more
priors to the reference
distribution, prior to evaluation of the test temporal trend test statistic.
[0092] Based on the comparison of the test value (e.g., the delta score set
148 or temporal trend test
statistic), the disease state of the subject can be classified. For instance,
in some embodiments, a
statistical hypothesis test is performed with a null hypothesis that the
subject's test value does not
belong to the distribution of reference test values. When the null hypothesis
is proved by the test, e.g.,
the test returns a statistically significant value satisfying a defined
threshold (e.g., 0.05, 0.01, or 0.005),
the subject can be classified as having the disease state. When the null
hypothesis is not proved by the
test, e.g., the test returns a statistically significant value that does not
satisfy a defined threshold (e.g.,
0.05, 0.01, or 0.005), the subject can be classified as not having the disease
state.
[0093] Having outlined a general workflow 200 for determining the disease
state of a subject based on
changes in biological characteristics of the subject over time, further
description of the processes and
features of the system, in accordance with various embodiments of the present
disclosure, are disclosed
below with reference to specific implementation methods 300 and 400, as
illustrated in Figures 3A-3G
and 4A-4F. In some embodiments, such processes and features of the system are
carried out by
modules 118, 140, and/or 150, as illustrated in Figure 1. Referring to these
methods, the systems
described herein (e.g., system 100) can include instructions for performing
the methods for
determining the disease state of a subject. These particular processes and
features for implementing
the methods described herein are not intended to be limiting, and alternative
processes and features can
be used for performing individual steps of the disclosed methods.
[0094] Disease States
27
CA 03158101 2022-5-11
WO 2021/108654
PCT/US2020/062350
[0095] Generally, the systems and methods described herein can be used to
increase the sensitivity and
specificity of diagnosing any disease state that is associated with the
development of a biological
disease signature. That is, any disease state that can be diagnosed based on
inspection of biological
features of a subject, e.g., genomic features, epigenetic features,
transcriptomic features, proteomic
features, metabolomics features, and the like.
[0096] In some embodiments, the disease state is one that can be diagnosed
based on genomic features
of cell-free DNA (cfDNA). cfDNA is a particularly useful source of biological
data for the methods
described herein, because it is readily obtained from various body fluids,
e.g., blood, plasma, serum,
urine, vaginal fluid, fluid from a hydrocele (e.g., of the testis), vaginal
flushing fluids, pleural fluid,
ascitic fluid, cerebrospinal fluid, saliva, sweat, tears, sputum,
bronchoalveolar lavage fluid, discharge
fluid from the nipple, aspiration fluid from different parts of the body
(e.g., thyroid, breast), etc.
Advantageously, use of bodily fluids can facilitate serial monitoring because
of the ease of collection,
as these fluids are collectable by non-invasive or minimally-invasive
methodologies. This can be in
contrast to methods that rely upon solid tissue samples, such as biopsies,
which often times use
invasive surgical procedures. Further, because bodily fluids such as blood
circulate throughout the
body, the cfDNA population can represents a sampling of many different tissue
types from many
different locations.
[0097] In some embodiments, the disease condition being tested for using the
systems and methods
described herein is a cancer condition (3026). For instance, methods for
classifying various cancer
conditions based on the evaluation of methylation patterns of cONA are
described in U.S. Patent
Application Publication No. 2019/0287652, the content of which is incorporated
herein by reference
for all purposes. Similarly, methods for classifying various cancer conditions
based on the evaluation
of relative genomic copy numbers in cfDNA are described in U.S. Patent
Application Publication No.
2019/0287649, the content of which is incorporated herein by reference for all
purposes. In some
embodiments, the cancer can be an adrenal cancer, a biliary track cancer, a
bladder cancer, a bone/bone
marrow cancer, a brain cancer, a cervical cancer, a colorectal cancer, a
cancer of the esophagus, a
gastric cancer, a head/neck cancer, a hepatobiliary cancer, a kidney cancer, a
liver cancer, a lung
cancer, an ovarian cancer, a pancreatic cancer, a pelvis cancer, a pleura
cancer, a prostate cancer, a
renal cancer, a skin cancer, a stomach cancer, a testis cancer, a thymus
cancer, a thyroid cancer, a
uterine cancer, a lymphoma, a melanoma, a multiple myeloma, or a leukemia.
28
CA 03158101 2022-5-11
WO 2021/108654
PCT/US2020/062350
100981 In some embodiments, the disease condition being tested for using the
systems and methods
described herein is a coronary disease (338). For instance, Zemmour H et al.,
Nat Commun.,
9(1):1443 (2018), the content of which is incorporated herein by reference,
identified genomic loci that
are differentially non-methylated in cardiornyocytes and demonstrated that
increases in these non-
methylated sequences could be detected in the plasma of patients with acute ST-
elevation myocardial
infarction. Similarly, Khush KK et al., Am J Transplant., 19(10):2889-99
(2019), the content of which
is incorporated herein by reference, demonstrated increases in donor-specific
cfDNA following heart
transplantation in samples classified as acute rejection Similar results can
be shown for kidney
transplant rejections.
[0099] In some embodiments, the disease condition is a type of disease
condition in a set of disease
conditions and the model provides a probability or likelihood for each disease
condition in the set
conditions (3028). For instance, in some embodiments, the systems and methods
described herein are
able to detect and/or discriminate between several related diseases. For
instance, diseases that present
with similar symptoms and/or similar biological signatures. Similarly, in some
embodiments, the
systems and methods described herein are able to detect and/or discriminate
between several different
stages of one or more disease. For instance, between an early stage of a
disease, a middle stage of a
disease, and/or a late stage of a disease. An example are the various cancer
stages, e.g., stages 0-IV.
[00100] In some embodiments, the set of disease conditions
includes a plurality of cancer
conditions (330). In some embodiments, the plurality of cancer conditions
includes an adrenal cancer,
a biliary track cancer, a bladder cancer, a bone/bone marrow cancer, a brain
cancer, a cervical cancer, a
colorectal cancer, a cancer of the esophagus, a gastric cancer, a head/neck
cancer, a hepatobiliary
cancer, a kidney cancer, a liver cancer, a lung cancer, an ovarian cancer, a
pancreatic cancer, a pelvis
cancer, a pleura cancer, a prostate cancer, a renal cancer, a skin cancer, a
stomach cancer, a testis
cancer, a thymus cancer, a thyroid cancer, a uterine cancer, a lymphoma, a
melanoma, a multiple
myeloma, or a leukemia.
[00101] Similarly, in some embodiments, the plurality of
cancer conditions includes a
predetermined stage of an adrenal cancer, a biliary track cancer, a bladder
cancer, a bone/bone marrow
cancer, a brain cancer, a cervical cancer, a colorectal cancer, a cancer of
the esophagus, a gastric
cancer, a head/neck cancer, a hepatobiliary cancer, a kidney cancer, a liver
cancer, a lung cancer, an
ovarian cancer, a pancreatic cancer, a pelvis cancer, a pleura cancer, a
prostate cancer, a renal cancer, a
29
CA 03158101 2022-5-11
WO 2021/108654
PCT/US2020/062350
skin cancer, a stomach cancer, a testis cancer, a thymus cancer, a thyroid
cancer, a uterine cancer, a
lymphoma, a melanoma, a multiple myeloma, or a leukemia.
[00102] In some embodiments, the disease condition is a
prognosis for a disease. For example,
a life expectancy without treatment, a life expectancy with treatment, or an
expected response to a
particular therapy. In some embodiments, the prognosis is a survival
statistic, e.g., a disease-specific
survival statistic (e.g., 1-year, 2-year, 5-year, 10-year, 20-year, or other
survival time), a relative
survival statistic (e.g., 1-year, 2-year, 5-year, 10-year, 20-year, or other
survival time), an overall
survival statistic (e.g., 1-year, 2-year, 5-year, 10-year, 20-year, or other
survival time), or a disease-free
survival statistic (e.g., 1-year, 2-year, 5-year, 10-year, 20-year, or other
recurrence-free or progression-
free survival time). In some embodiments, the prognosis is a predicted
response to a particular
therapeutic regimen. In some embodiments, the disease condition is a prognosis
for a cancer (332).
Accordingly, in some embodiments, the prognosis for the cancer is a prognosis
for a particular
treatment of the cancer (334). Similarly, in some embodiments, the prognosis
for the cancer is a
prognosis for cancer recurrence (336). In some embodiments, the disease
condition is a prognosis for a
coronary disease. In some embodiments, the disease condition is a prognosis
for a particular treatment
of a coronary disease.
[001031 Biological Sample Collection
[00104] As described herein, cfDNA can be a particularly
useful source of biological data for
the methods described herein, because it is readily obtained from various body
fluids.
Advantageously, use of bodily fluids can facilitate serial monitoring because
of the ease of collection,
as these fluids are collectable by non-invasive or minimally-invasive
methodologies. This can be in
contrast to methods that rely upon solid tissue samples, such as biopsies,
which often times use
invasive surgical procedures. Further, because bodily fluids, such as blood,
circulate throughout the
body, the cfDNA population can represent a sampling of many different tissue
types from many
different locations. Accordingly, in some embodiments, the biological samples
obtained from the
subject is selected from blood, plasma, serum, urine, vaginal fluid, fluid
from a hydrocele (e.g., of the
testis), vaginal flushing fluids, pleural fluid, ascitic fluid, cerebrospinal
fluid, saliva, sweat, tears,
sputum, bronchoalveolar lavage fluid, discharge fluid from the nipple,
aspiration fluid from different
parts of the body (e.g., thyroid, breast), etc.
CA 03158101 2022-5-11
WO 2021/108654
PCT/US2020/062350
1001051 In some embodiments, where the method includes
evaluation of biological features
(e.g., cfDNA) from two biological samples (e.g., as described below with
reference to method 300),
the first biological sample obtained from the test subject and the second
biological sample obtained
from the test subject independently include blood, whole blood, plasma, serum,
urine, cerebrospinal
fluid, fecal material, saliva, sweat, tears, pleural fluid, pericardial fluid,
or peritoneal fluid of the
subject. Similarly, in some embodiments where the method includes evaluation
of biological features
(e.g., cfDNA) from a series of more than two biological samples (e.g., as
described below with
reference to method 400), each of the samples obtained from the test subject
independently include
blood, whole blood, plasma, serum, urine, cerebrospinal fluid, fecal material,
saliva, sweat, tears,
pleural fluid, pericardial fluid, or peritoneal fluid of the subject.
[00106] In some embodiments, each sample in a series of
samples from a test subject is of the
same type. For instance, in some embodiments, where the method includes
evaluation of biological
features (e.g., cfDNA) from two biological samples (e.g., as described below
with reference to method
300), the first biological sample obtained from the test subject and the
second biological sample
obtained from the test subject are the same type of sample, selected from
blood, whole blood, plasma,
serum, urine, cerebrospinal fluid, fecal material, saliva, sweat, tears,
pleural fluid, pericardial fluid, and
peritoneal fluid of the subject. In some embodiments, the first biological
sample obtained from the test
subject and the second biological sample obtained from the test subject are
both blood samples. In
some embodiments, the first biological sample obtained from the test subject
and the second biological
sample obtained from the test subject are both blood plasma samples.
1001071 Similarly, in some embodiments where the method
includes evaluation of biological
features (e.g., cfDNA) from a series of more than two biological samples
(e.g., as described below with
reference to method 400), each of the samples obtained from the test subject
are the same type of
sample, selected from blood, whole blood, plasma, serum, urine, cerebrospinal
fluid, fecal material,
saliva, sweat, tears, pleural fluid, pericardial fluid, and peritoneal fluid
of the subject. In some
embodiments, each of the biological samples obtained from the test subject in
a series of biological
samples are blood samples. In some embodiments, each of the biological samples
obtained from the
test subject in a series of biological samples are blood plasma samples.
[00108] Obtaining Biological Characteristics
31
CA 03158101 2022-5-11
WO 2021/108654
PCT/US2020/062350
1001091 As outlined above with reference to step 202 of
workflow 200, in some embodiments,
the methods described herein (e.g., method 300 and/or method 400) include a
step of obtaining
biological characteristics from a biological sample obtained from the test
subject. For instance, in
some embodiments the biological characteristics used by method 300 are
sequence reads of cell-free
DNA from a liquid sample from the subject Accordingly, in some embodiments,
the method includes
one or both of obtaining a cfDNA sample from the subject and generating
sequence reads from the
cfDNA sample.
1001101 In some embodiments, e.g., as illustrated at step
206 of workflow 200, the biological
features used in conjunction with the systems and methods described herein are
genomic features
acquired from a liquid biological sample from a subject. Advantageously, cell-
free nucleic acids can
be obtained by a minimally-invasive, small-volume blood draw from the subject,
or possibly from non-
invasive sampling of other bodily fluids such as saliva or urine. As described
further below biological
features (e.g., one or more of read counts 126, allele statuses 130, allelic
fractions 134, and methylation
statuses 138) can be extracted from sequence reads of the cell-free DNA
present in liquid biological
samples.
1001111 Accordingly, in some embodiments, the biological
samples used in conjunction with the
methods described herein (e.g., methods 300 and 400) are liquid samples
containing any subset of the
human genome, including the whole genome. The sample may be extracted from a
subject known to
have or suspected of having cancer_ The sample may include blood, plasma,
serum, urine, fecal,
saliva, other types of bodily fluids, or any combination thereof In some
embodiments, methods for
drawing a blood sample (e.g., syringe or finger prick) may be less invasive
than procedures for
obtaining a tissue biopsy, which may use surgery. The extracted sample may
include cfDNA and/or
ctDNA. In some embodiments, the sample is enriched for particular regions
and/or loci of the genome,
e.g., using probe-based enrichment methods.
1001121 A sequencing library can then be prepared from the
sample, e.g., which may or may not
have been enriched for particular sequences. In some embodiments, during
library preparation, unique
molecular identifiers (UMIs) are added to the nucleic acid molecules (e.g.,
DNA molecules) through
adapter ligation. UMIs are short nucleic acid sequences (e.g., 4-10 base
pairs) that are added to ends of
DNA fragments during adapter ligation. In some embodiments, UMIs are
degenerate base pairs that
serve as a unique tag that can be used to identify sequence reads originating
from a specific DNA
fragment. In some embodiments, e.g., when multiplex sequencing can be used to
sequence cfDNA
32
CA 03158101 2022-5-11
WO 2021/108654
PCT/US2020/062350
from a plurality of subjects in a single sequencing reaction, a patient-
specific index is also added to the
nucleic acid molecules. In some embodiments, the patient specific index is a
short nucleic acid
sequence (e.g., 3-20 nucleotides) that are added to ends of DNA fragments
during library construction,
that serve as a unique tag that can be used to identify sequence reads
originating from a specific patient
sample. During PCR amplification following adapter ligation, the UMIs can be
replicated along with
the attached DNA fragment. This can provide a way to identify sequence reads
that came from the
same original fragment in downstream analysis.
1001131 In some embodiments, where the classification model
evaluates the methylation status
of one or more genomic locations, nucleic acids isolated from the biological
sample (e.g., cfDNA) are
treated to convert to convert unmethylated cytosines to uracils prior to
generating the sequencing
library. Accordingly, when the nucleic acids are sequenced, all cytosines
called in the sequencing
reaction can be methylated, since the unmethylated cytosines can be converted
to uracils and
accordingly would have been called as thymidines, rather than cytosines, in
the sequencing reaction.
Commercial kits can be available for bisulfite-mediated conversion of
methylated cytosines to uracils,
for instance, the EZ DNA MethylationTh-Gold, EZ DNA MethylationTm-Direct, and
EZ DNA
MethylationTm-Lightning kit (available from Zymo Research Corp (Irvine, CA)).
Commercial kits can
also be available for enzymatic conversion of methylated cytosines to uracils,
for example, the
APOBEC-Seq kit (available from NEBiolabs, Ipswich, MA).
1001141 Sequence reads can then be generated from the
sequencing library or pool of
sequencing libraries. Sequencing data may be acquired by known means in the
art. For example, next
generation sequencing (NGS) techniques such as sequencing-by-synthesis
technology (11lumina),
pyrosequencing (454 Life Sciences), ion semiconductor technology (Ion Torrent
sequencing), single-
molecule real-time sequencing (Pacific Biosciences), sequencing by ligation
(50LiD sequencing),
nanopore sequencing (Oxford Nanopore Technologies), or paired-end sequencing.
In some
embodiments, massively parallel sequencing is performed using sequencing-by-
synthesis with
reversible dye terminators.
1001151 The sequence reads can then be aligned to a
reference genome for the species of the
subject using known methods in the art to determine alignment position
information. Alignment
position may generally describe a beginning position and an end position of a
region in the reference
genome that corresponds to a beginning nucleotide based and an end nucleotide
base of a given
sequence read.
33
CA 03158101 2022-5-11
WO 2021/108654
PCT/US2020/062350
1001161 In some embodiments, the biological characteristics
used in the classifiers described
herein include one or more of genornic data, epigenetic data, transcriptomic
data, proteomic data,
metabolomics data, and the like. In fact, the particular source and type of
data may not be material to
the methods described herein, so long as it can be used to discriminate
between two or more disease
states in a subject.
1001171 Method 300
1001181 In one aspect, the disclosure provides a method 300
that uses a population distribution
to classify the disease state of a test subject based on changes in the
probability or likelihood that the
test subject has the disease state, as determined using a classifier trained
to distinguish the disease state
from one or more other disease states. Method 300 can relate directly to the
disease states and
methods for obtaining biological samples described above.
1001191 Referring generally to Figures 3A-3G, in some
embodiments, the method includes
determining a first genotypic data construct (e.g., genotypic data construct
124-1-1) for the test subject
(e.g., as outlined above with reference to step 208 of workflow 200). The
first genotypic data
construct can include values for a plurality of genotypic characteristics
(e.g., one or more of read
counts 126, allele statuses 130, allelic fractions 134, and methylation
statuses 138) based on a first
plurality of sequence reads, in electronic form (e.g., cfDNA sequence reads
generated at step 206 of
workflow 200), of a first plurality of nucleic acid molecules in a first
biological sample obtained from
the test subject at a first test time point (e.g., a sample obtained at step
204 of workflow 200). The
method can include inputting the first genotypic data construct into a model
(e.g., disease classification
model 142) for the disease condition (e.g., as outlined above with reference
to step 210 of workflow
200), thereby generating a first model score set for the disease condition
(e.g., disease class model
score set 146-1-1). The method can include determining a second genotypic data
construct (e.g.,
genotypic data construct 124-1-2) for the test subject (e.g., as outlined
above with reference to
repeating step 208 of workflow 200), the second genotypic data construct
including values for the
plurality of genotypic characteristics (e.g., the same one or more of read
counts 126, allele statuses
130, allelic fractions 134, and methylation statuses 138 as included in first
genotypic data construct
124-1-1) based on a second plurality of sequence reads, in electronic form
(e.g., cfDNA sequence
reads generated when step 206 of workflow 200 is repeated), of a second
plurality of nucleic acid
molecules in a second biological sample obtained from the test subject at a
second test time point
occurring after the first test time point (e.g., a sample obtained when step
204 of workflow 200 is
34
CA 03158101 2022-5-11
WO 2021/108654
PCT/US2020/062350
repeated). The method can include inputting the second genotypic data
construct into the model (e.g.,
the same disease classification model 142 as used for the first genotypic data
construct), thereby
generating a second model score set for the disease condition (e.g., disease
class model score set 146-
1-2). The method can include determining a test delta score set (e.g., delta
score set 148-1) based on a
difference between the first and second model score set (e.g., as outlined
above with reference to step
218 of workflow 200). Then the method can include evaluating the test delta
score set (e.g., as
outlined above with reference to step 220 of workflow 200) against a plurality
of reference delta score
sets (e.g., reference delta score sets 152), thereby determining the disease
condition of the test subject
(e.g., test subject classification 162), where each reference delta score set
(e.g., reference delta score
sets 154) in the plurality of reference delta scores sets is for a respective
reference subject in a plurality
of reference subjects.
[00120] Generating First Biological Feature Sets
[00121] As outlined above with reference to step 208 of
workflow 200, method 300 includes a
step of generating a biological feature set (e.g., genotypic data construct
124) from the biological
characteristics obtained from the biological sample. The particular features
included in, and the
formatting of, the biological feature set can be dictated by the classifier
used (e.g., disease
classification model 142) to determine an initial probability or likelihood
that a particular disease state
(e.g., cancer, a type of cancer, a cardiovascular disease, etc.). In some
embodiments, the classifier uses
genotypic features obtained from sequence reads acquired from a nucleic acid
containing sample from
the subject (e.g., a liquid sample containing cfDNA).
[00122] Accordingly, in some embodiments, the biological
feature set includes features
determined from a first plurality of nucleic acids in the first biological
sample obtained from the
subject. In some embodiments, the first plurality of nucleic acids include DNA
molecules (e.g.,
cfDNA or genomic DNA). In some embodiments, the first plurality of nucleic
acids include RNA
molecules (e.g., mRNA). In some embodiments, the first plurality of nucleic
acids include both DNA
and RNA molecules.
[00123] Accordingly, in some embodiments, method 300
includes determining (302) a first
genotypic data construct for the test subject. The first genotypic data
construct includes values for a
plurality of genotypic characteristics based on a first plurality of sequence
reads (e.g., sequence reads
obtained as described above with reference to step 206 illustrated in Figure
2), in electronic form, of a
CA 03158101 2022-5-11
WO 2021/108654
PCT/US2020/062350
first plurality of nucleic acid molecules in a first biological sample
obtained from the test subject at a
first test time point.
[00124] In some embodiments, the test subject is a human
(304). In some embodiments, the test
subject (e.g., a human) has not been diagnosed as having the disease condition
(306). For instance, the
methods described herein find utility in being able to identify a disease
state in a subject before a
biological signature for the disease reaches a level of detection (LOD) for a
conventional classifier.
Accordingly, in some embodiments, the subject has been tested for the disease
state multiple times,
and each time has been classified as not having the disease state.
[00125] In some embodiments (308), the genotypic
characteristics include any characteristics
including support for a single nucleotide variant at a genetic location (e.g.,
allele status 130), a
methylation status at a genetic location (e.g., regional methylation status
138), a relative copy number
for a genetic location (e.g., bin read count 126), an allelic ratio for a
genetic location (e.g., allelic
fraction 134), a fragment size metric of cell-free nucleic acid molecules, and
a mathematical
combination thereof.
[00126] Any methods for extracting genotypic features from
a plurality of electronic sequence
reads can be used. For instance, U.S_ Patent Application Publication No.
2019/0287652, the content of
which is incorporated herein by reference for all purposes, describes methods
for determining the
methylation status of a plurality of genomic locations. Similarly, U.S. Patent
Application Publication
No. 2019/0287649, the content of which is incorporated herein by reference for
all purposes, describes
methods for determining the relative copy number of a plurality of genomic
locations. Likewise,
methods for identifying single nucleotide variants and allele frequency of a
plurality of genomic
locations using next generation sequencing data is described, for instance, in
Nielsen K et al., PLoS
One, 7(7):e37558 (2012), the content of which is incorporated herein by
reference for all purposes.
1001271 In some embodiments, the plurality of genotypic
characteristics include a plurality of
relative copy numbers (e.g., bin read counts 126), where each respective
relative copy number in the
plurality of relative copy numbers corresponds to a different genetic location
in a plurality of genetic
locations (310). In some embodiments, the relative copy numbers represent the
relative abundance of
sequence reads from a plurality of genomic regions. In some embodiments, the
genomic regions have
the same size. In some embodiments, the genomic regions have different sizes.
36
CA 03158101 2022-5-11
WO 2021/108654
PCT/US2020/062350
1001281 In some embodiments, a genomic region is defined by
the number of nucleic acid
residues within the region. In some embodiments, a genomic region is defined
by its location and the
number of nucleic acids residues within the region. Any suitable size can be
used to define genomic
regions. For example, a genomic region can include 10 kb or fewer, 20 kb or
fewer, 30 kb or fewer, 40
kb or fewer, 50 kb or fewer, 60 kb or fewer, 70 kb or fewer, 80 kb or fewer,
90 kb or fewer, 100 kb or
fewer, 110 kb or fewer, 120 kb or fewer, 130 kb or fewer, 140 kb or fewer, 150
kb or fewer, 160 kb or
fewer, 170 kb or fewer, 180 kb or fewer, 190 kb or fewer, 200 kb or fewer, or
250 kb or fewer.
1001291 In some embodiments, genomic regions are defined by
dividing a reference genome for
the species of the subject into a plurality of segments (i.e., the genomic
regions). For instance, in
certain embodiments, a reference genome is divided into up to 1,000 regions,
2,000 regions, 4,000
regions, 6,000 regions, 8,000 regions, 10,000 regions, 12,000 regions, 14,000
regions, 16,000 regions,
18,000 regions, 20,000 regions, 22,000 regions, 24,000 regions, 26,000
regions, 28,000 regions,
30,000 regions, 32,000 regions, 34,000 regions, 36,000 regions, 38,000
regions, 40,000 regions,
42,000 regions, 44,000 regions, 46,000 regions, 48,000 regions, 50,000
regions, 55,000 regions,
60,000 regions, 65,000 regions, 70,000 regions, 80,000 regions, 90,000
regions, or up to 100,000
regions. In some embodiments, sequence reads of a subject can be normalized to
the average read
count across all chromosomal regions for the subject, e.g., as described in
U.S. Patent Application
Publication No. 2019/0287649, the content of which is incorporated herein by
reference, for all
purposes.
1001301 In some embodiments, the copy number data is
further normalized, e.g., to reduce or
eliminate variance in the sequencing data caused by potential confounding
factors. In some
embodiments, the normalizing involves one or more of centering on a measure of
central tendency
within the sample, centering on data from a reference sample or cohort,
normalization for GC content,
and principal component analysis (PCA) correction. Additionally or
alternatively, the normalization
may include B-score processing, as described in U.S. Patent Application
Publication No.
2019/0287649.
1001311 In some embodiments, the plurality of genotypic
characteristics includes a plurality of
methylation statuses (e.g., regional methylation statuses 138), where each
methylation status in the
plurality of methylation statuses corresponds to a different genetic location
in a plurality of genetic
locations (312). In some embodiments, each methylation status is represented
by a methylation state
vector as described, for example, in U.S. Provisional Patent Application No.
62/642,480, entitled
37
CA 03158101 2022-5-11
WO 2021/108654
PCT/US2020/062350
"Methylation Fragment Anomaly Detection," filed March 13, 2018, which is
hereby incorporated by
reference herein in its entirety. In some embodiments, the methylation state
vectors undergo p-value
filtration and classification, as described in United States Patent
Publication No. US 2019-0287652 Al,
the content of which is incorporated herein by reference.
[00132] In some embodiments, the plurality of methylation
statuses are obtained by a whole
genome bisulfite sequencing (WGBS). In some embodiments, the plurality of
methylation statuses is
obtained by a targeted DNA methylation sequencing using a plurality of probes.
In some
embodiments, the plurality of probes hybridize to at least 100 loci in the
human genome. In other
embodiments, the plurality of probes hybridize to at least 250, 500, 750,
1000, 2500, 5000, 10,000,
25,000, 50,000, 100,000, or more loci in the human genome. Methods for
identifying informative
methylation loci for classifying a disease condition (e.g., cancer) are
described, for instance, in US.
Patent Application Publication No. 2019/0287649.
[00133] In some embodiments, the targeted DNA methylation
sequencing detects one or more
5-methylcytosine (5mC) and/or 5-hydroxymethylcytosine (5hmC). In some
embodiments, the targeted
DNA methylation sequencing includes conversion of one or more unmethylated
cytosines or one or
more methylated cytosines to a corresponding one or more uracils. In some
embodiments, the targeted
DNA methylation sequencing includes conversion of one or more unmethylated
cytosines to a
corresponding one or more uracils, and the DNA methylation sequence reads out
the one or more
uracils as one or more corresponding thymines. In some embodiments, the
targeted DNA methylation
sequencing includes conversion of one or more methylated cytosines to a
corresponding one or more
uracils, and the DNA methylation sequence reads out the one or more 5mC and/or
5hmC as one or
more corresponding thymines. In some embodiments, the conversion of one or
more unmethylated
cytosines or one or more methylated cytosines includes a chemical conversion,
an enzymatic
conversion, or combinations thereof
[00134] Accordingly, in some embodiments, the plurality of
genotypic characteristics for the
first genotypic data structure (e.g., genotypic data construct 124-1-1)
includes a first plurality of bin
values (e.g., methylation statuses 138-1). Each respective bin value in the
first plurality of bin values
can represent a corresponding bin in a plurality of bins. Each respective bin
value in the first plurality
of bin values can be representative of a number of unique nucleic acid
fragments with a predetermined
methylation pattern identified using sequence reads in the first plurality of
sequence reads that map to
the corresponding bin in the plurality of bins. The plurality of genotypic
characteristics for the second
38
CA 03158101 2022-5-11
WO 2021/108654
PCT/US2020/062350
genotypic data structure (e.g., genotypic data construct 124-1-2) can include
a second plurality of bin
values (e.g., methylation statuses 138-1). Each respective bin value in the
second plurality of bin
values can represent a corresponding bin in the plurality of bins. Each
respective bin value in the
second plurality of bin values can be representative of a number of unique
nucleic acid fragments with
a predetermined methylation pattern identified using sequence reads in the
second plurality of
sequence reads that map to the corresponding bin in the plurality of bins.
Each bin in the plurality of
bins can represent a non-overlapping region of a reference genome of a species
of the test subject.
1001351 In some embodiments, the methylation data is
normalized, e.g., to reduce or eliminate
variance in the sequencing data caused by potential confounding factors. In
some embodiments, the
normalizing involves one or more of centering on a measure of central tendency
within the sample,
centering on data from a reference sample or cohort, normalization for GC
content, and principal
component analysis (PCA) correction. Further description of normalization of
methylation data can be
found, for example, in U.S. Provisional Patent Application No. 62/642,480 and
U.S. Patent
Application Publication No. 2019/0287649.
1001361 In some embodiments, the methylation values are
centered on a measure of central
tendency within the sample. For example, in some embodiments, the normalizing
includes
determining a first measure of central tendency across the first plurality of
bin values (e.g., methylation
statuses 138-1 determined from a first biological sample from the subject
obtained at a first time) and
determining a second measure of central tendency across the second plurality
of bin values (e.g.,
methylation statuses 138-2 determined from a second biological sample from the
subject obtained at a
second time). Then, each respective bin value in the first plurality of bin
values (e.g., methylation
statuses 138-1) can be replaced with the respective bin value divided by the
first measure of central
tendency and, similarly, each respective bin value in the second plurality of
bin values (e.g.,
methylation statuses 138-1) with the respective bin value divided by the
second measure of central
tendency. In some embodiments, the first and second measures of central
tendency are selected from
an arithmetic mean, weighted mean, midrange, midhinge, trimean, Winsorized
mean, mean, or mode
across the corresponding plurality of bin values.
1001371 In some embodiments, the methylation values are
normalized to correct for GC bias.
For example, in some embodiments, the normalizing includes replacing each
respective bin value in
the first plurality of bin values (e.g., methylation statuses 138-1 determined
from a first biological
sample from the subject obtained at a first time) with the respective bin
value corrected for a respective
39
CA 03158101 2022-5-11
WO 2021/108654
PCT/US2020/062350
first GC bias in the first plurality of bin values, and replacing each
respective bin value in the second
plurality of bin values (e.g., methylation statuses 138-2 determined from a
second biological sample
from the subject obtained at a second time) with the respective bin value
corrected for a respective
second GC bias in the second plurality of bin values.
[00138] In some embodiments, the respective first GC bias
is defined by a first equation for a
curve or line fitted to a first plurality of two-dimensional points, where
each respective two-
dimensional point includes (i) a first value that is the respective GC content
of the corresponding
region of the reference genome represented by the respective bin in the first
plurality of bins (e.g.,
methylation statuses 138-1) corresponding to the respective two-dimensional
point and (ii) a second
value that is the bin value in the first plurality of bin values for the
respective bin. Then, the GC
correction for the respective bin, derived from the GC content of the
corresponding region of the
reference genome of the species represented by the respective bin and the
first equation, can be
subtracted from the respective bin value. Similarly, the respective second GC
bias can be defined by a
second equation for a curve or line fitted to a first plurality of two-
dimensional points, where each
respective two-dimensional point includes CO a third value that can be the
respective GC content of the
corresponding region of the reference genome represented by the respective bin
in the second plurality
of bins (e.g., methylation statuses 138-2) corresponding to the respective two-
dimensional point and
(ii) a fourth value that can be the bin value in the second plurality of bin
values for the respective bin.
Then, the GC correction for the respective bin, derived from the GC content of
the corresponding
region of the reference genome of the species represented by the respective
bin and the second
equation, can be subtracted from the respective bin value.
[00139] However, as described herein, in some embodiments,
a particular classification model
evaluates features other than genomie characteristics, e.g., instead of, or in
addition to, the genornie
characteristics described above. For instance, in some embodiments, the
classification model evaluates
epigenetic markers (epigenetics), gene expression profiling (transcriptomics),
protein expression or
activity profiling (proteomics), metabolic profiling (metabolomics), etc.
Accordingly, in some
embodiments, the biological feature sets formed include one or more of these
non-genomic biological
features.
[00140] Additionally, in some embodiments, the
classification model evaluates one or more
personal characteristics of the subject, e.g., gender, age, smoking status,
alcohol consumption, familial
CA 03158101 2022-5-11
WO 2021/108654
PCT/US2020/062350
history, etc., in addition to the biological features. Accordingly, in some
embodiments, the biological
feature sets formed includes one or more personal characteristics of the
subject.
1001411 Generating a First Disease Model Score Set
1001421 As outlined above with reference to step 210 of
workflow 200, method 300 includes
using the first biological feature set formed from the biological
characteristics obtained from the
sample of the subject to generate a first disease model score set.
Accordingly, in some embodiments,
method 300 includes inputting (314) the first genotypic data construct into a
model for the disease
condition, thereby generating a first model score set for the disease
condition. Generally, the identity
and type of disease model used by the systems and methods described herein is
immaterial.
1001431 Many different models that evaluate biological
features in order to classifying one or
more disease statuses (e.g., a cancer status, coronary disease status, etc.)
of a subject have been
developed. For instance, U.S. Patent Application Publication No. 2019/0287652
describes models that
evaluate the methylation status across a plurality of genomic loci, e.g.,
using cfDNA samples, in order
to classify a cancer status of a subject. Similarly, U.S. Patent Application
Publication No.
2019/0287649 describes models that evaluate the relative copy number across a
plurality of genomic
loci, e.g., using cfDNA samples, in order to classify a cancer status of a
subject. Likewise, various
models have been developed that evaluate the presence of variant alleles
(e.g., single nucleotide
variants, indels, deletions, transversions, translocations, etc.) in order to
classify a cancer status of a
subject. Other suitable models are disclosed in U.S. Patent Application No.
16/428,575 entitled
"Convolutional Neural Network Systems and Methods for Data Classification,"
filed May 31, 2019.
Generally, any model developed for the classification of a disease status of a
subject may be used in
conjunction with the systems and methods described herein.
1001441 In some embodiments, the model is for detecting the
presence of a disease state in a
subject, e.g., detecting cancer or coronary disease in a subject. That is, the
systems and methods
provided herein can be particularly well suited for improving upon the
sensitivity and specificity of
existing disease models, because they facilitate identity of changes in the
biological signature of a
subject over time, even when the biological signal is not yet strong enough
for the underlying model to
detect. Accordingly, in some embodiments, the model (e.g., the underlying
model used to evaluate a
genotypic data construct 124 at step 210 of workflow 200) evaluates data from
a single time point
(316). That can be samples that evaluate biological features acquired from a
single sample from the
41
CA 03158101 2022-5-11
WO 2021/108654
PCT/US2020/062350
subject, or from a plurality of samples acquired at a same or similar point in
time from the subject
(e g , samples providing different types of biological information, such as
genomic and transcriptomic
information).
1001451 Generally, many different classification algorithms
can find use in the systems and
methods described herein. For instance, in some embodiments, the model is a
neural network
algorithm, a support vector machine algorithm, a Naive Bayes algorithm, a
nearest neighbor algorithm,
a boosted trees algorithm, a random forest algorithm, a decision tree
algorithm, a multinomial logistic
regression algorithm, a linear model, or a linear regression algorithm (324).
Generally, the type of
classifier used to generate a disease model score set for one or more disease
states, using the systems
and methods described herein, can be immaterial. In some embodiments, model is
trained (322) on a
cohort of subjects in which a first portion of the cohort has the disease
condition and a second portion
of the cohort is free of the disease condition, e.g., such that it is
specifically trained to distinguish
between a first state corresponding to not having the disease condition and a
second state
corresponding to having the disease condition.
1001461 Neural networks. In some embodiments, the
classifier is a neural network or a
convolutional neural network. Neural networks can be machine learning
algorithms that may be
trained to map an input data set to an output data set, where the neural
network comprises an
interconnected group of nodes organized into multiple layers of nodes. For
example, the neural
network architecture may comprise at least an input layer, one or more hidden
layers, and an output
layer. The neural network may comprise any total number of layers, and any
number of hidden layers,
where the hidden layers function as trainable feature extractors that allow
mapping of a set of input
data to an output value or set of output values. As used herein, a deep
learning algorithm (DNN) can
be a neural network comprising a plurality of hidden layers, e.g., two or more
hidden layers. Each
layer of the neural network can comprise a number of nodes (or "neurons"). A
node can receive input
That comes either directly from the input data or the output of nodes in
previous layers, and perform a
specific operation, e.g., a summation operation. In some embodiments, a
connection from an input to a
node is associated with a weight (or weighting factor). In some embodiments,
the node may sum up
the products of all pairs of inputs, xi, and their associated weights. In some
embodiments, the weighted
sum is offset with a bias, b. In some embodiments, the output of a node or
neuron may be gated using
a threshold or activation function, f, which may be a linear or non-linear
function. The activation
function may be, for example, a rectified linear unit (ReLU) activation
function, a Leaky ReLu
42
CA 03158101 2022-5-11
WO 2021/108654
PCT/US2020/062350
activation function, or other function such as a saturating hyperbolic
tangent, identity, binary step,
logistic, arcTan, softsign, parametric rectified linear unit, exponential
linear unit, softPlus, bent
identity, softExponential, Sinusoid, Sine, Gaussian, or sigmoid function, or
any combination thereof.
[00147] The weighting factors, bias values, and threshold
values, or other computational
parameters of the neural network, may be "taught" or "learned" in a training
phase using one or more
sets of training data. For example, the parameters may be trained using the
input data from a training
data set and a gradient descent or backward propagation method so that the
output value(s) that the
ANN computes are consistent with the examples included in the training data
set. The parameters may
be obtained from a back propagation neural network training process.
[00148] Any of a variety of neural networks may be suitable
for use in analyzing product
development. Examples can include, but are not limited to, feedforward neural
networks, radial basis
function networks, recurrent neural networks, convolutional neural networks,
and the like. In some
embodiments, the machine learning makes use of a pre-trained ANN or deep
learning architecture.
Convolutional neural networks can be used for classifying methyl ation
patterns in accordance with the
present disclosure.
[00149] Support vector machines. In some embodiments, the
classifier is a support vector
machine (SVM). When used for classification, SVMs separate a given set of
binary labeled data with
a hyper-plane that is maximally distant from the labeled data For cases in
which no linear separation
is possible, Snits can work in combination with the technique of 'kernels',
which automatically
realizes a non-linear mapping to a feature space. The hyper-plane found by the
SVM in feature space
can correspond to a non-linear decision boundary in the input space.
[00150] Naive Bayes algorithms. Naive Bayes classifiers can
be a family of "probabilistic
classifiers" based on applying Bayes' theorem with strong (naive) independence
assumptions between
the features. In some embodiments, they are coupled with Kernel density
estimation. In some
embodiments, the classifier is a Naive Bayes algorithm.
1001511 Nearest neighbor algorithms. Nearest neighbor
classifiers can be memory-based and
include no classifier to be fit. Given a query point xo, the k training points
xo, k closest in
distance to xo can be identified and then the point xo is classified using the
k nearest neighbors. Ties
can be broken at random. In some embodiments, Euclidean distance in feature
space is used to
determine distance as:
43
CA 03158101 2022-5-11
WO 2021/108654
PCT/US2020/062350
d(i) = 11x(i) ¨ x(0)11
In some embodiments, when the nearest neighbor algorithm is used, the bin
values for the training set
can be standardized to have mean zero and variance 1. In some embodiments, the
nearest neighbor
analysis is refined to address issues of unequal class priors, differential
misclassification costs, and
feature selection. Many of these refinements can involve some form of weighted
voting for the
neighbors. In some embodiments, the classifier is a nearest neighbor
algorithm.
[00152] Random forest, decision tree, and boosted tree
algorithms. In some embodiments, the
classifier is a decision tree. Tree-based methods can partition the feature
space into a set of rectangles,
and then fit a model (like a constant) in each one. In some embodiments, the
decision tree is random
forest regression. One specific algorithm that can be used is a classification
and regression tree
(CART). Other specific decision tree algorithms include, but are not limited
to, ID3, C4.5, MART,
and Random Forests.
[00153] Regression. In some embodiment, a regression
algorithm is used as the classifier. A
regression algorithm can be any type of regression. For example, in some
embodiments, the regression
algorithm is logistic regression. In some embodiments, the regression
algorithm is logistic regression
with lasso, L2 or elastic net regularization. In some embodiments, those
extracted features that have a
corresponding regression coefficient that fails to satisfy a threshold value
are pruned (removed from)
consideration. In some embodiments, a generalization of the logistic
regression model that handles
multicategory responses is used as the classifier. In some embodiments, the
classifier makes use of a
regression model.
[00154] Linear discriminant analysis algorithms. Linear
discriminant analysis (LDA), normal
discriminant analysis (NDA), or discriminant function analysis can be a
generalization of Fisher's
linear discriminant, a method used in statistics, pattern recognition, and
machine learning to find a
linear combination of features that characterizes or separates two or more
classes of objects or events.
The resulting combination can be used as the classifier (linear classifier) in
some embodiments of the
present disclosure.
[00155] Mixture model. In some embodiments, the classifier
is a mixture model. See, for
example, United States Patent Publication No. US 2020-0365229 Al, which is
hereby incorporated by
reference.
44
CA 03158101 2022-5-11
WO 2021/108654
PCT/US2020/062350
[00156] Hidden Alarkov model. In some embodiments, in
particular, those embodiments
including a temporal component, the classifier is a hidden Markov model.
[00157] Gaussian process. In some embodiments, for
classification, the logit transformed
probability is modeled as a Gaussian process.
[00158] Penalized model. In some embodiments, temporal
information is used for penalties
when learning the weights for a model (e.g., a classifier). In this situation,
the temporal trend in cancer
probability can be smooth and penalties can be used to penalize for this
smoothness.
[00159] Clustering. In some embodiments, the classifier is
an unsupervised clustering model.
In some embodiments, the classifier is a supervised clustering model. The
clustering problem can be
described as one of finding natural groupings in a dataset. To identify
natural groupings, two issues
can be addressed. First, a way to measure similarity (or dissimilarity)
between two samples can be
determined. This metric (e.g., similarity measure) can be used to ensure that
the samples in one cluster
are more like one another than they are to samples in other clusters. Second,
a mechanism for
partitioning the data into clusters using the similarity measure can be
determined. One way to begin a
clustering investigation can be to define a distance function and to compute
the matrix of distances
between all pairs of samples in the training set. If distance is a good
measure of similarity, then the
distance between reference entities in the same cluster can be significantly
less than the distance
between the reference entities in different clusters_ However, clustering may
not use of a distance
metric. For example, a nonmetric similarity function s(x, x') can be used to
compare two vectors x and
x'. s(x, x') can be a symmetric function whose value is large when x and x'
are somehow "similar."
Once a method for measuring "similarity" or "dissimilarity" between points in
a dataset has been
selected, clustering can use a criterion function that measures the clustering
quality of any partition of
the data. Partitions of the data set that extremize the criterion function can
be used to cluster the data.
Particular exemplary clustering techniques that can be used in the present
disclosure can include, but
are not limited to, hierarchical clustering (agglomerative clustering using a
nearest-neighbor algorithm,
farthest-neighbor algorithm, the average linkage algorithm, the centroid
algorithm, or the sum-of-
squares algorithm), k-means clustering, fuzzy k-means clustering algorithm,
and Jarvis-Patrick
clustering. In some embodiments, the clustering comprises unsupervised
clustering (e.g., with no
preconceived number of clusters and/or no predetermination of cluster
assignments).
CA 03158101 2022-5-11
WO 2021/108654
PCT/US2020/062350
1001601 The A score classifier described herein can be a
classifier of tumor mutational burden
based on targeted sequencing analysis of nonsynonymous mutations. For example,
a classification
score (e.g., "A score") can be computed using logistic regression on tumor
mutational burden data,
where an estimate of tumor mutational burden for each individual is obtained
from the targeted cfDNA
assay. In some embodiments, a tumor mutational burden can be estimated as the
total number of
variants per individual that are: called as candidate variants in the cIDNA,
passed noise-modeling and
joint-calling, and/or found as nonsynonymous in any gene annotation
overlapping the variants. The
tumor mutational burden numbers of a training set can be fed into a penalized
logistic regression
classifier to determine cutoffs at which 95% specificity is achieved using
cross-validation
1001611 The B score classifier is described in United
States Patent Publication Number
62/642,461, filed 62/642,461, which is hereby incorporated by reference. In
accordance with the B
score method, a first set of sequence reads of nucleic acid samples from
healthy subjects in a reference
group of healthy subjects can be analyzed for regions of low variability.
Accordingly, each sequence
read in the first set of sequence reads of nucleic acid samples from each
healthy subject can be aligned
to a region in the reference genome. From this, a training set of sequence
reads from sequence reads of
nucleic acid samples from subjects in a training group can be selected. Each
sequence read in the
training set can align to a region in the regions of low variability in the
reference genome identified
from the reference set. The training set can include sequence reads of nucleic
acid samples from
healthy subjects as well as sequence reads of nucleic acid samples from
diseased subjects who are
known to have the cancer. The nucleic acid samples from the training group can
be of a type that is the
same as or similar to that of the nucleic acid samples from the reference
group of healthy subjects.
From this it can be determined, using quantities derived from sequence reads
of the training set, one or
more parameters that reflect differences between sequence reads of nucleic
acid samples from the
healthy subjects and sequence reads of nucleic acid samples from the diseased
subjects within the
training group. Then, a test set of sequence reads associated with nucleic
acid samples comprising
cfNA fragments from a test subject whose status with respect to the cancer is
unknown can be
received, and the likelihood of the test subject having the cancer can be
determined based on the one or
more parameters.
1001621 The M score classifier is described in United
States Patent Application No. 62/642,480,
entitled "Methylation Fragment Anomaly Detection," filed March 13, 2018, which
is hereby
incorporated by reference.
46
CA 03158101 2022-5-11
WO 2021/108654
PCT/US2020/062350
[00163] Ensembles of cictssifiers and boosting. In some
embodiments, an ensemble (two or
more) of classifiers is used. In some embodiments, a boosting technique such
as AdaBoost is used in
conjunction with many other types of learning algorithms to improve the
performance of the classifier.
In this approach, the output of any of the classifiers disclosed herein, or
their equivalents, can be
combined into a weighted sum that represents the final output of the boosted
classifier.
[00164] In some aspects, the disclosed methods can work in
conjunction with cancer
classification models. The cancer classification models can be any models
described elsewhere herein.
For example, a machine learning or deep learning model (e.g., a disease
classifier) can be used to
determine a disease state based on values of one or more features determined
from one or more cell-
free DNA molecules or sequence reads (e.g., derived from one or more cfDNA
molecules). In various
embodiments, the output of the machine learning or deep learning model is a
predictive score or
probability of a disease state (e.g., a predictive cancer score).
[00165] In some embodiments, the machine-learned model
includes a logistic regression
classifier. In other embodiments, the machine learning or deep learning model
can be one of a
decision tree, an ensemble (e.g., bagging, boosting, random forest), gradient
boosting machine, linear
regression, Naive Bayes, or a neural network. The disease state model can
include learned weights for
the features that are adjusted during training. The term "weights" is used
generically here to represent
the learned quantity associated with any given feature of a model, regardless
of which particular
machine learning technique is used. In some embodiments, a cancer indicator
score is determined by
inputting values for features derived from one or more DNA sequences (or DNA
sequence reads
thereof) into a machine learning or deep learning model.
[00166] During training, training data can be processed to
generate values for features that are
used to train the weights of the disease state model. As an example, training
data can include cfDNA
data, cancer gDNA, and/or WBC gDNA data obtained from training samples, as
well as an output
label. For example, the output label can be an indication as to whether the
individual is known to have
a specific disease (e.g., known to have cancer) or known to be healthy (i.e.,
devoid of a disease). In
other embodiments, the model can be used to determine a disease type, or
tissue of origin (e.g., cancer
tissue of origin), or an indication of a severity of the disease (e.g., cancer
stage) and generate an output
label therefor. Depending on the particular embodiment, the disease state
model can receive the values
for one or more of the features determine from a DNA assay used for detection
and quantification of a
cfDNA molecule or sequence derived therefrom, and computational analyses
relevant to the model to
47
CA 03158101 2022-5-11
WO 2021/108654
PCT/US2020/062350
be trained. In one embodiment, the one or more features comprise a quantity of
one or more cfDNA
molecules or sequence reads derived therefrom. Depending on the differences
between the scores
output by the model-in-training and the output labels of the training data,
the weights of the predictive
cancer model can be optimized to enable the disease state model to make more
accurate predictions. In
various embodiments, a disease state model may be a non-parametric model
(e.g., k-nearest neighbors)
and therefore, the predictive cancer model can be trained to make more
accurately make predictions
without having to optimize parameters.
1001671 The exact nature of the biological features
evaluated by a particular model (or at least as
far as they remain within the confines of the types of biological samples and
biological features
described herein), and the classification algorithm underlying the particular
model, can be generally
immaterial to the systems and methods described herein. In some embodiments
the output of the
model (e.g., disease class model score set 146, as described with respect to
step 210 in workflow 200)
is a set of continuous or semi-continuous sores. In this fashion, changes
occurring with the range of
the continuous or semi-continuous scores over time for a subject can be
identified (e.g., as delta score
set 148, as outlined above relative to step 218 in workflow 200) and evaluated
(e.g., against reference
delta score sets 154, as outlined above relative to step 200) to classify the
disease state of the subject.
Accordingly, in some embodiments, the model score set (e.g., first disease
class model score set 146-1
and second disease class model score set 146-2) of the model is a likelihood
or probability of having
the disease condition (318). Similarly, in some embodiments, the model score
set (e.g., first disease
class model score set 146-1 and second disease class model score set 146-2) of
the model is a
likelihood or probability of not having the disease condition (320). Thus, a
change in the likelihood or
probability of having/not having a disease state from a first time point to a
second time point can be
quantified as a difference in the continuous range of the output.
[00168] In some embodiments, e.g., when the disease class
evaluation model is a neural network
(e.g., a conventional or convolutional neural network), the output of a
disease classifier is a
classification, e.g., either cancer positive or cancer negative. However, in
some embodiments, in order
to provide a continuous or semi-continuous value for the output of the model,
rather than a
classification, a hidden layer of a neural network, e.g., the hidden layer
just prior to the output layer, is
used as the disease class model score set.
1001691 Accordingly, in some embodiments, the model
includes (376) (1) an input layer for
receiving values for the plurality of genotypic characteristics, where the
plurality of genotypic
48
CA 03158101 2022-5-11
WO 2021/108654
PCT/US2020/062350
characteristics includes a first number of dimensions, and (ii) an embedding
layer that includes a set of
weights, where the embedding layer directly or indirectly receives output of
the input layer, and where
an output of the embedding layer is a model score set having a second number
of dimensions that is
less than the first number of dimensions, and (iii) an output layer that
directly or indirectly receives the
model score set from the embedding layer. In such embodiments, the first model
score set is the model
score set of the embedding layer upon inputting the first genotypic data
construct into the input layer,
and the second model score set is the model score set of the embedding layer
upon inputting the second
genotypic data construct into the input layer. In other words, in some
embodiments, the model score
set is the output of a set of neurons associated with a hidden layer in a
neural network termed the
embedding layer. In such embodiments, each such neuron in the embedding layer
is associated with a
weight and an activation function and the model score set comprises the output
of each such activation
function. In some embodiments, the activation function of a neuron in the
embedding layer is rectified
linear unit (ReLLT), tanh, or sigmoid activation function. In some such
embodiments, the neurons of
the embedding layer are fully connected to each of the inputs of the input
layer. In some such
embodiments, each neuron of the output layer is fully connected to each neuron
of the embedding
layer. In some embodiments, each neuron of the output layer is associated with
a Softmax activation
function. In some embodiments, one or more of the embedding layer and the
output layer is not fully
connected.
[00170] In some embodiments, each weight in the set of
weights of the embedding layer
corresponds to a different neuron in a plurality of neurons in the embedding
layer. In some such
embodiments, the plurality of hidden neurons comprises between two and five
hundred, between three
and four hundred, between four and three hundred, between five and two
hundred, or between six and
one hundred neurons. In some embodiments, the plurality of hidden neurons
comprises between four
neurons and twenty-four neurons.
[00171] Generating a Second Disease Model Score Set
[00172] As described above with reference to workflow 200,
the systems and methods described
herein rely on a comparison of disease class model scores generated for two or
more biological feature
sets for the subject. Accordingly, as indicated in workflow 200, a second
iteration of biological sample
collection, biological feature set formation, and disease model score set
generation are performed.
Generally, the same biological features can be used to form the second
biological feature set, as well as
any subsequent biological feature sets used for analysis of a series of
samples. In some embodiments,
49
CA 03158101 2022-5-11
WO 2021/108654
PCT/US2020/062350
the biological feature sets include genomic features acquired from nucleic
acid samples from the
subject. However, as described herein, the systems and methods described
herein are not limited to
genomic features and may also include, for example, transcriptomic features,
epigenetic features,
proteomic features, metabolomic features, etc.
[00173] Accordingly, in some embodiments, method 300
includes determining (338) a second
genotypic data construct (e.g., genotypic data construct 124-2) for the test
subject. The second
genotypic data construct can include values for the plurality of genotypic
characteristics (e.g., the same
one or more of read counts 126, allele statuses 130, allelic fractions 134,
and methylation statuses 138
included in first genotypic data construct 124-1) based on a second plurality
of sequence reads, in
electronic form, of a second plurality of nucleic acid molecules in a second
biological sample obtained
from the test subject at a second test time point occurring after the first
test time point (e.g., as outlined
above with respect to a second iteration of step 208 or workflow 200).
[00174] In some embodiments, the second time point is at
least a month after the first time point.
In some embodiments, the second time point is at least three months after the
first time point. In some
embodiments, the second time point is at least 6 months after the first time
point. In some
embodiments, the second time point is at least 12 months after the first time
point. In yet other
embodiments, the second time point is at least 2 weeks, 3 weeks, 1 month, 2
months, 3 months, 4
months, 5 months, 6 months, 9 months, or 12 months after the first time point.
1001751 In some embodiments, the systems and methods
provided herein find use in a periodic
monitoring procedure. For example, in some embodiments, a subject provides a
biological sample,
such as a saliva sample, blood sample, or other liquid sample, on a routine
basis, e.g., monthly, which
is analyzed according to a method described herein to monitor for development
of a disease state in the
subject, e.g., cancer. In some embodiments, the subject provides a biological
sample about every three
months. In some embodiments, the subject provides a biological sample about
every six months. In
some embodiments, the subject provides a biological sample about annually. In
some embodiments,
the subject provides a biological sample about every two years.
[00176] In some embodiments, a model score (e.g., a first
model score) generated at a current
time point is used to determine a time span between the current time point and
subsequent time points
(e.g., six months from the current time point). For example, a subject
provides a biological sample,
such as a saliva sample, blood sample, or other liquid sample, which is
analyzed according to a method
CA 03158101 2022-5-11
WO 2021/108654
PCT/US2020/062350
described herein to infer a disease condition (e.g., cancer) in the subject.
In this situation, for the
model score that is close to but below a predetermined threshold, a more
frequent periodic monitoring
interval (e.g., every three months instead every year for other individuals)
can be used.
1001771 Accordingly, in some embodiments, the step of
inputting a first genotypic data construct
into a model for the disease condition, to generate a first model score set
for the disease condition, is
performed before a second biological sample is obtained from the test subject
(between the first and
second time points). In some such embodiments, the model score set is
evaluated to determine when a
follow-up screening should occur for the test subject. For instance, in some
embodiments, when the
model score set indicates that the subject has a low probability of developing
the disease condition
(e.g., cancer) within a period of time (e.g., 6 months, 12 months, 18 months,
24 months, 3 years, 4
years, 5 years, 10 years, 15 years, 20 years, or longer), the test subject is
provided with a
recommendation to repeat testing at a time point that is further away than a
recommendation provided
to a subject who's model score set indicates a higher probability of
developing the disease condition
within the period of time.
Accordingly, in one embodiment, the disclosure provides a method of
determining whether a test
subject has a disease condition that includes: (a) determining a first
genotypic data construct for the
test subject, the first genotypic data construct comprising values for a
plurality of genotypic
characteristics based on a first plurality of sequence reads, in electronic
form, of a first plurality of
nucleic acid molecules in a first biological sample obtained from the test
subject at a first test time
point; (b) inputting the first genotypic data construct into a model for the
disease condition, thereby
generating a first model score set for the disease condition; (c) evaluating
the first model score set to
determine a second time test time point, e.g., based upon a risk model for
development of the disease
condition over time; (d) determining a second genotypic data construct for the
test subject, the second
genotypic data construct comprising values for the plurality of genotypic
characteristics based on a
second plurality of sequence reads, in electronic form, of a second plurality
of nucleic acid molecules
in a second biological sample obtained from the test subject at the second
test time point occurring
after the first test time point; (e) inputting the second genotypic data
construct into the model, thereby
generating a second model score set for the disease condition; (f) determining
a test delta score set
based on a difference between the first and second model score set; and (g)
evaluating the test delta
score set against a plurality of reference delta score sets, thereby
determining whether the test subject
51
CA 03158101 2022-5-11
WO 2021/108654
PCT/US2020/062350
has the disease condition, wherein each reference delta score set in the
plurality of reference delta
scores sets is for a respective reference subject in a plurality of reference
subjects.
[00178] Accordingly, as outlined above with respect to a
second iteration of step 210 of
workflow 200, method 300 includes imputing (346) the second genotypic data
construct 124-2 into the
model (e.g., the same disease classification model 142 as used to evaluate the
first genotypic data
construct 124-1), to generate a second model score set for the disease
condition. The disease
classification model used to evaluate the second genotypic data structure may
vary slightly, e.g., as it
continues to be refined, from the disease classification model used to
evaluate the first genotypic data
structure. When a particular disease classification model has been refined, or
replaced by a different
(e.g., improved) disease classification model, that the first genotypic
construct, or a refined version of
the first genotypic data construct, can be evaluated by the refined or
replacing disease classification
model, such that the resulting first and second disease class model score sets
146-1-1 and 146-1-2 are
more comparable.
[00179] Determining a Test Delta Score Set
[00180] As outlined above with reference to step 218 of
workflow 200, method 300 includes a
step of evaluating a change in the disease model score set over time, e.g.,
between the first disease
model score set corresponding to the disease state of the subject at the first
time point and the second
disease model score set corresponding to the disease state of the subject at
the second time
Accordingly, method 300 includes determining (348) a test delta score set
(e.g., delta score set 148)
based on a difference between the first and second disease model score sets
(e.g., disease class model
score sets 146-1-1 and 146-1-2).
[00181] In some embodiments, the test delta score set is a
value or matrix of values
corresponding to the raw difference in the value(s) of the two disease model
score sets. In some
embodiments, the test delta score set is further normalized, prior to
evaluation against a distribution of
test delta score sets from a reference population. Examples of the types of
normalizations
contemplated are described in the following section.
[00182] Evaluating a Test Delta Score Set
[00183] As outlined above with reference to step 220 of
workflow 200, method 300 includes a
step of evaluating the change in the disease model score set over time (e.g.,
evaluating delta score set
148), e.g., to determine whether there is a significant change in the disease
model score set indicative
52
CA 03158101 2022-5-11
WO 2021/108654
PCT/US2020/062350
that the subject is afflicted with the disease state. That is, in some
embodiments, method 300 includes
a step of evaluating (360) the test delta score set (e.g., delta score set
148) against a plurality of
reference delta score sets (e.g., reference delta score sets 152), thereby
determining the disease
condition of the test subject. Each reference delta score set (e.g., reference
delta score set 154) in the
plurality of reference delta scores sets can be for a respective reference
subject in a plurality of
reference subjects.
[00184] Generally, referring to method 300, the systems and
methods described herein can
evaluate whether a change in the disease model score for the test subject over
time is significantly
different from the types of changes in disease model scores observed over time
for reference subjects
who do not have the disease state. If the change in the disease model score
for the test subject is
statistically similar to changes in disease model scores for those reference
subjects, than the test subject
can be confidently classified as not having the disease state. However, if the
change in the disease
model score for the test subject is different with statistical significance
(e.g., a p-value of 0.05, 0.01,
0.005, etc.), than changes in disease model scores for the reference subjects
that don't have the disease
condition, it can be inferred that the test subject has a different disease
state, that is, the subject likely
has the disease state or is developing the disease state. In some embodiments,
this comparison is made
by generating a distribution of changes in disease model scores for a
plurality of reference subjects
(e.g., a distribution of reference delta score sets 152) and asking, e.g.,
using a statistical hypothesis test,
whether the change in disease model score for the test subject (e.g., delta
score set 148) is a member of
that distribution (or in the case of a statistical hypothesis test, whether
the test delta score set is not a
member of that distribution via a null hypothesis).
[00185] Accordingly, in some embodiments, the first model
score set (e.g., disease class model
score set 146-1) includes a probability that the test subject has the disease
condition at the first test
time point and the second model score set (e.g., disease class model score set
146-1) includes a
probability that the test subject has the disease at the second test time
point (e.g., as determined using a
disease classification model 142). Accordingly, the test delta score set
(e.g., delta score set 148) can
include a change in the probability that the test subject has the disease
state at the second time point,
relative to their probability of having the disease state at the first time
point. The test delta score set
can be compared (362) to a distribution of the reference delta score sets
(e.g., reference delta score sets
146), where each reference delta score set (e.g., each reference delta score
set 154) in the plurality of
reference delta scores can be for a respective reference subject in the
plurality of reference subject
53
CA 03158101 2022-5-11
WO 2021/108654
PCT/US2020/062350
based on a difference between (i) a first probability that the respective
reference subject has the disease
condition provided by the model (e.g, the same disease class evaluation model
as used to evaluate the
biological features of the test subject) using a first respective reference
genotypic data construct
including values for the plurality of genotypic features (e.g., the same
genotypic features as used for
the test subject), taken using a first respective biological sample acquired
at a respective first time
point from the respective reference subject, and (ii) a second probability
that the respective reference
subject has the disease condition provided by the model using a second
respective genotypic data
construct including values for the plurality of genotypic features, taken
using a second respective
biological sample acquired from the respective reference subject at a
respective second time point
occurring after the first respective time point, and wherein the respective
training subject is free of the
disease condition during at least the first and second respective time points.
[00186] In some aspects, the present disclosure is based
on, at least in part, the recognition that
accounting for personal characteristics of the test subject can improve the
sensitivity and specificity of
methods for classifying a disease state in the test subject. That is, because
personal characteristics of
the test subject affect the manifestation of the disease state biological
signature of the test subject As
such, accounting for one or more of these personal characteristics of the test
subject can further
improve the sensitivity and specificity of the disease state classification.
For instance, the magnitude
of the change between the first disease class model score set and the second
disease class model score
set, as well as the significance of the change, can be affected by at least
(i) changes in the disease state
of the test subject, e.g., development and progression of the disease state
can increase the magnitude of
the disease class model score set while regression of the disease state can
decrease the magnitude of
the disease class model score set, (ii) background variance in the biological
characteristics that
constitute the disease state signature of the subject, (iii) personal
characteristics of the test subject, e.g.,
age, gender, ethnicity, smoking status, alcohol consumption, familial history,
etc., and (iv) the length
of time between the first time point (e.g., the time at which the first
biological sample was obtained
from the test subject) and the second time point (e.g., the time at which the
second biological sample
was obtained from the test subject), e.g., a 10 percent increase in the
probability the subject has a
particular disease state is less significant if the length of time between
sample collection events is
twenty years than if the time between sample collection events is two months.
[00187] For instance, background variance refers to a
natural fluctuation in a biological property
of a subject, e.g., a genotypic characteristic such as methylation. For
instance, in some embodiments,
54
CA 03158101 2022-5-11
WO 2021/108654
PCT/US2020/062350
the methylation status of an individual's genome may fluctuate up or down from
a baseline state over
time in a fashion that is unrelated to a particular state of the individual,
such as a cancer status In this
fashion, a range for a value of a particular biological characteristic (such
as the methylation status of
one or more regions of the individual's genome) can be observed from a
plurality of samples collected
from the individual at different times, even when the individual's health
state (e.g., cancer status) does
not change. In some instances, the range in the value of the biological
characteristic for a first
individual can be different than the range of the value of the biological
characteristic for a second
individual, representing a different level of background variation in the
value of the biological
characteristic for the first and second individuals.
[00188] Accordingly, in some embodiments, one or more of
factors affecting the magnitude
and/or significance of the change between the first disease class model score
set and the second disease
class model set are accounted for when evaluating the test delta score set for
the test subject against the
distribution of reference delta score sets. In some embodiments, these
features are accounted for by
adjusting or normalizing either, or both, of the test delta score set and the
distribution of reference delta
score sets. In some embodiments, the adjustment or normalization is applied to
the test delta score set
and/or the reference delta score sets directly, e.g., each reference delta
score set is adjusted or
normalized independent of each other. In some embodiments, adjustment or
normalization is applied
to the reference delta score sets through the reference distribution, e.g.,
individual reference delta score
sets are adjusted or normalized as a function of the distribution, rather than
on an individualized basis.
In some embodiments, the underlying biological feature data, which is
evaluated by the disease
classification model, is adjusted or normalized.
[00189] In some embodiments, the length of time between
collection of the first and second
biological samples from the test subject and/or reference subject is used for
adjustment or
normalization, e.g., the test subject and/or reference subject biological
data, and/or the test subject
and/or reference subject delta score sets, and/or the distribution of
reference delta score sets are
adjusted or normalized to account for the time between test subject sample
collections.
[00190] Accordingly, in some embodiments, an amount of time
between the respective first time
point and the respective second time point for each respective reference
subject in the plurality of
reference subjects is used as a covariate (350) in calculating the
distribution (e.g., the distribution of
reference delta score sets 152). The test delta score set (e.g., delta score
set 148) can then be adjusted
based on the covariate representing a difference in time between the first
test time point and the second
CA 03158101 2022-5-11
WO 2021/108654
PCT/US2020/062350
test time point for the test subject. In some embodiments, the covariate
representing a difference in
time between the first test time point and the second test time point (es ,
the length of time between
test biological sample collection) is applied to one or more genotypic
characteristics in the plurality of
characteristics of the first genotypic data construct (e.g., genotypic data
construct 142-1-1), the second
genotypic data construct (e.g., genotypic data construct 142-1-1), each first
respective reference
genotypic data construct (e.g., reference genotypic data constructs
representing the first time point in
the generation of the reference delta score sets 152), or each second
respective reference genotypic
data construct (e g., reference genotypic data constructs representing the
second time point in the
generation of the reference delta score sets 152). In some embodiments, the
covariate representing a
difference in time between the first test time point and the second test time
point is applied to the test
delta score set (e.g., delta score set 148) and each reference delta score set
(e.g., reference delta score
sets 148) in the distribution of reference delta scores.
[00191] Similarly, in some embodiments, each respective
reference delta score set in the
plurality of reference delta scores sets is normalized for an amount of time
between the respective first
time point and the respective second time point for the respective subject,
and the test delta score set is
normalized for an amount of time between the first test time point and the
test second time point.
Likewise, in some embodiments, each respective reference delta score set in
the plurality of reference
delta score sets is normalized for an amount of time between the respective
first time point and the
respective second time point for the respective reference subject by
normalizing one or more genotypic
characteristics in the plurality of characteristics of each first respective
reference genotypic data
construct or each second respective reference genotypic data construct for an
amount of time between
the respective first time point and the respective second time point for the
respective subject. The test
delta score set can be normalized for an amount of time between the first test
time point and the test
second time point by normalizing one or more genotypic characteristics in the
first genotypic data
construct and the second genotypic data construct for an amount of time
between the first test time
point and the second test time point. In some embodiments, the normalizing is
applied to the test delta
score set and each reference delta score set in the distribution of the
reference delta score sets.
[00192] In some embodiments, the age of the test and/or
reference subject is used for adjustment
or normalization, e.g., the test subject and/or reference subject biological
data, and/or the test subject
and/or reference subject delta score sets, and/or the distribution of
reference delta score sets are
adjusted or normalized to account for the age of the test subject.
56
CA 03158101 2022-5-11
WO 2021/108654
PCT/US2020/062350
1001931 Accordingly, in some embodiments, an age of each
respective reference subject in the
plurality of reference subjects is used as a covariate (352) in calculating
the distribution (e.g., the
distribution of reference delta score sets 152). The test delta score set
(e.g., delta score set 148) can
then be adjusted based on an age of the test subject. In some embodiments, the
covariate representing
the age of the test subject is applied to one or more genotypic
characteristics in the plurality of
characteristics of the first genotypic data construct (e.g., genotypic data
construct 142-1-1), the second
genotypic data construct (e.g., genotypic data construct 142-1-1), each first
respective reference
genotypic data construct (e.g., reference genotypic data constructs
representing the first time point in
the generation of the reference delta score sets 152), or each second
respective reference genotypic
data construct (e.g., reference genotypic data constructs representing the
second time point in the
generation of the reference delta score sets 152), In some embodiments, the
covariate representing the
age of the test subject is applied to the test delta score set (e.g., delta
score set 148) and each reference
delta score set (e.g., reference delta score sets 148) in the distribution of
reference delta scores.
[00194] Similarly, in some embodiments, each respective
reference delta score set in the
plurality of reference delta score sets is normalized for an age of the
respective reference subject (e.g.,
age is used as a covariate), and the test delta score set is normalized for an
age of the test subject. Each
respective reference delta score set in the plurality of reference delta score
sets can be normalized for
an age of the respective reference subject by normalizing one or more
genotypic characteristics in the
plurality of characteristics of each first respective reference genotypic data
construct or each second
respective reference genotypic data construct for the age of the respective
subject, and the test delta
score set can be normalized for age of the test subject. In some embodiments,
the normalizing is
applied to the test delta score set and each reference delta score set in the
distribution of the reference
delta score sets.
[00195] In some embodiments, a smoking status or an alcohol
consumption characteristic of the
test and/or reference subject is used for adjustment or normalization, e.g.,
the test subject and/or
reference subject biological data, and/or the test subject and/or reference
subject delta score sets,
and/or the distribution of reference delta score sets are adjusted or
normalized to account for the
smoking status or alcohol consumption characteristic of the test subject.
1001961 Accordingly, in some embodiments, a smoking status
or an alcohol consumption
characteristic of each respective reference subject in the plurality of
reference subjects is used as a
covariate (354) in calculating the distribution (e.g., the distribution of
reference delta score sets 152).
57
CA 03158101 2022-5-11
WO 2021/108654
PCT/US2020/062350
The test delta score set (e.g., delta score set 148) can then be adjusted
based on a smoking status or an
alcohol consumption characteristic of the test subject. In some embodiments,
the covariate
representing the smoking status or alcohol consumption characteristic of the
test subject is applied to
one or more genotypic characteristics in the plurality of characteristics of
the first genotypic data
construct (e.g., genotypic data construct 142-1-1), the second genotypic data
construct (e.g., genotypic
data construct 142-1-1), each first respective reference genotypic data
construct (e.g., reference
genotypic data constructs representing the first time point in the generation
of the reference delta score
sets 152), or each second respective reference genotypic data construct (e.g.,
reference genotypic data
constructs representing the second time point in the generation of the
reference delta score sets 152).
In some embodiments, the covariate representing the smoking slams or alcohol
consumption
characteristic of the test subject is applied to the test delta score set
(e.g., delta score set 148) and each
reference delta score set (e.g., reference delta score sets 148) in the
distribution of reference delta
scores.
[00197] Similarly, in some embodiments, each respective
reference delta score set in the
plurality of reference delta score sets is normalized for a smoking status or
an alcohol consumption
characteristic of the respective reference subject, and the test delta score
set is normalized for a
smoking status or an alcohol consumption characteristic of the test subject.
Each respective reference
delta score set in the plurality of reference delta score sets can be
normalized for a smoking status or an
alcohol consumption characteristic of the respective reference subject by
normalizing one or more
genotypic characteristics in the plurality of characteristics of each first
respective reference genotypic
data construct or each second respective reference genotypic data construct
for the smoking status or
an alcohol consumption characteristic of the respective subject, and the test
delta score set can be
normalized for a smoking status or an alcohol consumption characteristic of
the test subject. In some
embodiments, the normalizing is applied to the test delta score set and each
reference delta score set in
the distribution of the reference delta score sets.
[00198] In some embodiments, a gender/biological sex of the
test and/or reference subject is
used for adjustment or normalization, e.g., the test subject and/or reference
subject biological data,
and/or the test subject and/or reference subject delta score sets, and/or the
distribution of reference
delta score sets are adjusted or normalized to account for the gender of the
test subject.
1001991 Accordingly, in some embodiments, a gender of each
respective reference subject in the
plurality of reference subjects is used as a covariate (354) in calculating
the distribution (e.g., the
58
CA 03158101 2022-5-11
WO 2021/108654
PCT/US2020/062350
distribution of reference delta score sets 152). The test delta score set
(e.g., delta score set 148) can
then be adjusted based on a gender of the test subject. In some embodiments,
the covariate
representing the gender of the test subject is applied to one or more
genotypic characteristics in the
plurality of characteristics of the first genotypic data construct (e.g.,
genotypic data construct 142-1-1),
the second genotypic data construct (e.g., genotypic data construct 142-1-1),
each first respective
reference genotypic data construct (e.g., reference genotypic data constructs
representing the first time
point in the generation of the reference delta score sets 152), or each second
respective reference
genotypic data construct (e.g., reference genotypic data constructs
representing the second time point
in the generation of the reference delta score sets 152). In some embodiments,
the covariate
representing the gender of the test subject is applied to the test delta score
set (e.g., delta score set 148)
and each reference delta score set (e.g., reference delta score sets 148) in
the distribution of reference
delta scores.
[00200] Similarly, in some embodiments, each respective
reference delta score set in the
plurality of reference delta score sets is normalized for a gender of the
respective reference subject, and
the test delta score set is normalized for a gender of the test subject. Each
respective reference delta
score set in the plurality of reference delta score sets can be normalized for
a gender of the respective
reference subject by normalizing one or more genotypic characteristics in the
plurality of
characteristics of each first respective reference genotypic data construct or
each second respective
reference genotypic data construct for the gender of the respective subject,
and the test delta score set
can be normalized for a gender of the test subject. In some embodiments, the
normalizing is applied to
the test delta score set and each reference delta score set in the
distribution of the reference delta score
sets.
1002011 In some embodiments, a background variance for a
biological characteristic of the test
and/or reference subject is used for adjustment or normalization, e.g., the
test subject and/or reference
subject biological data, and/or the test subject and/or reference subject
delta score sets, and/or the
distribution of reference delta score sets are adjusted or normalized to
account for a background
variance for a biological characteristic of the test subject. That is, the
amount of variance in the
measurement of any particular biological feature may vary from one individual
to the next.
Accordingly, in some embodiments, a relative level of background variance in
measured biological
characteristics is determined for the test subject, e.g., by collecting a
plurality of biological samples
from the subject at a plurality of different times, e.g., 2, 3, 4, 5, 6, 7, 8,
9, 10, or more biological
59
CA 03158101 2022-5-11
WO 2021/108654
PCT/US2020/062350
samples. In some embodiments, each sample is collected within 1 day of a
previous biological sample,
or within 2 days, 3 days, 4 days, 5 days, 6 days, 7 days, two weeks, three
weeks, or a month, of a
previous biological sample. The intent of collecting these samples may not be
to detect changes in the
levels of biological features that correlate with progression of the disease
state but, rather, to determine
the amount of variance in the measurements of biological features from the
test subject.
[00202] Accordingly, in some embodiments, a background
variance for a biological
characteristic of each respective reference subject in the plurality of
reference subjects is used as a
covariate (354) in calculating the distribution (e.g., the distribution of
reference delta score sets 152).
The test delta score set (e.g_, delta score set 148) can then be adjusted
based on a background variance
for a biological characteristic of the test subject. In some embodiments, the
covariate representing the
background variance for a biological characteristic of the test subject is
applied to one or more
genotypic characteristics in the plurality of characteristics of the first
genotypic data construct (e.g.,
genotypic data construct 142-1-1), the second genotypic data construct (e.g.,
genotypic data construct
142-1-1), each first respective reference genotypic data construct (e.g.,
reference genotypic data
constructs representing the first time point in the generation of the
reference delta score sets 152), or
each second respective reference genotypic data construct (e.g., reference
genotypic data constructs
representing the second time point in the generation of the reference delta
score sets 152). In some
embodiments, the covariate representing the background variance for a
biological characteristic of the
test subject is applied to the test delta score set (e.g., delta score set
148) and each reference delta score
set (e.g., reference delta score sets 148) in the distribution of reference
delta scores.
[002031 Similarly, in some embodiments, each respective
reference delta score set in the
plurality of reference delta score sets is normalized for a background
variance for a biological
characteristic of the respective reference subject, and the test delta score
set is normalized for a
background variance for a biological characteristic of the test subject. Each
respective reference delta
score set in the plurality of reference delta score sets can be normalized for
a background variance for a
biological characteristic of the respective reference subject by normalizing
one or more genotypic
characteristics in the plurality of characteristics of each first respective
reference genotypic data
construct or each second respective reference genotypic data construct for the
background variance for
a biological characteristic of the respective subject, and the test delta
score set can be normalized for a
background variance for a biological characteristic of the test subject. In
some embodiments, the
CA 03158101 2022-5-11
WO 2021/108654
PCT/US2020/062350
normalizing is applied to the test delta score set and each reference delta
score set in the distribution of
the reference delta score sets
[00204] In some embodiments, rather than adjusting or
normalizing a single distribution of
reference delta score sets, a segmented reference distribution is used in
which all of the reference
subjects are one of an enumerated class of individuals sharing one or more
personal characteristics
with the test subject. For example, in some embodiments, a reference
distribution is selected such that
all of the reference subjects used in the reference distribution have a
similar age as the test subject In
some embodiments, system 100 stores a plurality of segmented reference
distributions, or forms a
segmented reference distribution based on one or more personal attributes of
the test subject. In some
embodiments, each reference subject in a segmented distribution has an age,
gender, smoking status,
background variance in a biological characteristic, and/or alcohol consumption
characteristic that is
shared with the test subject. Accordingly, in some embodiments, the plurality
of reference subjects is
segmented for gender, age, smoking status, alcohol consumption, background
variance in a biological
characteristic, or a combination thereof (3074). For instance, a segmented
reference distribution can be
formed from the reference delta score sets 154 that share one or more
enumerated personal
characteristic with the test subject.
[00205] In some embodiments, to account for the variance of
biological characteristics in the
test subject, a plurality of baseline genotypic data constructs for the test
subject are determined (358).
Each respective baseline genotypic data construct in the plurality of baseline
genotypic data constructs
can include values for the plurality of genotypic characteristics (e.g., the
same one or more of read
counts 126, allele statuses 130, allelic fractions 134, and methylation
statuses 138 used to form the
genotypic data construct 124 and corresponding reference genotypic data
constructs) based on a
corresponding baseline plurality of sequence reads, in electronic form, of a
corresponding plurality of
nucleic acid molecules in a corresponding baseline biological sample, in a
plurality of baseline
biological samples, obtained from the test subject at a corresponding baseline
test time point occurring
before the second test time point (e.g., prior to obtaining the first
biological sample, or after obtaining
the first biological sample). In some embodiments, the first biological sample
is used as one of the
baseline biological samples for the test subject. Then, an amount of variance
in values for one or more
respective genotypic characteristic, in the plurality of genotypic
characteristics, between respective
baseline genotypic data constructs in the plurality of baseline genotypic
constructs can be used to
calculate a baseline variance covariate specific to the test subject. This
baseline covariate can be
61
CA 03158101 2022-5-11
WO 2021/108654
PCT/US2020/062350
applied to the distribution of the reference delta score sets, to normalize
the distribution of the
reference delta score sets against the baseline variability of the test
subject.
[00206] In some embodiments, the test delta score set
(e.g., test delta score set 148) is evaluated
by performing a statistical hypothesis test against a reference distribution
of delta score sets (e.g.,
reference delta score sets 152) from reference subjects that are not afflicted
with the disease state,
which may or may not be adjusted or normalized to account for a covariate. In
some embodiments, the
statistical hypothesis test provides a measure of statistical significance for
whether or not the test delta
score set is a member of the distribution of reference delta score sets. In
some embodiments, the
subject is deemed to be afflicted with the disease state when the statistical
hypothesis test provides a
one-tailed p-value that satisfies a threshold level of significance, e.g., p =
0.05, 0.1, 0.005, etc. In some
embodiments, the one-tailed test is used because negative changes in the
disease class model score set
indicate that the disease is regressing in the subject, rather than
progressing. Thus, outliers on the high
end of the distribution can be determined to have the disease state.
1002071 In a related methodology, in some embodiments, the
test delta score set (e.g., test delta
score set 148) is evaluated by determining whether the test delta score set
falls within a rejection
region of the reference distribution. For example, a rejection region of the
reference distribution of
delta score sets (e.g., reference delta score sets 152) can be defined by
selecting a significance level
(e.g., an alpha level setting an acceptable probability of an error supporting
the alternative
hypothesis¨that a subject does not have a disease condition¨when the null
hypothesis¨that the
subject does have the disease condition __________________ is true), and then
it is determined whether the test delta score
set (e.g., test delta score set 148) falls within the rejection region of the
reference distribution.
1002081 Accordingly, in some embodiments, the comparison
between the test delta score set and
the distribution of reference delta score sets includes determining (364) a
measure of central tendency
of the distribution (e.g., the distribution of reference delta score sets 152)
and a measure of spread of
the distribution. Then, the comparison can include determining a significance
of the test delta score set
using the measure of central tendency of the distribution and the measure of
spread of the distribution.
In some embodiments, the measure of central tendency of the distribution is an
arithmetic mean,
weighted mean, midrange, midhinge, trimean, Winsorized mean, mean, or mode
across the distribution
(366). In some embodiments, the measure of spread of the distribution is a
standard deviation, a
variance, or a range of the distribution (368),
62
CA 03158101 2022-5-11
WO 2021/108654
PCT/US2020/062350
1002091 In some embodiments, the measure of central
tendency of the distribution is the mean of
the distribution, the measure of spread of the distribution is the standard
deviation of the distribution,
and the determining the significance of the test delta score set using the
measure of central tendency of
the distribution and the measure of spread of the distribution comprises
determining a number of
standard deviations the test delta score set is from the mean of the
distribution (370). In some
embodiments, the test subject is determined to have the disease condition when
the number of standard
deviations the test delta score set from the mean of the distribution
satisfies a threshold value (372).
That is, it can be expected that the test subject does not have the disease
condition (e g., cancer or
coronary disease condition) if their delta score set is similar to those in
the distribution
1002101 In some embodiments, the reference distribution of
delta score sets (e.g., reference delta
score sets 152) is normalized to generate a normal distribution, at-
distribution, a chi-squared
distribution, an F-distribution, a lognormal distribution, a Weibull
distribution, an exponential
distribution, a uniform distribution, or any other normalized distribution.
1002111 In some embodiments, the test delta score set is
evaluated using a classifier trained
against the plurality of reference delta score sets, e.g., rather than by
statistical comparison to the
distribution of the reference delta score sets. For instance, in some
embodiments, the evaluating (378)
includes inputting the test delta score into a classifier trained against the
plurality of reference delta
score sets, where each reference delta score set in the plurality of reference
delta scores is for a
respective reference subject in the plurality of reference subject based on a
difference between (i) a
first probability that the respective reference subject has the disease
condition provided by the model
using a respective first reference genotypic data construct having values for
the plurality of genotypic
features, taken using a respective first biological sample acquired at a
respective first time point from
the respective reference subject, and (ii) a second probability that the
respective reference subject has
the disease condition provided by the model using a respective second
genotypic data construct having
values for the plurality of genotypic features, taken using a respective
second biological sample
acquired from the respective reference subject at a respective second time
point occurring after the
respective first time point, and wherein the respective training subject is
free of the disease condition
during at least the respective first and second time points.
1002121 In some embodiments, the classifier is further
trained on whether one or more of the
reference subjects later developed the disease condition (e.g., later
developed cancer). That is, in some
embodiments, each of a plurality of reference subjects are determined not to
have the disease condition
63
CA 03158101 2022-5-11
WO 2021/108654
PCT/US2020/062350
(e.g., cancer) at respective first and second time points, e.g., as determined
using a disease
classification model 142 that provides a disease class model score set 146
based on a genotypic data
construct 124 determined from a biological sample (e.g., a liquid biological
sample). The change in
the disease class model score sets over time, e.g., the delta score set 148,
is used as an independent
variable when training the classifier. Then, some or all of the reference
subjects can be further
evaluated for the disease condition at a third time point that is after the
first and second time point. In
some embodiments, the result of that later evaluation, e.g., whether or not
the reference subject later
developed the disease condition, is used as a dependent variable when training
the classifier. In this
fashion, particular changes in the disease class model score set 146 over time
can be better associated
with future outcomes and/or can be used to leverage earlier detection of the
disease condition.
Accordingly, in some embodiments, the classifier is further trained against,
for each respective training
subject in at least a subset of the plurality of reference subjects, a
determination of whether the
respective subject had the disease condition at a respective third time point
occurring after the
respective second time point.
[00213] As described herein with reference to other
embodiments, in some embodiments, the
amount of time between the respective first, second, and third time points, as
well as non-genotypic
characteristics of the reference subject, are used to normalize the data. That
is, these characteristics
can be used as co-variates when determining values for a genotypic data
construct, a disease class
model score set, or a delta score set, e.g., prior to training the classifier.
In some embodiments, one or
more of these characteristics are further used to train the classifier.
[00214] In some embodiments, the classifier is a neural
network algorithm, a support vector
machine algorithm, a Naive Bayes algorithm, a nearest neighbor algorithm, a
boosted trees algorithm,
a random forest algorithm, a decision tree algorithm, a multinomial logistic
regression algorithm, or a
linear regression algorithm, as described elsewhere herein.
[00215] In some embodiments, the test delta score set is
evaluated by logistic regression, rather
than statistics. For instance, in some embodiments, the evaluating (378)
includes evaluating the test
delta score set using a logistic function trained by logistic regression
against the plurality of reference
delta score sets.
[00216] In some embodiments, each reference delta score set
in the plurality of reference delta
scores is for a respective reference subject in the plurality of reference
subjects based on a difference
64
CA 03158101 2022-5-11
WO 2021/108654
PCT/US2020/062350
between: (i) a first score set provided by the embedding layer of the model
using a first respective
reference genotypic data construct comprising values for the plurality of
genotypic features, taken
using a first respective biological sample acquired at a respective first time
point from the respective
reference subject, and (ii) a second score set provided by the embedding layer
of the model using a
second respective genotypic data construct comprising values for the plurality
of genotypic features,
taken using a second respective biological sample acquired from the respective
reference subject at a
respective second time point other than the first respective time point. In
some embodiments, the
model is a convolutional neural network (380). In some embodiments, a first
subset of the plurality of
reference subjects have the disease condition and a second subset of the
plurality of reference subjects
do not have the disease condition (382). In some embodiments, each reference
subject in the plurality
of reference subjects does not have the disease condition (384).
[00217] In some embodiments, the logistic regression
further includes personal characteristics,
for example one or more of gender, age, smoking status, and alcohol
consumption, in order to account
for such characteristics, as described above for the statistical methods.
[00218] The regression algorithm can be any type of
regression. For example, in some
embodiments, the regression algorithm is logistic regression. In some
embodiments, the logistic
regression assumes:
P( exPO% + thxii+ = = =
+ AXik)
= xi)
1 + e x p (11 + flixii+ ...+ thcrik )1
where:
xi = (xii, xi2, xik) are the corresponding
biological feature values (e.g., one or more
of read counts 126, allele statuses 130, allelic fractions 134, and
methylation statuses 138), obtained
from biological samples for the jth corresponding training subject, where the
corresponding training
subject either has a first disease status (e.g., cancer condition or coronary
disease) (Y = 1) or a second
disease status (Y = 0);
Y E {0, 1} is a class label that has the value "1" when the corresponding
subject i has
the first disease status and has the value "0" when the corresponding subject
i has the second disease
status,
/30 is an intercept, and
CA 03158101 2022-5-11
WO 2021/108654
PCT/US2020/062350
= (j = 1, k) is a plurality of regression coefficients, where each respective
regression coefficient in the plurality of regression coefficients is for a
corresponding biological
feature value.
[00219] In some embodiments, the logistic regression is
logistic least absolute shrinkage and
selection operator (LASSO) regression. In such embodiments, the logistic LASSO
estimator flo, ...,
is defined as the minimizer of the negative log likelihood:
min(Er=i [¨yi(130 + + + flicrik) + log(1 +
exp(/30 + 131x1 + + 13krik))1) ,
subject to the constraint EIJC=1
A, where A is a constant
optimized for any given dataset.
[00220] In some embodiments, the regression algorithm is
logistic regression with lasso, L2 or
elastic net regularization.
[00221] As noted in the above equations, each xi = (xii,
Xj2, Xlic) are the
corresponding feature
values for the tili corresponding training subject and, as such, each xi,
represents a corresponding
biological feature. Moreover, each pi = (j = 1, ... k) is the regression
coefficient for a corresponding
biological feature. In some embodiments, those extracted features that have a
corresponding
regression coefficient that fails to satisfy a threshold value are pruned
(removed from) the plurality of
biological features. In some embodiments, this threshold value is zero. Thus,
in such embodiments,
those biological features that have a corresponding regression coefficient
that is zero from the above-
described regression are removed from the plurality of biological features
prior to training the
classifier. In some embodiments, for instance, in which L2 regularization is
employed, the threshold
value is 0.1. Thus, in such embodiments, those biological features that have a
corresponding
regression coefficient whose absolute value is less than 0.1 from the above-
described regression are
removed from the plurality of extracted features prior to training the
classifier. In some embodiments,
the threshold value is a value between 0.1 and 0.3. An example of such
embodiments is the case where
the threshold value is 0.2. In such embodiments, those extracted features that
have a corresponding
regression coefficient whose absolute value is less than 0.2 from the above-
described regression are
removed from the plurality of extracted features prior to training the
classifier.
[00222] Method 400
1002231 In one aspect, the disclosure provides a method 400
that uses a population distribution
to classify the disease state of a test subject based on changes in the
probability or likelihood that the
66
CA 03158101 2022-5-11
WO 2021/108654
PCT/US2020/062350
test subject has the disease state over a series of measurements, as
determined using a classifier trained
to distinguish the disease state from one or more other disease states. Method
400 relates directly to
the descriptions of disease states, methods for obtaining biological samples,
and methods for obtaining
biological features described above. Further, many of the features and
processes involved in method
400 can be the same as for method 300, described above. For brevity,
description of some of these
features is not repeated below. However, any of the features and processes
described above, e.g., with
reference to method 300, can also be applicable to method 400.
1002241 Referring generally to Figures 4A-4F, in some
embodiments, the method includes
determining, for each respective test time point in a plurality of test time
points, a corresponding
genotypic data construct (e.g., genotypic data constructs 124) for the test
subject (e.g., as outlined
above with reference to several iterations of step 208 of workflow 200) The
corresponding genotypic
data construct can include values for a plurality of genotypic characteristics
(e.g., one or more of read
counts 126, allele statuses 130, allelic fractions 134, and methylation
statuses 138) based on a
corresponding plurality of sequence reads, in electronic form (e.g., cfDNA
sequence reads generated at
corresponding iterations of step 206 of workflow 200), of a corresponding
plurality of nucleic acid
molecules in a corresponding biological sample obtained from the test subject
at the respective test
time point (e.g., a sample obtained at corresponding iterations of step 204 of
workflow 200). The
method can include inputting the corresponding genotypic data construct (e.g.,
of genotypic data
constructs 124) into a model (e.g., disease classification model 142) for the
disease condition to
generate a corresponding time stamped model score set (e.g., of disease class
model score sets 146-1)
for the disease condition at the respective test time point, thereby obtaining
a plurality of time stamped
test model score sets for the test subject (e.g., disease class model score
sets 146-1-1 through 146-1-N),
where each respective time stamped test model score set is coupled to a
different test time point in the
plurality of test time points (e.g., different iterations of the data
collection and analysis workflow). The
method can include fitting the plurality of time stamped test model score sets
with a temporal trend test
(e.g., as outlined above with reference to step 218 of workflow 200), thereby
obtaining a temporal test
trend parameter set for the test subject (e.g., temporal test trend parameter
149-1). The method can
include evaluating the test trend parameter set for the test subject (e.g., as
outlined above with
reference to step 220 of workflow 200) against a plurality of reference trend
parameter sets (e.g., as
analogized to reference delta score sets 152) for a plurality of reference
subjects thereby determining
the disease condition of the test subject (e.g., test subject classification
162), where each respective
67
CA 03158101 2022-5-11
WO 2021/108654
PCT/US2020/062350
reference trend parameter set in the plurality of reference trend parameter
sets is for a corresponding
reference subject in the plurality of reference subjects
[00225] Advantageously, by collecting a series of
biological samples for the test subject over
time, the personal variance in biological characteristics of the subject can
be better accounted for when
monitoring for a disease state. For instance, some subjects can inherently
demonstrate a greater
variance in biological characteristics. In these subjects, a small shift in a
determined probability that
the subject has a particular disease state can be less informative than in
subjects having less variance in
biological characteristics. That is, it is expected, when monitoring subjects
demonstrating higher
variance in biological characteristics for a disease condition over time, that
the probability of the
subject having the disease state can fluctuate more, e.g., both in the
positive and negative directions.
As such, a small increase in a determined probability that the subject has a
disease state can be likely
explained by the natural variance in their biological characteristics, rather
than by an underlying
biological response to development of the disease state. In contrast, a small
increase in a determined
probability that a subject having little variance in their biological
characteristics has a disease state can
be less likely to be explained by natural variance, and can be more likely
indicative of a biological
response associated with development of the disease state. Conventional
methods for classifying a
disease state in a subject cannot account for personal variance in a subject's
biological characteristics,
because they use data for a single time point. Advantageously, in some
embodiments, the systems and
methods described herein improve upon these convention methods for classifying
a disease state by
accounting for personal variance.
[00226] Accordingly, in some embodiments, method 400 uses
biological information from a
series of samples collected over a plurality of test time points. In some
embodiments, the plurality of
test time points is three or more time points (436). In some embodiments, the
plurality of test time
points is four or more time points. In some embodiments, the plurality of test
time points is ten or
more time points. In yet other embodiments, the plurality of test time points
is at least 3, 4, 5, 6, 7, 8,
9, 10, 15, 20, or more test time points.
[00227] In some embodiments, the plurality of test time
points span a period of months or years
(438). For instance, in some embodiments, the plurality of test time points
spans at least six months.
In some embodiments, the plurality of test time points spans at least a year.
In some embodiments, the
plurality of test time points spans at least five years. In yet other
embodiments, the plurality of test
time points spans at least 6 months, 7 months, 8 months, 9 months, 10 months,
11 months, 1 years, 2
68
CA 03158101 2022-5-11
WO 2021/108654
PCT/US2020/062350
years, 3 years, 4 years, 5 years, 6 years, 7 years, 8 years, 9 years, 10
years, 15 years, 20 years, or
longer.
[00228] In some embodiments, the plurality of test time
points form an unevenly spaced time
series (440). For instance, in some embodiments, biological samples are
collected from the subject
when they visit a medical facility (e.g., doctor's office, hospital, clinic,
medical laboratory, etc.), e.g.,
for an unrelated reason. In other embodiments, the plurality of test time
points form a more evenly
spaced time series. For instance, in some embodiments, biological samples are
collected from the
subject on a monthly, semi-annual, or annual basis, e.g., via regularly
scheduled visits to a medical
facility or by remote sample submission.
[00229] Generating Biological Feature Sets
[00230] As outlined above with reference to step 208 of
workflow 200, method 400 includes
steps of generating biological feature set (e.g., genotypic data construct
124) from biological
characteristics obtained from a plurality of biological samples, obtained over
a series of time from the
test subject. The particular features included in, and the formatting of, the
biological feature sets can
be dictated by the classifier used (e.g., disease classification model 142) to
determine an initial
probability or likelihood that a particular disease state (e.g., cancer, a
type of cancer, a cardiovascular
disease, etc.) In some embodiments, the classifier uses genotypic features
obtained from sequence
reads acquired from a nucleic acid containing sample from the subject (e.g., a
liquid sample containing
cfDNA),
[00231] Accordingly, in some embodiments, a respective
feature set includes features
determined from a respective plurality of nucleic acids in a respective
biological sample obtained from
the subject. In some embodiments, the respective plurality of nucleic acids
include DNA molecules
(e.g., cfDNA or genomic DNA). In some embodiments, the respective plurality of
nucleic acids
include RNA molecules (e.g., mRNA), In some embodiments, the respective
plurality of nucleic acids
include both DNA and RNA molecules.
[00232] Accordingly, in some embodiments, method 400
includes, for each respective test time
point (402) in a plurality of test time points, determining (404) a
corresponding genotypic data
construct for a test subject, the corresponding genotypic data construct
including values for a plurality
of genotypic characteristics based on a corresponding plurality of sequence
reads (e.g., sequence reads
obtained as described above with reference to step 206 illustrated in Figure
2), in electronic form, of a
69
CA 03158101 2022-5-11
WO 2021/108654
PCT/US2020/062350
corresponding plurality of nucleic acid molecules in a corresponding
biological sample obtained from
the test subject at the respective test time point
[00233] In some embodiments, the test subject is a human
(406). In some embodiments, the test
subject (e.g., a human) has not been diagnosed as having the disease condition
(408). For instance, in
some embodiments, the methods described herein find utility in being able to
identify a disease state in
a subject before a biological signature for the disease reaches a level of
detection (LOD) for a
conventional classifier. Accordingly, in some embodiments, the subject has
been tested for the disease
state multiple times, and each time has been classified as not having the
disease state.
[00234] In some embodiments (410), the plurality of
genotypic characteristics include one or
more characteristics including support for a single nucleotide variant at a
genetic location (e.g., allele
status 130), a methylation status at a genetic location (e.g., regional
methylation status 138), a relative
copy number for a genetic location (e.g., bin read count 126), an allelic
ratio for a genetic location
(e.g., allelic fraction 134), a fragment size metric of the cell-free nucleic
acid molecules, a methylation
pattern at a genetic location, and a mathematical combination thereof
[00235] In some embodiments, the plurality of genotypic
characteristics include a plurality of
relative copy numbers (e.g., bin read counts 126), where each respective
relative copy number in the
plurality of relative copy numbers corresponds to a different genetic location
in a plurality of genetic
locations (412) In some embodiments, the relative copy numbers represent the
relative abundance of
sequence reads from a plurality of genomic regions. In some embodiments, the
genomic regions have
the same size. In some embodiments, the genomic regions have different sizes.
As described above,
with reference to method 300, in some embodiments, the copy number data is
further normalized, e.g.,
to reduce or eliminate variance in the sequencing data caused by potential
confounding factors.
[00236] In some embodiments, the plurality of genotypic
characteristics includes a plurality of
methylation statuses (e.g., regional methylation statuses 138), where each
methylation status in the
plurality of methylation statuses corresponds to a different genetic location
in a plurality of genetic
locations (414). In some embodiments, each methylation status is represented
by a methylation state
vector as described, for example, in U.S. Provisional Patent Application No.
62/642,480, entitled
"Methylation Fragment Anomaly Detection," filed March 13, 2018, which is
hereby incorporated by
reference herein in its entirety. As described above, with reference to method
300, in some
CA 03158101 2022-5-11
WO 2021/108654
PCT/US2020/062350
embodiments, the methylation data is normalized, e.g., to reduce or eliminate
variance in the
sequencing data caused by potential confounding factors.
1002371 However, as described herein, in some embodiments,
a particular classification model
evaluates features other than genomic characteristics, e.g., instead of, or in
addition to, the genomic
characteristics described above. For instance, in some embodiments, the
classification model evaluates
epigenetic markers (epigenetics), gene expression profiling (transcriptomics),
protein expression or
activity profiling (proteomics), metabolic profiling (metabolomics), etc.
Accordingly, in some
embodiments, the biological feature sets formed include one or more of these
non-genomic biological
features.
1002381 Additionally, in some embodiments, the
classification model evaluates one or more
personal characteristics of the subject, e.g., gender, age, smoking status,
alcohol consumption, familial
history, etc., in addition to the biological features. Accordingly, in some
embodiments, the biological
feature sets formed includes one or more personal characteristics of the
subject.
1002391 Generating Disease Model Score Sets
1002401 As outlined above with reference to step 210 of
workflow 200, method 400 includes
using the biological feature set formed from the biological characteristics
obtained from the biological
samples of the subject over time to generate a series of disease model score
sets. Accordingly, in some
embodiments, method 400 includes, for each respective test time point in a
plurality of test time points,
inputting (416) the corresponding genotypic data construct (e.g., a genotypic
data construct 124) into a
model for a disease condition (e.g., disease classification model 142),
thereby generating a
corresponding time stamped model score set (e.g., a disease class model score
set 146) for the disease
condition at the respective test time point, thereby obtaining a plurality of
time stamped test model
score sets for the test subject. Each respective time stamped test model score
set can be coupled to a
different test time point in the plurality of test time points. Generally, the
identity and type of disease
model used by the systems and methods described herein can be immaterial.
1002411 Many different models that evaluate biological
features in order to classifying one or
more disease statuses (e.g., a cancer status, coronary disease status, etc.)
of a subject have been
developed. For instance, U.S. Patent Application Publication No. 2019/0287652
describes models that
evaluate the methylation status across a plurality of genomic loci, e.g.,
using cfDNA samples, in order
to classify a cancer status of a subject. Similarly, U.S. Patent Application
Publication No.
71
CA 03158101 2022-5-11
WO 2021/108654
PCT/US2020/062350
2019/0287649 describes models that evaluate the relative copy number across a
plurality of genomic
loci, e.g., using ctONA samples, in order to classify a cancer status of a
subject. Likewise, various
models have been developed that evaluate the presence of variant alleles
(e.g., single nucleotide
variants, indels, deletions, transversions, translocations, etc.) in order to
classify a cancer status of a
subject. Generally, any model developed for the classification of a disease
status of a subject may be
used in conjunction with the systems and methods described herein.
1002421 In some embodiments, the model is for detecting the
presence of a disease state in a
subject, e.g., detecting cancer or coronary disease in a subject. That is, the
systems and methods
provided herein are particularly well suited for improving upon the
sensitivity and specificity of
existing disease models, because they facilitate identity of changes in the
biological signature of a
subject over time, even when the biological signal is not yet strong enough
for the underlying model to
detect. Accordingly, in some embodiments, the model (e.g., the underlying
model used to evaluate a
genotypic data construct 124 at step 210 of workflow 200) evaluates data from
a single time point
That can be samples that evaluate biological features acquired from a single
sample from the subject,
or from a plurality of samples acquired at a same or similar point in time
from the subject (e.g.,
samples providing different types of biological information, such as genomic
and transcriptomic
information).
1002431 Generally, many different classification algorithms
can find use in the systems and
methods described herein. For instance, in some embodiments, the model is a
neural network
algorithm, a support vector machine algorithm, a Naive Bayes algorithm, a
nearest neighbor algorithm,
a boosted trees algorithm, a random forest algorithm, a decision tree
algorithm, a multinomial logistic
regression algorithm, a linear model, or a linear regression algorithm (434),
details of which are
described elsewhere herein. Generally, the type of classifier used to generate
a disease model score set
for one or more disease states, using the systems and methods described
herein, can be immaterial. In
some embodiments, the model is trained (432) on a cohort of subjects in which
a first portion of the
cohort has the disease condition and a second portion of the cohort is free of
the disease condition, e.g.,
such that it is specifically trained to distinguish between a first state
corresponding to not having the
disease condition and a second state corresponding to having the disease
condition.
1002441 In some aspects, the disclosed methods can work in
conjunction with cancer
classification models (418). For example, a machine learning or deep learning
model (e.g., a disease
classifier) can be used to determine a disease state based on values of one or
more features determined
72
CA 03158101 2022-5-11
WO 2021/108654
PCT/US2020/062350
from one or more cell-free DNA molecules or sequence reads (e.g., derived from
one or more cfDNA
molecules). In various embodiments, the output of the machine leaning or deep
learning model is a
predictive score or probability of a disease state (e.g., a predictive cancer
score).
[00245] In some embodiments, the machine-learned model
includes a logistic regression
classifier. In other embodiments, the machine learning or deep learning model
can be one of a
decision tree, an ensemble (e.g., bagging, boosting, random forest), gradient
boosting machine, linear
regression, Naive Bayes, or a neural network. The disease state model can
include learned weights for
the features that are adjusted during training. The term "weights" is used
generically here to represent
the learned quantity associated with any given feature of a model, regardless
of which particular
machine learning technique is used. In some embodiments, a cancer indicator
score is determined by
inputting values for features derived from one or more DNA sequences (or DNA
sequence reads
thereof) into a machine learning or deep learning model.
[00246] During training, training data can be processed to
generate values for features that are
used to train the weights of the disease state model. As an example, training
data can include cfDNA
data, cancer gDNA, and/or WBC gDNA data obtained from training samples, as
well as an output
label. For example, the output label can be an indication as to whether the
individual is known to have
a specific disease (e.g., known to have cancer) or known to be healthy (i.e.,
devoid of a disease). In
other embodiments, the model can be used to determine a disease type, or
tissue of origin (e.g., cancer
tissue of origin), or an indication of a severity of the disease (e.g., cancer
stage) and generate an output
label therefor. Depending on the particular embodiment, the disease state
model can receive the values
for one or more of the features determine from a DNA assay used for detection
and quantification of a
cfDNA molecule or sequence derived therefrom, and computational analyses
relevant to the model to
be trained. In one embodiment, the one or more features comprise a quantity of
one or more cfDNA
molecules or sequence reads derived therefrom. Depending on the differences
between the scores
output by the model-in-training and the output labels of the training data,
the weights of the predictive
cancer model can be optimized to enable the disease state model to make more
accurate predictions. In
various embodiments, a disease state model may be a non-parametric model
(e.g., k-nearest neighbors)
and therefore, the predictive cancer model can be trained to make more
accurately make predictions
without having to optimize parameters.
[00247] While the exact nature of the biological features
evaluated by a particular model (or at
least as far as they remain within the confines of the types of biological
samples and biological features
73
CA 03158101 2022-5-11
WO 2021/108654
PCT/US2020/062350
described herein), and the classification algorithm underlying the particular
model, can be generally
immaterial to the systems and methods described herein, in some embodiments
the output of the model
(e.g., disease class model score set 146, as described with respect to step
210 in workflow 200) can be
a set of continuous or semi-continuous scores. In this fashion, changes
occurring with the range of the
continuous or semi-continuous scores over time for a subject can be identified
(e.g., using trend test
parameter 149, as outlined above relative to step 218 in workflow 200) and
evaluated (e.g., against
reference trend test parameters, as outlined above relative to step 200) to
classify the disease state of
the subject. Accordingly, in some embodiments, the model score set (e.g.,
disease class model score
sets 146) of the model is a likelihood or probability of having the disease
condition (420). Similarly, in
some embodiments, the model score set (e.g., disease class model score sets
146) of the model is a
likelihood or probability of not having the disease condition. Thus, a change
in the likelihood or
probability of having/not having a disease state from a first time point to a
second time point can be
quantified as a difference in the continuous range of the output.
[00248] In some embodiments, e.g., when the disease class
evaluation model is a neural network
(e.g., a conventional or convolutional neural network), the output of a
disease classifier is a
classification, e.g., either cancer positive or cancer negative. However, in
some embodiments, in order
to provide a continuous or semi-continuous value for the output of the model,
rather than a
classification, a hidden layer of a neural network, e.g., the hidden layer
just prior to the output layer, is
used as the disease class model score set.
[00249] Accordingly, in some embodiments, the model
includes (i) an input layer for receiving
values for the plurality of genotypic characteristics, where the plurality of
genotypic characteristics
includes a first number of dimensions, and (ii) an embedding layer that
includes a set of weights,
where the embedding layer directly or indirectly receives output of the input
layer, and where an
output of the embedding layer is a model score set having a second number of
dimensions that is less
than the first number of dimension, and (iii) an output layer that directly or
indirectly receives the
model score set from the embedding layer, where the first model score set is
the model score set of the
embedding layer upon inputting the first genotypic data construct into the
input layer, and the second
model score set is the model score set of the embedding layer upon inputting
the second genotypic data
construct into the input layer.
[00250] Determining a Test Trend Parameter Set
74
CA 03158101 2022-5-11
WO 2021/108654
PCT/US2020/062350
1002511 As outlined above with reference to step 218 of
workflow 200, method 400 includes a
step of evaluating a change in the disease model score set over time, e.g.,
between the plurality of
disease model score sets (e.g., disease class model score sets 146-1-1 to 146-
1-N) corresponding to the
disease state of the subject at each time point in the plurality of test time
points in the series. In some
embodiments, the evaluation is made using a temporal trend test, for instance,
the Cochran-Armitage
trend test, the Mann-Kendall test, and the Mann-Whitney U Test.
1002521 For example, the Cochran-Annitage trend test
evaluates trends in binomial proportions
across the levels of a single variable. Briefly, variance Var(I) from the null
hypothesis (no
association) of the Cochran-Armitage trend statistic:
T Zr1ti(N11R2 ¨ NOD,
where k is the number of categories, ti are weights, Nici represents the ith
observation of the it category,
and Rk represents the sum of the i observations for the kth category, can be
calculated as:
V ar(T) = ¨ C1)
¨ 2 E15-1 EIC t=t=C=
1=1
j=e+1 L õI jC=
i=
1002531 The Mann-Kendall test can be a non-parametric trend
test used to identify monotonic
trends (one-way trends) in series data. Briefly, the Mann-Kendall test can
employ a Kendall rank
correlation of consecutive observations (e.g., the series of disease class
model score sets 146
determined for a plurality of time points) with time, to test for monotonic
trends. The null hypothesis
for the test can be that there are no trends. That is, the observations can be
independently distributed
with respect to the time series. Kendall's tau coefficient can be a statistic
used to measure the ordinal
association between two measured quantities, e.g., disease class model score
sets 146.
1002541 Accordingly, in some embodiments, method 400
includes fitting (446) the plurality of
time stamped test model score sets (e.g., disease class model score sets 146-1-
1 through 146-1-N for
the time series), with a temporal trend test (e.g., a Cochran-Armitage trend
test, a Mann-Kendall test, a
Mann-Whitney U Test, or by log-linear least squares fitting), thereby
obtaining a test trend parameter
set (e.g., temporal trend test parameter 149) for the test subject. In some
embodiments, fitting the time
stamped test model score sets is performed by log-linear least squares fitting
a plurality of time
stamped test model scores of the test subject to obtain the slope of the line
for the test subject.
1002551 In some embodiments, method 400 also includes
fitting a corresponding plurality of
reference time stamped time model score sets with the temporal trend test
(e.g., the same temporal
trend test used to fit the data for the test subject) thereby obtaining a
respective reference trend
CA 03158101 2022-5-11
WO 2021/108654
PCT/US2020/062350
parameter set in a distribution of a plurality of reference trend parameter
sets for corresponding
reference subject. In some embodiments, the temporal trend test is a Cochran-
Armitage trend test, a
Mann-Kendall test, a Mann-Whitney U Test, or by log-linear least squares
fitting. In some
embodiments, the fitting includes log-linear least squares fitting a
corresponding plurality of time
stamped time points of the corresponding reference subject to obtain the slope
of a line for the
corresponding reference subject.
1002561 Evaluating a Test Trend Parameter Set
1002571 As outlined above with reference to step 220 of
workflow 200, method 400 includes a
step of evaluating the change in the disease model score set over time (e.g.,
evaluating temporal trend
test parameter 149), e.g., to determine whether there is a significant change
in the disease model score
set indicative that the subject is afflicted with the disease state. That is,
method 400 can include a step
of evaluating (452) the test tend parameter set (e.g., temporal trend test
parameter 149) for the test
subject against a plurality of reference trend parameter sets for a plurality
of reference subjects (e.g.,
analogous reference trend test parameters to the reference delta score sets
154 as illustrated in Figure
1A), thereby determining the disease condition of the test subject, where each
respective reference
trend parameter set in the plurality of reference trend parameter sets is for
a corresponding reference
subject in the plurality of reference subjects.
1002581 Generally, referring to method 400, in some
embodiments the systems and methods
described herein evaluate whether a trend in the changes in the disease model
score for the test subject
over time is significantly different from the types of trends for changes in
disease model scores
observed over time for reference subjects who do not have the disease state.
If the trend for change in
the disease model score for the test subject is statistically similar to the
trend for changes in disease
model scores for those reference subjects, then the test subject can be
confidently classified as not
having the disease state. However, if the trend for change in the disease
model score for the test
subject is different with statistical significance (e.g., a p-value of 0.05,
0.01, 0.005, etc.), than the trend
for changes in disease model scores for the reference subjects that don't have
the disease condition, it
can be inferred that the test subject has a different disease state, that is,
the subject likely has the
disease state or is developing the disease state. In some embodiments, this
comparison is made by
generating a distribution of trend statistics for changes in disease model
scores for a plurality of
reference subjects (e.g., analogous to the distribution of reference delta
score sets 152, as discussed
above with reference to method 300) and asking, e.g., using a statistical
hypothesis test, whether the
76
CA 03158101 2022-5-11
WO 2021/108654
PCT/US2020/062350
trend for change in disease model score for the test subject (e.g., temporal
trend test parameter 149) is
a member of that distribution (or in the case of a statistical hypothesis
test, whether the trend test
parameter is not a member of that distribution via a null hypothesis).
1002591 In some embodiments, evaluation of the trend test
parameter is done using a parametric
statistical hypothesis test. In some embodiments, each timed stamped test
model score set in the
plurality of timed stamped test model score sets (e.g., disease class model
score sets 146-1-1 through
146-1-N for the test subject) includes a probability that the test subject has
the disease condition (e.g.,
cancer or a coronary disease) at the corresponding test time point (4054).
Accordingly, the trend test
parameter (e.g., temporal trend test parameter 149) can be a statistical
measure of whether a trend in
the time stamped test model sets exists. The test trend parameter set for the
test subject (e.g., temporal
trend test parameter 149) can be compared to a distribution formed from a
plurality of reference trend
parameter sets (e.g., analogous to a distribution of the reference delta score
sets 152 shown in
Figure 1A).
1002601 Each reference trend parameter set in the plurality
of reference trend parameter sets can
be for a corresponding reference subject in the plurality of reference
subject, and can be determined by,
for each respective corresponding reference time point in a corresponding
plurality of reference time
points associated with the corresponding reference subject, (i) determining a
corresponding genotypic
data construct for the reference subject, the corresponding genotypic data
construct including values
for the plurality of genotypic characteristics (e.g., the same genotypic
characteristics used to form
genotypic data constructs 124 for the test subject) based on a corresponding
plurality of sequence
reads, in electronic form, of a corresponding plurality of nucleic acid
molecules in a corresponding
biological sample obtained from the corresponding reference subject at the
corresponding time point,
and (ii) inputting the corresponding genotypic data construct into the model
(e.g., the same disease
classification model 142 as used to generate disease class model score sets
146 for the test subject), to
generate a corresponding reference time stamped model score set for the
disease condition at the
respective time point for the corresponding reference subject. Thereby, a
corresponding plurality of
reference time stamped model score sets for the corresponding reference
subject can be formed, where
each respective reference time stamped model score set for a different time
point in the corresponding
plurality of time points associated with the corresponding reference subject.
The corresponding
plurality of referenced time stamped time model score sets can then be fitted
with the temporal trend
test (e.g., the same temporal trend test used to fit the disease class model
score sets 146 of the test
77
CA 03158101 2022-5-11
WO 2021/108654
PCT/US2020/062350
subject), thereby obtaining the respective trend parameter in the distribution
of trend parameters for the
corresponding reference subject
[00261] Some aspects of the present disclosure can be based
on, at least in part, the recognition
that accounting for personal characteristics of the test subject can improve
the sensitivity and
specificity of methods for classifying a disease state in the test subject.
That is, because personal
characteristics of the test subject can affect the manifestation of the
disease state biological signature of
the test subject. As such, accounting for one or more of these personal
characteristics of the test
subject can further improve the sensitivity and specificity of the disease
state classification. For
instance, the magnitude of a change between consecutive disease class model
score sets in a series of
disease class model score sets, as well as the significance of the change, are
affected by at least (i)
changes in the disease state of the test subject, e.g., development and
progression of the disease state
can increase the magnitude of the disease class model score set while
regression of the disease state
can decrease the magnitude of the disease class model score set, (ii)
background variance in the
biological characteristics that constitute the disease state signature of the
subject, (iii) personal
characteristics of the test subject, e.g., age, gender, ethnicity, smoking
status, alcohol consumption,
familial history, etc., and (iv) the length of time between consecutive time
points. For example, a 10
percent increase in the probability the subject has a particular disease state
is less significant if the
length of time between sample collection events is twenty years than if the
time between sample
collection events is two months.
[00262] Accordingly, in some embodiments, one or more of
factors affecting the magnitude
and/or significance of the change between consecutive disease class model
score sets in a time series of
disease class model score sets are accounted for when evaluating the temporal
trend test parameter for
the test subject against the distribution of reference trend test parameters.
In some embodiments, these
features are accounted for by adjusting or normalizing either, or both, of the
trend test parameter and
the distribution of reference trend test parameters. In some embodiments, the
adjustment or
normalization is applied to the trend test parameter and/or the reference
trend test parameters directly,
e.g., each trend test parameter is adjusted or normalized independent of each
other. In some
embodiments, adjustment or normalization is applied to the reference trend
test parameters through the
reference distribution, e.g., individual reference trend test parameters are
adjusted or normalized as a
function of the distribution, rather than on an individualized basis. In some
embodiments, the
78
CA 03158101 2022-5-11
WO 2021/108654
PCT/US2020/062350
underlying biological feature data, which is evaluated by the disease
classification model, is adjusted
or normalized
[00263] In some embodiments, the length of time between
collection of consecutive biological
samples from the test subject and/or reference subject, e.g., an average
length of time between
collection of all the biological samples in the time series, is used for
adjustment or normalization, e.g.,
the test subject and/or reference subject biological data, and/or the test
subject and/or reference subject
trend test parameters, and/or the distribution of reference trend test
parameters are adjusted or
normalized to account for the time between biological sample collections.
[00264] Accordingly, in some embodiments, an amount of time
between consecutive time points
(e.g., an average length of time between biological sample collections in the
time series) for each
respective reference subject in the plurality of reference subjects is used as
a covariate in calculating
the distribution (e.g., the distribution of reference trend test parameters).
The trend test parameter
(e.g., trend test parameter 149) can then be adjusted based on the covariate
representing a difference in
time between consecutive test time points (e.g., an average length of time
between biological sample
collections from the test subject in the time series). In some embodiments,
the covariate representing a
difference in time between consecutive test time points is applied to one or
more genotypic
characteristics in the plurality of characteristics of either or both of the
genotypic data constructs (e.g.,
genotypic data constructs 142) corresponding to the consecutive time points,
for either or both of the
test subject or the reference subjects. In some embodiments, the covariate
representing a difference in
time between consecutive time points in a time series is applied to the trend
test parameter (e.g., trend
test parameter 149) and each reference trend test parameter in the
distribution of trend test parameters.
[00265] Similarly, in some embodiments, each respective
trend test parameter in the plurality of
reference trend test parameters is normalized for an amount of time between
consecutive time points in
a time series for the respective subject, and the test trend test parameter is
normalized for an amount of
time between consecutive time points in a time series for the test subject.
Likewise, in some
embodiments, each respective reference trend test parameter in the plurality
of reference trend test
parameters is normalized for an amount of time between consecutive time points
in a time series for
the respective reference subject by normalizing one or more genotypic
characteristics in the plurality of
characteristics of either or both of the respective reference genotypic data
construct corresponding to
the consecutive time points in the time series for the respective subject. The
test trend test parameter
can be normalized for an amount of time between consecutive test time points
in the time series for the
79
CA 03158101 2022-5-11
WO 2021/108654
PCT/US2020/062350
test subject by normalizing one or more genotypic characteristics in either or
both of the genotypic data
constructs corresponding to the consecutive time points in the time series for
the test subject. In some
embodiments, the normalizing is applied to the test trend test parameter and
each reference trend test
parameter in the distribution of the reference trend test parameters.
[00266] In some embodiments, the age of the test and/or
reference subject is used for adjustment
or normalization, e.g., the test subject and/or reference subject biological
data, and/or the test subject
and/or reference subject trend test parameters, and/or the distribution of
reference trend test parameters
are adjusted or normalized to account for the age of the test subject.
[00267] Accordingly, in some embodiments, an age of each
respective reference subject in the
plurality of reference subjects is used as a covariate (462) in calculating
the distribution (e.g., the
distribution of reference trend test parameters). The test trend test
parameter (e.g., trend test parameter
149) can then be adjusted based on an age of the test subject. In some
embodiments, the covariate
representing the age of the test subject is applied to one or more genotypic
characteristics in the
plurality of characteristics of one or more genotypic data construct (e.g.,
genotypic data construct 142)
in the plurality of genotypic data constructs for the test subject, and/or for
one or more genotypic data
construct in the plurality of genotypic data constructs for each respective
reference subject in the
plurality of reference subjects. In some embodiments, the covariate
representing the age of the test
subject is applied to the test trend test parameter (e.g., trend test
parameter 149) and each reference
trend test parameter in the distribution of reference trend test parameters.
[00268] Similarly, in some embodiments, each respective
reference trend test parameter in the
plurality of reference trend test parameters is normalized for an age of the
respective reference subject,
and the test trend test parameter is normalized for an age of the test
subject. Each respective reference
trend test parameter in the plurality of reference trend test parameters can
be normalized for an age of
the respective reference subject by normalizing one or more genotypic
characteristics in the plurality of
characteristics of each respective reference genotypic data construct for the
age of the respective
subject, and the test trend test parameter is normalized for age of the test
subject. In some
embodiments, the normalizing is applied to the test trend test parameter and
each reference trend test
parameter in the distribution of the reference trend test parameters.
[00269] In some embodiments, the smoking status or an
alcohol consumption characteristic of
the test and/or reference subject is used for adjustment or normalization,
e.g., the test subject and/or
CA 03158101 2022-5-11
WO 2021/108654
PCT/US2020/062350
reference subject biological data, and/or the test subject and/or reference
subject trend test parameters,
and/or the distribution of reference trend test parameters are adjusted or
normalized to account for the
smoking status or an alcohol consumption characteristic of the test subject.
[00270] Accordingly, in some embodiments, a smoking status
or an alcohol consumption
characteristic of each respective reference subject in the plurality of
reference subjects is used as a
covariate (464) in calculating the distribution (e.g., the distribution of
reference trend test parameters).
The test trend test parameter (e.g., trend test parameter 149) can then be
adjusted based on a smoking
status or an alcohol consumption characteristic of the test subject. In some
embodiments, the covari ate
representing the smoking status or an alcohol consumption characteristic of
the test subject is applied
to one or more genotypic characteristics in the plurality of characteristics
of one or more genotypic
data construct (e.g., genotypic data construct 142) in the plurality of
genotypic data constructs for the
test subject, and/or for one or more genotypic data construct in the plurality
of genotypic data
constructs for each respective reference subject in the plurality of reference
subjects. In some
embodiments, the emanate representing the smoking status or an alcohol
consumption characteristic
of the test subject is applied to the test trend test parameter (e.g., trend
test parameter 149) and each
reference trend test parameter in the distribution of reference trend test
parameters.
[00271] Similarly, in some embodiments, each respective
reference trend test parameter in the
plurality of reference trend test parameters is normalized for a smoking
status or an alcohol
consumption characteristic of the respective reference subject, and the test
trend test parameter is
normalized for a smoking status or an alcohol consumption characteristic of
the test subject. Each
respective reference trend test parameter in the plurality of reference trend
test parameters can be
normalized for a smoking status or an alcohol consumption characteristic of
the respective reference
subject by normalizing one or more genotypic characteristics in the plurality
of characteristics of each
respective reference genotypic data construct for the smoking status or an
alcohol consumption
characteristic of the respective subject, and the test trend test parameter is
normalized for the smoking
status or an alcohol consumption characteristic of the test subject. In some
embodiments, the
normalizing is applied to the test trend test parameter and each reference
trend test parameter in the
distribution of the reference trend test parameters.
[00272] In some embodiments, the gender of the test and/or
reference subject is used for
adjustment or normalization, e.g., the test subject and/or reference subject
biological data, and/or the
81
CA 03158101 2022-5-11
WO 2021/108654
PCT/US2020/062350
test subject and/or reference subject trend test parameters, and/or the
distribution of reference trend test
parameters are adjusted or normalized to account for the gender of the test
subject.
[00273] Accordingly, in some embodiments, a
gender/biological sex of each respective
reference subject in the plurality of reference subjects is used as a
covariate (466) in calculating the
distribution (e.g., the distribution of reference trend test parameters). The
test trend test parameter
(e.g., trend test parameter 149) can then be adjusted based on a gender of the
test subject. In some
embodiments, the covariate representing the gender of the test subject is
applied to one or more
genotypic characteristics in the plurality of characteristics of one or more
genotypic data construct
(e.g., genotypic data construct 142) in the plurality of genotypic data
constructs for the test subject,
and/or for one or more genotypic data construct in the plurality of genotypic
data constructs for each
respective reference subject in the plurality of reference subjects. In some
embodiments, the covariate
representing the gender of the test subject is applied to the test trend test
parameter (e.g., trend test
parameter 149) and each reference trend test parameter in the distribution of
reference trend test
parameters.
[00274] Similarly, in some embodiments, each respective
reference trend test parameter in the
plurality of reference trend test parameters is normalized for a gender of the
respective reference
subject, and the test trend test parameter is normalized for a gender of the
test subject. Each respective
reference trend test parameter in the plurality of reference trend test
parameters can be normalized for a
gender of the respective reference subject by normalizing one or more
genotypic characteristics in the
plurality of characteristics of each respective reference genotypic data
construct for the gender of the
respective subject, and the test trend test parameter is normalized for the
gender of the test subject. In
some embodiments, the normalizing is applied to the test trend test parameter
and each reference trend
test parameter in the distribution of the reference trend test parameters.
[00275] In some embodiments, rather than adjusting or
normalizing a single distribution of trend
test parameters, a segmented reference distribution is used in which all of
the reference subjects are
one of an enumerated class of individuals sharing one or more personal
characteristics with the test
subject. For example, in some embodiments, a reference distribution is
selected such that all of the
reference subjects used in the reference distribution have a similar age as
the test subject. In some
embodiments, system 100 stores a plurality of segmented reference
distributions, or forms a segmented
reference distribution based on one or more personal attributes of the test
subject. In some
embodiments, each reference subject in a segmented distribution has an age,
gender, smoking status,
82
CA 03158101 2022-5-11
WO 2021/108654
PCT/US2020/062350
and/or alcohol consumption characteristic that is shared with the test
subject. Accordingly, in some
embodiments, the plurality of reference subjects is segmented for gender, age,
smoking status, alcohol
consumption, background variance in a biological characteristic, or a
combination thereof (468). Such
segmented distribution can include information about dependency structure
among different
covariates. For instance, a segmented reference distribution is formed from
trend test parameters that
share one or more enumerated personal characteristic with the test subject. In
one example, a
segmented reference distribution can be formed from trend test parameters that
share the same gender,
age, and smoking status.
1002761 In some embodiments, the test trend test parameter
(e.g., trend test parameter 149) is
evaluated by performing a statistical hypothesis test against a reference
distribution of trend test
parameters from reference subjects that are not afflicted with the disease
state, which may or may not
be adjusted or normalized to account for a covariate. In some embodiments, the
statistical hypothesis
test provides a measure of statistical significance for whether or not the
test trend test parameter is a
member of the distribution of reference trend test parameters. In some
embodiments, the subject is
deemed to be afflicted with the disease state when the statistical hypothesis
test provides a p-value that
satisfies a threshold level of significance, e.g., p = 0.05, 0.1, 0.005, etc.
[00277] However, because p-values measure the aggregated
probability that a defined event
(e.g., the null hypothesis), or an occurrence more rare than the defined
event, a statistically significant
p-value cannot identify whether the defined event falls on one extreme or the
other extreme within the
distribution. Accordingly, in some embodiments, comparison of the test trend
test parameter and the
distribution of reference trend test parameters further uses inspection as to
which extreme the test trend
test parameter belongs. For instance, negative changes in the disease class
model score set can indicate
that the disease is regressing in the subject, rather than progressing.
1002781 In some embodiments, the comparison between the
test trend test parameter and the
distribution of reference trend test parameters includes determining (456) a
measure of central
tendency of the distribution and a measure of spread of the distribution.
Then, the comparison can
include determining a significance of the test trend test parameter using the
measure of central
tendency of the distribution and the measure of spread of the distribution. In
some embodiments, the
measure of central tendency of the distribution is an arithmetic mean,
weighted mean, midrange,
midhinge, trimean, Winsorized mean, mean, or mode across the distribution. In
some embodiments,
83
CA 03158101 2022-5-11
WO 2021/108654
PCT/US2020/062350
the measure of spread of the distribution is a standard deviation, a variance,
or a range of the
distribution
[00279] In some embodiments, the measure of central
tendency of the distribution is the mean of
the distribution, the measure of spread of the distribution is the standard
deviation of the distribution,
and the determining the significance of the test trend test parameter using
the measure of central
tendency of the distribution and the measure of spread of the distribution
comprises determining a
number of standard deviations the test trend test parameter is from the mean
of the distribution (458).
In some embodiments, the test subject is determined to have the disease
condition when the number of
standard deviations the test trend test parameter from the mean of the
distribution satisfies a threshold
value (460). That is, it can be expected that the test subject does not have
the disease condition (e.g.,
cancer or coronary disease condition) if their trend test parameter is similar
to those in the distribution_
[00280] In some embodiments, the test trend test parameter
is evaluated by logistic regression,
rather than statistics. For instance, in some embodiments, the evaluating
includes evaluating the test
trend test parameter using a logistic function trained by logistic regression
against the plurality of
reference trend test parameters. In some embodiments, each reference trend
parameter set in the
plurality of reference trend parameter sets is for a respective reference
subject in the plurality of
reference subjects based on a difference between (i) a first time stamped
model score set provided by
the embedding layer of the model using a first respective reference genotypic
data construct
comprising values for the plurality of genotypic features, taken using a first
respective biological
sample acquired at a respective first time point from the respective reference
subject, and (ii) a second
time stamped model score set provided by the embedding layer of the model
using a second respective
genotypic data construct comprising values for the plurality of genotypic
features, taken using a second
respective biological sample acquired from the respective reference subject at
a respective second time
point other than the first respective time point.
[00281] In some embodiments, the logistic regression
further includes personal characteristics,
for example one or more of gender, age, smoking status, and alcohol
consumption, in order to account
for such characteristics, as described above for the statistical methods.
[00282] The regression algorithm can be any type of
regression. For example, in some
embodiments, the regression algorithm is logistic regression. In some
embodiments, the logistic
regression assumes:
84
CA 03158101 2022-5-11
WO 2021/108654
PCT/US2020/062350
exPOqo + flixii+ = = = + Axik
P (xi) =
1 + exp (130 + /Axil+ + 13kxik ))
where:
Xi = xi2, xik) are the corresponding
biological feature values (e.g., one or more
of read counts 126, allele statuses 130, allelic fractions 134, and
methylation statuses 138), obtained
from biological samples for the Oh corresponding training subject, where the
ith corresponding training
subject either has a first disease status (e.g., cancer condition or coronary
disease) (Y = 1) or a second
disease status (Y = 0);
Y E {0, 1} is a class label that has the value "1" when the corresponding
subject i has
the first disease status and has the value "0" when the corresponding subject
i has the second disease
status,
flo is an intercept, and
= (j = 1, k) is a plurality of regression coefficients, where each respective
regression coefficient in the plurality of regression coefficients is for a
corresponding biological
feature value.
[00283] In some embodiments, the logistic regression is
logistic least absolute shrinkage and
selection operator (LASSO) regression. In some such embodiments, the logistic
LASSO estimator
/30, Pk is defined as the minimizer of the negative log likelihood:
[¨y(/Jo + fl1x1 + + igkxik) + log(1 + exp(flo + &xi + + flkxik))])
subject to the constraint Eit IPA
A, where A is a constant
optimized for any given dataset.
[00284] In some embodiments, the regression algorithm is
logistic regression with lasso, L2 or
elastic net regularization.
[00285] As noted in the above equations, each xi =
x12, xi') are the
corresponding feature
values for the th corresponding training subject and, as such, each xi,
represents a corresponding
biological feature. Moreover, each pi = (j = 1, k) is the regression
coefficient for a corresponding
biological feature. In some embodiments, those extracted features that have a
corresponding
regression coefficient that fails to satisfy a threshold value are pruned
(removed from) the plurality of
biological features. In some embodiments, this threshold value is zero. Thus,
in such embodiments,
those biological features that have a corresponding regression coefficient
that is zero from the above-
CA 03158101 2022-5-11
WO 2021/108654
PCT/US2020/062350
described regression are removed from the plurality of biological features
prior to training the
classifier. In some embodiments, for instance, in which L2 regularization is
employed, the threshold
value is 0.1. Thus, in such embodiments, those biological features that have a
corresponding
regression coefficient whose absolute value is less than 0.1 from the above-
described regression are
removed from the plurality of extracted features prior to training the
classifier. In some embodiments,
the threshold value is a value between 0.1 and 0.3. An example of such
embodiments is the case where
the threshold value is 0.2. In such embodiments, those extracted features that
have a corresponding
regression coefficient whose absolute value is less than 0.2 from the above-
described regression are
removed from the plurality of extracted features prior to training the
classifier.
1002861 Examples
10102871 The data used in the analyses presented in Examples
1 and 2 below was collected as
part of the CCGA clinical study. The CCGA [NCT02889978] is the largest study
of cfDNA-based
early cancer detection. This prospective, multi-center, observational study
has enrolled over 10,000
demographically-balanced participants across 141 sites, including healthy
individuals and cancer
patients across at least 20 tumor types and all clinical stages. All samples
were analyzed by: 1) Paired
cfDNA and white blood cell (WBC)-targeted sequencing (60,000X, 507 gene
panel), using a joint
caller to remove WBC-derived somatic variants and residual technical noise; 2)
Paired cfDNA and
WBC whole-genome sequencing (WGS) at approximately 35X sequence coverage; and
3) cfDNA
whole-genome bisulfite sequencing (WGBS) at approximately 34X sequence
coverage, using
abnormally methylated fragments to normalize scores.
1002881 Cell-free DNA was isolated from the collected blood
samples and then sequenced, as
described above, to provide the cfDNA sequencing data. Likewise, blood cells
were isolated using a
buffy coat separation method and genomic preparations from the white blood
cells were then
sequenced to provide a matching sequence reads of the loci of interest, e.g.,
for positive assignment of
sequence variants arising from clonal hematopoiesis.
002891 The cancer types included in the CCGA study
included invasive breast cancer, lung
cancer, colorectal cancer, DCIS, ovarian cancer, uterine cancer, melanoma,
renal cancer, pancreatic
cancer, thyroid cancer, gastric cancer, hepatobiliary cancer, esophageal
cancer, prostate cancer,
lymphoma, leukemia, multiple myeloma, head and neck cancer, and bladder
cancer.
86
CA 03158101 2022-5-11
WO 2021/108654
PCT/US2020/062350
[00290] EXAMPLE I - In Silico Spiking of Cancer Signals
into Data from Non-cancerous
Subjects
[00291] It was hypothesized that pre-cancerous genomic
aberration accumulates with age, but is
held in check by the immune system, telomeric shortening, etc., until
appropriate (and evolutionarily
unlikely) adaptations arise. That is, cancer evolution becomes
punctuated/saltational at evolutionary
bottlenecks. That is development of a biological signature for cancer in a
subject developing cancer
(e.g., having progressing, early-stage cancer) would proceed differently in
different subjects, due to
biological differences between the subjects, e.g., aging. For example, Figure
6 shows two distributions
of cancer model probabilities calculated for healthy individuals based on
inspection of cfDNA
sequence reads. Distribution XA included non-cancer patients from the CCGA
control group matched
in age distribution to the CCGA cancer patients. Distribution XE included
young and healthy
individuals from the CCGA control group. As shown in Figure 6, there was a
statistically significant
difference between the two distributions (p = 0.0000005). This reinforces the
conclusion that age
plays a key role in the development of cancer signal. Therefore, adjusting for
this variation through
the use of personalized baselines for biological features could improve the
level of detection of any
cancer classifier.
[00292] To investigate this theory, an in stile data
spiking experiment was designed to test the
effect of spiking the same amount of various cancer signals into different
biological backgrounds. In
the experiment, increasing percentages of bin values determined for sequence
reads mapped to a
plurality of genomic regions from subjects known to have various types of
cancer were serially spiked
into bin values determined for sequence reads mapped to the plurality of
genomic regions for subjects
with very low tumor fractions. This was designed to simulate a time series
development of cancer, in
silico, using a plurality of different biological backgrounds. Then,
development of the cancer signal,
as reported by a probability of cancer derived from a cancer classifier
trained against copy number
variation (relative bin values), was evaluated for each spiked data sample.
The classifier used in this
experiment is described in U.S. Patent Application Publication No.
2019/0287649.
[00293] Briefly, twenty-two CCGA low-tumor-fraction
subjects with undetectable levels of cell-
free tumor fraction, and a matched number of high-tumor-fraction subjects who
were known to have
different types of cancer, who each had a cell-free DNA tumor fraction of at
least 10%, and for whom
the cancer classifier provide at least a 90% probability of having cancer,
were also selected from the
CCGA study data. Next, increasing amounts of bin counts from each of the high-
tumor-fraction
87
CA 03158101 2022-5-11
WO 2021/108654
PCT/US2020/062350
subjects were added to the bin counts of different instances of the bin count
data for each low-tumor-
fraction subject, forming four hundred and eighty four sets of cancer series
data having increasing bin
counts, as plotted on the x-axis of the graphs shown in Figure 5. Each
instance of spiked bin counts
was then evaluated by the cancer classifier, to generate a probability that
the spiked data was acquired
from a subject having cancer. These probabilities were plotted as a function
of tumor fraction, in the
graphs shown in Figure 5.
1002941 As shown by the graphs in Figure 5, the probability
of cancer calculated for a given
simulated sample depended upon (i) the simulated tumor fraction, (ii) the type
of cancer, and (iii) the
background signal provided by the reference subject (the subject who data was
spiked with cancer
signal). For instance, referring to reference individual 2813, the plot for
which is enlarged in Figure
5C, there is a nearly 10-fold difference in the tumor fraction used to
generate a spike in the identified
cancer probability across the different types of cancers. For instance, when
signal from a first cancer
was spiked into reference individual's 2813 background (represented by series
502), a significant
increase in the identified cancer probability was seen at simulated tumor
fractions of just greater than
0.001 (0.1%). However, when signal from two different cancers were spiked into
the same
background (represented by series 504 and 506, respectively), an increase in
the identified cancer
probability was not seen until the simulated tumor fraction increases above
0.01 (1%). This
demonstrates the dependence upon the cancer type on the calculated cancer
probability. Similarly,
Figure 5 shows that the dependence upon the individual's background signal on
the calculated cancer
probability is rather significant. For instance, in most of the reference
backgrounds, a spike in
calculated cancer probability was not observed for one particular cancer type
until the tumor fraction of
the simulated sample reached above 0.01 (1%). However, when the cancer signal
for that cancer was
spiked into data for individual 510, a spike in cancer probability was
observed at a tumor fraction
significantly below 0.01. In fact, detectable spikes in the calculated cancer
probabilities for reference
individual 510 were seen significantly earlier for almost all of the different
cancer types. In contrast,
when the cancer signal for that cancer type was spiked into data for
individual 1314, no increase in
cancer probability was observed until the tumor fraction rose significantly
above 0.01 (1%). In fact,
detectable spikes in the calculated cancer probabilities for reference
individual 1314 appeared to be
significantly delayed for most cancer types.
88
CA 03158101 2022-5-11
WO 2021/108654
PCT/US2020/062350
[00295] EXAMPLE 2¨ Testing of In Silico Distributions
[00296] The in silky time series data generated for the
sample of cancer types spiked into 22
different reference backgrounds, described in Example 1, was used as data set
to test whether the
methods described herein for comparing changes in cancer probability over time
to a reference
distribution can increase the sensitivity of a classifier for cancer. Two
different approaches were taken
to generate a reference distribution to which the changes in cancer
probabilities shown in Figure 5
could be compared.
1002971 In a first approach, bin counts were determined for
more than 100 samples of a single
positive cancer cell line control. As these samples contained cancerous cells,
the effective tumor
fraction for the sample was known to be 1Ø Given data from a reference, non-
cancerous sample,
having an effective tumor fraction of 0.0, regression analysis was used to
simulate signals from a
plurality of tumor fractions between 0.0 and 1.0, as shown in Figure 7A.
Cancer probabilities for each
regressed tumor fraction, for each reference sample were then generated using
the copy number
classifier described in U.S. Patent Application Publication No. 2019/0287649.
Examples of the
calculated cancer probabilities generated for three of the simulated tumor
fraction series are illustrated
in Figure 7B.
1002981 Next, a distribution of changes in the probability
of cancer as a function of tumor
fraction was established based on the regressions performed for all samples.
The distribution was
defined to include those healthy samples with no spiked in cancer DNA signal.
Then, the changes in
cancer probability for all samples was compared to the established reference
distribution. As shown in
Figure 7B, when the copy number classifier was used alone to classify whether
the samples were
cancerous, 95% specificity was reached at a tumor fraction of approximately
0.02 (2%). However,
when the changes in probability between consecutively simulated data set was
compared to the
established baseline, using a 95% statistical cut-off (p = 0.05), 95%
specificity was achieved at a tumor
fraction of approximately 0.01, representing a 2-fold improvement in LoD, the
tumor fraction at which
50% sensitivity was achieved.
[00299] In a second approach, three replicates of samples
from eight different healthy
individuals, using five different combinations of ciDNA isolation and
amplification protocols, were
used to establish a normalized distribution of cancer probabilities for intra-
individual variance, as
89
CA 03158101 2022-5-11
WO 2021/108654
PCT/US2020/062350
illustrated in Figure 8. 95% specificity was achieved at a tumor fraction of
approximately 0.08 (8%)
using this distribution.
[00300] Next, the two distributions established above, were
used for comparison of changes in
the cancer probabilities for all of the simulated tumor fraction series data
described in Example 1. A
95% statistical cut-off (p = 0.05), was used to call whether the sample can be
classified as cancerous or
non-cancerous. Figure 9 shows a breakdown of the sensitivity of the various
models achieved for each
cancer stage, as defined by simulated tumor fraction. Briefly, the data shows
that using the first
reference distribution, the comparative change in cancer method described
herein approximately
doubled the sensitivity at 95% specificity for detecting stage 0 cancer,
improved the sensitivity for
detecting stage I cancer by approximately 70%, improved the sensitivity for
detecting stage II cancer
by approximately 40%, and improved the sensitivity for detecting stage HI
cancer by approximately
20%. Advantageously, these improvements in sensitivity would significantly
improve detection of
early stage cancers, as compared to convention, single-time point assays.
[00301] EXAMPLE 3- CCGA Serial Sample Study - Sub Study
[00302] A study was developed to determine whether changes
in patient results over lime from a
next generation sequencing (NGS)-based cancer classifier, developed and
validated in a separate study
(CCGA), could be used to identify early stage cancer in subjects classified as
non-cancerous by the
classifier. Briefly, cell-free DNA (cfDNA) isolated from plasma collected from
subjects was
sequenced and analyzed using a classifier trained to distinguish between
multiple types of cancer and
to provide cancer tissue of origin information. The output of the test
provided a diagnosis or prediction
selected from a group of diagnoses that includes at least (i) no cancer signal
detected, indicating the
subject does not have cancer, (ii) a cancer signal with an indeterminate
tissue of origin, indicating the
subject has cancer originating from an undetermined tissue type, and (iii) a
cancer signal with a
determined tissue of origin, indicating the subject has cancer originating
from a particular tissue type.
[00303] The objectives of the study were: (i) to evaluate
cfDNA signatures in individuals
serially over time, (ii) to describe the association between changes in cfDNA
signatures over time and
cancer diagnoses, and (iii) to describe the association between changes in
cfDNA signatures over lime
and subject outcomes. Accordingly, the overall goal of the study was to
explore changing cancer
signals over time and demonstrate increased cancer detection sensitivity and
specificity, when serial
blood draws are available_
CA 03158101 2022-5-11
WO 2021/108654
PCT/US2020/062350
[00304] This study is a sub-study of the CCGA. The CCGA is
a prospective, multi-center,
observational study with collection of de-identified biospecimens and clinical
data from at least 15,000
participants from clinical networks in the United States, Canada, and the
United Kingdom. The study
enrolled cancer subjects with multiple types of malignancies (the CANCER arm)
and representative
subjects without a clinical diagnosis of cancer (the NON-CANCER arm) as
defined by eligibility
criteria over an enrollment period of 30 months. Clinical information,
demographics, and medical data
relevant to cancer status were collected from all participants and their
medical record at baseline (time
of biospecimen collection), and subsequently from the medical record at
intermittent future time
points, at least annually for up to 5 years A future blood collection may also
be requested from study
subjects during the follow-up period, but is not a scheduled event.
[00305] The Sub-Study population is derived from the
enrolled CCGA population. Current
CCGA participants were selected for inclusion in the Sub-Study as defined by
eligibility criteria.
Subjects agreeing to participate underwent an enrollment Study Visit for
consent. Consenting subjects
underwent two study blood draws approximately 3 months apart. Additional
clinical information
regarding past and current health status was collected. This included but were
not limited to past
medical history, current medical conditions, diagnostic and screening tests,
and health-related risk
factors. 400 participants were enrolled for the Sub Study, 200 with a
diagnosis of cancer in the
enrollment period and 200 with no cancer diagnosis in the enrollment period.
Sub Study participation
included 2 additional blood draws 3 months apart and follow-up within the
protocol defined CCGA
study period, which is up to 5 years following enrollment. Participation in
the Sub Study did not
extend the study duration beyond that already prescribed in CCGA protocol.
[00306] Briefly, venous blood was collected from the Sub
Study participants by peripheral
venous blood draw with optimal collection of 20 mL (maximum) peripheral blood
into 2 x 10 mL
Streck Cell-free DNA BCT. In addition, clinical data was collected from
participant questionnaires
and the medical record (at baseline and follow-up visits), including imaging
and pathology reports.
Data was captured and managed within an electronic data capture (EDC) system.
1003071 EXAMPLE 4- Temporal Methylation Changes
[00308] A study was performed to evaluate changes in
genomic methylation patterns over time
and, particularly, changes in genonnic methylation patterns that indicate pre-
cancer and/or early cancer
development. This study was a sub-study of the CCGA. To date CCGA-based
studies have evaluated
91
CA 03158101 2022-5-11
WO 2021/108654
PCT/US2020/062350
blood draws from a single point in time from a given donor. Though useful for
identifying dominant
methylation variants present in cancer patients versus normal participants,
single time point
observations do not assess participant-level epigenetic changes that occur
with time in non-cancer
participants.
[00309] As a first objective of the study, temporal
methylation changes in healthy participants
were investigated. Briefly, follow-up blood draws were collected from selected
CCGA2 participants
for processing with a targeted methylation assay. Longitudinal velocity of
methylation patterns were
characterized from a comparison of the methylation patterns in the original
CCGA2 blood samples to
those subsequent blood draws_ The results from this first objective were used
to design follow-up
studies to address secondary research objectives. These secondary objectives
include (i) improving
classifier performance using longitudinal blood draws, (ii) identifying
temporal changes in methylation
pattern that accompany and/or drive transformation from a non-cancerous state
to a cancerous state in a
subject, (iii) assessing the velocity of epigenetic changes in a cancer signal
over time, and (iv)
evaluating whether particular individuals have inherently noisy methylation
signals that persist in
repeated blood draws.
1003101 Briefly, 188 CCGA2 participants with longitudinal
blood draws were selected for this
study. These CCGA2 participants had an evaluable assay result at baseline and
an additional blood
draw later in time. A single tube of plasma from each participant was selected
for processing.
Participants were selected or prioritized based on the following criteria: (i)
the subject had strong
cancer signal at the time of the first blood draw, as determined by a positive
cancer prediction from the
multi-cancer classifier at a specificity of 97%, 98%, and 99%; (ii) that DNA
sequencing data from
corresponding white blood cells from the subject was available; (iii) that the
selected cohort have a
roughly uniform distribution of subjects having longitudinal samples collected
around 12 months, 18
months, 24 months, and 30 months after the baseline blood draw; (iv) that the
selected cohort have
approximately the same number of males and females; and (v) that the selected
cohort have a roughly
equal number of participants from each of the following age groups: <30, 31-
40,41-50, 51-60, 61-70,
71-80, and >80.
1003111 188 frozen longitudinal CCGA plasma samples were
processed, and two cfDNA
extraction batches (plates) were processed and quantified. 2 PC2 positive
controls, representing
control samples formulated to provide abnormal counts upon processing in a
multi-cancer assay, were
added to each plate of samples at the ciDNA extraction step. The samples have
been formulated to
92
CA 03158101 2022-5-11
WO 2021/108654
PCT/US2020/062350
provide consistent abnormal and binary coverage in a multi-cancer assay and
serve as experimental
quality controls. The samples in the two plates were subject to bisulfite
conversion, DNA library
preparation, and sample quantification. Finished cfDNA libraries were
quantified with Accuclear and
consolidated for multiplex enrichment. A multiplex enrichment protocol using a
probe library that
enriches for CpG-rich regions, library quantification, and normalized pooling
was performed, e.g., as
described in United States Patent Publication No. US 2020-0365229 Al. All
samples were then
sequenced on a single S4 flow cell.
1003121 The sequencing data was de-multiplexed and input
into a cfDNA methylation-based
multi-cancer classifier, e.g., as described in United States Patent
Publication No. US 2020-0365229
Al, which is hereby incorporated by reference, implemented at a target
specificity of 99.4%. Two
versions of the assay (Methylation Test vi and Methylation Test v2) were used
in the study, based on
which assay was originally used to evaluate the first blood draw from the
subject in the CCGA2 study
data.
[00313] The classifier outputs a probability score, ranging
from 0 to 1, representing the cancer
signal at the time of the corresponding blood draw. Statistical analyses on
the change in the output
score generated for each subject between the initial and longitudinal sample
blood draw (e.g., second
blood draw) were then evaluated for qualitative insights into the key
objectives described above.
[00314] First, the distribution of changes in the
probability score generated for each subject
between the first and second samples were determined. Histograms of these
changes are presented in
Figure 10, for samples processed using version 1 (left) and version 2 (right)
of the methyl ation assay at
the initial blood draw. As can be seen in Figure 10, the distribution of
changes clustered around 0 for
both versions of the assay. Further, the distribution appeared to be fairly
regular, with similar numbers
of changes greater than and less than zero. This likely represents background
variance in the
methylation signals of these healthy subjects. That is, fluctuations in the
genomic methyl ation pattern
over the 12 to 40 month period, for the most part, result in small shifts in
the cancer probability output
by the classifier.
[00315] Next, the second cancer probability score generated
for each subject (using the second,
longitudinal blood draw) was plotted as a function of the first cancer
probability score for the subject
(using the first blood draw). As shown in Figure 11, the majority of points
fell in the lower left
quadrant of the plot, representing cases where the cancer probability score
generated from both the first
93
CA 03158101 2022-5-11
WO 2021/108654
PCT/US2020/062350
and second blood draw were low. In a few instances, the points fell in the
upper right quadrant of the
plot, representing cases where the cancer probability score generated from
both the first and second
blood draw were high. However, in a few instances, significant changes in the
cancer probability score
were observed, represented by the points falling within the upper left and
lower right quadrants of the
graph. For perspective, a density plot representing variation in cancer
probability score between vi
assay replicates from 4503 CCGA2 participants, is overlaid, in unbroken lines,
on the plot.
Significantly, the majority of points, particularly when version 2 of the
methylation test was used at the
initial blood draw, fall within this distribution, indicating that some of the
small changes in cancer
probability score can be attributed to noise within the assay, rather than
underlying biology.
1003161 To investigate whether the time between the first
blood draw and the second blood draw
significantly affected cancer probabilities, each change in cancer probability
score was plotted as a
function of the time interval between the first and second blood draw. As
shown in Figure 12, no
strong relationship is seen between the change in cancer probability scores
and the passage of time
within a short time-range of the longitudinal dataset.
1003171 To investigate the biological significance
underlying the large changes in cancer
probability score, the medical record of several of the corresponding subjects
was further investigated.
These subjects correspond to the points falling outside of the lower left
quadrant of the graph in
Figure 11, as represented again in Figure 13. The density plot in Figure 13
represents the distribution
computed from the longitudinal participants, averaging over vi and v2 assays
at the initial blood draw.
1003181 The medical record for subject ccga_15379 was
investigated. This subject fell within
the upper right quadrant of the graph shown in Figures 11 and 13, indicating
that a stable cancer signal
was present in the first and second blood draws, taken twelve months apart for
this subject. While this
subject displayed no clinical indications of cancer, they were diagnosed with
monoclonal gammopathy
of undetermined significance (MGUS) more than 10 years prior to the first
blood draw. MGUS is a
condition caused by abnormal changes in plasma cells, which usually does not
cause any symptoms.
Approximately 1% of patients with MGUS develop blood cancer, such as multiple
myeloma, each
year.
1003191 The medical record for subjects ccga_4540 and
ccga_7860 were also investigated.
These subjects fell within the upper left quadrant of the graph shown in
Figures 11 and 13, indicating
94
CA 03158101 2022-5-11
WO 2021/108654
PCT/US2020/062350
that a significant cancer signal developed within these patients in the time
between the first and second
blood draws.
[00320] The medical record for subject ccga 4540 has no
indication that this subject has
developed cancer. However, the time between the first and second blood draws
for this subject was 35
months, which is one of the longest time periods investigated. One possibility
is that this observed
change is due to a relationship between the passage of time and change in the
cancer probability score
for a subject. A second possibility is that this observed change is
representative of a pre-cancerous or
cancerous state that is not yet clinically detectable. A third possibility is
that clinical records
associated with the change are not available yet.
[00321] In contrast, the medical record for subject
ccga_7860 shows that this subject was
diagnosed with a bladder cancer within a month of the second blood draw. This
indicates that the
change in the cancer signal detected in the longitudinal blood draw, collected
27 months after the
initial blood draw, represents cancer development in this subject.
[00322] The medical record for subjects ccga_10260 and
ccga_9055 were also investigated.
These subjects fell within the lower right quadrant of the graph shown in
Figures 11 and 13, indicating
that cancer signal detected in the first blood draw significantly diminished
between the first and second
blood draws.
[00323] The medical record for subject ccga_10260 shows at
the time the initial blood draw was
taken, the subject had not been diagnosed with cancer. However, three months
later, this subject was
diagnosed with ER+/PR+/HER2- breast cancer. Significantly, this is a slow
growing, luminal cancer,
suggesting that the subject had already developed the cancer at the time of
the first blood draw. The
subject was then treated by mastectomy after neoadjuvant therapy, followed by
irradiation, prior to the
second blood draw, which occurred 25 months after the initial blood draw.
Significantly, this is a type
of cancer typically associated with a positive clinical prognosis, which is
consistent with the significant
drop in cancer signal detected in the second blood draw.
[00324] The medical record for subject ccga_9055 indicates
that the subject has displayed no
clinical signs of cancer. However, subject ccga_9055 was diagnosed with MGUS
and
thrombocytopenia. While the cancer signal for subject ccga_9055 diminished
within the 25 months
between the first and second blood draws, the drop in signal was less than for
subject ccga_10260.
This is consistent with the results seen for subject ccga_15379, who was also
diagnosed with MGUS,
CA 03158101 2022-5-11
WO 2021/108654
PCT/US2020/062350
who observed a modest drop in signal over time.. These results indicate that
subjects with non-
cancerous blood disorders, such as MGUS, may display a larger natural variance
in their biological
cancer signals.
[00325] A central hypothesis is that, beyond typical
variation, a detected cancer signal only
increases with time. To test this hypothesis two analyses will be
investigated. First, whether positive
cancer detected signals at baseline (initial blood draw) remain positive at
the subsequent blood draw.
Second, whether negative cancer signals at baseline convert to positive cancer
signals detected at the
later time point, or whether there is no detectable directionality of the
signal. The analyses will be
conducted using R software version 16 or higher.
[00326] To calculate classifier prediction transitions
between the baseline and second blood
draws, the following metrics will be computed. First, concordance of the
classifier results (positive vs
negative) between the participant-matched baseline and additional blood
samples will be evaluated by
constructing a 2 x 2 matrix and estimating positive percent agreement,
negative percent agreement,
overall agreement and the fraction of samples whose prediction changes from
non-cancer to cancer
between classifier results from the two blood draws.
[00327] Second, contribution of covariates to classifier
prediction transitions will be estimated.
An indicator variable representing whether a sample's cancer status changed
between the two
predictions will be calculated. A logistic regression model will then be fit
using this indicator as the
dependent variable and an additive model of sex, age-bin, and the number of
months between the
blood draws as covariates. Interaction effects between the covariates will
also be included if there are
enough samples that change in cancer prediction between the blood draws. It
cannot be predicted how
many samples will have a changing cancer signal between the blood draws. If
less than 10 samples
change in their cancer prediction this analysis will not be performed.
1003281 Third, a generalized linear mixed model will be fit
with a binary outcome representing
the classifier prediction and fixed effects using measured covariates, such as
age and gender. A
random effect whose covariance represents the "longitudinal" correlation
induced by sampling the
same participants at different time points will be modeled. For efficient
computation this temporal
covariance will be parameterized using a discrete autoregressive process
model. If there is no variation
in the cancer prediction between the blood draws, it will not be possible to
fit this model or learn the
96
CA 03158101 2022-5-11
WO 2021/108654
PCT/US2020/062350
underlying temporal covariance. As above, if less than 10 samples change in
their cancer prediction,
this analysis will not be performed.
[00329] Fourth, the latent difference in classifier
probabilities (or logit-transformed
probabilities) will be modeled as a two component mixture distribution, where
the first component is a
point-mass at zero and the second component is a flexible non-negative
distribution. A Gaussian
likelihood that allows for sampling variation in the observed difference in
cancer probabilities will be
used. This model captures the fact that most samples will have no change in
their latent cancer
probability, but some will shift towards increased cancer probability as time
proceeds. The probability
of belonging to either component will be estimated from the data using an
empirical Bayes approach.
[00330] Fifth, the number of samples that received a
different TOO call between the two blood
draws including those with a "cancer not detected" assignment will be
calculated Among the samples
that received a cancer TOO assignment, a "difference" metric (e.g., Kullback-
Leibler divergence)
between the fitted probabilities output by the TOO classifier for each sample
between time points will
be determined.
[00331] In addition, several exploratory analyses will be
performed. First, a redaction analysis
will be applied, using the first blood draw as baseline data whose signal
would be removed from the
second blood draw. Using this approach any fragments that look unusual with
respect to the baseline
can be removed, and the same analyses as above can be re-run with the redacted
data.
[00332] Second, a set of methylation variants will be
defined using a large reference database of
non-cancer WGBS cfDNA samples from CCGA1 (e.g., that do not overlap with the
participants
analyzed in this study) and fully methylated or unmethylated variants that are
rare in non-cancer
samples will be filtered. The reference set will be locked in advance of
analyzing the follow-up
samples. The data set will be conditioned on a high probability of cancer, and
test performed for a
shift distribution of frequency change between time-points, where the shift
represents a potential
increase in the underlying tumor fraction.
[00333] Third, the subset of samples that have received a
tissue of origin (TOO) call at the first
blood draw will be focused on. For each predicted tissue of origin in the
first time point, target
methylation variants will be defined from a pre-computed reference database of
methylation variants
called on that corresponding TOO, filtering variants that are high frequency
in the database. The
posterior distribution of tumor fraction will then be estimated and a
potential shift in tumor fraction
97
CA 03158101 2022-5-11
WO 2021/108654
PCT/US2020/062350
between the first and second blood draw will be inferred / tested for. The
same "reference free" tumor
fraction estimation approach described above will then be performed, but
conditioned on the TOO call
at the second blood draw, rather than the first
1003341 Fourth, Uniform Manifold Approximation and
Projection (UMAP) and Principal
Component Analysis (PCA) will be applied to the mixture model feature matrix
generated for the
longitudinal pilot data. Each row of this matrix will represent a sample and
each column will represent
a mixture model feature. Notably, the same individual will be present in
different rows but their data
being sampled at different blood draws. We will then regress a number of
covariates (age, sex, assay-
type, blood draw indicator) on each dimension output from UNIAP to gain
interpretation into what
patterns drive similarities among the samples.
1003351 Fifth, Principal Component Analysis (PCA) will be
applied to the mixture model
features generated for the training set samples. Each longitudinal pilot data
sample will then be
projected onto the axes of variation defined by the PCA applied to the
training set. This will allow
leverage of the large and diverse collection of samples from the training set
to look for overall
relationships among samples from the smaller longitudinal pilot data. Similar
regression of the same
covariates from above will be performed to look for associations.
1003361 CONCLUSION
1003371 All references cited herein are incorporated herein
by reference in their entirety and for
all purposes to the same extent as if each individual publication or patent or
patent application was
specifically and individually indicated to be incorporated by reference in its
entirety for all purposes.
1003381 The present invention can be implemented as a
computer program product that
comprises a computer program mechanism embedded in a non-transitory computer
readable storage
medium. For instance, the computer program product could contain the program
modules shown
and/or described in any combination of Figures 1-8. These program modules can
be stored on a CD-
ROM, DVD, magnetic disk storage product, USB key, or any other non-transitory
computer readable
data or program storage product.
1003391 Many modifications and variations of this invention
can be made without departing
from its spirit and scope, as will be apparent to those skilled in the art.
The specific embodiments
described herein are offered by way of example only. The embodiments were
chosen and described in
order to best explain the principles of the invention and its practical
applications, to thereby enable
98
CA 03158101 2022-5-11
WO 2021/108654
PCT/US2020/062350
others skilled in the art to best utilize the invention and various
embodiments with various
modifications as are suited to the particular use contemplated. The invention
is to be limited only by
the terms of the appended claims, along with the full scope of equivalents to
which such claims are
entitled.
99
CA 03158101 2022-5-11