Note: Descriptions are shown in the official language in which they were submitted.
CA 03163348 2022-05-30
WO 2021/119306
PCT/US2020/064303
TITLE: SPECTRAL ANALYSIS AND MACHINE LEARNING OF ACOUSTIC
SIGNATURE OF WIRELINE STICKING
CLAIM OF PRIORITY UNDER 35 U.S.C. 119
[0001] The present Application for Patent claims priority to U.S. Provisional
Application No.
63/058,548 entitled "Spectral Analysis, Machine Learning, and Frac Score
Assignment
to Acoustic Signatures of Fracking Events" filed July 30, 2020, and assigned
to the
assignee hereof and hereby expressly incorporated by reference herein. The
present
Application for Patent also claims priority to U.S. Provisional Application
Nos.
62/945,929, 62/945,949, 63/058,534, 62/945,953, and 62/945,957 entitled
"Spectral
Analysis and Machine Learning to Detect Offset Well Communication Using High
Frequency Acoustic or Vibration Sensing", "Acoustic and Vibrational Sensor
Based
Micro-Seismic Analysis", "Spectral Analysis and Machine Learning of Acoustic
Signature of Wireline Sticking", "Spectral Analysis and Machine Learning of
Well
Activity Using High Frequency Pressure Sensing of Phase-Locked Stimulation",
and
"Spectral Analysis and Machine Learning of Acoustic Signature of Drill Bit
Positive
Displacement Motor Torque and Drill Bit Wear", respectively, each of which are
assigned to the assignee hereof and hereby expressly incorporated by reference
herein.
FIELD OF THE DISCLOSURE
[0002] The present disclosure relates generally to oil field monitoring. In
particular, but not
by way of limitation, the present disclosure relates to systems, methods and
apparatuses
for spectral analysis of acoustic signals associated with drilling and
completions
operations.
DESCRIPTION OF RELATED ART
[0003] Unconventional reservoirs include reservoirs such as tight-gas sands,
gas and oil shales,
coalbed methane, heavy oil and tar sands, and gas-hydrate deposits. These
reservoirs
have little to no porosity, thus the hydrocarbons may be trapped within
fractures and
pore spaces of the formation. Additionally, the hydrocarbons may be adsorbed
onto
organic material (e.g., of a shale formation). In some cases, these reservoirs
may require
special recovery operations distinct from conventional operating practices in
order to
mobilize and extract the oil.
1
CA 03163348 2022-05-30
WO 2021/119306
PCT/US2020/064303
[0004] The rapid development of extracting hydrocarbons from these
unconventional
reservoirs can be tied to the combination of horizontal drilling and induced
fracturing
(called "hydraulic fracturing" or simply "fracking") of the formations.
Horizontal
drilling has allowed for drilling along and within hydrocarbon reservoirs of a
formation
to better capture the hydrocarbons trapped within the reservoirs. In some
cases,
increasing the number of fractures in the formation and/or increasing the size
of existing
fractures through fracking may serve to increase mobilization.
[0005] In some cases, modern drilling and fracturing operations may utilize a
perforating gun
to perforate oil and gas wells in preparation for production. Perforating guns
may
perforate a well's casing and surrounding rock to form tunnels via several
shaped
explosive charges. In some cases, these tunnels can later be expanded via high
pressure
fluids. Perforating guns may be controlled via a wireline (or electric line),
wherein the
wireline may be used to lower and raise the perforating guns (or control their
horizontal
position in a horizontal section of a well), as well as control firing of the
charges therein.
[0006] In some circumstances, wireline sticking (or simply "sticking") is
identified as the
difficulty of the wireline movement either in the upward or downward
direction.
Wirelines are prone to sticking for a number of reasons, including, but not
limited to, a
cave-in of the borehole above the drill bit; drill-cuttings settling within
the borehole due
to not being carried away properly; turning radius issues in deviated
boreholes;
adhesion of the drill string or wireline based on a lack of movement; high
friction
between the drill pipe and the borehole walls; or differential sticking caused
by higher
drilling fluid pressure than formation pressure. In a complete wireline
sticking situation,
neither circulation nor wireline movement may be possible. Complete sticking
not only
delays production as fishing operations are carried out to free the wireline
and/or
perforating gun, but in some cases the gun and stage of the well may have to
be
abandoned. Such sticking can occur as often as every 45 days and can cost an
operator
hundreds of thousands of dollars per jam, thus constituting a significant
annual cost to
fracking operations. In some areas, events related to sticking can be
responsible for as
much as 40% of the total well cost.
[0007] Thus, there exists a need for accurately predicting wireline sticking
events to minimize
downtime and optimize fracking and drilling operations.
SUMMARY
2
CA 03163348 2022-05-30
WO 2021/119306
PCT/US2020/064303
[0008] The following presents a simplified summary relating to one or more
aspects and/or
embodiments disclosed herein. As such, the following summary should not be
considered an extensive overview relating to all contemplated aspects and/or
embodiments, nor should the following summary be regarded to identify key or
critical
elements relating to all contemplated aspects and/or embodiments or to
delineate the
scope associated with any particular aspect and/or embodiment. Accordingly,
the
following summary has the sole purpose to present certain concepts relating to
one or
more aspects and/or embodiments relating to the mechanisms disclosed herein in
a
simplified form to precede the detailed description presented below.
[0009] Wireline sticking is a significant cause of concern during fracking and
drilling
operations. This concern has been identified and dated back to at least the
1940s (see
Warren, J. E. 1940. Causes, Preventions, and Recovery of Stuck Drill Pipe. API-
40-
030), and yet, there is a long-felt unmet need for accurately predicting
wireline sticking.
Besides the significant cost, wireline sticking events also hamper production
due to the
delays associated with fixing such sticking events. In some extreme cases, the
gun and
stage of a drilled well may have to be abandoned. Wirelines are prone to
sticking for a
number of reasons, including, but not limited to, a cave-in of the borehole
above the
drill bit; drill-cuttings settling within the borehole due to not being
carried away
properly; turning radius issues in deviated boreholes; adhesion of the drill
string or
wireline based on a lack of movement; high friction between the drill pipe,
perf gun,
and/or plug with the borehole walls; differential sticking caused by higher
drilling fluid
pressure than formation pressure. In some other cases, proppant sands from a
previous
stage of fracking may remain in the wellbore, which may increase friction on
the
wireline as it pushes the perforation gun and plug down for a next stage. In
yet other
cases, differential pressures on the wireline, or pressure difference between
the
hydrostatic pressure and the formation pressure, can also slow or halt
wireline
movement.
[0010] Wireline sticking rarely occurs instantaneously; rather, the stuck
wireline event is in
most cases preceded by changes in one or more wireline parameters that
foreshadow a
stuck wireline event, with changes occurring sometimes minutes or even hours
prior to
the stuck wireline event. For example, increasing torque, decreasing drill
string
revolutions per minute (RPM), and/or decreasing drilling fluid flow may be
indicative
of an upcoming stuck wireline event.
3
CA 03163348 2022-05-30
WO 2021/119306
PCT/US2020/064303
[0011] While some attempts have been made to identify characteristics of
static well pressure,
which is used as one indicator of wireline sticking, these attempts are not
only difficult
to read, but also lacking in their ability to predict wireline friction. For
instance,
WEATHERFORD uses hydraulics and torque-and-drag software to determine
deviation of real-time data from a real-time model as well as trend analysis
of real-time
data, with parameters such as pump pressure, flow rate, torque, rotary speed,
hookload
and drag, and weight on bit (see Sahninen, et al. STUCK-PIPE PREDICTION BY USE
OF AUTOMATED REAL-TIME MODELING AND DATA ANALYSIS. September
2017. Society of Petroleum Engineers, SPE Drilling & Completion).
[0012] In some other cases, statistical analytics of previous sticking events
have been used to
predict wireline sticking (see U.S. Patent No. 9,970,266; see also Weakley,
Use of
Stuck Pipe Statistics To Reduce the Occurrence of Stuck Pipe, September 23-26,
1990,
Society of Petroleum Engineers, SPE Annual Technical Conference and
Exhibition), as
well as artificial neural network analytics of existing data have been used
(Jahanbakhshi
et al, Intelligent Prediction of Differential Pipe Sticking by Support Vector
Machine
Compared With Conventional Artificial Neural Networks: An Example of Iranian
Offshore Oil Fields, December 2012, Society of Petroleum Engineers, SPE
Drilling &
Completion) but these are far from real-time. At least one group has used
linear
regression based on "training wells" to build models that can be used to
predict wireline
sticking based on a current hook load value for a given bit depth (U.S. Patent
Application No. 2017/0306726). Landmark Graphics Corp. has used real-time
measurements of wireline hookload moving averages to short interval hookload
moving
average to identify sticking events (U.S. Patent No. 10,436,010).
[0013] In yet other cases, the prior art has focused on avoiding, rather than
predicting, sticking.
For instance, Wheater describes mechanical means of avoiding sticking through
the use
of standoffs which help to relieve wireline pressure against sidewalls of the
borehole,
and thereby reduces cable key-setting, high wireline cable drag, and friction
that could
lead to sticking (see U.S. Patent No. 10,066,449). However, mechanical means
of
avoiding sticking are not guaranteed, and may merely decrease the likelihood
of
sticking, rather than eliminate it completely. Additionally, in some
circumstances,
mechanical means may also increase the cost and complexity of the system due
to the
use of non-standard components/parts and/or additional parts.
[0014] The novel embodiments described herein are directed to assisting
drilling operators in
avoiding stuck wireline events by providing an indication of a likelihood of a
future
4
CA 03163348 2022-05-30
WO 2021/119306
PCT/US2020/064303
stuck wireline event sufficiently far in advance that one or more corrective
measures
may be taken. Embodiments are also directed to predicting and preventing stuck
wireline events by identifying increased wireline friction associated with
imminent
wireline sticking.
[0015] In one aspect of the disclosure, acoustic or vibration data can be
monitored at the
wellhead, a circulating fluid line, or a standpipe of the well, and when
vibrations in the
time domain exceed a threshold, an indicator can be returned to the operator
or a
controller can adjust fracking operation parameters. The threshold can be an
average
amplitude or a rate of increase in acoustic or vibration signals. In a second
example,
spectral analysis of acoustic or vibration signals in a well may help
operators in
identifying component failures. Additionally or alternatively, spectral
analysis may
allow operators to preemptively remove or replace a component from operation
before
failure. In a third example, analyzing acoustic or vibration data in the
frequency domain
may provide operators with insight on casing wear, which may allow them to
identify
excessive casing wear.
[0016] In a fourth example, acoustic or vibration signals can be monitored at
the wellhead, a
circulating fluid line, or a standpipe of the well, and when vibrations in the
time domain
exceed a threshold and specific spectral signals are identified in the
frequency domain
of the vibration data, an indicator can be returned to the operator or a
controller can
adjust fracking operation parameters. The threshold can be an average
amplitude or a
rate of increase in acoustic or vibration signals.
[0017] In a fifth example, acoustic or vibration signals can be monitored at
the wellhead, a
circulating fluid line, or a standpipe of the well, and when specific spectral
signals are
identified in the frequency domain, an indicator can be returned to the
operator, or a
controller can adjust fracking operation parameters. The threshold can be an
average
amplitude or a rate of increase in acoustic or vibration signals.
[0018] Some embodiments of the disclosure may relate to a system for
preventing wireline
sticking during hydraulic fracturing operations, the system comprising: a
sensor
coupled to a fracking wellhead, circulating fluid line, or standpipe of a well
and
configured to convert acoustic vibrations measured in fracking fluid in the
fracking
wellhead, circulating fluid line, or standpipe into an electrical signal in a
time domain;
a memory configured to store the electrical signal; a converter configured to
access the
electrical signal from the memory and convert the electrical signal in a
window of time
into a current frequency domain spectrum; a machine-learning system configured
to
CA 03163348 2022-05-30
WO 2021/119306
PCT/US2020/064303
classify the current frequency domain spectrum as associated with increasing
wireline
friction, the machine-learning system trained on previous frequency domain
spectra
measured during previous wireline operations and previously classified by the
machine-
learning system; and a user interface configured to return an indication of
the increasing
wireline friction to an operator of the hydraulic fracturing operations.
[0019] Some other embodiments of the disclosure may relate to a method of
preventing
wireline sticking during hydraulic fracturing operations, the method
comprising:
providing a sensor coupled to a wellhead, circulating fluid line, or standpipe
of a well
and configured to convert acoustic vibrations in fracking fluid in the
wellhead,
circulating fluid line, or standpipe into an electrical signal in a time
domain; recording
the electrical signal to a memory; converting the electrical signal in the
memory for a
window of time to a current frequency domain spectrum comprising an amplitude
spike
at one or more frequencies; analyzing the current frequency domain spectrum
via a
machine-learning system trained on previous frequency domain spectra measured
during previous wireline operations and previously classified by the machine-
learning
system; classifying the current frequency domain spectrum as associated with
increased
wireline friction; and returning an indication of the increasing wireline
friction to a well
operator.
[0020] In yet other embodiments, the disclosure may relate to a method of
preventing wireline
sticking, the method comprising: starting a wireline operation on a fracking
stage of a
well; measuring acoustic vibrations in fracking fluid in a wellhead,
circulating fluid
line, or standpipe of the well; converting the acoustic vibrations into an
electrical signal
in a time domain; recording the electrical signal to a memory; converting the
electrical
signal in the memory for a window of time to a current frequency domain
spectrum
comprising an amplitude spike at one or more frequencies; analyzing the
current
frequency domain spectrum via a machine-learning system trained on previous
frequency domain spectra measured during previous wireline stages and
previously
classified by the machine-learning system; classifying the current frequency
domain
spectrum as associated with increased wireline friction; and adjusting a
parameter of
the wireline operation based on the increased wireline friction.
[0021] These and other features, and characteristics of the present
technology, as well as the
methods of operation and functions of the related elements of structure and
the
combination of parts and economies of manufacture, will become more apparent
upon
consideration of the following description and the appended claims with
reference to
6
CA 03163348 2022-05-30
WO 2021/119306
PCT/US2020/064303
the accompanying drawings, all of which form a part of this specification,
wherein like
reference numerals designate corresponding parts in the various figures. It is
to be
expressly understood, however, that the drawings are for the purpose of
illustration and
description only and are not intended as a definition of the limits of the
disclosure. As
used in the specification and in the claims, the singular form of 'a', an, and
the include
plural referents unless the context clearly dictates otherwise.
BRIEF DESCRIPTION OF THE DRAWINGS
[0022] Various objects and advantages and a more complete understanding of the
present
disclosure are apparent and more readily appreciated by referring to the
following
detailed description and to the appended claims when taken in conjunction with
the
accompanying drawings:
[0023] FIG. 1 illustrates a drilling system for monitoring acoustic or
vibration signals in an
observation well according to an embodiment of the disclosure.
[0024] FIG. 2 illustrates a drilling system for monitoring acoustic or
vibration signals in an
observation well according to an embodiment of the disclosure.
[0025] FIG. 3 illustrates a network structure for multiple spoke computers
according to an
embodiment of the disclosure.
[0026] FIG. 4A illustrates a drilling system including a drilling rig and a
wireline truck.
[0027] FIG. 4B illustrates a system for using frequency signatures of acoustic
or vibration data
to identify equipment failures.
[0028] FIG. 5 illustrates a well head embodying the herein-disclosed acoustic
sensor in
accordance with one or more implementations.
[0029] FIG. 6 illustrates an isometric view of four offset wells, each
including a vertical and
horizontal region separated by the heel, in accordance with one or more
implementations.
[0030] FIG. 7 illustrates an isometric view of the four offset wells in FIG.
6, in accordance
with one or more implementations.
[0031] FIG. 8 illustrates an isometric view of the four offset wells in FIG.
6, in accordance
with one or more implementations.
[0032] FIG. 9 illustrates an isometric view of the four offset wells in FIG.
6, in accordance
with one or more implementations.
7
CA 03163348 2022-05-30
WO 2021/119306
PCT/US2020/064303
[0033] FIGs 10 illustrates an isometric view of four offset wells, each
including a vertical and
horizontal region separated by the heel, in accordance with one or more
implementations.
[0034] FIG. 11 illustrates an isometric view of the four offset wells in FIG.
10, in accordance
with one or more implementations.
[0035] FIG. 12 illustrates an isometric view of the four offset wells in FIG.
10, in accordance
with one or more implementations.
[0036] FIG. 13 illustrates an isometric view of the four offset wells in FIG.
10, in accordance
with one or more implementations
[0037] FIG. 14 illustrates one view of an exemplary spectral plot with
frequency spikes
associated with frac initiation in an observation well, in accordance with one
or more
implementations.
[0038] FIG. 15 illustrates a second view of the exemplary spectral plot in
FIG. 14, in
accordance with one or more implementations.
[0039] FIG. 16 illustrates a third view of the exemplary spectral plot in FIG.
14, in accordance
with one or more implementations.
[0040] FIG. 17 illustrates an exemplary well including an acoustic or
vibration sensor at the
wellhead according to an embodiment of the disclosure.
[0041] FIG. 18 illustrates an exemplary well including an acoustic or
vibration sensor at the
wellhead according to an embodiment of the disclosure.
[0042] FIG. 19 illustrates a computing system configured for preemptively
identifying signs
of eminent wireline sticking, in accordance with one or more implementations.
[0043] FIG. 20 illustrates a method of training a model to identify wireline
friction and/or
sticking events, in accordance with one or more implementations.
[0044] FIG. 21 illustrates a flowchart related to a method of training a model
to identify
wireline friction and/or sticking events according to an embodiment of the
disclosure.
[0045] FIG. 22 illustrates a method of using acoustic or vibration data at a
well to identify
related events through a model analyzing a time series or frequency spectrum
of the
acoustic or vibration data.
[0046] FIG. 23 illustrates an exemplary well including an acoustic or
vibration sensor at the
wellhead according to an alternate embodiment of the disclosure.
[0047] FIG. 24 illustrates a method of training a model to identify fracking
events or states
according to an alternate embodiment of the disclosure.
8
CA 03163348 2022-05-30
WO 2021/119306
PCT/US2020/064303
[0048] FIG. 25 illustrates a method of using acoustic or vibrational data at a
well to identify
related events through a model analyzing a frequency spectrum of the acoustic
or
vibrational data according to an alternate embodiment of the disclosure.
[0049] FIG. 26 illustrates a computing system configured for optimizing drill
head positive
displacement motor torque according to an alternate embodiment of the
disclosure.
DETAILED DESCRIPTION
[0050] The word "exemplary" is used herein to mean "serving as an example,
instance, or
illustration." Any embodiment described herein as "exemplary" is not
necessarily to
be construed as preferred or advantageous over other embodiments.
[0051] Preliminary note: the flowcharts and block diagrams in the following
figures illustrate
the architecture, functionality, and operation of possible implementations of
systems,
methods and computer program products according to various embodiments of the
present invention. In this regard, some blocks in these flowcharts or block
diagrams
may represent a module, segment, or portion of code, which comprises one or
more
executable instructions for implementing the specified logical function(s). It
should
also be noted that, in some alternative implementations, the functions noted
in the block
may occur out of the order noted in the figures. For example, two blocks shown
in
succession may, in fact, be executed substantially concurrently, or the blocks
may
sometimes be executed in the reverse order, depending upon the functionality
involved.
It will also be noted that each block of the block diagrams and/or flowchart
illustrations,
and combinations of blocks in the block diagrams and/or flowchart
illustrations, can be
implemented by special purpose hardware-based systems that perform the
specified
functions or acts, or combinations of special purpose hardware and computer
instructions.
[0052] The present disclosure relates generally to oil field monitoring. In
particular, but not
by way of limitation, the present disclosure relates to systems, methods and
apparatuses
for spectral analysis of acoustic or vibration signals received at a well
head.
Sources of Acoustic and/or Vibration Pressure and Acoustic/Vibration Sensors
[0053] Existing pressure sensing techniques for oil field monitoring involve
recording pressure
changes (e.g., absolute changes over long periods of time) with reference to
an absolute
pressure of fluid in the well. However, currently used static pressure sensors
usually
have a slow sample rate (e.g., slower than 1 Hz) and provide very little
signal amplitude
when indications of wireline friction arise. Given the high cost of delays and
stage
9
CA 03163348 2022-05-30
WO 2021/119306
PCT/US2020/064303
abandonment that can result from wireline sticking, there is a need for
systems and
methods that can more accurately predict wireline sticking and do so with
greater lead
time to sticking events.
[0054] In some cases, analyzing fluctuations or vibrations in the fluid in a
well (e.g., fracking
fluid) in a frequency domain, rather than a time domain, may serve to provide
a more
accurate understanding of wireline sticking. In some cases, this analysis may
involve
acquiring dynamic acoustic or vibration pressure data from the well's fluid
(e.g.,
fracking fluid) and converting it into a frequency spectrum or frequency
domain. In
some circumstances, the analysis can focus on repeating patterns, which may
have a
better correlation to underground events, and may travel through and be more
easily
discerned through thousands of feet of rock and sand formations, than one-off
changes
in absolute pressure (events that often take hours to register). In some
cases, this
spectrum may also be referred to as an acoustic or vibration spectral
frequency signature
(or frequency signature). In some embodiments, the analysis may comprise
generating
machine learning (ML) models, or other artificial intelligence (Al) models,
and training
the models to recognize the acoustic or vibration signatures of different
events. One
non-limiting example of an event may comprise identifying increasing wireline
friction
or wireline sticking. Once models have been trained to recognize the acoustic
or
vibration signatures of different wireline events, real-time acquired data may
be
compared to the model or analyzed by the model for real-time assessment of
wireline
friction or sticking. Current techniques involve operators making wireline
decisions
based on slow feedback parameters such as speed of descent and tension on the
wireline, parameters that lag wireline events by significant amounts over
indications
available when acoustic or vibration signals in the fracking fluid are
monitored. The
systems and methods disclosed herein alleviate some of the deficiencies of
current
wireline monitoring techniques by utilizing real-time quantitative and
qualitative
analysis of acoustic and vibration signals in the fracking fluid, in either
the time domain,
frequency domain, or both, to more accurately assess wireline friction and
sticking, and
to optionally provide warnings to operators and/or automated and optimized
control of
wireline operations.
[0055] In some cases, the techniques described in this disclosure may utilize
a high frequency
(e.g., greater than 1 kHz) acoustic or vibration sensor directly coupled to a
well, for
instance at the well head, circulating fluid line, or standpipe. This acoustic
or vibration
sensor may be in direct physical contact with fluid in the well, the well
casing, the well
CA 03163348 2022-05-30
WO 2021/119306
PCT/US2020/064303
head pipe, the circulating fluid line, the standpipe, or the well pad (e.g.,
vibration
sensors on the well pad can obviate the need to have direct contact with fluid
in the
well). In some embodiments, a vibration sensor need not be directly coupled to
a
component of the well, but instead can indirectly measure vibrations in the
fluid. For
instance, a laser reflecting off a surface of the well, such as a viewing
window, could
measure vibrations of the viewing window using optical methods. For the sake
of
brevity, an acoustic or vibration sensor may be used wherever the term
acoustic sensor
is seen in this disclosure. In some examples, the high frequency acoustic or
vibration
sensor may provide a digital or analog signal indicative of high frequency
pressure
fluctuations. Additionally or alternatively, the signal may be indicative of
vibrations in
the fluid. In some examples, this signal may be passed to a conversion and
analysis
component, or a converter (e.g., spectrum analyzer), configured to identify
frequency
components of the signal (e.g., via an algorithm that transforms pressure or
vibration
data in the time domain to the frequency domain such as a Fast Fourier
Transform (FFT)
and compares the frequency domain signal to previously measured frequency
domain
signals or signatures). FIGs. 14-16 show examples of frequency spectra that
were used
to identify subterranean events, such as increased wireline friction and
sticking, much
sooner than is possible with traditional techniques, or using fewer sensors
(e.g., one).
[0056] In some examples, the acoustic sensors described throughout this
disclosure may or
may not have a reference pressure. Furthermore, the acoustic sensors may be
configured
to measure at least changes in pressure. Thus, in some cases, the acoustic
sensors may
be configured to measure absolute pressure in addition to pressure changes
(i.e., if a
reference pressure is being used). Additionally or alternatively, for
instance, if no
reference pressure is being used, the acoustic sensors may be used in parallel
with an
absolute pressure sensor. In some cases, the absolute pressure sensor may be
configured
to measure static or absolute pressures, where the absolute pressure may be
used as a
baseline (or reference) for the higher sensitivity data from the acoustic
sensor.
[0057] It should be noted that throughout this disclosure a vibration sensor
may be used in
addition (or as an alternative) to a high frequency acoustic pressure sensor.
Acquired Data
[0058] As previously noted, the term acoustic sensor may be broadly used to
refer to a high
frequency acoustic pressure sensor and/or a vibration sensor (e.g., sampling
at ¨ 1 kHz
or greater). One non-limiting example of a vibration sensor may comprise a
piezoelectric vibration sensor. In some cases, piezoelectric vibration sensors
may be
11
CA 03163348 2022-05-30
WO 2021/119306
PCT/US2020/064303
configured to generate a current or voltage proportional to an amount of
piezoelectric
material movement. The piezoelectric material can be in direct physical
contact with
the fluid in the well or may be physically coupled to a protective membrane
that is in
direct physical contact with the fluid. Either way, vibrations in the fluid
may be
transmitted to the piezoelectric material, which may cause movement or
vibrations of
the piezoelectric material. Movement of the piezoelectric material may
generate a
current or voltage, where the current or voltage may be proportional to the
amount of
vibration or movement of the piezoelectric material. The ICP Pressure Sensor,
Model
Number 113B23, is one non-limiting example of an acoustic or vibration sensor.
[0059] In some cases, the generated current or voltage may be recorded and
stored, and there
may be a 1 to 1 mapping of vibration data to current or voltage data. The
measured
current or voltage readings may be used to determine vibration data, for
instance, by
mapping the current or voltage readings to corresponding vibration values in a
look-up
table. In some cases, raw data may comprise one or more of the mapped
vibration data,
and the measured current and/or voltage readings. This raw data can be passed
through
a transform operation such as a Fourier Transform, and further analyzed in the
frequency domain (e.g., via a spectrum analyzer), further described below.
Analysis of Acquired Data and Example Applications/Use Cases
Frequency Domain Analysis
[0060] In some examples, a transform component and/or a conversion and
analysis component
(e.g., converter or spectrum analyzer) may be implemented as a software
program,
firmware module, hardware comprising analog circuits, or a combination
thereof. In
some embodiments, a conversion function (e.g., Fourier Transform) may comprise
the
use of wavelet analysis techniques. Further, wavelet analysis may refer to the
use of a
custom function that is stretched and scaled. Further, wavelet analysis may
facilitate in
optimizing analysis of detailed timing of events in a signal.
[0061] For the purposes of this disclosure, a conversion and analysis
component (e.g., spectrum
analyzer) may be configured to measure the magnitude of an input signal at
different
frequencies. Said another way, the conversion and analysis component may
analyze
signals in the frequency domain, rather than the time domain. Typically, the
conversion
and analysis component may receive electrical signals as an input. In some
other cases,
the conversion and analysis component may receive acoustic or vibration
signals via an
appropriate transducer. In some embodiments, the conversion and analysis
component
12
CA 03163348 2022-05-30
WO 2021/119306
PCT/US2020/064303
may utilize a Fourier Transform or another applicable transform algorithm to
convert
raw acoustic or vibration data from the time domain to the frequency domain.
[0062] Fracking pads may include one or more acoustic sensors (e.g., one
acoustic sensor for
each well head) or one or more static pressure sensors and one or more
acoustic sensors
(e.g., one static and one acoustic sensor for each well head). The acoustic
sensors may
be high frequency pressure sensors (e.g., sampling at ¨1 kHz or greater). Each
fracking
pad may include a transceiver for transmitting raw data from its sensor(s) to
a local or
cloud-based conversion and analysis component. Additionally or alternatively,
the raw
data may be transmitted to a processing resource that receives and analyses
outputs
from various conversion and analysis components. In one embodiment, a set of
pads
may comprise a master transceiver configured to receive data from one or more
other
pads on a local network. Each pad can transmit raw data or converted data
(i.e.,
frequency domain data) to the master transceiver, and the master transceiver
may
transmit (i.e., relay) the data received on the local network to a cloud-based
resource,
such as a server farm where more complex analysis takes place (e.g.,
comparison to a
model; training a model).
[0063] Further, the acoustic sensors may be coupled to one or more conversion
and analysis
components. In some cases, the number of conversion and analysis components
may
vary (e.g., one for each pad, one for each well head, or one for a network of
sensors, to
name a few non-limiting examples). The conversion and analysis component may
be
configured to execute an algorithm, such as a FFT algorithm, for transforming
raw data
from the time domain to the frequency domain. In some other cases, the
conversion and
analysis component may be used in concert with another device or software
module
that can perform FFT.
[0064] Using spectral analysis rather than static pressure-based sensing
enables higher signal
to noise ratios than traditional static pressure-based sensors. For instance,
an increase
in wireline friction or sticking would not be visible in static pressure
measurements, but
would cause an acoustic signal or vibration that could be detected by a
dynamic acoustic
sensor and seen via analysis of frequency components in the time or frequency
domain.
Such changes from the noise floor could be seen as frequency peaks in the
frequency
domain, as seen in FIGs. 14-16. By training a model based on frequency
signatures of
previous wireline events, it is possible to associate a current frequency
spectrum with
known levels of increased wireline friction or with sticking events, and thus
use
acoustic measurements to predict wireline sticking.
13
CA 03163348 2022-05-30
WO 2021/119306
PCT/US2020/064303
[0065] Since this disclosure looks at a spectral analysis of acoustic and
vibration waves in well
hole fluid, many different signatures can be identified and analyzed, each
having their
own benefits (e.g., detecting different down well phenomena, or where some
signals
might have a higher signal to noise ratio). For instance, in the frequency
domain, the
consistent pumping of pumping components, such as pump trucks, at an adjacent
well
may have a much greater amplitude than signals at other frequencies. Fluid,
mud, and
proppant flowing through the well holes, perforations in stage walls, and
fractures may
also have easily identifiable signatures in the frequency domain. For
instance, sand
moving along edges of a pipe, well hole, or fracture may generate acoustic or
vibration
waves at a unique frequency (e.g., at a different frequency or frequencies
from signals
generated by clean water moving through the same structure). Also, areas where
fluids
become turbulent may be identifiable in the frequency domain, as distinct from
areas
of laminar fluid flow.
[0066] Being able to distinguish between different processes or events during
development of
a well or offset well may allow the conversion and analysis component to
identify
signatures coming from specific activities as well as from specific locations
in the
observation or offset well. For instance, one adjacent well may be packing
sand and
gel into existing cracks while another adjacent well may be opening cracks
with
pumped fluid. In such cases, given knowledge of the timing of these processes
at nearby
wells, the conversion and analysis component may be able to identify which
well is
causing which signals based on which it may monitor changes in the signal from
one
well to the other (e.g., where one of the two wells is approaching a wireline
sticking
event). Alternatively, spectral analysis of acoustic or vibration signals in a
well may
help operators better understand drill bit torque and wear, or even predict an
impending
wireline sticking event. In another example, spectral analysis of acoustic or
vibration
signals in a well may help operators more quickly identify component failures
or
preemptively remove a component from operation before failure. In yet another
example, analyzing acoustic or vibration data in the frequency domain may shed
light
on casing wear and allow operators to act in response to excessive wear.
[0067] In an embodiment, high frequency acoustic signals in a well can be
matched with known
signals indicating an increasing likelihood of a mishap, such as impending
sticking of
the coil tube, sticking of wireline, or stalling of a drill bit. This can
allow preventive
actions to be taken before a catastrophic event, such as coil tube sticking,
occurs.
Similarly, acoustic signatures of components that are nearing failure may be
monitored
14
CA 03163348 2022-05-30
WO 2021/119306
PCT/US2020/064303
and preventative maintenance may be carried out in response. For instance, it
is well
known in the prior art that paddle trucks include pumps that begin to
disintegrate or
"chunk" out prior to complete failure. However, the pressurized nature of
these pumps
prevents them from being visually monitored. According to aspects of the
present
disclosure, a conversion and analysis component (i.e., on the well head, or
coupled to a
fluid line of the pump truck, or on an offset well) may be used to detect the
frequency
signature of "chunking" and issue a warning.
Raw Time Domain Analysis and/or Time & Frequency Domain Analysis
[0068] In some cases, the acoustic or vibration data in the time domain may be
analyzed, for
instance, by a machine learning model without conversion. In such cases, the
conversion and analysis component may be responsible for analysis, but not
conversion, of the time domain data. It should be noted that, even though no
conversion
of time domain data into the frequency domain takes place, the model may still
have
access to frequency information associated with the measured signal. In some
cases,
knowledge of frequency space decomposition of a signal may be utilized to
deconstruct
a single waveform in time into a composite of simpler, underlying waveforms
(e.g.,
sinusoidal waveforms). In some other cases, a Short-time Fourier transform
(STFT)
may be used to determine the sinusoidal frequency and phase content of local
sections
of a signal as it changes over time. STFT computation may involve dividing a
longer
time signal into shorter segments of equal length and then computing the
Fourier
transform separately on each shorter segment. In some cases, once the Fourier
spectrum
is revealed for each shorter segment, the changing spectra may be plotted as a
function
of time (i.e., also known as a spectrogram or waterfall plot).
[0069] Furthermore, while this disclosure has discussed use cases where a
source of a
frequency signal is constant, such as that of fracking fluid passing through a
perforation
in a casing or a pumping frequency of a pump truck, in other embodiments, the
source
frequency may vary in time. In some instances, frequency monitoring operations
may
be controlled and fine-tuned to assist in distinguishing a signal from
background noise.
In one example, operators may vary and control a generated source frequency
signal
(e.g., from a pump truck) and monitor changes in the observed signal in the
frequency
and/or time domain. For instance, rather than simply monitoring a 33 Hz pump
truck
signal, operators could perform a frequency sweep for the generated pump truck
signal
(e.g., by gradually adjusting a pump truck frequency through a range, such as
20 Hz to
40 Hz). In this example, the conversion and analysis component may be used to
not
CA 03163348 2022-05-30
WO 2021/119306
PCT/US2020/064303
only pick up on these unique frequencies (e.g., between 20 and 40 Hz) over
background
frequencies, but also monitor and observe the signal changing in the frequency
domain
as a function of time. Additionally or alternatively, the source frequency may
also be
adjusted to optimize travel through a given medium. For instance, where a
certain shale
formation separates an observation well and an observation well coupled to
pump
trucks, the pump trucks' revolution per minute (RPMs) could be gradually
adjusted
until a highest amplitude signal (i.e., corresponding to an optimized
frequency for travel
through the shale formation between the wells) is observed by the conversion
and
analysis component. In this way, a source signal can be optimized for
detection in an
offset well.
[0070] It should be noted that, pump trucks are just one example of an
acoustic or vibration
source, and different acoustic/vibration sources may be utilized in different
embodiments. For instance, surface vibrators or surface oscillators used for
releasing
stuck drill strings may be used as acoustic or vibration sources. In some
other cases,
surface vibrators used to impart vibratory seismic energy into the ground may
be used
as acoustic/vibration sources. In yet other cases, an acoustic transducer,
ultrasound
transducer, sonar transducer, etc., may be used to inject energy into the
system.
Machine Learning
Fourier Analysis
[0071] Some embodiments of this disclosure pass acoustic or vibration data in
the frequency
domain to a machine learning model for analysis, labeling, and training of the
model.
In some embodiments, the model may be configured to use artificial
intelligence based
on, for example, a neural network or other type of machine learning algorithm.
In some
cases, the artificial intelligence algorithm or model may receive time domain
data
converted to a frequency domain, for instance, using a FFT algorithm or
another
algorithm for computing the discrete Fourier transform (DFT) of a sequence. A
DFT
may be obtained by decomposing a sequence of values into components of
different
frequencies. In some cases, a conversion and analysis component may be
utilized to
perform the conversion from time to frequency domain. In some other cases, the
acoustic or vibration data in the time domain may be passed to a machine
learning
model without conversion. In such cases, the conversion and analysis component
may
be responsible for analysis, but not conversion, of the time domain data. It
should be
noted that, even though no conversion of time domain data into the frequency
domain
takes place, the model may still have access to frequency information
associated with
16
CA 03163348 2022-05-30
WO 2021/119306
PCT/US2020/064303
the measured signal. In some cases, the model may look at a window of data in
one shot
(or one local section of a signal as it changes over time) and learn to
detect, for instance,
high and low frequency waveforms and structures. The model or neural network
may
encompass knowledge of frequency space decomposition of a signal and may be
configured to deconstruct a single waveform in time into a composite of
simpler,
underlying waveforms (e.g., sinusoidal waveforms). Thus, in some aspects, the
model
may be trained to perform something akin to Fourier analysis. In some other
cases, the
model may utilize a Short-time Fourier transform (STFT) to determine the
sinusoidal
frequency and phase content of local sections of a signal as it changes over
time. STFT
computation may involve dividing a longer time signal into shorter segments of
equal
length and then computing the Fourier transform separately on each shorter
segment.
In some cases, once the Fourier spectrum is revealed for each shorter segment,
the
changing spectra may be plotted as a function of time (i.e., also known as a
spectrogram
or waterfall plot).
Example Machine Learning Algorithms
[0072] In some embodiments, a plurality of distinct machine-learning
algorithms may be
operated in parallel, which may serve to enhance the accuracy of predicting
future
wireline sticking or jamming events. In some aspects, the use of multiple
machine-
learning algorithms may also decrease false positive indications as compared
to the use
of a single machine learning algorithm. In some cases, a combination of three
or four
machine learning algorithms may be operated in parallel, which may provide a
balance
of high accuracy versus system complexity. Some non-limiting examples of
machine
learning algorithms may include a neural network, a decision tree, a support
vector
machine, and Bayesian methods.
Neural Networks
[0073] In some cases, a neural network may comprise a plurality of input
nodes, where an input
node refers to a point within the neural network to which a parameter (e.g., a
drilling
parameter) may be provided for further processing. Further, the neural network
may
comprise one or more output nodes, where each output node represents a
calculated
and/or predicted parameter based on the input data at the input nodes. In some
cases,
one or more layers of hidden nodes may lie between the input and output nodes,
where
the hidden nodes may be coupled to some or all of the input nodes and/or the
output
nodes. Each of the hidden nodes may be configured to perform a mathematical
function
that is determined or learned during a training phase of the neural network,
where the
17
CA 03163348 2022-05-30
WO 2021/119306
PCT/US2020/064303
mathematical function may be determined based on the data of the input nodes
to which
it is coupled. Likewise, the output nodes may perform mathematical functions
based on
data provided from the hidden nodes. In some embodiments, the neural network
may
be provided one or more drilling parameters in real-time, as well as one or
more
historical values of the drilling parameters based on preprocessing, for
instance, by a
wireline sticking event prediction software. In other words, the neural
network may be
trained using historical data from fracking and drilling operations where a
wireline
sticking event actually occurred. In such cases, the neural network may
produce a value
at an output node based on an input value provided to the input node, where
the value
may be a probability of occurrence of a wireline sticking event. Some non-
limiting
examples of drilling parameters may include a value indicative of weight-on-
bit; a value
indicative of hook load, wherein the hook may be used to control the
ascent/descent of
the wireline or a drill string in the borehole; a value indicative of rate-of-
penetration; a
value indicative of rotary speed of the drill pipe; a value indicative of
torque applied to
the drill pipe; a value indicative of drilling fluid pump pressure; a value
indicative of
inclination of the drill string; a value indicative of length of drill string;
measurement-
while-drilling data; logging-while-drilling data; and a value indicative of
drilling fluid
flow rate.
Decision Trees
[0074] With regards to fracking and drilling operations, a decision tree
machine learning
algorithm may be an example of a predictive model comprising a plurality of
interior
nodes that may be traversed based on a set of input parameters (e.g., drilling
parameters,
such as drill string RPM, torque, etc.). In such cases, the predicted value
(e.g., of a
wireline sticking event) may be based on arriving at an end node following
transitioning
from node to node, where the transitioning may be based on the set of input
parameters.
In such cases, the end node may be dictated by the input parameters. It should
be noted
that, in some cases, decision trees may also be referred to as classification
or regression
trees.
Support Vector Machines
[0075] In some cases, support vector machines are a class of machine-learning
algorithms that
perform classifications of data into groups. In particular, support vector
machines can
be thought of as performing classification by analysis of the data in a
multidimensional
space. Training data for support vector machines may be "plotted" or "mapped"
into
the multidimensional space and classified or grouped spatially. It should be
noted that
18
CA 03163348 2022-05-30
WO 2021/119306
PCT/US2020/064303
the plotting or mapping need not be a true physical plotting, but a conceptual
operation.
After the training phase, data to be analyzed may be plotted or mapped into
the
multidimensional space. Further, the support vector machine may be configured
to
determine the most likely classification of the data. In some cases, the
classification of
the data to be analyzed may be a "distance" calculation between the spatial
location of
the data to be analyzed in the mappings and the "nearest" classification. In
one non-
limiting example, the support vector machine may be provided one or more
drilling
parameters from drilling and fracking operations where wireline sticking or
jamming
took place, as well as operations where no sticking event occurred. In this
case, the
support vector machine may be configured to plot the data in a
multidimensional space
and classify the data. During actual drilling and fracking operations (i.e.,
when real-
time drilling parameters are provided to the support vector machine), the
support vector
machine may plot a data point under test in the multidimensional space, and
predict a
result (i.e., a probability of a wireline sticking event) based on the spatial
position of
the plotted point relative to a spatial delineation (or classification line)
between data
with wireline sticking events and those without.
Bayesian Methods
[0076] In yet other cases, the machine learning algorithm may comprise the use
of Bayesian
methods. Bayesian methods represent a logically different view of data and
probabilities and may be thought of as testing the plausibility of a
hypothesis (e.g., a
wireline sticking event will occur in the future) based on a previous set of
data. In some
aspects, Bayesian methods may be considered non-deterministic since they
generally
assume the plausibility of a hypothesis is based on unknown or unknowable
underlying
data or assumptions. In some embodiments, a value indicative of plausibility
of a
hypothesis may be determined based on the previous data (e.g., the training
data),
following which plausibility may be tested again in view of new data (i.e.,
with the
drilling parameters applied). From the evaluation, a plausibility of the truth
of the
hypothesis may be determined.
[0077] FIG. 1 illustrates a drilling system 100 for monitoring acoustic or
vibration signals
(referred to simply as, signals) in an observation well. The signals can
either be sourced
or generated at (or in) the observation well or an optional offset well. As
shown, the
drilling system 100 can include a well head 102 of the observation well and
optionally
an offset well having an offset well head 120. The well head 102 of the
observation
well can include a sensor 104 (e.g., acoustic or vibration sensor) in physical
contact
19
CA 03163348 2022-05-30
WO 2021/119306
PCT/US2020/064303
with fluid in the observation well or a component directly in contact with the
fluid (e.g.,
a sensor affixed to an outside of the standpipe of wellhead). For instance,
the sensor
104 can be arranged within the wellhead, a circulating fluid line, or the
standpipe.
Alternatively, the sensor 104 can be arranged at an end of a T-junction that
runs roughly
perpendicular to piping of the wellhead, a circulating fluid line, or the
standpipe.
Alternatively, the sensor 104 can be arranged within a pipe parallel to piping
of the
wellhead, circulating fluid line, or standpipe. The sensor 104 can generate a
signal and
pass said signal to an onsite computer 106, for instance, via an analog-to-
digital
converter (ADC) 108. The onsite computer 106 may be configured to process
signals
from one or more wellheads of a pad, or alternatively, from multiple pads. The
onsite
computer 106 can include a transceiver or antenna 110 configured to transmit
raw
acoustic or vibration data to a conversion and analysis component. As
illustrated, the
conversion and analysis component may comprise an on-site or cloud-based
storage
and analysis unit 112. In some examples, the conversion and analysis component
may
be configured to convert the raw acoustic or vibration data from a time to a
frequency
domain. Further, the conversion and analysis component may be configured to
identify
frequency signatures indicative of one or more events. In some cases,
identification of
such events may further trigger a communication to an operator computer 114.
Some
non-limiting examples of such events may include a potential communication
between
wells, an eminent drill bit failure, wireline sticking, etc. In some cases,
the operator
computer 114 may be linked to the conversion and analysis component via a
transceiver
116, and may further include a display 118 for providing visual warnings or
other
messages or indicators.
[0078] In some cases, the on-site or cloud-based storage and analysis unit 112
may include a
trained model (e.g., as part of a machine-learning system) based on previous
wireline
operations and their frequency signatures (and optionally previously
classified by the
machine-learning system). For instance, the model may have been trained using
acoustic or vibration data from previous drilling events, for instance, an
event that led
to a falloff in production. In one example, frequency signatures for previous
sticking
events or wireline jamming events could also be used to train the model to
detect
acoustic or vibration frequency signatures that suggest an eminent wireline
jamming
event. In some embodiments, the on-site or cloud-based storage and analysis
unit 112
may be configured to take action in response to the on-site or cloud-based
storage and
analysis unit 112 identifying a threshold increase in wireline friction or an
imminent
CA 03163348 2022-05-30
WO 2021/119306
PCT/US2020/064303
sticking event, for instance, by providing automated feedback control to the
well. More
specifically, the automated feedback may include reducing a speed of descent
of the
wireline, stopping motion of the wireline, reversing a direction of the
wireline,
increasing a flush time, performing a dedicated flush, or using a smaller
plug, or
perform another applicable action.
[0079] In some embodiments, the on-site or cloud-based storage and analysis
112 may monitor
a signature of pump trucks 122 pumping fluids into the offset well head 120.
These
trucks may be operating pumps at around 33 Hz. In such cases, the frequency
signature
(i.e., at 33 Hz) generated by the pump truck may be of a larger amplitude than
other
frequency components generated by the illustrated drilling system 100.
[0080] By better understanding wireline friction and sticking and providing
earlier predictions
of such events, the herein disclosed systems, methods, and apparatus may not
only help
reduce downtime, but also minimize the abandonment of stages during a fracking
operation.
[0081] FIG. 2 illustrates a drilling system 200 for monitoring acoustic or
vibration signals in
an observation well. In some examples, the drilling system 200 may implement
one or
more aspects of the figures described herein, including at least FIG. 1. As
shown,
drilling system 200 may comprise one or more well pads 202 (e.g., well pad 202-
a, well
pad 202-b), one or more spoke computers 208 (e.g., spoke computers 208-a,
spoke
computer 208-b), antenna systems 212 (e.g., antenna system 212-a, antenna
system
212-b), a remote hub 214, and a database 230. While the illustrated embodiment
shows
two well pads 212, any number of well pads may be utilized. Each well pad 212
may
include one or more well heads (shown as well head 102 and/or well head 120 in
FIG.
1), where each well head can include a sensor (shown as acoustic sensor 104 in
Fig. 1)
directly or indirectly coupled to fluids in the well, and optionally an
absolute pressure
sensor (or static pressure sensor) directly coupled to fluids in the well
(e.g., via the
wellhead, circulating fluid line, or standpipe, to name a few non-limiting
examples).
Alternatively, each well may include an acoustic sensor and an optional
absolute
pressure sensor, and these sensors may not be directly coupled to fluids in
the well via
the well head. For instance, an adapter below the well head may be used to
place the
sensor(s) in direct communication with fluid in the well, or the vibration
sensor may be
coupled to a metal component (e.g., a standpipe) of the well or well head.
[0082] The signals can either be sourced at the observation well (e.g.,
acoustic waves from a
fracture initiation) or an adjacent or offset well. In some embodiments, the
sensor(s)
21
CA 03163348 2022-05-30
WO 2021/119306
PCT/US2020/064303
may be configured to couple to processors (e.g., Raspberry Pi) located in the
spoke
computers 208-a and/or 208-b. In some cases, a spoke computer 208 may comprise
one
or more processors for each well pad 202 in electronic communication with the
respective spoke computer. In some cases, in addition to reading the acoustic
or
vibration signal measurements from the one or more sensors, the computer
system (e.g.,
spoke computers 208) may also be configured to read one or more surface-based
parameters directly or indirectly. A non-limiting list of surface-based
parameters that
may be directly or indirectly read by the computer systems comprises: a hook
load;
RPM of the drill string at the surface; torque applied to the drill string at
the surface;
pressure of the drilling fluid as the drilling fluid is pumped into the drill
string; pressure
of the drilling fluid returning to the surface; and standpipe pressure of the
drilling fluid.
[0083] In some embodiments, the one or more processors of the spoke computers
208 may be
coupled to an antenna system 212. In some cases, the antenna system 212 may
comprise
an omnidirectional antenna, although other types of antennas are contemplated
in
different embodiments. Each antenna system 212 may be in communication with a
wide
area network (WAN), such as a 4G or 5G network. In another embodiment, the
antennas
of the antenna system 212 may form a local area wireless network wherein one
of the
antennas may be configured as an interface (e.g., a gateway) between the local
area
wireless network and a wide area network. In some embodiments, cellular (e.g.,
multi-
beam antennas, sector antennas) or satellite (e.g., dish) antennas may be
deployed for
communication with a wide area network, to name a few non-limiting examples.
Further, omnidirectional or Yagi type antennas, to name two non-limiting
examples,
may be utilized for local area network communication.
[0084] In some cases, the remote hub 214 may be in communication with the
antenna systems
212 and the spoke computers 208. Further, the remote hub 214 may be configured
to
contact an insight program 226 via an Application Programming Interface (API)
224.
In some examples, this communication may involve a local area network or a
wide area
network. Insight 226 may be configured to store data for a training model in
the
database 230, as well as continually train the model using new data acquired
from the
acoustic sensors at the well heads. In some cases, the drilling system 200 may
also
support a web app 228 to provide one or more insights, warnings, feedback,
and/or
instructions to pad operators. In some examples, the web app 228 may be
accessible via
a user interface displayed on a user device (e.g., laptop, smartphone, tablet,
etc.).
22
CA 03163348 2022-05-30
WO 2021/119306
PCT/US2020/064303
[0085] In some embodiments, the processors may comprise (or may be coupled to)
a
conversion and analysis component. In other embodiments, the processors may
send
their data through the network(s) to a centralized conversion and analysis
component.
In some cases, the centralized conversion and analysis component may or may
not be
located near the well pads 202. For instance, the centralized conversion and
analysis
component may be located off-site in some embodiments.
[0086] As illustrated, the drilling system 200 may further comprise one or
more additional
components, modules, and/or sub-systems, including, but not limited to, a Data
Acquisition and Control System (DASTrac 216), a fracking client 218, a Coiled
Tubing
(CT) Data Acquisition module 220, and a CT client 222. In some cases, the
DASTrac
216 may comprise a data acquisition and control program for acquiring fracking
operations data from wellsite process control units and other sensors.
Further. DASTrac
216 may be configured to display the acquired data from the data acquisition
system in
both numeric and graphical form in real time, which may enable operators to
change
job profiles, scale parameters, advance stages, change stages, and hold stages
in
response to seeing fracture scores, to name a few non-limiting examples. In
some cases,
the CT Data Acquisition module 220 may be configured to measure and control
technological parameters of coiled tubing units during repair and stimulation
operations
of oil and gas wells. The CT Data Acquisition module 220 may also be
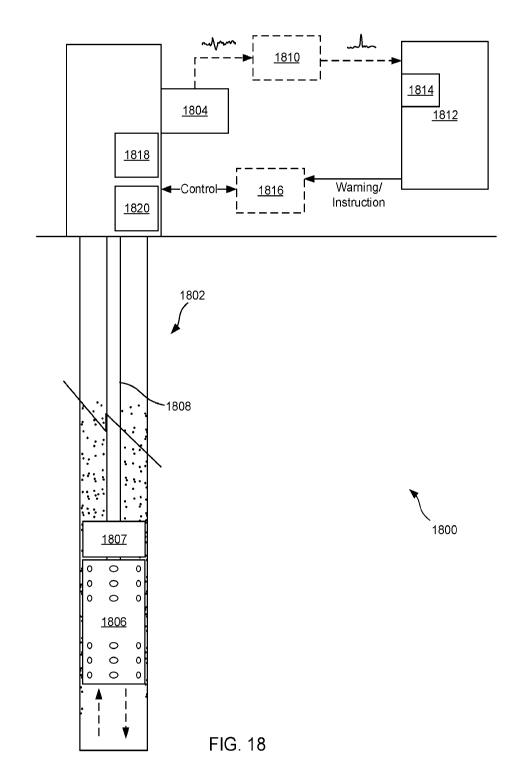
configured to
record the measured technological parameters on electronic media, and
optionally
display and visualize them on an operator's computer display. In some cases,
the CT
client 222 may be configured to access coiled tubing data from the CT Data
Acquisition
module 220, for instance, directly via the API 224. In the oil and gas
industry, coiled
tubing may refer to a long metal pipe, usually anywhere between 1 to 3.25
inches in
diameter (although other diameters are contemplated in different embodiments),
which
is supplied spooled on a reel. In some cases, coiled tubing may be used for
interventions
in oil and gas wells, as production tubing in depleted gas wells, and/or as an
alternative
to a wireline (i.e., the coiled tubing may be used to carry out operations
similar to a
wireline). In some embodiments, coiled tubing may be configured to perform
open hole
drilling and milling operations. Further, due to their high pressure tolerance
abilities
(e.g., ranging from 55,000 PSI to 120,000 PSI), they may also be utilized to
fracture a
reservoir. In some cases, one or more sensors (not shown) may be coupled to
the coiled
tubing and sent downhole. The CT Data Acquisition module 220 may collect real-
time
downhole measurements from the sensors, where the measurements may be used to
23
CA 03163348 2022-05-30
WO 2021/119306
PCT/US2020/064303
model the fatigue on the coiled tubing, predict coiled tubing performance,
fluid
behavior at modeled downhole well conditions, to name a few non-limiting
examples.
In some cases, the real-time downhole measurements collected by the CT Data
Acquisition module 220 may also be used to optimize treatments, for instance,
during
interventions (i.e., when the well is taken offline).
[0087] The spoke computers can include memory for storing electrical signals,
a current
frequency domain spectrum, or both, measured by sensors at one or more well
heads,
circulating fluid lines, or standpipes at the well pads 202-a and 202-b. The
database
230 can also include memory for storing electrical signals, a current
frequency domain
spectrum, or both, measured by sensors at one or more well heads, circulating
fluid
lines, or standpipes at the well pads 202-a and 202-b. The database 230 can
also be
configured to store frequency domain spectra measured during previous wireline
operations. The database 230 can also include previous classifications or
identifications
of wireline events associated with the previous frequency domain spectra. This
may
include a mapping between events (e.g., increased wireline friction or
wireline sticking)
and previous frequency domain spectra.
[0088] FIG. 3 illustrates a network structure 300 for multiple spoke computers
according to an
alternate embodiment of the disclosure. As illustrated, the network structure
300 may
comprise 'N' spoke computers 308, each including some or all the details shown
in the
spoke computer 308-a. In some examples, spoke computers 308 may be
electronically
and communicatively coupled to antenna systems 312. Further, each antenna
system
312 may be in communication with a hub 314. Spoke computers 308, antenna
systems
312, and hub 314 may be similar or substantially similar to spoke computers
208,
antenna systems 212, and remote hub 214, respectively, previously described in
relation
to FIG. 2. In some examples, spoke computer 308-a may be in electronic
communication with sensors (e.g., acoustic or vibration sensors) of a well pad
(shown
as well pad 202 in FIG. 2). As shown, the well pad may comprise one or more
wells
(e.g., well 302-a¨e ), each having an acoustic or vibration sensor. Further,
these sensors
may be configured to provide raw data (e.g., time domain acoustic or vibration
signal
data) to the spoke computer 308-a. In some embodiments, the spoke computers
may be
configured to wirelessly communicate with the hub 314. Furthermore, the hub
314 may
be configured to communicate with a wide area network, for instance, via an
antenna
system 312-d.
24
CA 03163348 2022-05-30
WO 2021/119306
PCT/US2020/064303
[0089] In some cases, one or more user/operator devices 305, such as
user/operator devices
305-a, 305-b, 305-c, and/or 305 may be in communication with a configuration
app
328. The configuration app (also referred to as config app 328) may be in
communication with the hub 314 and may be used to assign sensors to particular
wells
302 and/or spoke computers 308, for instance. The config app 328 may also be
used for
configuring one or more of the hub 314, the sensors, and the spoke computers
308.
[0090] FIG. 4A illustrates a drilling system 400-a including a drilling rig
401 and a wireline
truck 420. The drilling rig 401 may comprise a wellhead 425, a sensor 415
(e.g., an
acoustic or vibration sensor) in direct contact with a fluid in the well, or
alternatively,
a metal component (e.g., pipe) of the wellhead. A wireline 430 may be reeled
around a
wireline drum (not shown) within the wireline truck 420 and may thus be
supported by
and coupled to the wireline truck 420 at a first end. Furthermore, one or more
wireline
tools (e.g., natural gamma ray tool, resistivity tool, sonic and ultrasonic
tool, perforating
gun, etc.), not shown, may be coupled at a second end of the wireline 430. In
this way,
the wireline 430 may be used to run perforating guns and other equipment/tools
down
into the wellbore or borehole.
[0091] As shown, the intermediate portion of the wireline 430 may pass over a
pulley system
410 located above the wellhead 425 of the drilling rig 401. The drilling
system 400-a
may further include a line 435 spooled on a winch (not shown) adjacent a first
side of
the drilling rig. The line 435 may pass from the winch to a block located near
a top of
the drilling rig 401, down through a second pulley system 405, back up to the
block
(near the top of the rig), and back down to an anchor (not shown) adjacent a
second
side of the drilling rig. In other words, the line 435 may be winched and
anchored,
respectively, on opposing sides of the drilling rig 401. In some cases, the
line 435 may
facilitate in raising and lowering the wireline 430 in the borehole. In some
aspects, the
pulley systems 405 and 410 may form a double pulley system, wherein the line
435
may be used to control the ascent and/or descent of the wireline 430 within
the borehole
(not shown). In some other cases, the second pulley system 405 may be replaced
by a
traveling block and a hook, where the hook couples the traveling block to the
wireline
430. Similar to the embodiment with the second pulley system 405, a line 435
may be
passed down to the traveling block and hook system for raising and lowering
the
wireline 430. Thus, the block located near the top of the drilling rig and the
traveling
block may act as a block-and-tackle device to provide mechanical advantage in
raising
the lowering the wireline 430 coupled to the wireline truck 420.
CA 03163348 2022-05-30
WO 2021/119306
PCT/US2020/064303
[0092] In one or more embodiments, the line 435 may include a fast line that
extends from the
winch (i.e., adjacent a first side of the drilling rig) to the block at the
top of the drilling
rig and a deadline that extends from the same block to the anchor (i.e.,
adjacent a second
side of the drilling rig). In one or more embodiments, a supply spool may
store
additional line 435 that can be used when the line 435 has been in use for
some time
and is considered worn. In one or more embodiments, a pulley or hookload
sensor may
provides signals representative of the load imposed by the wireline 430 on the
second
pulley system 405, or alternatively, the hook. In one or more embodiments, the
pulley
or hookload sensor may be coupled to the deadline to measure the tension in
the line
435.
[0093] As discussed above, in some circumstances, the wireline 430 may become
stuck in the
well or borehole for a variety of reasons, including a collapse of the
borehole,
differential sticking in which the pressure exerted by fluids overcomes
formation
pressures causing the wireline 430 to stick to the wall of the borehole,
swelling of the
borehole, etc. Once the wireline is stuck, pulling on the wireline with a
pressure beyond
a safe limit may damage the wireline 430 or other tools/equipment in the
borehole.
[0094] In some cases, one or more drilling parameters may be monitored and
recorded and
passed on to a machine learning algorithm for analysis and classification.
Some non-
limiting examples of drilling parameters may include a value indicative of
weight-on-
bit; a value indicative of hook load; a value indicative of rate-of-
penetration; a value
indicative of rotary speed of the drill pipe; a value indicative of torque
applied to the
drill pipe; a value indicative of drilling fluid pump pressure; a value
indicative of
inclination of the drill string; a value indicative of length of drill string;
measurement-
while-drilling data; logging-while-drilling data; and a value indicative of
drilling fluid
flow rate. In some cases, the likelihood of an event (e.g., wireline sticking)
may be
determined based on comparing acoustic or vibration signatures given the
applied
drilling parameters for known wireline sticking events and those without,
described in
more detail below. In some embodiments, one or more surface-based parameters
may
be directly or indirectly read by a computer system, including, but not
limited to, a hook
load; RPM of the drill string at the surface; torque applied to the drill
string at the
surface; pressure of the drilling fluid as the drilling fluid is pumped into
the drill string;
pressure of the drilling fluid returning to the surface; and standpipe
pressure of the
drilling fluid. These surface-based parameters may also be used to predict
events, such
as wireline sticking.
26
CA 03163348 2022-05-30
WO 2021/119306
PCT/US2020/064303
[0095] FIG. 4B illustrates a system 400-b for using frequency signatures of
acoustic or
vibration data to identify equipment failures. In this illustration, one or
more sensors
404 (e.g., sensor 404-a, sensor 404-b) are coupled to pump trucks 406 (e.g.,
pump truck
406-a, pump truck 406-b), where the one or more sensors 404 may be acoustic or
vibration sensors. In some cases, the sensors 404 may be similar or
substantially similar
to the sensors 104 previously described in relation to FIG. 1. In some
embodiments, the
sensors 404 may be configured to pass raw data (e.g., time domain acoustic or
vibration
signal data) to a spoke computer 408, which may implement one or more aspects
of the
spoke computers 208 and/or 308 described in FIGs. 2 and/or 3, respectively.
Following
reception of raw sensor data, the spoke computer 408 may transmit the raw data
using
wired or wireless communication to a hub 414. Alternatively, the spoke
computer 408
may be configured to convert the raw data in the time domain to the frequency
domain,
for instance, using a FFT algorithm. As shown, the spoke computer 408 may be
configured to communicate with the hub 414 using antenna system 412-a. Antenna
systems 412 may be similar or substantially similar to the antenna systems 212
and 312
described in relation to FIGs. 2 and 3. The antenna systems 412 may comprise
one or
more of omnidirectional, Yagi, dish, and cellular antennas, to name a few non-
limiting
examples.
[0096] After hub 414 receives the data (e.g., raw data, or frequency domain
sensor data) from
spoke computer 408, it may further relay said data on to a frequency spectral
analysis
module 401 via antenna system 412-b and/or API 424. The API 424 may implement
one or more aspects of API 224 discussed in relation to HG. 2. In some
examples, for
instance, if the hub 414 receives time domain data from the spoke computer
408, the
hub 414 may transmit the time domain data to a conversion and analysis
component
and receive converted frequency domain data, prior to relaying the frequency
domain
data to the API 424.
[0097] As illustrated, the frequency spectral analysis module 401 may be
electronically and
communicatively coupled to a classification and prediction module 402. The
classification and prediction module 402 may be configured to determine if the
frequency spectrum of the raw data aligns with signatures for known failures,
such as
an equipment failure, performance degradation, or a specific equipment
condition, to
name three non-limiting examples. If such a classification occurs, then an
events and
notification module 403 may be activated. In some circumstances, the events
and
notification module 403 may be configured to issue a warning to an operator of
the
27
CA 03163348 2022-05-30
WO 2021/119306
PCT/US2020/064303
pump truck 420. Alternatively, the classification and prediction module 402
may be
configured to analyze raw time series data and determine if this raw data
aligns with
known time series signatures (e.g., for wireline friction and/or sticking). If
such a
classification occurs, the events and notification module 403 may also be
activated to
send a warning to an operator.
[0098] FIG. 5 illustrates wellhead assembly 500 comprising a wellhead 502 and
one or more
sensors. As shown, the wellhead 502 may include several interfaces for various
sensors
such as a casing pressure sensor 505, a static pressure sensor 506, a tubing
temperature
sensor 507, an acoustic or vibration sensor 504, etc. In some embodiments,
different
sensors may be provided for the tubing and the casing since these are separate
fluid
paths. It should be noted that, the sensors depicted in FIG. 5 are not
intended to be
limiting, and more or fewer sensors may be utilized in other embodiments. For
instance,
in some examples, a tubing pressure sensor may be provided in addition to the
casing
pressure sensor 505. Additionally or alternatively, a casing temperature
sensor may be
provided along with the tubing temperature sensor 507. In some embodiments,
the
herein disclosed acoustic or vibration sensor 504 may be coupled to one of the
interfaces of the wellhead 502, such that the acoustic or vibration sensor 504
is in direct
physical contact with fluid in the wellhead 502. In some examples, the
acoustic sensor
504 may comprise wireless transmission hardware for supporting communication
with
a spoke computer, hub, or wide area network (not shown).
[0099] FIG. 6 illustrates an isometric view of four offset wells 600 (e.g.,
offset wells 600-a,
600-b, 600-c, and 600-d), each including a vertical (e.g., vertical regions
603-a, 603-b,
603-c, and 603-d) and a horizontal region 604 separated by a heel 606 (e.g.,
heel 606-
a, 606-b, 606-c, 606-d). The horizontal region 604 of each offset well 600
connects a
respective heel 606 to a toe 601 (e.g., toe 601-a, toe 601-b, toe 601-c, toe
601-d). In this
example, an event 602 has occurred near the toe 601-b of the second offset
well 600-b.
An acoustic or vibration sensor as described earlier may be coupled to a top
or wellhead
of the first offset well 600-a (e.g., a wellhead, circulating fluid line, or
standpipe). In
this case, the first offset well 600-a may be referred to as the observation
well. In some
cases, the acoustic sensor at the wellhead of the first offset well 600-a may
detect the
event 602 at the second well based on detecting sound or vibrations passing
through the
underground formation separating the two offset wells 600-a and 600-b. In some
cases,
the sound or vibrations associated with the event 602 may also pass through
one or
more fractures 616 off of both wells. Because pressure or sound tend to move
more
28
CA 03163348 2022-05-30
WO 2021/119306
PCT/US2020/064303
quickly through dense rock than through fluids in a fracture or in a well,
event 602 may
be detected multiple times at the acoustic sensor. In some cases, the pressure
or sound
measured by the acoustic sensor may be recorded in a digital format as a time
series or
in the time domain, also referred to as a trace, over a given time period. In
some cases,
the sound or vibration energy recorded may be projected back to multiple
possible
points of origin for the event in the underground formation.
[00100] FIGs. 7, 8, and 9 implement one or more aspects of the figures
described herein,
including at least FIG. 6. For instance, FIGs. 6-9 show example paths (i.e.,
path 617-a,
path 617-b, path 617-c, and path 617-d) followed by the sound or vibrations
from the
event 602 to the heel 606-a of the first observation well 600-a. After
arriving at the heel
606-a of the first observation well 600-a, the sound or vibration signals may
follow the
vertical wellbore (i.e., vertical region 603-a of the first observation well)
and arrive at
different times at the acoustic sensor of the wellhead. In particular, FIG. 6
shows sound
or vibrations passing from the event 602 through fractures 616-a and 616-b of
wells
600-a and 600-b, respectively, as well as a small portion of rock between
those
fractures. In some cases, the sound or vibrations may then travel through the
horizontal
region 604 of the well 600-a towards the heel 606-a. Because much of the path
in FIG.
6 involves sound passing through fluids rather than solid rock, the path in
FIG. 6 may
be slower than the paths seen in FIGs. 7-9.
[00101] FIG. 7 shows a path slightly longer in distance than that in FIG. 6,
but one where the
sound or vibrations travel primarily through rock between the two wells 600-a
and 600-
b and then through the fluid in the well 600-a to the heel 606-a. As
previously described,
despite the longer distance traveled, the signal in FIG. 7 may arrive at the
acoustic
sensor before the signal in FIG. 6, since more of this path is through rock
than the path
seen in FIG. 6. FIGs. 8 and 9 show shorter paths than those seen in either of
FIG. 6 and
7. Further, the paths traveled by the sound or vibration from event 602 in
FIGs. 8 and
9 may be primarily through rock. The combination of an overall shorter path
length, as
well as a greater path length through rock as compared to fluid, may enable
the signals
in FIGs. 8 and 9 to reach the acoustic sensor before the signals in FIGs. 6
and 7.
[00102] It should be noted that, the specifics of the FIGs. 6 through 9 are
not as important as
the fact that the acoustic or vibration sensor at the wellhead of the first
well 600-a is
likely to hear ringing, or multiple instances of the signal (or vibrations)
associated with
event 602, where each instance arrives at a different time. In some
embodiments, this
ringing may be correlated with ringing from previously-monitored events. In
this way,
29
CA 03163348 2022-05-30
WO 2021/119306
PCT/US2020/064303
analyzing the ringing may allow a structure of the wells 600 and their
fractures 616 to
be assessed, assuming some knowledge about the rock formation. Alternatively,
if
some understanding of the wells 600 and fractures 616 is already known, an
analysis of
the ringing may help determine a structure of the rock formation. In some
cases,
deconvolution of the arriving signal may be used to separate each of the
various signals
following different paths and arriving from the event 602.
[00103] FIGs. 10-13 show a similar concept as FIGs. 6-9, but for an offset
well event 1002
occurring within or near an end of a fracture 1016. As shown, FIGs. 10-13
illustrate an
isometric view of four offset wells 1000 (e.g., offset wells 1000-a, 1000-b,
1000-c, and
1000-d), each including a vertical (e.g., vertical regions 1003-a, 1003-b,
1003-c, and
1003-d) and a horizontal region 1004 separated by a heel 1006 (e.g., heel 1006-
a, 1006-
b, 1006-c, 1006-d). The horizontal region 1004 of each offset well 1000
connects a
respective heel 1006 to a toe 1001 (e.g., toe 1001-a, toe 1001-b, toe 1001-c,
toe 1001-
d). In this example, an event 1002 has occurred within or near an end of a
fracture 1016,
where the fracture 1016 located proximal to the toe 1001-b (as opposed to the
heel
1006-b) of the second offset well 1000-b. In some cases, an acoustic or
vibration sensor
(not shown) may be coupled to a top or wellhead of the first offset well 1000-
a (e.g., at
a wellhead, circulating fluid line, or standpipe).
[00104] Additionally or alternatively, a vibration sensor (not shown) may be
attached to a
component (e.g., metal component, such as a pipe) of the wellhead. In such
cases,
vibrations felt through the metal component may also be measured and recorded.
Similar to FIGs. 6 ¨ 9, the acoustic or vibration sensor at the well head of
the
observation well (i.e., first offset well 1000-a) may hear ringing, or
multiple instances
of the signal or vibrations associated with event 1002, since each instance
may arrive
at a different time based on the amount of path length through rock, fluid,
etc. Analysis
of this ringing and time or frequency signatures obtained from the signal data
may allow
an earlier or more accurate wireline warning to be generated.
[00105] FIGs. 14-16 show different views of an exemplary spectral plot 1400
with four
frequency spikes associated with a frac initiation in an observation well,
though unique
frequency spikes can also be observed leading up to wireline sticking. This
plot was
created from actual acoustic sensor data taken over a period of time and then
converted
to a spectral plot via Fourier Transform. In this example, four frequencies
dominate
above the noise baseline and three of these spikes have relatively the same
amplitude.
In some cases, the amplitudes may correlate to a size of the fracture.
Further, these four
CA 03163348 2022-05-30
WO 2021/119306
PCT/US2020/064303
frequencies may correspond to a formation of a fracture during one stage of a
multi-
stage fracturing process. While not shown, other frequencies, or other
combinations of
frequencies may indicate other events, such as, but not limited to, an
increase in wireline
friction or wireline sticking. Furthermore, although spectral plot 1400 shows
spikes for
an event in an observation well (i.e., the well being monitored), in other
illustrations,
such spikes may represent activities in an offset well. In such cases, the
events or
activities may be transmitted through intervening rock/soil between the
observation and
offset wells.
[00106] The spectral artifacts seen in FIGs. 14-16 are exemplary only but may
be used to
illustrate the analysis of any spectrum detected by the acoustic sensors.
There may be
a separate classification for each spike or set of spikes, or an average of
two or more
spikes may be used in a classification. Each of one or more spikes may be
classified
by a max or central frequency as well as frequency width (i.e., the
bandwidth). In some
embodiments, the spectral plot showing the frequency spikes may be used to
generate
a frequency signature, where the frequency signature may be associated with
the
wireline event that caused the acoustic or vibration signals that gave the
frequency
signature. In some cases, the frequency signature may be labeled by a trained
model
and used to further train the model to identify similar frequency signatures
associated
with future events. In some embodiments, the labeling can be manual, but the
trained
model can be used to identify wireline events during wireline operations.
Changes in
the spectrum over time may also be associated with a frequency signature
(e.g., where
a frequency peak shifts at a recognizable rate).
[00107] In general, Artificial intelligence (Al) models aim to learn a
function (f(X)) which
provides the most precise correlation between input values (X) and output
values (Y),
such that Y=f(X). In some embodiments, Al models may be used to monitor and
preemptively detect impending wireline friction and sticking events, further
described
below. Further, the AT models described in this disclosure may be of a variety
of types,
for example linear regression models, logistic regression models, linear
discriminant
analysis models, decision tree models, naïve bayes models, K-nearest neighbors
models, learning vector quantization models, support vector machines, bagging
and
random forest models, and deep neural networks.
Monitoring Wireline Friction and Sticking
31
CA 03163348 2022-05-30
WO 2021/119306
PCT/US2020/064303
[00108] In some embodiments, an Al model may be trained to identify time
series signatures
or spectral signatures of wireline friction, especially, an amount or type of
friction that
is likely to lead to wireline sticking. In some cases, the Al model may be
trained via a
time sequence analysis or spectral analysis of acoustic or vibration data in a
well,
wellhead, circulating fluid line, pump line, standpipe, or other component in
fluid
communication with the well, to name a few non-limiting examples. In these
embodiments, an acoustic or vibration sensor can be arranged to monitor
signals from
components within the same well being monitored.
[00109] For instance, FIG. 17 illustrates a drilling system 1700 comprising an
exemplary well
1702 including an acoustic or vibration sensor 1704 at the wellhead that is in
direct
physical contact with fluid in the well, or alternatively, in direct contact
with a metal
component (e.g., pipe) of the wellhead. A perforation gun 1706 and plug 1707
may be
headed downhole and controlled via a wireline 1708. The acoustic or vibration
sensor
1704 may provide raw data to a machine learning component 1712, including a
model
1714, which may be configured to search for and identify any time series
signatures or
frequency signatures in the data that indicate a known condition of the
wireline, such
as increased wireline friction or sticking. Alternatively, the sensor 1704 may
be
configured to optionally (as depicted by the dashed lines) provide the raw
data to a
converter 1710 (e.g., a spectrum analyzer) arranged remotely or on-site. The
optional
converter 1710 may be configured to convert the raw data to a frequency
domain, prior
to passing this frequency spectrum information to the machine learning
component
1712.
[00110] In some circumstances, the machine learning component 1712 may observe
that the
time series data matches (or resembles) a time series signature previously
correlated to
friction that preceded a sticking event(s). For instance, wireline friction
can lead to
increased variations in signal amplitudes over time as compared to amplitude
variations
when there is less friction. In some cases, an increase in frequency and/or
amplitude of
spikes in the time domain may be indicative of a greater amount of friction
occurring,
and thus, a higher likelihood of a sticking event. In such cases, the machine
learning
component 1712 may identify a time series signature (e.g., threshold increase
in
variation over time) that corresponds to a known time series signature (i.e.,
a time series
signature discovered in a trained model of the machine learning component
1712)
associated with a particular state or event (e.g., wireline friction and
sticking). In some
embodiments, an average acoustic vibration can be measured during wireline
descent
32
CA 03163348 2022-05-30
WO 2021/119306
PCT/US2020/064303
and a current acoustic vibration can be compared to this average. If the
current acoustic
vibration exceeds the average by a threshold, then the machine learning
component
1712 can classify the current acoustic vibration as associated with excessive
wireline
friction.
[00111] When the optional converter 1710 is used, the machine learning
component 1712 may
observe that the frequency domain version of the data matches frequency
signatures
that have previously been correlated to increased friction preceding a
sticking event.
Specifically, a wireline may begin to emit particular frequencies of sound (or
other
signals) when excessive friction in the wellbore occurs. However, once jamming
or
sticking occurs, the frequencies of sound (or signals) emitted may shift, or
even
degrade/decrease. In other words, the frequencies associated with wireline
jamming
may be different from the frequencies associated with increasing friction in
the
wellbore. For instance, in some cases, the plug may be formed of a different
material
than the perforation gun (e.g., composite versus metal). In such cases, a
rubbing of these
components on walls of the wellbore may be associated with different and
unique
spectral signals since one of these two components may experience friction
sooner than
the other in a pre-jamming situation. In some cases, the degree or amount of
friction
may be associated with different frequency signals (e.g., increasing friction
may result
in an increasing amplitude of acoustic or vibration signal(s) up the wellbore
for certain
frequencies, or increasing friction may result in decreasing frequencies of
spectral
peaks, or increasing friction may result in decreasing bandwidth of one or
more spectral
peaks, to name a few non-limiting examples). Thus, the machine learning
component
1712 may identify frequency signatures that resemble or correspond to
frequency
signatures used to train the model, where the frequency signatures used to
train the
model correspond to particular states or events (e.g., wireline friction and
sticking).
[00112] In some embodiments, the machine learning component 1712 may use new
insights
from the time series data or from the converted frequency domain version of
the data,
to further train the model 1714. Additionally or alternatively, the machine
learning
component 1712 may also send a signal or indication to an operator user
interface or an
instruction to wireline equipment in response to labeling the new time series
signature
or frequency signature. For instance, a warning may be sent to an optional
operator
computer 1716 in response to the machine learning component 1712 applying a
jammed
state label to the new frequency or time series signature. In some other
cases, the
machine learning component 1712 may also send instructions to the optional
operator
33
CA 03163348 2022-05-30
WO 2021/119306
PCT/US2020/064303
computer 1716 to present a visual representation of an amount of friction on
the
computer's 1716 display. An operator can view the computer's 1716 display and
in
response, control the controllers 1718 and 1720. Alternatively, the machine
learning
component 1712 can directly control the controllers 1718 and 1720 as part of a
closed
feedback loop with or without involving the operator computer 1716. In some
embodiments, the optional operator computer 1716 may comprise a visual
display, such
as an LCD screen, a LED screen, a plasma screen, to name a few non-limiting
examples.
[00113] In some embodiments, the machine learning component 1712 can provide a
warning
and/or instructions to the operator computer 1716, and/or to the controllers
1718, 1720.
The instructions, or suggestion (with or without a warning), may include: (1)
a decrease
in wireline speed; (2) stoppage of wireline movement; (3) a reversal of
wireline speed;
(4) a lengthening of flush time; (5) a dedicated flush; and (6) use of a
smaller plug, to
name some non-limiting examples.
[00114] In some embodiments, the first controller 1718 can be configured to
control a direction
and speed of the wireline 1718. Furthermore, the second controller 1720 can be
configured to control flushing of the well 1702. In some embodiments, the
first and
second controllers 1718, 1720 may be deployed as a single controller or unit.
For
instance, the first and second controllers 1718, 1720 may be installed within
a single
housing or enclosure and may be in electronic communication with each other.
In other
cases, a single controller (not shown) may be configured to perform the
functions of
both the first and second controllers 1718, 1720.
[00115] FIG. 18 illustrates a drilling system 1800 comprising an exemplary
well 1802
including an acoustic or vibration sensor 1804 at the wellhead, according to
an
embodiment of the disclosure. FIG. 18 implements one or more aspects of FIG.
17 and
may include first and second controllers 1818 and 1820, respectively, an
operator
computer 1816, an optional converter1810 (e.g., spectral analyzer), a machine
learning
component 1812, and a model 1814. In some embodiments, the operator computer
1816
may comprise a visual display, such as an LCD screen, a LED screen, a plasma
screen,
to name a few non-limiting examples. In some aspects, FIG. 18 relates to how
friction,
sticking, and attempts to preempt sticking issues arise. The drilling system
1800 may
further comprise a wireline 1808, a plug 1807, and a perforation gun 1806. In
some
circumstances, friction and sticking can occur when the plug 1807 and/or
perforation
gun 1806 are pushed down the well 1802 or pulled up toward the surface (i.e.,
as shown
by the dashed arrows below perforation gun 1806). Friction and sticking are
often
34
CA 03163348 2022-05-30
WO 2021/119306
PCT/US2020/064303
caused by debris or solids in the well 1802, such as proppant (e.g., proppant
solids),
and in particular debris or solids between the plug 1807 and the wall of the
well 1802,
and/or between the perforation gun 1806 and the walls of the well 1802. This
type of
friction with debris or solids may generate a first frequency signature
comprising one
or more frequency peaks. However, friction between the wireline 1808 and walls
of
the wellbore 1802 can also lead to increase friction and sticking, and this
type of friction
may generate a second frequency signature comprising one or more frequency
peaks
different from those in the first frequency signature. Thus, the machine
learning
component 1812 may not only identify increased wireline friction by the
appearance of
either the first or second frequency signature, but it may also be able to
tell the
difference between the two causes of friction based on their different
frequency
signatures. And this ability to distinguish between different types of
wireline friction
allows the machine learning component 1812 to provide different warnings to
the
optional operator computer 1816 or to take different corrective measures when
instructing either or both of the controllers 1818, 1820.
[00116] In some embodiments, an average acoustic vibration can be measured
during wireline
descent and a current acoustic vibration can be compared to this average. If
the current
acoustic vibration exceeds the average by a threshold, then the machine
learning
component 1812 can classify the current acoustic vibration as associated with
excessive
wireline friction.
[00117] FIG. 20 illustrates a method 2000 for training a model to identify
wireline friction
and/or sticking events, in accordance with one or more implementations. The
operations
of method 2000 presented below are intended to be illustrative only, and non-
limiting.
In some implementations, method 2000 may be accomplished with one or more
additional operations not described, and/or without one or more of the
operations
discussed. Additionally, the order in which the operations of method 2000 are
illustrated in FIG. 20 and described below is not intended to be limiting.
[00118] In some implementations, method 2000 may be implemented in one or more
processing devices (e.g., a digital processor, an analog processor, a digital
circuit
designed to process information, an analog circuit designed to process
information, a
state machine, and/or other mechanism for electronically processing
information). The
one or more processing devices may include one or more devices executing some
or all
of the operations of method 2000 in response to instructions stored
electronically on an
electronic storage medium. The one or more processing devices may include one
or
CA 03163348 2022-05-30
WO 2021/119306
PCT/US2020/064303
more devices configured through hardware, firmware, and/or software to be
specifically
designed for execution of one or more of the operations of method 2000.
[00119] An operation 2002 may include providing an acoustic or vibration
sensor (e.g.,
acoustic or vibration sensor 1704 or 1804 in FIGs. 17 and 18) configured for
direct
physical contact with fluid within a well, or optionally direct physical
contact with a
component of the well (e.g., a pipe). For instance, the acoustic or vibration
sensor may
be affixed to a metal component of a pump or wireline truck that is in direct
physical
contact with fluid in the well or directly in contact with the wireline since
the wireline
itself can transmit acoustic and vibration data from down hole.
[00120] An operation 2004 may include acquiring acoustic or vibration data in
the fluid via the
acoustic or vibration sensor in a time domain. Operation 2004 may be performed
by
one or more hardware processors configured by machine-readable instructions
including a module that is the same as or similar to vibration data acquiring
module
1910 (as shown in FIG. 19), in accordance with one or more implementations.
[00121] In some embodiments, method 2000 may turn to operations 2006 and 2008
(shown as
optional by the dashed lines), for instance, if frequency spectrum analysis is
to be
performed on the data. Alternatively, operations 2006 and 2008 may be skipped
or
eliminated if time series data is to be analyzed. In some embodiments, an
optional
operation 2006 may include transferring the acoustic or vibration data to a
converter
such as a spectrum analyzer (e.g., spectrum analyzer 1810 in FIG. 18).
Furthermore,
optional operation 2006 may be performed by one or more hardware processors
configured by machine-readable instructions including a module that is the
same as or
similar to the acoustic vibration data transferring module 1912 (as shown in
FIG. 19),
in accordance with one or more implementations.
[00122] In some cases, a converter (e.g., spectrum analyzer) may optionally
convert the
acoustic or vibration data from the time domain to a frequency domain
(Operation
2008). Optional operation 2008 may be performed by one or more hardware
processors
configured by machine-readable instructions including a module that is the
same as or
similar to acoustic vibration data converting module 1914 (as shown in FIG.
19), in
accordance with one or more implementations.
[00123] In some cases, method 2000 may further include performing an operation
2010.
Operation 2010 may include comparing (e.g., via machine learning component
1812
described in relation to FIG. 18) the acoustic or vibration data in the time
domain (or
optionally, the frequency domain) to a model (e.g., model 1814 in FIG. 18)
trained on
36
CA 03163348 2022-05-30
WO 2021/119306
PCT/US2020/064303
time domain signatures (or frequency signatures) corresponding to known
incidences
of wireline friction and/or sticking. In some cases, the model 1814 may be an
example
of an Al model or a data comparing model. In some embodiments, operation 2010
may
be performed by one or more hardware processors configured by machine-readable
instructions including a module that is the same as or similar to data
comparing module
1916 (as shown in FIG. 19), in accordance with one or more implementations.
[00124] As shown, method 2000 may further include performing an operation
2012, where
operation 2012 may include assigning one of a plurality of labels to the
acoustic or
vibration data in the time domain (or frequency domain) based on the
comparing. The
plurality of labels may include an excessive wireline friction state (where
wireline
friction exceeds a threshold) and/or a sticking state, to name two non-
limiting examples.
Operation 2012 may be performed by one or more hardware processors configured
by
machine-readable instructions including a module that is the same as or
similar to label
assignment module 1918 (as shown in FIG. 19), in accordance with one or more
implementations.
[00125] In some cases, for instance, if the friction state label is assigned,
an operation 2014
may include generating a first indication on an operator display (e.g., a
display of
operator computers 1716 and/or 1816 shown in FTGs. 17 and/or 18, respectively)
or
changing a speed and/or direction of the wireline via the controllers (e.g.,
controllers
1818, 1820 in FIG. 18) until new acoustic or vibration data (i.e., in the time
series or
frequency domain) falls within parameters of an optimal set of known time
series or
frequency signatures. In one non-limiting example, the indication may merely
indicate
one of the state, the state and instructions, or suggestions for responding to
the friction
state. Further, the suggested responses may include reducing a speed of
descent of the
wireline, stopping motion of the wireline, reversing a direction of the
wireline,
increasing a flush time, performing a dedicated flush, or using a smaller
plug, to name
a few non-limiting examples. In this example, operation 2014 may also include
autonomously controlling the controllers 1718, 1720, or 1818, 1820 as shown in
FIGs.
17 and/or 18, respectively, and causing them to perform one of the above-noted
responses/actions. In some cases, autonomous control of the controllers may
not
involve displaying the above-noted responses/actions on the display of the
operator
computer 1716, 1816, or soliciting user input from the operator. In other
cases,
operation 2014 may include providing an indication on the display of the
operator
computers 1716, 1816, and optionally requesting a confirmation from the
operator. In
37
CA 03163348 2022-05-30
WO 2021/119306
PCT/US2020/064303
some cases, the operator may provide input confirming or rejecting the
suggested
control/responses via one or more user input devices of the operator computer,
such as
a keyboard, a mouse, a joystick, voice control, gesture control, etc. In some
examples,
operation 2014 may be performed by one or more hardware processors configured
by
machine-readable instructions including a module that is the same as or
similar to
indication generating module 1920, wireline direction adjusting module 1922,
and/or
wireline speed adjusting module 1924, in accordance with one or more
implementations.
[00126] In some embodiments, if the sticking state label is assigned, an
operation 2016 may
include generating a second indication on an operator display (e.g., display
of operator
computers 1716 and/or 1816 described in relation to FIGs. 17 and/or 18) or
changing a
speed and/or direction of the wireline via the controllers 1718, 1720, 1818,
or 1820
until new acoustic or vibration data in the time series or frequency domain
falls within
parameters of an optimal set of known time series or frequency signatures (or
at least a
set of known time series or frequency signatures indicating that the wireline
is no longer
sticking). For instance, the indication may indicate one of the state, the
state and
instructions, or suggestions for responding to the sticking state. In some
cases, the
suggested responses may include withdrawing the wireline, or decoupling the
wireline
from the plug and optionally from the perforation gun, as well. In some
embodiments,
operation 2016 may also include controlling the controllers 1718, 1720, or
1818, 1820
and causing them to perform one of the above-noted responses/actions without
involving the operator display 1716, 1816 (i.e., autonomous control), or one
of the
above-noted responses/actions plus providing an indication on the operator
display
1716, 1816 (i.e., manual or semi-autonomous control). In some examples,
operation
2016 may be performed by one or more hardware processors configured by machine-
readable instructions including a module that is the same as or similar to
indication
generating module 1920, wireline direction adjusting module 1922, and/or
wireline
speed adjusting module 1924, further described in relation to FIG. 19, in
accordance
with one or more implementations.
[00127] While not shown in FIG. 20, in some embodiments, the method 2000 may
further
include optionally training the model with acoustic or vibration data in the
time or
frequency domain using the one of the plurality of labels and the acoustic or
vibration
data in the time domain or frequency domain. In some cases, this optional
operation
may be performed by one or more hardware processors configured by machine-
readable
38
CA 03163348 2022-05-30
WO 2021/119306
PCT/US2020/064303
instructions including a module that is the same as or similar to model
training module
1930, further described below in relation to FIG. 19, in accordance with one
or more
implementations
[00128] FIG. 21 illustrates a flowchart 2100 related to a method for training
a model to identify
wireline friction and/or sticking events, in accordance with one or more
implementations. Flowchart 2100 may implement one or more aspects of the
figures
described herein, including at least FIGs. 17-20. As shown, the flowchart 2100
can
include collecting high frequency acoustic (or vibration data) at an acoustic
(or
vibration) sensor (Block 2102). In some embodiments, an acoustic or vibration
sensor,
similar to acoustic or vibration sensor 1704 or 1804 in FIG. 17 or 18, may be
installed
in direct communication with fluid in an observation well, for instance, at
the well head,
a circulating fluid line, the standpipe, or a pumping truck, to name two non-
limiting
examples. The acoustic or vibration sensor may be configured to perform the
collecting
and transmit or relay the data to a model, such as model 1814 in FIG. 18.
[00129] As shown, at Block 2104, the data from the acoustic sensor can be fed
into the model,
wherein the model may be configured to identify time series or spectral
signatures in
the data that match known acoustic (or vibration) behavior of an event, such
as wireline
friction preceding a sticking event or a jamming event. In other words, prior
to the start
of the method in flowchart 2100, the model may be trained to recognize a time
series
signal or spectral signal associated with certain wireline events, including a
wireline
sticking event. This training can be based on previous frequency spectra
associated with
previous excessive wireline friction events or wireline sticking events. In
some
embodiments, at Block 2106, the model may then classify or identify the event,
for
instance, by matching the sensor data with one or more categories of events.
[00130] At Block 2108, the results data associated with the event may be
collected, where the
results data may include any data type that is related to (or a consequence
of) the event
classified at Block 2106. For instance, knowledge of a wireline getting stuck
may be
one example of results data for acoustic or vibration data that preceded or
occurred at
the time of the sticking. In some embodiments, at Block 2110, the model may
find
correlations between the results data and the classified event data. In some
cases,
multiple sets of results data may be correlated to a single classified event.
After one or
more correlations (if any) have been made, the model may be configured to
learn from
(i.e., be trained using) the correlations at Block 2112. As shown, after Block
2112, the
method may return to Block 2102 and restart. In other words, the flowchart
2100 may
39
CA 03163348 2022-05-30
WO 2021/119306
PCT/US2020/064303
be an example of a closed-loop feedback system, where the model is
continuously
trained using newly acquired sensor data. In some cases, one or more of the
blocks
(2102,2104, 2106, 2108, 2110, 2112) may be repeated to continually update the
model.
In this way, the training model described in this disclosure may refine its
ability to
accurately detect and model events. In some cases, the model can then be used
to
identify events and states based on acquired acoustic or vibration data in the
time
domain (or alternatively in the frequency domain where a time-to-frequency
conversion
has taken place as discussed earlier).
[00131] In some embodiments, the model can be trained on data unrelated to
wireline events.
This could be performed to help the model identify spectral signatures
unrelated to
wireline events and thereby more quickly and more accurately identify spectral
signatures that are related to wireline events. For instance, such training
may be used
to form a model that knows that spectral indicators below a certain threshold
freuqency
are primarily related to movement of water through a formation and not
wireline events.
Accordingly, the model may be able to focus on higher frequency data when
looking
for wireline events in the future. This is just an illustrative example, and
not intended
to limit the scope of the disclosure.
[00132] FIG. 22 illustrates a method 2200 directed to using acoustic or
vibration data at a well,
in conjunction with a model configured for analyzing a time series or
frequency
spectrum of the acoustic or vibration data, to identify related events. Method
2200 may
implement one or more aspects of the figures described herein, including at
least FIGs.
17-21. As shown, at Block 2202, the method 2200 may include installing an
acoustic
sensor in direct communication with fluid in an observation well. Additionally
or
alternatively, the method 2200 may include installing a vibration sensor in
direct
contact with a component of the well, such as a pipe. In some other cases, the
sensor
(e.g., acoustic, vibration sensor) may be placed in direct communication with
fluid in a
pumping truck, the wireline, or another fluid line of the fracking operation.
[00133] At Block 2204, the method 2200 may comprise monitoring the acoustic or
vibration
signal via the sensor, as previously described in relation to FIGs. 1-5 and 17-
18.
Furthermore, at Block 2206, the method 2200 may comprise performing a wireline
fracking operation (e.g., lowering or raising the perforation gun and plug),
as described
in relation to FIGs. 17-18. In some embodiments, at Block 2208, the sensor may
be
configured to provide data that is converted from the time domain to the
frequency
domain through a Fourier Transform or other transform algorithm (e.g., as
embodied in
CA 03163348 2022-05-30
WO 2021/119306
PCT/US2020/064303
a spectrum analyzer). It should be noted that, the conversion of the acoustic
signal from
the time domain to the frequency domain at 2208 is an optional step, as
denoted by the
dashed lines for the box.
[00134] In some cases, at Block 2210, the method 2200 may comprise analyzing
the time series
(or optionally the frequency spectrum of the transformed acoustic or vibration
data)
using a model to identify known activities and states such as wireline
friction or
wireline sticking, to name two non-limiting examples. While not shown, in some
cases,
the analysis may comprise labeling or categorizing the data, where the labeled
or
categorized data may be used to further train the model, as previously
described in
relation to FIG. 21.
[00135] In some examples, once the acoustic signal in the frequency domain or
time domain
has been classified or labeled, the method 2200 may comprise automatically
controlling
a fracking operation, such as a direction of travel of the wireline, to adjust
a state of the
fracking operation at Block 2212. For instance, in response to an excessive
friction state
(i.e., friction exceeding a threshold) of the wireline. the method 2200 may
comprise
instructing the well (e.g., through first controller 1718) to reverse a
direction of the
wireline or decrease a lowering speed. Alternatively, or in parallel. the
method 2200
may comprise providing feedback to an operator computer (e.g., operator
computer
1816 in FIG. 18) based on the label or classification. In one non-limiting
example, the
method 2200 may include providing an update to a wireline friction curve that
an
operator is using to control a direction and speed of the perforation gun via
the wireline.
In another example, the method 2200 may comprise sending a warning regarding a
likely sticking event to an operator computer, as well as a suggestion for
remedial action
(e.g., reduce, halt, or reverse a descent of the perforation gun and plug;
e.g., a suggestion
to withdraw the plug and send a smaller diameter plug down hole; e.g., a
suggestion to
increase a flush time or perform a dedicated flush).
[00136] FIG. 19 illustrates a computing system 1900 configured for
preemptively identifying
signs of eminent wireline sticking, in accordance with one or more
implementations. In
some implementations, computing system 1900 may include one or more computing
platforms 1902. Computing platform(s) 1902 may be configured to communicate
with
one or more remote platforms 1904 according to a client/server architecture, a
peer-to-
peer architecture, and/or other architectures. Remote platform(s) 1904 may be
configured to communicate with other remote platforms via computing
platform(s)
41
CA 03163348 2022-05-30
WO 2021/119306
PCT/US2020/064303
1902 and/or according to a client/server architecture, a peer-to-peer
architecture, and/or
other architectures. Users may access system 1900 via remote platform(s) 1904.
[00137] Computing platform(s) 1902 may be configured by machine-readable
instructions
1906. Machine-readable instructions 1906 may include one or more instruction
modules. The instruction modules may include computer program modules. The
instruction modules may include one or more of acoustic/vibration data
acquiring
module 1910, acoustic/vibration data transferring module 1912, optional
acoustic/vibration data converting module 1914, data comparing module 1916,
label
assignment module 1918, indication generating module 1920, wireline direction
adjusting module 1922, wireline speed adjusting module 1924, model training
module
1930, and/or other instruction modules.
[00138] In some embodiments, acoustic or vibration sensor(s) 1908 may be in
communication
with the computing platform(s) 1902 and may be configured to provide raw data
to the
processor(s) 1938. Furthermore, the acoustic or vibration sensor(s) 1908 may
be
configured to be in direct physical contact with fluid within a well (or
direct physical
contact with a component of the well, such as a pipe). In some cases, the
acoustic or
vibration sensor(s) 1908 may be designed for high frequency applications
(e.g., having
greater than 1000 sample/second rate). In an embodiment, the acoustic or
vibration
sensor 1908 may include a piezoelectric material configured to generate a
current or
voltage proportional to an amplitude of vibration of the piezoelectric
material.
[00139] Acoustic/vibration data acquiring module 1910 may be configured to
acquire acoustic
or vibration data in a time domain from the sensor(s) 1908.
[00140] Acoustic/vibration data transferring module 1912 may be configured to
transfer the
acoustic or vibration data to a data comparing module, for instance, when time
series
data is analyzed. Alternatively, the acoustic or vibration data transferring
module 1912
may be configured to transfer the data to a spectrum analyzer (i.e., when
frequency
spectrum data is used for analysis). It should be noted that, the spectrum
analyzer may
or may not be part of the same computing platform that various other modules
in FIG.
19 are on. For instance, the spectrum analyzer may be a stand-alone unit
separate from
the computing platform 1902.
[00141] In some embodiments, the computing system 1900 may comprise an
optional
acoustic/vibration data converting module 1914, wherein the acoustic/vibration
data
converting module 1914 may be configured to convert the acoustic or vibration
data
from the time domain to a frequency domain, for instance, via the spectrum
analyzer.
42
CA 03163348 2022-05-30
WO 2021/119306
PCT/US2020/064303
[00142] Data comparing module 1916 may be configured to compare the acoustic
or vibration
data in the time series (or alternatively, in the frequency domain) to a model
trained on
time series signatures (or frequency signatures) corresponding to known
incidences of
wireline friction and sticking. In some examples, training the model may
include
building or updating a wireline friction curve. By way of non-limiting
example, the
comparing may comprise considering a recorded/measured amplitude versus a
baseline
or steady state amplitude, and/or evaluating a variation in frequency
components of the
acoustic or vibration data. In another non-limiting example, the comparing may
consider a number of frequency spikes, a width of the frequency spikes, and an
amplitude of the frequency spikes in the frequency signatures. In other words,
under
normal operation, the acoustic or vibration data may have a consistent set of
one or
more frequency components in the spectral regime. However, when friction
begins to
build, the one or more frequency components may change or increase in number,
which
may be indicative of increased friction. Increased amplitude, rate of
amplitude spikes,
or variation in amplitudes over time in the time domain may also be analyzed
in the
comparing.
[00143] Label assignment module 1918 may be configured to assign one of a
plurality of labels
to the acoustic or vibration data in the time series (or frequency domain)
based on the
comparing. By way of non-limiting example, the plurality of labels may include
an
excessive wireline friction state or a wireline sticking state.
[00144] In some cases, for instance, if the excessive friction state label is
assigned, an
indication generating module 1920 may be configured to generate and display a
first
indication on an operator display suggesting a reduction in wireline speed, a
reversal of
wireline direction (e.g., up instead of downhole), or use of a smaller plug.
Additionally,
if a sticking state is assigned, the indication generating module 1920 may be
configured
to generate and display a second indication on an operator display, wherein
the second
indication may suggest initiation of fishing procedures.
[00145] In some embodiments, in response to the excessive friction state
label, a wireline
direction adjusting module 1922 may be configured to reverse a direction of
the
wireline until new acoustic or vibration data in the time series (or frequency
domain)
fall within parameters of an optimal set of known time series signatures or
frequency
domain signatures, or until the excessive friction state label is no longer
assigned.
[00146] In some cases, in response to the excessive friction state label,
wireline speed adjusting
module 1924 may be configured to decrease a lowering speed of the wireline
until new
43
CA 03163348 2022-05-30
WO 2021/119306
PCT/US2020/064303
acoustic or vibration data in the time series (or frequency domain) fall
within
parameters of an optimal set of known time series signatures (or frequency
signatures),
or until the excessive friction state label is no longer assigned.
[00147] While not shown, the machine-readable instructions 1906 may also
include, or may
replace one or more of wireline direction adjusting module 1922 and wireline
speed
adjusting module 1924 with: an increased flush time module; a perform
dedicated flush
module; and/or a smaller plug module. Any one or more of these optional
modules may
be called on to control the wireline, which may further assist in minimizing
the risk of
excessive friction and/or sticking.
[00148] In some embodiments, model training module 1930 may be configured to
train the
model of acoustic or vibration data in the time series (or frequency domain)
using the
one of the plurality of labels and the acoustic or vibration data in the time
series (or
frequency domain).
[00149] In some implementations, computing platform(s) 1902, remote
platform(s) 1904,
and/or external resources 1934 may be operatively linked via one or more
electronic
communication links. For example, such electronic communication links may be
established, at least in part, via a network such as the Internet and/or other
networks. It
will be appreciated that this is not intended to be limiting, and that the
scope of this
disclosure includes implementations in which computing platform(s) 1902,
remote
platform(s) 1904, and/or external resources 1934 may be operatively linked via
some
other communication media.
[00150] A given remote platform 1904 may include one or more processors
configured to
execute computer program modules. The computer program modules may be
configured to enable an expert or user associated with the given remote
platform 1904
to interface with system 1900 and/or external resources 1934, and/or provide
other
functionality attributed herein to remote platform(s) 1904. By way of non-
limiting
example, a given remote platform 1904 and/or a given computing platform 1902
may
include one or more of a server, a desktop computer, a laptop computer, a
handheld
computer, a tablet computing platform, a NetBook, a Smartphone, a gaming
console,
and/or other computing platforms.
[00151] External resources 1934 may include sources of information outside of
system 1900,
external entities participating with system 1900, and/or other resources. For
instance,
external data may be fed into the model to help with initial training. In some
44
CA 03163348 2022-05-30
WO 2021/119306
PCT/US2020/064303
implementations, some or all of the functionality attributed herein to
external resources
1934 may be provided by resources included in system 1900.
[00152] Computing platform(s) 1902 may include electronic storage 1936, one or
more
processors 1938, and/or other components. Computing platform(s) 1902 may
include
communication lines, or ports to enable the exchange of information with a
network
and/or other computing platforms. Illustration of computing platform(s) 1902
in FIG.
19 is not intended to be limiting. Computing platform(s) 1902 may include a
plurality
of hardware, software, and/or firmware components operating together to
provide the
functionality attributed herein to computing platform(s) 1902. For example,
computing
platform(s) 1902 may be implemented by a cloud of computing platforms
operating
together as computing platform(s) 1902.
[00153] Electronic storage 1936 may comprise non-transitory storage media that
electronically
store information. The electronic storage media of electronic storage 1936 may
include
one or both of system storage that is provided integrally (i.e., substantially
non-
removable) with computing platform(s) 1902 and/or removable storage that is
removably connectable to computing platform(s) 1902 via, for example, a port
(e.g., a
USB port, a firewire port, etc.) or a drive (e.g., a disk drive, etc.).
Electronic storage
1936 may include one or more of optically readable storage media (e.g.,
optical disks,
etc.), magnetically readable storage media (e.g., magnetic tape, magnetic hard
drive,
floppy drive, etc.), electrical charge-based storage media (e.g., EEPROM, RAM,
etc.),
solid-state storage media (e.g., flash drive, etc.), and/or other
electronically readable
storage media. Electronic storage 1936 may include one or more virtual storage
resources (e.g., cloud storage, a virtual private network, and/or other
virtual storage
resources). Electronic storage 1936 may store software algorithms, information
determined by processor(s) 1938, information received from computing
platform(s)
1902, information received from remote platform(s) 1904, and/or other
information that
enables computing platform(s) 1902 to function as described herein.
[00154] Processor(s) 1938 may be configured to provide information processing
capabilities
in computing platform(s) 1902. As such, processor(s) 1938 may include one or
more of
a digital processor, an analog processor, a digital circuit designed to
process
information, an analog circuit designed to process information, a state
machine, and/or
other mechanisms for electronically processing information. Although
processor(s)
1938 is shown in FIG. 19 as a single entity, this is for illustrative purposes
only. In
some implementations, processor(s) 1938 may include a plurality of processing
units.
CA 03163348 2022-05-30
WO 2021/119306
PCT/US2020/064303
These processing units may be physically located within the same device, or
processor(s) 1938 may represent processing functionality of a plurality of
devices
operating in coordination. Processor(s) 1938 may be configured to execute
modules
1910, 1912, 1914, 1916, 1918, 1920, 1922, 1924, and/or 1930, and/or other
modules.
Processor(s) 1938 may be configured to execute modules 1910, 1912, 1914, 1916,
1918, 1920, 1922, 1924, and/or 1930, and/or other modules by software;
hardware;
firmware; some combination of software, hardware, and/or firmware; and/or
other
mechanisms for configuring processing capabilities on processor(s) 1938. As
used
herein, the term "module" may refer to any component or set of components that
perform the functionality attributed to the module. This may include one or
more
physical processors during execution of processor readable instructions, the
processor
readable instructions, circuitry, hardware, storage media, or any other
components.
[00155] It should be appreciated that although modules 1910, 1912, 1914, 1916,
1918, 1920,
1922, 1924, and/or 1930 are illustrated in FIG. 19 as being implemented within
a single
processing unit, in implementations in which processor(s) 1938 includes
multiple
processing units, one or more of modules 1908, 1910, 1912, 1914, 1916, 1918,
1920,
1922, 1924, 1926, 1928, and/or 1930 may be implemented remotely from the other
modules. The description of the functionality provided by the different
modules 1910,
1912, 1914, 1916, 1918, 1920, 1922, 1924, and/or 1930 described below is for
illustrative purposes, and is not intended to be limiting, as any of modules
1910, 1912,
1914, 1916, 1918, 1920, 1922, 1924, and/or 1930 may provide more or less
functionality than is described. For example, one or more of modules 1910,
1912, 1914,
1916, 1918, 1920, 1922, 1924, and/or 1930 may be eliminated, and some or all
of its
functionality may be provided by other ones of modules 1910, 1912, 1914, 1916,
1918,
1920, 1922, 1924, and/or 1930. As another example, processor(s) 1938 may be
configured to execute one or more additional modules that may perform some or
all of
the functionality attributed below to one of modules 1910, 1912, 1914, 1916,
1918,
1920, 1922, 1924, and/or 1930.
Additional Embodiments (Monitoring Positive Displacement Motor Torque and
Drill Bit Wear)
[00156] In some cases, rotary and coiled tubing drilling often uses a positive
displacement
motor (PDM) to rotate the drill bit. A PDM is a downhole tool that uses
hydraulic power
from fluid flowing therethrough to drive a drill bit. During drilling
operations, the
46
CA 03163348 2022-05-30
WO 2021/119306
PCT/US2020/064303
unloaded PDM rotates at a constant RPM and achieves a "freespin" motor
pressure,
with respect to the fluid flow rate. As the drill bit encounters the bottom of
the hole and
force is transferred to the bit, referred to as weight-on-bit (WOB), the motor
will sense
an increase in torque. The increase in torque is a result of increased
resistance to rotating
at the constant RPM (assuming a constant flow rate). In turn, the PDM requires
additional pressure to turn the motor at the constant RPM while under
increased
resistance. If the resistance increases to a condition which prohibits the PDM
from
rotating (i.e., excessive WOB), a motor stall is encountered. Stalling usually
occurs
when the application of excessive weight on bit or hole sloughing stops the
bit from
rotating and when the power section of the drilling motor is not capable of
providing
enough torque to power through. During a motor stall, the motor stops turning,
the
downhole fluid path is severely restricted, and the surface pump pressure
dramatically
increases. This pressure increase is developed because the rotor is no longer
able to
rotate inside the stator, forming a long seal between the two. If fluid
circulation
continues during a stall, the drilling fluid forces its way through the power
section by
deflecting the stator rubber. Drilling fluid will still circulate through the
motor, but the
bit will not turn. Operating in this state will erode and possibly chunk the
stator in a
very short period of time, resulting in extensive damage. If the PDM is
damaged, the
drilling process will be stopped, and the coiled tubing will be fatigue-cycled
as the bit
is pulled off bottom and run back into the hole to start drilling again.
[00157] To avoid stalls and damage to the drill bits or PDM, each PDM has a
specification
sheet that provides a user with information about the operation of the PDM,
and
sometimes includes a torque curve to help operators to maximize drilling
effectiveness
while avoiding damage to the motor or drill bit. The torque curve may identify
a
differential pressure versus rotations per minute ("RPM") and/or torque curve
for the
PDM at a given flow rate through the PDM. As the differential pressure
increases, the
RPM generally decrease toward zero, at which point the PDM stalls.
[00158] Since it can be difficult to determine when a PDM is near stalling or
when one has
pushed past the Full Load line on a torque curve, accurate understanding of
PDM
operation and location on torque may serve to optimize drilling operations. In
some
circumstances, incomplete knowledge about the PDM and drill head may also lead
to
drill bit wear/damage and PDM wear/damage. For instance, inefficient bottom
hole
cleaning may lead to wear on the drill bit and vibrations that decrease the
efficiency of
drilling. Likewise, after a certain value of rotary speed has been met, Rate
of
47
CA 03163348 2022-05-30
WO 2021/119306
PCT/US2020/064303
Penetration (ROP) decelerates as the bit starts skating on top of the rock
rather than
getting good penetration of the cutting structure. This can be caused by
instability of
the drilling assembly in the wellbore.
[00159] Via spectral analysis of acoustic or vibrational data in a well, pump
line, or other
component in fluid communication with the well, one can use a trained model to
identify spectral signatures of activities and conditions to help peer through
the "fog"
that traditional operators face while evaluating motor torque and drill bit
wear. In these
embodiments, an acoustic or vibrational sensor can be arranged to monitor
signals from
components within the same well being monitored.
[00160] FIG. 23 illustrates an exemplary well 2302 including an acoustic or
vibrational sensor
2304 at the wellhead that is in direct physical contact with fluid in the
well. A PDM
2306 may drive rotation of a drill bit 2308 at a bottom of the well 2302.
Further, the
acoustic or vibrational sensor 2304 may provide raw data to a spectrum
analyzer 2310
arranged remotely or on-site. The spectrum analyzer 2310 may be configured to
convert the raw data to a frequency domain. A machine learning component 2312,
including a model 2314, can search for and identify any frequency signatures
in the
frequency domain version of the data that indicate a known condition of the
PDM or
drill bit. For instance, the machine learning component 2312 may observe that
the
frequency domain version of the data matches frequency signatures that have
previously been correlated to a stalled state of the PDM or an excessive wear
condition
of the drill bit. Specifically, a PDM may begin to emit particular frequencies
of sound
when stalling, and then entirely different frequencies once stalled (e.g.,
since the drill
bit is no longer turning, but fluid is still being pumped through the stator).
Similarly,
when a drill bit begins to approach an excessive wear state, it may begin to
emit a
unique acoustic signature. As another example, near a stalling state, the PDM
may start
to vibrate emitting a unique frequency signature. Thus, the machine learning
component 2312 may identify frequency signatures that correspond to frequency
signatures used to train the model and/or to particular states or events.
[00161] The machine learning component 2312 may be configured to use any new
insights
from the converted frequency domain version of the data to further train the
model
2314. It may be also be configured to send a signal or instruction in response
to labeling
of the new frequency signature. For instance, if it applies a stalled state
label to the new
frequency signature, then a warning may be sent to an optional operator
computer 2316.
In some other cases, the machine learning component 2312 may also send
instructions
48
CA 03163348 2022-05-30
WO 2021/119306
PCT/US2020/064303
to the optional operator computer 2316 to visualize a point on a torque curve
on the
optional computer's 2316 display. For instance, as the new frequency signature
changes (e.g., as a PDM moves from optimum, to stalling, to stalled), the
machine
learning component 2312 may instruct the optional operator computer 2316 to
visualize
said changes on the displayed torque curve. In response, the operator may
instruct the
well to adjust fluid flow through a fluid flow controller 2318 and/or to
adjust weight on
bit via a weight on bit controller 2320. Alternatively, the machine learning
component
2312 may be configured to directly control the controllers 2318 and 2320, with
or
without involving the optional operator computer 2316, as a closed feedback
loop.
[00162] In an embodiment, the model 2314 can be trained to recognize spectral
signatures
corresponding to one or more states of the drill bit, including, but not
limited to, a stalled
state, a stalling state, an optimal state, a sub-optimal state, and a zero-
weight state. Once
acoustic or vibrational data is converted to the frequency domain, the model
2314 can
classify the spectral signature according to one or more labels including, but
not limited
to, a stalled state label, a stalling state label, an optimal state label, a
sub-optimal state
label, and a zero-weight state label.
[00163] Although this discussion has often used operating states of a PDM as
illustrative
examples, one of skill in the art will appreciate that these systems, methods,
and
apparatus can be applied to a variety of different diagnostics within the
drilling space.
For instance, but not to limit this disclosure, the herein disclosed systems,
methods, and
apparatus for spectral analysis and machine learning of acoustic signatures
can be
applied to the following: drill bit wear; drill bit damage; PDM damage; PDM
lifetime;
casing wear; drill string buckling; drill string centering in the bore; drill
bit stick slip
condition; drill string tension; weight on bit; type of formation that bit is
drilling
through; relative hardness of formation that bit is drilling though;
effectiveness of
debris removal from drill bit; effectiveness of debris removal from entire
wellbore;
pump chunking; pump truck damage; pump truck failure; drill string sticking;
coiled
tubing sticking; coiled tubing collapse; coiled tubing pin hole damage;
excessive coiled
tubing pressure; corrosion; hydraulic fracturing screenout; perforation
effectiveness;
perforation cluster efficiency; frack pumping effectiveness; and proppant
effectiveness.
[00164] FIG. 24 illustrates a method of training a model to identify fracking
events or states.
The method 2400 can include collecting high frequency acoustic or vibrational
data at
an acoustic sensor (Block 2402). The data from the acoustic sensor can be fed
into a
model (Block 2404) and the model can identify spectral aspects of the data
that match
49
CA 03163348 2022-05-30
WO 2021/119306
PCT/US2020/064303
known acoustic behavior of an event (e.g., PDM stalling, drill bit wear, pump
chunking). In other words, the model will have been previously trained to
recognize a
spectral signal associated with certain events. The model can then classify
the event,
for instance, by matching the sensor data with one or more categories of
events (Block
2406). In some examples, results data associated with the event can be taken
(Block
2408), where the results data includes any data type that is a consequence of
the event
classified in Block 2406. For instance, knowledge that a PDM has broken or
stalled
can be results data for acoustic or vibrational data that preceded or occurred
at the time
of the break or stall. As another example, severely reduced drilling depth
rate may be
results data for an acoustic or vibrational data set classified as a stall
event. The model
can then find correlations between the results data and the classified event
data (Block
2410). In some cases multiple sets of results data can be correlated to a
single classified
event. After any correlations have been made, the model can learn from, or be
trained
on the correlations (Block 2412), and the method 2400 can restart. These
blocks can be
repeated to continually train the model. The model can then be used to
identify events
and states based on acquired acoustic or vibrational data that may or may not
have been
transformed to the frequency domain.
[00165] FIG. 25 illustrates a method 2500 for optimizing drill head positive
displacement
motor torque, in accordance with one or more implementations. The operations
of
method 2500 presented below are intended to be illustrative. In some
implementations,
method 2500 may be accomplished with one or more additional operations not
described, and/or without one or more of the operations discussed.
Additionally, the
order in which the operations of method 2500 are illustrated in FIG. 25 and
described
below is not intended to be limiting.
[00166] In some implementations, method 2500 may be implemented in one or more
processing devices (e.g., a digital processor, an analog processor, a digital
circuit
designed to process information, an analog circuit designed to process
information, a
state machine, and/or other mechanisms for electronically processing
information). The
one or more processing devices may include one or more devices executing some
or all
of the operations of method 2500 in response to instructions stored
electronically on an
electronic storage medium. The one or more processing devices may include one
or
more devices configured through hardware, firmware, and/or software to be
specifically
designed for execution of one or more of the operations of method 2000.
CA 03163348 2022-05-30
WO 2021/119306
PCT/US2020/064303
[00167] An operation 2502 may include providing an acoustic or vibrational
sensor configured
for direct physical contact with fluid within a well.
[00168] An operation 2504 may include acquiring acoustic or vibration data in
the fluid via the
acoustic or vibrational sensor in a time domain. Operation 2504 may be
performed by
one or more hardware processors configured by machine-readable instructions
including a module that is the same as or similar to vibration data acquiring
module, in
accordance with one or more implementations.
[00169] An operation 2506 may include transferring the acoustic or vibration
data to a
spectrum analyzer. Operation 2506 may be performed by one or more hardware
processors configured by machine-readable instructions including a module that
is the
same as or similar to acoustic vibration data transferring module 2612, shown
in FIG.
26, in accordance with one or more implementations.
[00170] An operation 2508 may include converting the acoustic or vibration
data from the time
domain to a frequency domain via the spectrum analyzer. Operation 2508 may be
performed by one or more hardware processors configured by machine-readable
instructions including a module that is the same as or similar to acoustic
vibration data
converting module 2614, shown in FIG. 26, in accordance with one or more
implementations. This operation 2008 may also be carried out via a spectrum
analyzer.
[00171] An operation 2510 may include comparing the acoustic or vibration data
in the
frequency domain to a model trained on frequency signatures corresponding to
known
incidences of positive displacement motor stalling and/or low positive
displacement
motor torque. Operation 2510 may be performed by one or more hardware
processors
configured by machine-readable instructions including a module that is the
same as or
similar to data comparing module 2616, shown in FIG. 26, in accordance with
one or
more implementations.
[00172] An operation 2512 may include assigning one of a plurality of labels
to the acoustic
or vibration data in the frequency domain based on the comparing. The
plurality of
labels may include a stalled state label, an optimal state label, a sub-
optimal state label,
and a zero-weight state label. Operation 2512 may be performed by one or more
hardware processors configured by machine-readable instructions including a
module
that is the same as or similar to label assignment module 2618, shown in FIG.
26, in
accordance with one or more implementations.
[00173] An operation 2514 may include if the stalled state label is assigned,
then generating a
first indication on an operator display suggesting a reduction in fluid flow
to the drill
51
CA 03163348 2022-05-30
WO 2021/119306
PCT/US2020/064303
head and/or weight on bit. Operation 2514 may be performed by one or more
hardware
processors configured by machine-readable instructions including a module that
is the
same as or similar to indication generating module 2620, shown in FIG. 26, in
accordance with one or more implementations.
[00174] An operation 2516 may include if the sub-optimal state label or zero-
weight state label
is assigned, then generating a second indication on the operator display
suggesting an
increase in fluid flow to the drill head and/or weight on bit. Operation 2516
may be
performed by one or more hardware processors configured by machine-readable
instructions including a module that is the same as or similar to indication
generating
module 2620, adjusting module 2622, flow decrease module 2626 (i.e., for
controlling
fluid flow) and/or a weight on bit increasing module, in accordance with one
or more
implementations.
[00175] The method 2500 may further include, in response to the stalled state
label, the sub-
optimal state label, or the zero-weight state label, adjusting weight on bit
and/or fluid
flow to the drill head until new acoustic or vibration data in the frequency
domain falls
within parameters of an optimal set of known frequency signatures or is
assigned the
optimal state label. Operation 2518 may be performed by one or more hardware
processors configured by machine-readable instructions including a module that
is the
same as or similar to weight adjusting module 2622, weight decrease module
2624,
and/or a flow decrease module 2626 in accordance with one or more
implementations.
Additionally or alternatively, a fluid flow and/or a weight on bit increasing
module may
be utilized to perform operation 2518.
[00176] The method 2500 may further include, in response to the stalled state
label, decreasing
a weight on bit. Operation 2520 may be performed by one or more hardware
processors
configured by machine-readable instructions including a module that is the
same as or
similar to adjusting module 2622 or weight decrease module 2624, in accordance
with
one or more implementations.
[00177] The method 2500 may further include, in response to the stalled state
label, decreasing
fluid flow to the drill head. Operation 2522 may be performed by one or more
hardware
processors configured by machine-readable instructions including a module that
is the
same as or similar to adjusting module 2622 or flow decrease module 2626, in
accordance with one or more implementations.
[00178] The method 2500 may further include, in response to the sub-optimal
state label or
zero-weight state label, increasing weight on bit and/or fluid flow to the
drill head.
52
CA 03163348 2022-05-30
WO 2021/119306
PCT/US2020/064303
Operation 2524 may be performed by one or more hardware processors configured
by
machine-readable instructions including a module that is the same as or
similar to
adjusting module 2622, in accordance with one or more implementations.
Alternatively, a fluid flow and/or a weight on bit increasing module may be
utilized to
perform 2524.
[00179] The method 2500 may further include training the model of acoustic or
vibration data
in the frequency domain using the one of the plurality of labels and the
acoustic or
vibration data in the frequency domain. Operation 2526 may be performed by one
or
more hardware processors configured by machine-readable instructions including
a
module that is the same as or similar to model training module 2630, in
accordance
with one or more implementations.
[00180] FIG. 26 illustrates a computing system 2600 configured for optimizing
drill head
positive displacement motor torque, in accordance with one or more
implementations.
In some implementations, system 2600 may include one or more computing
platforms
2602. Computing platform(s) 2602 may be configured to communicate with one or
more remote platforms 2604 according to a client/server architecture, a peer-
to-peer
architecture, and/or other architectures. Remote platform(s) 2604 may be
configured to
communicate with other remote platforms via computing platform(s) 2602 and/or
according to a client/server architecture, a peer-to-peer architecture, and/or
other
architectures. Users may access system 2600 via remote platform(s) 2604.
[00181] Computing platform(s) 2602 may be configured by machine-readable
instructions
2606. Machine-readable instructions 2606 may include one or more instruction
modules. The instruction modules may include computer program modules. The
instruction modules may include one or more of vibration data acquiring module
2610,
acoustic vibration data transferring module 2612, acoustic vibration data
converting
module 2614, data comparing module 2616, label assignment module 2618,
indication
generating module 2620, weight adjusting module 2622, weight decrease module
2624,
flow decrease module 2626, drill head increasing module 2628, model training
module
2630, and/or other instruction modules, such as a fluid flow and/or a weight
on bit
increasing module.
[00182] Acoustic or vibrational sensor(s) 2608 can be in communication with
the computing
platform(s) 2602 and provide raw data to the processor(s) 2638. The acoustic
or
vibration sensor(s) 2608 can be configured for direct physical contact with
fluid within
a well. The sensor(s) 2608 can be high frequency (e.g., having greater than
1000
53
CA 03163348 2022-05-30
WO 2021/119306
PCT/US2020/064303
sample/second rate, although other sampling rates are contemplated in
different
embodiments). The acoustic or vibrational sensor 2608 may include a
piezoelectric
material configured to generate a current or voltage proportional to an
amplitude of
vibration of the piezoelectric material.
[00183] Vibration data acquiring module 2610 may be configured to acquire
acoustic or
vibration data in a time domain from the sensor(s) 2608.
[00184] Acoustic vibration data transferring module 2612 may be configured to
transfer the
acoustic or vibration data to a spectrum analyzer. The spectrum analyzer may
or may
not be part of the same computing platform that various other modules in FIG.
26 are
on.
[00185] Acoustic vibration data converting module 2614 may be configured to
convert the
acoustic or vibration data from the time domain to a frequency domain via the
spectrum
analyzer.
[00186] Data comparing module 2616 may be configured to compare the acoustic
or vibration
data in the frequency domain to a model trained on frequency signatures
corresponding
to known incidences of various positive displacement motor states such as
stalling,
optimum torque, sub-optimum torque, and zero-weight conditions. Training the
model
may include building or updating a torque curve. By way of non-limiting
example, the
comparing may consider a number of frequency spikes, a width of the frequency
spikes,
and an amplitude of the frequency spikes in the frequency signatures.
[00187] Label assignment module 2618 may be configured to assign one of a
plurality of labels
to the acoustic or vibration data in the frequency domain based on the
comparing. By
way of non-limiting example, the plurality of labels may include a stalled
state label,
an optimal state label, a sub-optimal state label, and a zero-weight state
label.
[00188] Indication generating module 2620 may be configured to, if the stalled
state label is
assigned, then generate a first indication on an operator display suggesting a
reduction
in fluid flow to the drill head and/or reduction in weight on bit.
[00189] Indication generating module 2620 may be configured to, if the sub-
optimal state label
or zero-weight state label is assigned, then generate a second indication on
the operator
display suggesting an increase in fluid flow to the drill head and/or weight
on bit.
[00190] Adjusting module 2622 may be configured to, in response to the stalled
state label, the
sub-optimal state label, or the zero-weight state label, adjust weight on bit
and/or fluid
flow to the drill head until new acoustic or vibration data in the frequency
domain falls
54
CA 03163348 2022-05-30
WO 2021/119306
PCT/US2020/064303
within parameters of an optimal set of known frequency signatures or is
assigned the
optimal state label.
[00191] Weight decrease module 2624 may be configured to, in response to the
stalled state
label, decrease a weight on bit.
[00192] Flow decrease module 2626 may be configured to, in response to the
stalled state label,
decrease fluid flow to the drill head.
[00193] Drill head increasing module 2628 may be configured to, in response to
the sub-
optimal state label or zero-weight state label, increase weight on bit and/or
fluid flow
to the drill head. In some other cases, one or more of a fluid flow increasing
module
and a weight on bit increasing module may be configured to perform a same or
similar
function as the drill head increasing module 2628.
[00194] Model training module 2630 may be configured to train the model of
acoustic or
vibration data in the frequency domain using the one of the plurality of
labels and the
acoustic or vibration data in the frequency domain.
[00195] In some implementations, computing platform(s) 2602, remote
platform(s) 2604,
and/or external resources 2634 may be operatively linked via one or more
electronic
communication links. For example, such electronic communication links may be
established, at least in part, via a network such as the Internet and/or other
networks. It
will be appreciated that this is not intended to be limiting, and that the
scope of this
disclosure includes implementations in which computing platform(s) 2602,
remote
platform(s) 2604, and/or external resources 2634 may be operatively linked via
some
other communication media.
[00196] A given remote platform 2604 may include one or more processors
configured to
execute computer program modules. The computer program modules may be
configured to enable an expert or user associated with the given remote
platform 2604
to interface with system 2600 and/or external resources 2634, and/or provide
other
functionality attributed herein to remote platform(s) 2604. By way of non-
limiting
example, a given remote platform 2604 and/or a given computing platform 2602
may
include one or more of a server, a desktop computer, a laptop computer, a
handheld
computer, a tablet computing platform, a NetBook, a Smartphone, a gaming
console,
and/or other computing platforms.
[00197] External resources 2634 may include sources of information outside of
system 2600,
external entities participating with system 2600, and/or other resources. For
instance,
external data may be fed into the model to help with initial training. In some
CA 03163348 2022-05-30
WO 2021/119306
PCT/US2020/064303
implementations, some or all of the functionality attributed herein to
external resources
2634 may be provided by resources included in system 2600.
[00198] Computing platform(s) 2602 may include electronic storage 2636, one or
more
processors 2638, and/or other components. Computing platform(s) 2602 may
include
communication lines, or ports to enable the exchange of information with a
network
and/or other computing platforms. Illustration of computing platform(s) 2602
in FIG.
26 is not intended to be limiting. Computing platform(s) 2602 may include a
plurality
of hardware, software, and/or firmware components operating together to
provide the
functionality attributed herein to computing platform(s) 2602. For example,
computing
platform(s) 2602 may be implemented by a cloud of computing platforms
operating
together as computing platform(s) 2602.
[00199] Electronic storage 2636 may comprise non-transitory storage media that
electronically
stores information. The electronic storage media of electronic storage 2636
may include
one or both of system storage that is provided integrally (i.e., substantially
non-
removable) with computing platform(s) 2602 and/or removable storage that is
removably connectable to computing platform(s) 2602 via, for example, a port
(e.g., a
USB port, a firewire port, etc.) or a drive (e.g., a disk drive, etc.).
Electronic storage
2636 may include one or more of optically readable storage media (e.g.,
optical disks,
etc.), magnetically readable storage media (e.g., magnetic tape, magnetic hard
drive,
floppy drive, etc.), electrical charge-based storage media (e.g., EEPROM, RAM,
etc.),
solid-state storage media (e.g., flash drive, etc.), and/or other
electronically readable
storage media. Electronic storage 2636 may include one or more virtual storage
resources (e.g., cloud storage, a virtual private network, and/or other
virtual storage
resources). Electronic storage 2636 may store software algorithms, information
determined by processor(s) 2638, information received from computing
platform(s)
2602, information received from remote platform(s) 2604, and/or other
information that
enables computing platform(s) 2602 to function as described herein.
[00200] Processor(s) 2638 may be configured to provide information processing
capabilities
in computing platform(s) 2602. As such, processor(s) 2638 may include one or
more of
a digital processor, an analog processor, a digital circuit designed to
process
information, an analog circuit designed to process information, a state
machine, and/or
other mechanisms for electronically processing information. Although
processor(s)
2638 is shown in FIG. 26 as a single entity, this is for illustrative purposes
only. In
some implementations, processor(s) 2638 may include a plurality of processing
units.
56
CA 03163348 2022-05-30
WO 2021/119306
PCT/US2020/064303
These processing units may be physically located within the same device, or
processor(s) 2638 may represent processing functionality of a plurality of
devices
operating in coordination. Processor(s) 2638 may be configured to execute
modules
2608, 2610, 2612, 2614, 2616, 2618, 2620, 2622, 2624, 2626, 2628, 2630, and/or
2632,
and/or other modules. Processor(s) 2638 may be configured to execute modules
2608,
2610, 2612, 2614, 2616, 2618, 2620, 2622,2624, 2626, 2628, 2630, and/or 2632,
and/or
other modules by software; hardware; firmware; some combination of software,
hardware, and/or firmware; and/or other mechanisms for configuring processing
capabilities on processor(s) 2638. As used herein, the term "module" may refer
to any
component or set of components that perform the functionality attributed to
the module.
This may include one or more physical processors during execution of processor
readable instructions, the processor readable instructions, circuitry,
hardware, storage
media, or any other components.
[00201] It should be appreciated that although modules 2608, 2610, 2612, 2614,
2616, 2618,
2620, 2622, 2624, 2626, 2628, 2630, and/or 2632 are illustrated in FIG. 26 as
being
implemented within a single processing unit, in implementations in which
processor(s)
2638 includes multiple processing units, one or more of modules 2608, 2610,
2612,
2614, 2616, 2618, 2620, 2622, 2624, 2626, 2628, 2630, and/or 2632 may be
implemented remotely from the other modules. The description of the
functionality
provided by the different modules 2608, 2610, 2612, 2614, 2616, 2618, 2620,
2622,
2624, 2626, 2628, 2630, and/or 2632 described below is for illustrative
purposes, and
is not intended to be limiting, as any of modules 2608, 2610, 2612, 2614,
2616, 2618,
2620, 2622, 2624, 2626, 2628, 2630, and/or 2632 may provide more or less
functionality than is described. For example, one or more of modules 2608,
2610, 2612,
2614, 2616, 2618, 2620, 2622, 2624, 2626, 2628,2630, and/or 2632 may be
eliminated,
and some or all of its functionality may be provided by other ones of modules
2608,
2610, 2612, 2614, 2616, 2618, 2620, 2622, 2624, 2626, 2628, 2630, and/or 2632.
As
another example, processor(s) 2638 may be configured to execute one or more
additional modules that may perform some or all of the functionality
attributed below
to one of modules 2608, 2610, 2612, 2614, 2616, 2618, 2620, 2622, 2624, 2626,
2628,
2630, and/or 2632.
Additional Embodiments
57
CA 03163348 2022-05-30
WO 2021/119306
PCT/US2020/064303
[00202] In some examples of the method, system, computing platform, and non-
transient
computer-readable storage medium described herein, the acoustic vibrations are
caused
by the wireline rubbing against walls of a borehole.
[00203] In some examples of the method, system, computing platform, and non-
transient
computer-readable storage medium described herein the sensor samples at
greater than
1 kHz. In some examples of the method, system, and non-transient computer-
readable
storage medium described herein the sensor is an acoustic sensor.
[00204] In some examples of the method, system, computing platform, and non-
transient
computer-readable storage medium described herein the converter uses a Fast-
Fourier
transform to convert the electrical signal in a window of time into a current
frequency
domain spectrum.
[00205] In some examples of the method, system, computing platform, and non-
transient
computer-readable storage medium described herein the machine-learning system
considers one or more of a number of frequency spikes in the current frequency
domain
spectrum, a width of one or more frequency spikes in the current frequency
domain
spectrum, and an amplitude of the one or more frequency spikes in the current
frequency domain spectrum.
[00206] In some examples of the method, system, computing platform, and non-
transient
computer-readable storage medium described herein the machine-learning system
is
trained on frequency domain spectra measured during previous hydraulic
fracturing
operations as a machine-learning input and associated well outcomes as machine-
learning outputs. In some examples of the method, system, computing platform,
and
non-transient computer-readable storage medium described herein the machine-
learning system is trained on previous frequency domain spectra as a machine-
learning
input and associated wireline sticking events as a machine-learning output. In
some
examples of the method, system, computing platform, and non-transient computer-
readable storage medium described herein the machine-learning system is
trained to
classify the current frequency domain spectrum on a grouping of previous
frequency
domain spectra measured during previous wireline operations that most closely
matches
the current frequency domain spectra
[00207] In some examples of the method, system, computing platform, and non-
transient
computer-readable storage medium described herein the associated wireline
sticking
events comprise a full sticking event. In some examples of the method, system,
computing platform, and non-transient computer-readable storage medium
described
58
CA 03163348 2022-05-30
WO 2021/119306
PCT/US2020/064303
herein the machine-learning system is trained on wireline sticking events as a
machine-
learning input and associated previous frequency domain spectra as a machine-
learning
output. In some examples of the method, system, computing platform, and non-
transient computer-readable storage medium described herein the machine-
learning
system is configured to classify based on a grouping of frequency domain
spectra
measured during previous wireline operations that most closely match the
current
frequency domain spectra. In some examples of the method, system, computing
platform, and non-transient computer-readable storage medium described herein
the
machine-learning system is further configured to analyze the electrical signal
for the
window of time in the time domain in conjunction with analyzing the current
frequency
domain spectrum to classify the current frequency domain spectrum
[00208] In some examples of the method, system, computing platform, and non-
transient
computer-readable storage medium described herein the sensor is configured to
be in
contact with the fluid in the well or with a surface of a circulating fluid
line or standpipe
at the wellhead. In some examples of the method, system, computing platform,
and
non-transient computer-readable storage medium described herein the sensor is
configured to be in contact with the fracking fluid in the well or with a
surface of the
circulating fluid line or the standpipe at the wellhead.
[00209] In some examples of the method, system, computing platform, and non-
transient
computer-readable storage medium described herein: one or more of the sensor
and the
machine-learning system is configured to measure and analyze pressure sensor
data
during the window of time. In some examples of the method, system, computing
platform, and non-transient computer-readable storage medium described herein
the
machine-learning system is configured to classify the current frequency domain
spectrum as associated with a start or end of plug transport down the well. In
some
examples of the method, system, computing platform, and non-transient computer-
readable storage medium described herein the converter is on a local converter
and the
current frequency domain spectrum is transported via a large area network to a
remote
server hosting the machine-learning system. In some examples of the method,
system,
computing platform, and non-transient computer-readable storage medium
described
herein the electrical signal is transported via a large area network to a
remote converter
configured to convert the electrical signal in the window of time into the
current
frequency domain spectrum.
59
CA 03163348 2022-05-30
WO 2021/119306
PCT/US2020/064303
[00210] In some examples of the method, system, computing platform, and non-
transient
computer-readable storage medium described herein wireline friction is
identified by
an increase in a number or width of frequency peaks in the current frequency
domain
spectrum, or alternatively, a decrease in the number or width of frequency
peaks in the
current frequency domain spectrum.
[00211] In some examples of the method, system, computing platform, and non-
transient
computer-readable storage medium described herein: the converter is a spectrum
analyzer. In some embodiments, the system may further comprise a wellbore with
a
casing; and a fracking pump.
[00212] In some examples of the method and non-transient computer-readable
storage medium
described herein the analyzing considers a number of frequency spikes in the
current
frequency domain spectrum, a width of one or more frequency spikes in the
current
frequency domain spectrum, and/or an amplitude of the frequency spikes in the
current
frequency domain spectrum. In some examples of the method and non-transient
computer-readable storage medium described herein the converting comprises a
Fast-
Fourier transform.
[00213] In some examples of the method and non-transient computer-readable
storage medium
described herein the machine-learning system is trained on previous frequency
domain
spectra as a machine-learning input and associated wireline sticking events as
a
machine-learning output. In some examples of the method and non-transient
computer-
readable storage medium described herein the classifying is based on a
grouping of
frequency domain spectra measured during previous wireline operations that
most
closely matches the current frequency domain spectra. In some examples of the
method
and non-transient computer-readable storage medium described herein the
machine-
learning system is trained on wireline sticking events as a machine-learning
input and
associated previous frequency domain spectra as a machine-learning output.
[00214] In some examples of the method and non-transient computer-readable
storage medium
described herein the classifying is based on a grouping of frequency domain
spectra
measured during previous wireline operations that most closely match the
current
frequency domain spectra.
[00215] In some examples of the method and non-transient computer-readable
storage medium
described herein, the method further comprises analyzing the electrical signal
for the
window of time in the time domain in conjunction with analyzing the current
frequency
domain spectrum to perform the classifying. In some examples of the method and
non-
CA 03163348 2022-05-30
WO 2021/119306
PCT/US2020/064303
transient computer-readable storage medium described herein, the method
further
comprises analyzing the electrical signal for the window of time in the time
domain and
using this in addition to the analyzing the current frequency domain spectrum
to
perform the classifying. In some examples of the method and non-transient
computer-
readable storage medium described herein, the performing the classifying is
based at
least in part on an analysis of pressure sensor data during the window of
time.
[00216] In some examples of the method and non-transient computer-readable
storage medium
described herein, the method further comprises classifying the current
frequency
domain spectrum as associated with a start or end of plug transport down the
well. In
some examples of the method and non-transient computer-readable storage medium
described herein, the converting is performed on a local converter and the
current
frequency domain spectrum is transported via a large area network to a remote
server
hosting the machine-learning system. In some examples of the method and non-
transient computer-readable storage medium described herein the electrical
signal is
transported via a large area network to a remote converter for performing the
converting.
[00217] In some examples of the method and non-transient computer-readable
storage medium
described herein, the method further comprises adjusting parameters of
subsequent
wireline operations to change how a subsequent frequency domain spectrum is
classified. In some examples of the method and non-transient computer-readable
storage medium described herein the classifying is based on the acoustic
vibrations
increasing a threshold level above an average of acoustic vibrations during
wireline
descent.
[00218] In some examples of the method and non-transient computer-readable
storage medium
described herein, increased wireline friction is identified by an increase in
a number or
width of frequency peaks in the current frequency domain spectrum. For
instance, the
increased wireline friction may be identified based at least in part on
identifying the
increase in the number or width of frequency peaks in the current frequency
domain
spectrum.
[00219] In some examples of the method, system, computing platform, and non-
transient
computer-readable storage medium described herein the parameter of the
wireline
operation is perforation gun pressure.
61
CA 03163348 2022-05-30
WO 2021/119306
PCT/US2020/064303
[00220] In some examples of the method, system, computing platform, and non-
transient
computer-readable storage medium described herein the parameter of the
wireline
operation is fracking stage duration.
[00221] In some examples of the method, system, computing platform, and non-
transient
computer-readable storage medium described herein the parameter of the
wireline
operation is a pressure of fluid forced into a subterranean formation.
[00222] In some examples of the method, system, computing platform, and non-
transient
computer-readable storage medium described herein the parameter of the
wireline
operation is pH of the fracking fluid pumped into the well. In some examples
of the
method, system, computing platform, and non-transient computer-readable
storage
medium described herein the parameter of the wireline operation is a length of
flush
time.
[00223] One aspect of the present disclosure relates to a system configured
for optimizing drill
head positive displacement motor torque. The system may include one or more
hardware processors configured by machine-readable instructions. The
processor(s)
may be configured to provide an acoustic or vibration sensor configured for
direct fluid
communication with fluid within a well. The processor(s) may be configured to
acquire
acoustic or vibration data in the fluid via the acoustic or vibration sensor
in a time
domain. The processor(s) may be configured to transfer the acoustic or
vibration data
to a spectrum analyzer. The processor(s) may be configured to convert the
acoustic or
vibration data from the time domain to a frequency domain via the spectrum
analyzer.
The processor(s) may be configured to compare the acoustic or vibration data
in the
frequency domain to a model trained on frequency signatures corresponding to
known
incidences of positive displacement motor stalling and/or low positive
displacement
motor torque. The processor(s) may be configured to assign one of a plurality
of labels
to the acoustic or vibration data in the frequency domain based on the
comparing. The
plurality of labels may include a stalled state label, an optimal state label,
a sub-optimal
state label, and a zero-weight state label. The processor(s) may be configured
to, if the
stalled state label is assigned, then generate a first indication on an
operator display
suggesting a reduction in fluid flow to the drill head and/or weight on bit.
The
processor(s) may be configured to, if the sub-optimal state label or zero-
weight state
label is assigned, then generate a second indication on the operator display
suggesting
an increase in fluid flow to the drill head and/or weight on bit.
62
CA 03163348 2022-05-30
WO 2021/119306
PCT/US2020/064303
[00224] Another aspect of the present disclosure relates to a method for
optimizing drill head
positive displacement motor torque. The method may include providing an
acoustic or
vibration sensor configured for direct fluid communication with fluid within a
well. The
method may include acquiring acoustic or vibration data in the fluid via the
acoustic or
vibration sensor in a time domain. The method may include transferring the
acoustic or
vibration data to a spectrum analyzer. The method may include converting the
acoustic
or vibration data from the time domain to a frequency domain via the spectrum
analyzer. The method may include comparing the acoustic or vibration data in
the
frequency domain to a model trained on frequency signatures corresponding to
known
incidences of positive displacement motor stalling and/or low positive
displacement
motor torque. The method may include assigning one of a plurality of labels to
the
acoustic or vibration data in the frequency domain based on the comparing. The
plurality of labels may include a stalled state label, an optimal state label,
a sub-optimal
state label, and a zero-weight state label. The method may include, if the
stalled state
label is assigned, then generating a first indication on an operator display
suggesting a
reduction in fluid flow to the drill head and/or weight on bit. The method may
include,
if the sub-optimal state label or zero-weight state label is assigned, then
generating a
second indication on the operator display suggesting an increase in fluid flow
to the
drill head and/or weight on bit.
[00225] Yet another aspect of the present disclosure relates to a non-
transient computer-
readable storage medium having instructions embodied thereon, the instructions
being
executable by one or more processors to perform a method for optimizing drill
head
positive displacement motor torque. The method may include providing an
acoustic or
vibration sensor configured for direct fluid communication with fluid within a
well. The
method may include acquiring acoustic or vibration data in the fluid via the
acoustic or
vibration sensor in a time domain. The method may include transferring the
acoustic or
vibration data to a spectrum analyzer. The method may include converting the
acoustic
or vibration data from the time domain to a frequency domain via the spectrum
analyzer. The method may include comparing the acoustic or vibration data in
the
frequency domain to a model trained on frequency signatures corresponding to
known
incidences of positive displacement motor stalling and/or low positive
displacement
motor torque. The method may include assigning one of a plurality of labels to
the
acoustic or vibration data in the frequency domain based on the comparing. The
plurality of labels may include a stalled state label, an optimal state label,
a sub-optimal
63
CA 03163348 2022-05-30
WO 2021/119306
PCT/US2020/064303
state label, and a zero-weight state label. The method may include, if the
stalled state
label is assigned, then generating a first indication on an operator display
suggesting a
reduction in fluid flow to the drill head and/or weight on bit. The method may
include,
if the sub-optimal state label or zero-weight state label is assigned, then
generating a
second indication on the operator display suggesting an increase in fluid flow
to the
drill head and/or weight on bit.
[00226] Still another aspect of the present disclosure relates to a computing
platform
configured for optimizing drill head positive displacement motor torque. The
computing platform may include a non-transient computer-readable storage
medium
having executable instructions embodied thereon. The computing platform may
include
one or more hardware processors configured to execute the instructions. The
processor(s) may execute the instructions to provide an acoustic or vibration
sensor
configured for direct fluid communication with fluid within a well. The
processor(s)
may execute the instructions to acquire acoustic or vibration data in the
fluid via the
acoustic or vibration sensor in a time domain. The processor(s) may execute
the
instructions to transfer the acoustic or vibration data to a spectrum
analyzer. The
processor(s) may execute the instructions to convert the acoustic or vibration
data from
the time domain to a frequency domain via the spectrum analyzer. The
processor(s)
may execute the instructions to compare the acoustic or vibration data in the
frequency
domain to a model trained on frequency signatures corresponding to known
incidences
of positive displacement motor stalling and/or low positive displacement motor
torque.
The processor(s) may execute the instructions to assign one of a plurality of
labels to
the acoustic or vibration data in the frequency domain based on the comparing.
The
plurality of labels may include a stalled state label, an optimal state label,
a sub-optimal
state label, and a zero-weight state label. The processor(s) may execute the
instructions
to, if the stalled state label is assigned, then generate a first indication
on an operator
display suggesting a reduction in fluid flow to the drill head and/or weight
on bit. The
processor(s) may execute the instructions to, if the sub-optimal state label
or zero-
weight state label is assigned, then generate a second indication on the
operator display
suggesting an increase in fluid flow to the drill head and/or weight on bit.
[00227] Even another aspect of the present disclosure relates to a system
configured for
optimizing drill head positive displacement motor torque. The system may
include
means for providing an acoustic or vibration sensor configured for direct
fluid
communication with fluid within a well. The system may include means for
acquiring
64
CA 03163348 2022-05-30
WO 2021/119306
PCT/US2020/064303
acoustic or vibration data in the fluid via the acoustic or vibration sensor
in a time
domain. The system may include means for transferring the acoustic or
vibration data
to a spectrum analyzer. The system may include means for converting the
acoustic or
vibration data from the time domain to a frequency domain via the spectrum
analyzer.
The system may include means for comparing the acoustic or vibration data in
the
frequency domain to a model trained on frequency signatures corresponding to
known
incidences of positive displacement motor stalling and/or low positive
displacement
motor torque. The system may include means for assigning one of a plurality of
labels
to the acoustic or vibration data in the frequency domain based on the
comparing. The
plurality of labels may include a stalled state label, an optimal state label,
a sub-optimal
state label, and a zero-weight state label. The system may include means for,
if the
stalled state label is assigned, then generating a first indication on an
operator display
suggesting a reduction in fluid flow to the drill head and/or weight on bit.
The system
may include means for, if the sub-optimal state label or zero-weight state
label is
assigned, then generating a second indication on the operator display
suggesting an
increase in fluid flow to the drill head and/or weight on bit.
[00228] Some portions of the present disclosure are presented in terms of
algorithms or
symbolic representations of operations on data bits or binary digital signals
stored
within a computing system memory, such as a computer memory. These algorithmic
descriptions or representations are examples of techniques used by those of
ordinary
skill in the data processing arts to convey the substance of their work to
others skilled
in the art. An algorithm is a self-consistent sequence of operations or
similar processing
leading to a desired result. In this context, operations or processing
involves physical
manipulation of physical quantities. Typically, although not necessarily, such
quantities
may take the form of electrical or magnetic signals capable of being stored,
transferred,
combined, compared or otherwise manipulated. It has proven convenient at
times,
principally for reasons of common usage, to refer to such signals as bits,
data, values,
elements, symbols, characters, terms, numbers, numerals or the like. It should
be
understood, however, that all of these and similar terms are to be associated
with
appropriate physical quantities and are merely convenient labels. Unless
specifically
stated otherwise, it is appreciated that throughout this specification
discussions utilizing
terms such as "processing," "computing," "calculating," "determining," and
"identifying" or the like refer to actions or processes of a computing device,
such as
one or more computers or a similar electronic computing device or devices,
that
CA 03163348 2022-05-30
WO 2021/119306
PCT/US2020/064303
manipulate or transform data represented as physical electronic or magnetic
quantities
within memories, registers, or other information storage devices, transmission
devices,
or display devices of the computing platform.
[00229] As will be appreciated by one skilled in the art, aspects of the
present disclosure may
be embodied as a system, method or computer program product. Accordingly,
aspects
of the present disclosure may take the form of an entirely hardware
embodiment, an
entirely software embodiment (including firmware, resident software, micro-
code,
etc.), or an embodiment combining software and hardware aspects that may all
generally be referred to herein as a "circuit," "module" or "system."
Furthermore,
aspects of the present disclosure may take the form of a computer program
product
embodied in one or more computer readable medium(s) having computer readable
program code embodied thereon.
[00230] As used herein, the recitation of "at least one of A, B and C" is
intended to mean "either
A, B, C or any combination of A, B and C." The previous description of the
disclosed
embodiments is provided to enable any person skilled in the art to make or use
the
present disclosure. Various modifications to these embodiments will be readily
apparent to those skilled in the art, and the generic principles defined
herein may be
applied to other embodiments without departing from the spirit or scope of the
disclosure. Thus, the present disclosure is not intended to be limited to the
embodiments shown herein but is to be accorded the widest scope consistent
with the
principles and novel features disclosed herein.
66