Note: Descriptions are shown in the official language in which they were submitted.
WO 2021/226392
PCT/US2021/031173
SYSTEMS AND METHODS FOR DETECTING PROXIMITY EVENTS
PRIORITY APPLICATION
100011 This application claims the benefit of U.S. Provisional
Patent Application No.
63/022,343 filed 08 May 2020, which application is incorporated herein by
reference.
BACKGROUND
Field
[00021 The present invention relates to systems that identify
and track puts and takes of
items by subjects in real space.
Description of Related Art
[00031 Technologies have been developed to apply image
processing to identify and track
actions of subjects in real space. For example, so-called cashier-less
shopping systems are being
developed with identify inventory items that have been picked up by the
shoppers, and automatically
accumulate shopping lists that can be used to bill the shoppers.
[00041 There are many locations in stores that can hold
inventory items, and act in an
exchange as one or both of a source of an inventory item or a sink of an
inventory item. These
locations are referred to herein as inventory caches. Examples of inventory
caches include shelfs on
inventory display structures, peg boards. baskets, bins, and other physical
locations in the stores that
typically do not move during a shopping episode. Other examples of inventory
caches include
shoppers hands, the crook of a shopper's elbow, a shopping bag or a shopping
cart having locations
in the store which move over time.
[00051 Tracking exchanges of inventory items in a store
involving customers, such as a
people in a shopping store, present many technical challenges. For example,
consider such an image
processing system deployed in a shopping store with multiple customers moving
in aisles between
the shelves and open spaces within the shopping store. Customer interactions
can include takes of
items from shelves (i.e a fixed inventory cache) and placing them in their
respective shopping carts
or baskets (i.e. a moving inventory cache). Customers may also put items back
on the shelf in an
CA 03177772 2022- 11-3
WO 2021/226392
PCT/US2021/031173
2
exchange from a moving inventory cache to a fixed inventory cache, if they do
not want the item.
The customers can also transfer items in their hands to the hands of other
customers who may then
put these items in their shopping carts or baskets in an exchange between two
moving inventory
caches. The customer can also simply touch inventory items, without an
exchange of the inventory
items.
[0006] It is desirable to provide a technology that solves
technological challenges involved
in effectively and automatically identifying and tracking exchanges of
inventory items, including
puts, takes and transfers, in large spaces.
SUMMARY
[0007] A system, and method for operating a system, are provided
for detecting and
classifying exchanges of inventory items in an area of real space. This
function of detection and
classifying of exchanges of inventory items by image processing presents a
complex problem of
computer engineering, relating to the type of image data to be processed, what
processing of the
image data to perform, and how to determine actions from the image data with
high reliability. The
system described herein can in some embodiments perform these functions using
only images from
sensors, such as cameras disposed overhead in the real space, so that no
retrofitting of store shelves
and floor space with sensors and the like is required for deployment in a
given setting. In other
embodiments, a variety of configurations of sensors deployed in the area of
real space can be
utilized.
[0008] A system, method and computer program product are
described, for tracking
exchanges of inventory items between inventory caches which can act as at
least one of sources and
sinks of inventory items in exchanges of inventory items, including first
processing a plurality of
sequences of images, in which sequences of images in the plurality of
sequences of images have
respective fields of view in the real space, to locate inventory caches which
move over time having
locations in three dimensions; accessing data to locate inventory caches on
inventory display
structures in the area of real space; second processing the located inventory
caches over time to
detect a proximity event between the located inventory caches, the proximity
event having a location
in the area of real space and a time; and third processing images in at least
one sequence of images
CA 03177772 2022- 11-3
WO 2021/226392
PCT/US2021/031173
3
in the plurality of sequences of images before and after the time of the
proximity event to classify an
exchange of an inventory item in the proximity event.
100091 A system, method and computer program product are
provided for detecting
proximity events in an area of real space, where a proximity event is an event
in which a moving
inventory cache is located in proximity with another inventory cache, which
can be moving or
stationary. The system and method for detecting proximity events can use a
plurality of sensors to
produce a plurality of sequences of images, in which sequences of images in
the plurality of
sequences of images have respective fields of view in the real space. In
advantageous systems, the
field of view of each sensor overlaps with the field of view of at least one
other sensor in the
plurality of sensors. The system and method are described for processing the
images from
overlapping sequences of images to generate positions of subjects in three
dimensions in the area of
real space. Using the position of inventory caches in three dimensions, the
system and method
identifies proximity events, which have a location and a time, when distance
between a moving
inventory cache, such as a person, and another inventory cache such as a shelf
or a person, is below
a pre-determined threshold.
[00101 A system, method and computer program product capable of
tracking exchanges of
inventory items between individual persons, generally referred to herein as
subjects, in an area of
real space is described. Accordingly, a processing system can be configured as
described herein to
receive a plurality of sequences of images, where sequences of images in the
plurality of sequences
of images have of respective fields of view in the real space. The processing
system includes an
image recognition logic, receiving sequences of images from the plurality of
sequences, and
processing the images in sequences to identify locations of inventory caches
linked to first and
second subjects over time represented in the images. The system includes logic
to process the
identified locations of the inventory caches linked to first and second
subjects over time to detect an
exchange of an inventory item between the first and second subjects.
[00111 In one embodiment, the processing of images to generate
positions of subjects and
inventory caches linked to the subjects in three dimensions in the area or
real space includes
calculating locations of joints of subjects in three dimensions in the area of
real space. The system
can process the sets of joints and their locations to identify a subject as a
constellation of joints, and
CA 03177772 2022- 11-3
WO 2021/226392
PCT/US2021/031173
4
an inventory cache as a location linked to the constellation of joints, such
as a position of a joint
corresponding to the subject's hand.
100121 The detected exchanges can include at least one of a
transfer event, put event, a take
event or a touch event. A transfer event can be an exchange in which the
inventory cache acting as a
source, and the inventory cache acting as a sink, are linked to different
shoppers. A put event can be
an exchange in which the inventory cache acting as a source is linked to
shopper, and the inventory
cache acting as a sink, is an inventory location in the store that is
typically not moving. A take event
can be an exchange in which the inventory cache acting as a source is an
inventory location in the
store that is typically not moving, and the inventory cache acting as a sink
is linked to a shopper. A
touch event can be a proximity event without an exchange of inventory item,
where the inventory
cache acting as a source also acts as the sink for the purposes of classifying
the event.
[00131 In one embodiment, the system includes logic to detect a
put event when the distance
between the source, represented by a three-dimensional position of a subject
holding an item prior to
the detected proximity event and not holding the item after the detected
proximity event, and the
sink, represented by the three dimensional position of a subject not holding
an item prior to the
detected proximity event and holding the item after the detected proximity
event is less than the
threshold.
[00141 In one embodiment, the system includes logic to detect a
take event when distance
between the sink, represented by a three-dimensional position of a subject not
holding an item prior
to the detected proximity event and holding the item after the detected
proximity event, and the
source, represented by the three dimensional position of a subject holding an
item prior to the
detected proximity event and not holding the item after the detected proximity
event is less than the
threshold.
[00151 Locations which can act as sources and sinks are referred
to herein as inventory
caches, which have locations in three dimensions in the area of real space.
Inventory caches can be
hands or a crux of an elbow on shoppers, shopping bags, shopping carts or
other locations which
move over time as the shoppers move through the area of real space. Inventory
caches can be
locations in inventory display structures, such as shelves, which typically do
no move during a
shopping episode.
CA 03177772 2022- 11-3
WO 2021/226392
PCT/US2021/031173
[0016] In one embodiment, the system includes logic to detect a
touch event when the
distance between the sink, represented by a three-dimensional position of a
subject not holding an
item prior to the detected proximity event and not holding the item after the
detected proximity
event, and the source, represented by the three dimensional position of a
subject holding an item
prior to the detected proximity event and holding the item after the detected
proximity event is less
than the threshold.
10017j In one embodiment, the system can include logic to detect
a transfer event or an
exchange event between a sink and a source. The source and sinks can be
represented by subjects in
three dimensions in the area of real space. The sources and sinks can also
include positions of
shelves or other locations in three dimensions in the area of real space. The
system can detect a
transfer event or an exchange event when the source and sink are located at a
distance which is
below a pre-defined threshold distance. The system can include logic to
process sequences of
images of sources and sinks over time to detect exchange of items between
sources and sinks. In one
embodiment, the transfer event or exchange event can include a put event and a
take event. The
source holds the inventory item before the proximity event is detected and
does not hold the
inventory item after the proximity event. The sink does not hold the inventory
item before the
proximity event and holds the inventory item after the proximity event.
Therefore, the technology
disclosed can detect exchanges or transfers of inventory items from source to
sinks.
[0018] In some embodiments, the processing of the images to
detect the locations of
shoppers, or other subjects, and of inventory caches linked to the shoppers
which move, can include
first reducing the resolution of the images, and then applying the reduced
resolution images to a
trained inference engine like a neural network. The processing of images to
detect the inventory
items subject of the exchanges can be executed using the same images with a
high resolution
compared to the without the reduced resolution, or with different resolutions
such as the input
resolution from the source of the images.
[0019] The processing of images to detect the inventory items
subject of the exchanges can
be executed by first cropping the images, such as on bounding boxes around
inventory caches such
as hands, to produce cropped images, and applying the cropped images to
trained inference engines.
The cropped images can have a high resolution, such as the native resolution
output by the sensors
generating the sequences of images.
CA 03177772 2022- 11-3
WO 2021/226392
PCT/US2021/031173
6
[0020] A. system, method and computer program product are
provided for detecting
proximity events in an area of real space. The system can include a plurality
of sensors to produce
respective sequences of images of corresponding fields of view in the real
space. The field of view
of each sensor can overlap with the field of view of at least one other sensor
in the plurality of
sensors. The system includes logic to receive corresponding sequences of
images in two dimensions
from the plurality of sensors and process the two-dimensional images from
overlapping sequences
of images to generate positions of subjects in three dimensions in the area of
real space. The system
can include logic to access a database storing three dimensional positions of
locations on inventory
display structures which can act as sources and sinks in the area of real
space. Systems and methods
are provided for processing a time sequence of three-dimensional positions of
subjects and inventory
display structures in the area of real space to detect proximity events when
distance between a
source and a sink is below a pre-determined threshold. The source is a subject
or an inventory
display structure holding an item prior to the detected proximity event and
not holding the item after
the detected proximity event and the sink is a subject or an inventory display
structure not holding
an item prior to the detected proximity event and holding the item after the
detected proximity event.
[00211 A. system, method and computer program product are
provided for fusing inventory
events in an area of real space. The system can include a plurality of sensors
to produce respective
sequences of images of corresponding fields of view in the real space. The
field of view of each
sensor can overlap with the field of view of at least one other sensor in the
plurality of sensors. The
system. can include logic to process sequences of images to identify locations
of sources and sinks.
The sources and sinks can represent subjects in three dimensions in the area
of real space. The
system. can include redundant procedures to detect an inventory event
indicating exchange of an
item between a source and a sink. The system can include logic to produce
streams of inventory
events using the redundant procedures, the inventory events can include
classification of the item
exchanged. The system can include logic to match an inventory event in one
stream of the inventory
events with inventory events in other streams of the inventory events within a
threshold of a number
of frames preceding or following the detection of the inventory event. The
system can generate a
fused inventory event by weighted combination of the item classification of
the item exchanged in
the inventory event and the item exchanged in the matched inventory event.
CA 03177772 2022- 11-3
WO 2021/226392
PCT/US2021/031173
7
[0022] In one embodiment, the system can include three redundant
procedures to produce
streams of inventory events. The first procedure processes sequences of images
to identify locations
of sources and sinks over time represented in the images. The sources and sink
can represent
subjects in the area of real space. In one embodiment, the system can also
receive locations of
shelves in the area of real space and use the three-dimensional positions of
shelves as sources and
sinks. The system can detect exchange of an item between a source and a sink
when distance
between the source and the sink is below a pre-determined threshold. 'Fhe
first procedure can
produce a stream of proximity events over time. The second procedure includes
logic to process
bounding boxes of hands in images in the sequences of images to produce
holding probabilities and
classifications of items in the hands. The system includes logic to perform a
time sequence analysis
of the holding probabilities and classifications of items to detect region
proposals events and
produces a stream of region proposal events over time. The system can include
a matching logic to
match a proximity event in the stream of proximity events with events in the
stream of region
proposals events within a threshold of a number of frames preceding or
following the detection of
the proximity event. The system can generate a fused inventory event by
weighted combination of
the item classification of the item exchanged in the proximity event and the
item exchanged in the
matched region proposals event.
[0023] The system can include a third procedure that includes
logic to mask foreground
source and sinks in images in the sequences of images to generate background
images of inventory
display structures. The system can include logic to process background images
to detect semantic
diffing events including item classifications and sources and sinks associated
with the classified
items and producing a stream of semantic diffing events over time. The system
can include a
matching logic to match proximity event in the stream of proximity events with
events in the stream
of semantic diffing events within a threshold of a number of frames preceding
or following the
detection of the proximity event. The system can include logic to generate a
fused inventory event
by weighted combination of the item classification of the item exchanged in
the proximity event and
the item exchanged in the matched semantic diffing event. The system can match
inventory events
from two or more inventory streams detect puts, takes, touch, and transfer or
exchanges or items
between sources and sinks. The system can also use inventory events detected
by one procedure to
detect puts, takes, touch, and transfer or exchanges or items between sources
and sinks.
CA 03177772 2022- 11-3
WO 2021/226392
PCT/US2021/031173
8
[0024] Methods and computer program products which can be
executed by computer
systems are also described herein.
[0025] Other aspects and advantages of the present invention can
be seen on review of the
drawings, the detailed description and the claims, which follow.
BRIEF DESCRIPTION OF THE DRAWINGS
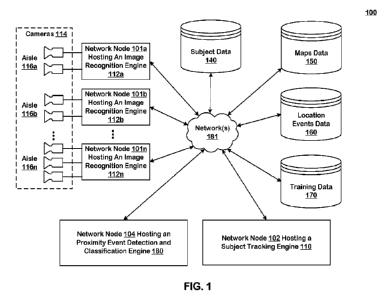
[0026] Fig. I illustrates an architectural level schematic of a
system in which a proximity
event detection engine detects proximity events in an area of real space.
[0027] Fig. 2A is a side view of an aisle in a shopping store
illustrating a camera
arrangement.
[0028] Fig. 2B is a perspective view of subject interacting with
items on shelves in an
inventory display structure in the area of real space.
[0029] Fig. 3 illustrates a three-dimensional and a two-
dimensional view of an inventory
display structure (or a shelf unit).
[0030] Fig. 4A illustrates input, output and convolution layers
in an example convolutional
neural network to classify joints of subjects in sequences of images.
[0031] Fig. 4B is an example data structure for storing joint
information.
[0032] Fig. 5A presents a graphical illustration of detection of
proximity events over a
period of time when the distance between inventory caches is less than a
threshold distance.
[0033] Fig. 5B presents example illustrations of movement of
subjects in an area of real
space and detection of proximity events by calculating distances between hand
joints of subjects, or
Other moving inventory caches.
100341 Fig. 6 shows an example data structure for storing a
subject including the information
of associated joints.
[0035] Fig. 7 is a flowchart illustrating process steps for
tracking subjects using the subject
tracking engine of Fig. I.
[0036] Fig. 8 is a flowchart showing more detailed process steps
for a video process step of
Fig. 7.
[0037] Fig. 9A is a flowchart showing a first part of more
detailed process steps for the
scene process of Fig. 7.
CA 03177772 2022- 11-3
WO 2021/226392
PCT/US2021/031173
9
[0038] Fig. 9B is a flowchart showing a second part of more
detailed process steps for the
scene process of Fig. 7.
[00391 Fig. 10A is an example architecture for combining event
stream from location-based
put and take detection with event stream from region proposals-based (WhatCNN
and WhenCNN)
put and take detection.
[0040] Fig. 10B is an example architecture for combining event
stream from location-based
put and take detection with event stream from semantic diffing-based put and
take detection.
[0041.] Fig. 10C shows multiple image channels from multiple
cameras and coordination
logic for the subjects and their respective shopping cart data structures.
[0042] Fig. 10D is an example data structure including locations
of inventory caches for
storing inventory items.
[0043] Fig. 11A presents graphical illustrations for event type
detection using item holding
probability values before and after the occurrence of a proximity event.
[0044] Fig. 11B presents an example of an item hand-off (or item
exchange) between a
source subject and a sink subject resulting in a put event and a take event.
[0045] Fig. 12 is a flowchart illustrating process steps for
identifying and updating subjects
in the real space.
[0046] Fig. 13 is a flowchart showing process steps for
processing hand joints (or moving
inventory caches) of subjects to identify inventory items.
[0047] Fig. 14 is a flowchart showing process steps for time
series analysis of inventory
items per hand joint (or moving inventory cache) to create a shopping cart
data structure per subject.
[0048] Fig. 15 is a flowchart presenting process steps for
detecting proximity events.
100491 Fig. 16 is a flowchart presenting process steps for
detecting item associated with the
proximity event detected in Fig. 11.
[0050] Fig. 17 is a flowchart presenting process steps for
location-based events stream
fusion with region proposals-based events stream and semantic diffing-based
events stream.
[0051] Fig. 18A is an example of a decision tree for predicting
location-based events based
on distance of joints to shelves.
[0052] Fig. 18B is an example architecture for training a random
forest classifier and
applying the trained classifier to predict location-based events.
CA 03177772 2022- 11-3
WO 2021/226392
PCT/US2021/031173
[0053] Fig. 19 presents an example architecture of a WhatCNN
model illustrating the
dimensionality of convolutional layers.
[0054] Fig. 20 presents a high-level block diagram of an
embodiment of a WhatCNN model
for classification of hand images.
[0055] Fig. 21 presents details of a first block of the high-
level block diagram of a
WhatCNN model presented in Fig. 20.
[0056] Fig. 22 presents operators in a fully connected layer in
the example WhatCNN model
presented in Fig. 19.
[0057] Fig. 23A presents a first part of process steps for
detecting semantic diffing events.
[0058] Fig. 23B presents a second part of process steps for
detecting semantic diffing events.
[0059] Fig. 24 is an example of a computer system architecture
implementing the proximity
events detection logic.
DETAILED DESCRIPTION
[0060] The following description is presented to enable any
person skilled in the art to make
and use the invention and is provided in the context of a particular
application and its requirements.
Various modifications to the disclosed embodiments will be readily apparent to
those skilled in the
art, and the general principles defined herein may be applied to other
embodiments and applications
without departing from the spirit and scope of the present invention. Thus,
the present invention is
not intended to be limited to the embodiments shown but is to be accorded the
widest scope
consistent with the principles and features disclosed herein.
System Overview
[0061] A. system and various implementations of the subject
technology is described with
reference to Figs. 1-24. The system and processes are described with reference
to Fig. 1, an
architectural level schematic of a system in accordance with an
implementation. Because Fig. 1 is an
architectural diagram, certain details are omitted to improve the clarity of
the description.
[0062] The discussion of Fig. 1 is organized as follows. First,
the elements of the system are
described, followed by their interconnections. Then, the use of the elements
in the system is
described in greater detail.
CA 03177772 2022- 11-3
WO 2021/226392
PCT/US2021/031173
11
[0063] Fig. 1 provides a block diagram level illustration of a
system 100. The system 100
includes cameras 114, network nodes hosting image recognition engines 112a,
112b, and 112n, a
subject tracking engine 110 deployed in a network node 102 (or nodes) on the
network, a subject
database 140, a maps database 150, a proximity events database 160, a training
database 170, a
proximity event detection engine 180 deployed in a network node 104 (or
nodes), and a
communication network or networks 181. The network nodes can host only one
image recognition
engine, or several image recognition engines as described herein. The system
can also include an
inventory database, a joints heuristics database and other supporting data.
[00641 As used herein, a network node is an addressable hardware
device or virtual device
that is attached to a network, and is capable of sending, receiving, or
forwarding information over a
communications channel to or from other network nodes, including channels
using TCP/IP sockets
for example. Examples of electronic devices which can be deployed as hardware
network nodes
having media access layer addresses, and supporting one or more network layer
addresses, include
all varieties of computers, workstations, laptop computers, handheld
computers, and smartphones.
Network nodes can be implemented in a cloud-based server system. More than one
virtual device
configured as a network node can be implemented using a single physical
device.
100651 For the sake of clarity, only three network nodes hosting
image recognition engines
are shown in the system 100. However, any number of network nodes hosting
image recognition
engines can be connected to the tracking engine 110 through the network(s)
181. Also, the image
recognition engine, the tracking engine, the proximity event detection engine
and other processing
engines described herein can execute using more than one network node in a
distributed
architecture.
100661 The interconnection of the elements of system 100 will
now be described. Network(s)
181 couples the network nodes 101a, 101b, and 101n, respectively, hosting
image recognition
engines 112a, 112b, and 112n, the network node 102 hosting the tracking engine
110, the subject
database 140, the maps database 150, the proximity events database 160, the
training database 170,
and the network node 104 hosting the proximity event detection engine 180.
Cameras 114 are
connected to the tracking engine 110 through network nodes hosting image
recognition engines
112a, 112b, and 112n. In one embodiment, the cameras 114 are installed in a
shopping store (such as
a supermarket) such that sets of cameras 114 (two or more) with overlapping
fields of view are
CA 03177772 2022- 11-3
WO 2021/226392
PCT/US2021/031173
12
positioned over each aisle to capture images of real space in the store. In
Fig. 1, two cameras are
arranged over aisle 116a, two cameras are arranged over aisle 116b, and three
cameras are arranged
over aisle 116n. The cameras 114 are installed over aisles with overlapping
fields of view. In such
an embodiment, the cameras are configured with the goal that customers moving
in the aisles of the
shopping store are present in the field of view of two or more cameras at any
moment in time.
[0067] Cameras 114 can be synchronized in time with each other,
so that images are
captured at the same time, or close in time, and at the same image capture
rate. The cameras 114 can
send respective continuous streams of images at a predetermined rate to
network nodes hosting
image recognition engines 112a-112n. Images captured in all the cameras
covering an area of real
space at the same time, or close in time, are synchronized in the sense that
the synchronized images
can be identified in the processing engines as representing different views of
subjects having fixed
positions in the real space. For example, in one embodiment, the cameras send
image frames at the
rates of 30 frames per second (fps) to respective network nodes hosting image
recognition engines
112a-112n. Each frame has a timestamp, identity of the camera (abbreviated as
"camera id"), and a
frame identity (abbreviated as "frame_id") along with the image data. Other
embodiments of the
technology disclosed can use different types of sensors such as infrared image
sensors, RF image
sensors, ultrasound sensors, thermal sensors, Lidars, etc., to generate this
data. Multiple types of
sensors can be used, including for example ultrasound or RF sensors in
addition to the cameras 114
that generate ROB color output. Multiple sensors can be synchronized in time
with each other, so
that frames are captured by the sensors at the same time, or close in time,
and at the same frame
capture rate. In all of the embodiments described herein, sensors other than
cameras, or sensors of
multiple types, can be used to produce the sequences of images utilized. The
images output by the
sensors have a native resolution, where the resolution is defined by a number
of pixels per row and
an number of pixels per column, and by a quantization of the data of each
pixel. For example, an
image can have a resolution of 1280 column by 720 rows of pixels over the full
field of view, where
each pixel includes one byte of data representing each of red, green and blue
ROB colors.
[0068] Cameras installed over an aisle are connected to
respective image recognition
engines. For example, in Fig. 1, the two cameras installed over the aisle 116a
are connected to the
network node 101a hosting an image recognition engine 112a. Likewise, the two
cameras installed
over aisle 116b are connected to the network node 101b hosting an image
recognition engine 112b.
CA 03177772 2022- 11-3
WO 2021/226392
PCT/US2021/031173
13
Each image recognition engine 112a-112n hosted in a network node or nodes 101a-
101n, separately
processes the image frames received from one camera each in the illustrated
example.
100691 In one embodiment, each image recognition engine 112a,
112b, and 112n is
implemented as a deep learning algorithm such as a convolutional neural
network (abbreviated
CNN). In such an embodiment, the CNN is trained using a training database. In
an embodiment
described herein, image recognition of subjects in the real space is based on
identifying and
grouping joints recognizable in the images, where the groups of joints can be
attributed to an
individual subject. For this joints-based analysis, the training database has
a large collection of
images for each of the different types of joints for subjects. In the example
embodiment of a
shopping store, the subjects are the customers moving in the aisles between
the shelves. In an
example embodiment, during training of the CNN, the system 100 is referred to
as a "training
system". After training the CNN using the training database, the CNN is
switched to production
mode to process images of customers in the shopping store in real time. In an
example embodiment,
during production, the system 100 is referred to as a runtime system (also
referred to as an inference
system). The CNN in each image recognition engine produces arrays of joints
data structures for
images in its respective stream of images. In an embodiment as described
herein, an array of joints
data structures is produced for each processed image, so that each image
recognition engine 112a-
112n produces an output stream of arrays of joints data structures. These
arrays of joints data
structures from cameras having overlapping fields of view are further
processed to form groups of
joints, and to identify such groups of joints as subjects.
[00701 The cameras 114 are calibrated before switching the CNN
to production mode. The
technology disclosed can include a calibrator that includes a logic to
calibrate the cameras and stores
the calibration data in a calibration database.
[00711 The tracking engine 110, hosted on the network node 102,
receives continuous
streams of arrays of joints data structures for the subjects from image
recognition engines 112a-
112n. The tracking engine 110 processes the arrays of joints data structures
and translates the
coordinates of the elements in the arrays of joints data structures
corresponding to images in
different sequences into candidate joints having coordinates in the real
space. For each set of
synchronized images, the combination of candidate joints identified throughout
the real space can be
considered, for the purposes of analogy, to be like a galaxy of candidate
joints. For each succeeding
CA 03177772 2022- 11-3
WO 2021/226392
PCT/US2021/031173
14
point in time, movement of the candidate joints is recorded so that the galaxy
changes over time.
The output of the tracking engine 110 is stored in the subject database 140.
100721 The tracking engine 110 uses logic to identify groups or
sets of candidate joints
having coordinates in real space as subjects in the real space. For the
purposes of analogy, each set
of candidate points is like a constellation of candidate joints at each point
in time. The constellations
of candidate joints can move over time.
100731 The logic to identify sets of candidate joints comprises
heuristic functions based on
physical relationships amongst joints of subjects in real space. These
heuristic functions are used to
identify sets of candidate joints as subjects. The heuristic functions are
stored in a heuristics
database. The output of the subject tracking engine 110 is stored in the
subject database 140. Thus,
the sets of candidate joints comprise individual candidate joints that have
relationships according to
the heuristic parameters with other individual candidate joints and subsets of
candidate joints in a
given set that has been identified, or can be identified, as an individual
subject.
[00741 In the example of a shopping store, shoppers (also
referred to as customers or
subjects) move in the aisles and in open spaces. The shoppers can take items
from shelves in
inventory display structures. In one example of inventory display structures,
shelves are arranged at
different levels (or heights) from the floor and inventory items are stocked
on the shelves. The
shelves can be fixed to a wall or placed as freestanding shelves forming
aisles in the shopping store.
Other examples of inventory display structures include, pegboard shelves,
magazine shelves, lazy
susan shelves, warehouse shelves, and refrigerated shelving units. The
inventory items can also be
stocked in other types of inventory display structures such as stacking wire
baskets, dump bins, etc.
The customers can also put items back on the same shelves from where they were
taken or on
another shelf. The system can include a maps database 150 in which locations
of inventory caches
on inventory display structures in the area of real space are stored. In one
embodiment, three-
dimensional maps of inventory display structures are stored that include the
width, height, and depth
information of display structures along with their positions in the area of
real space. In one
embodiment, the system can include or have access to memory storing a
planogram identifying
inventory locations in the area of real space and inventory items to be
positioned on inventory
locations. The planogram can also include information about portions of
inventory locations
CA 03177772 2022- 11-3
WO 2021/226392
PCT/US2021/031173
designated for particular inventory items. The planogram can be produced based
on a plan for the
arrangement of inventory items on the inventory locations in the area of real
space.
100751 As the shoppers (or subjects) move in the shopping store,
they can exchange items
with other shoppers in the store. For example, a first shopper can hand-off an
item to a second
shopper in the shopping store. The second shopper who takes the item from the
first shopper can
then in turn put that item in her shopping basket, shopping cart, or simply
keep the item in her hand.
The second shopper can also put the item back on a shelf The technology
disclosed can detect a
"proximity event" in which a moving inventory cache is positioned close to
another inventory cache
which can be moving or fixed, such that a distance between them is less than a
threshold (e.g., 10
cm). Different values of threshold can be used greater than or less than 10
cm. In one embodiment,
the technology disclosed uses locations of joints to locate inventory caches
linked to shoppers to
detect the proximity event. For example, the system can detect a proximity
event when a left or a
right hand joint of a shopper is positioned closer than the threshold to a
left or right hand joint of
another shopper or a shelf location. The system can also use positions of
other joints such as elbow
joints, or shoulder joints of subject to detect proximity events. The
proximity event detection engine
180 includes the logic to detect proximity events in the area of real space.
The system can store the
proximity events in the proximity events database 160.
[00761 The technology disclosed can process the proximity events
to detect puts and takes of
inventory items. For example, when an item is handed-off from the first
shopper to the second
shopper, the technology disclosed can detect the proximity event. Following
this, the technology
disclosed can detect a type of the proximity event, e.g., put, take or touch
type event. When an item
is exchanged between two shoppers, the technology disclosed detects a put type
event for the source
shopper (or source subject) and a take type event for the sink shopper (or
sink subject). The system
can then process the put and take events to determine the item exchanged in
the proximity event.
This information is then used by the system to update the log data structures
(or shopping cart data
structures) of the source and sink shoppers. For example, the item exchanged
is removed from the
log data structure of the source shopper and added to the log data structure
of the sink shopper. The
system can apply the same processing logic when shoppers take items from
shelves and put items
back on the shelves. In this case, the exchange of items takes place between a
shopper and a shelf.
CA 03177772 2022- 11-3
WO 2021/226392
PCT/US2021/031173
16
The system determines the item taken from the shelf or put on the shelf in the
proximity event. The
system then updates the log data structure of the shopper and the shelf
accordingly.
100771 The technology disclosed includes logic to detect a same
event in the area of real
space using multiple parallel image processing pipelines or subsystems or
procedures. These
redundant event detection subsystems provide a robust event detection and
increases the confidence
detection of puts and takes by matching events in multiple event streams. The
system can then fuse
events from multiple event streams using a weighted combination of items
classified in event
streams. In case one image processing pipeline cannot detect an event, the
system can use the results
from other image processing pipeline to update the log data structure of the
shoppers. We refer to
these events of puts and takes in the area of real space as "inventory
events". An inventory event can
include information about the source and sink, classification of the item, a
timestamp, a frame
identifier, and a location in three dimensions in the area of real space. The
multiple streams of
inventory events can include a stream of location based-events, a stream of
region proposals-based
events, and a stream of semantic diffing-based events. We provide the details
of the system
architecture, including the machine learning models, system components,
processing steps in the
three image processing pipelines, respectively producing the three event
streams. We also provide
logic to fuse the events in a plurality of event streams.
[00781 The actual communication path through the network 181 can
be point-to-point over
public and/or private networks. The communications can occur over a variety of
networks 181, e.g.,
private networks, VPN, MPLS circuit, or Internet, and can use appropriate
application programming
interfaces (APIs) and data interchange formats, e.g., Representational State
Transfer (REST),
JavaScriptTm Object Notation (JSON), Extensible Markup Language (XML), Simple
Object Access
Protocol (SOAP), Java rm Message Service (JMS), and/or Java Platform Module
System. All of the
communications can be encrypted. The communication is generally over a network
such as a LAN
(local area network), WAN (wide area network), telephone network (Public
Switched Telephone
Network (PSTN), Session Initiation Protocol (SIP), wireless network, point-to-
point network, star
network, token ring network, hub network, Internet, inclusive of the mobile
Internet, via protocols
such as EDGE, 3G, 4G LTE, Wi-Fi, and WiMAX. Additionally, a variety of
authorization and
authentication techniques, such as username/password, Open Authorization
((Muth), Kerberos,
SecurelD, digital certificates and more, can be used to secure the
communications.
CA 03177772 2022- 11-3
WO 2021/226392
PCT/US2021/031173
17
[0079] The technology disclosed herein can be implemented in the
context of any computer-
implemented system including a database system, a multi-tenant environment, or
a relational
database implementation like an Oracle Tm compatible database implementation,
an IBM DB2
Enterprise ServerTm compatible relational database implementation, a MySQL'm
or PostgreSQ.L'm
compatible relational database implementation or a Microsoft SQL Server-1m
compatible relational
database implementation or a NoSQL1m non-relational database implementation
such as a
Vampire m compatible non-relational database implementation, an Apache
CassandraTM compatible
non-relational database implementation, a BigTableim compatible non-relational
database
implementation or an HBaseTm or DynamoDBTM compatible non-relational database
implementation. In addition, the technology disclosed can be implemented using
different
programming models like MapReduceTM, bulk synchronous programming, MPI
primitives, etc. or
different scalable batch and stream management systems like Apache Storm,
Apache SparkTM,
Apache KafkaTM, Apache MinkTm, TruvisoTm, Amazon Elasticsearch ServiceTM,
Amazon Web
ServicesTM (AWS), IBM Info-Sphere, BorealisTM, and Yahoo! S4Tm.
Camera Arrangement
[0080] The cameras 114 are arranged to track multi-joint
entities (or subjects) in a three-
dimensional (abbreviated as 3D) real space. In the example embodiment of the
shopping store, the
real space can include the area of the shopping store where items for sale are
stacked in shelves. A
point in the real space can be represented by an (x, y, z) coordinate system..
Each point in the area of
real space for which the system is deployed is covered by the fields of view
of two or more cameras
114.
100811 In a shopping store, the shelves and other inventory
display structures can be
arranged in a variety of manners, such as along the walls of the shopping
store, or in rows forming
aisles or a combination of the two arrangements. Fig. 2A shows an arrangement
of shelves, forming
an aisle 116a, viewed from one end of the aisle 116a. Two cameras, camera A.
206 and camera B
208 are positioned over the aisle 116a at a predetermined distance from a roof
230 and a floor 220 of
the shopping store above the inventory display structures such as shelves. The
cameras 114
comprise cameras disposed over and having fields of view encompassing
respective parts of the
inventory display structures and floor area in the real space. If we view the
arrangement of cameras
CA 03177772 2022- 11-3
WO 2021/226392
PCT/US2021/031173
18
from the top, the camera A 206 is positioned at a predetermined distance from
the shelf A 202 and
the camera B 208 is positioned at a predetermined distance from the shelf B
204. In another
embodiment, in which more than two cameras are positioned over an aisle, the
cameras are
positioned at equal distances from each other. In such an embodiment, two
cameras are positioned
close to the opposite ends and a third camera is positioned in the middle of
the aisle. It is understood
that a number of different camera arrangements are possible.
10082j The coordinates in real space of members of a set of
candidate joints, identified as a
subject, identify locations in the floor area of the subject. In the example
embodiment of the
shopping store, the real space can include all of the floor 220 in the
shopping store from which
inventory can be accessed. Cameras 114 are placed and oriented such that areas
of the floor 220 and
shelves can be seen by at least two cameras. The cameras 114 also cover at
least part of the shelves
202 and 204 and floor space in front of the shelves 202 and 204. Camera angles
are selected to have
both steep, straight down, and angled perspectives that give more full body
images of the customers.
In one example embodiment, the cameras 114 are configured at an eight (8) foot
height or higher
throughout the shopping store. Fig. 13 presents an illustration of such an
embodiment.
[0083] In Fig. 2A, the cameras 206 and 208 have overlapping
fields of view, covering the
space between a shelf A 202 and a shelf B 204 with overlapping fields of view
216 and 218,
respectively. A location in the real space is represented as a (x, y, z) point
of the real space
coordinate system. "x" and "y" represent positions on a two-dimensional (21))
plane which can be
the floor 220 of the shopping store. The value "z" is the height of the point
above the 2D plane at
floor 220 in one configuration.
[0084] Fig. 2B is a perspective view of the shelf unit B 204
with four shelves, shelf 1, shelf
2, shelf 3, and shelf 4 positioned at. different levels from the floor. The
inventory items are stocked
on the shelves. A subject 240 is reaching out to take an item from the right-
hand side portion of the
shelf 4. A location in the real space is represented as a (x, y, z) point of
the real space coordinate
system. "x" and "y" represent positions on a two-dimensional (2D) plane which
can be the floor 220
of the shopping store. The value "z" is the height of the point above the 21)
plane at floor 220 in one
configuration.
CA 03177772 2022- 11-3
WO 2021/226392
PCT/US2021/031173
19
Camera Calibration
[00851 The system can perform two types of calibrations:
internal and external. In internal
calibration, the internal parameters of the cameras 114 are calibrated.
Examples of internal camera
parameters include focal length, principal point, skew, fisheye coefficients,
etc. A variety of
techniques for internal camera calibration can be used. One such technique is
presented by Zhang in
"A flexible new technique for camera calibration" published in IEEE
Transactions on Pattern
Analysis and Machine Intelligence, Volume 22, No. 11, November 2000.
100861 In external calibration, the external camera parameters
are calibrated in order to
generate mapping parameters for translating the 213 image data into 3D
coordinates in real space. In
one embodiment, one subject, such as a person, is introduced into the real
space. The subject moves
through the real space on a path that passes through the field of view of each
of the cameras 114. At
any given point in the real space, the subject is present in the fields of
view of at least two cameras
forming a 3D scene. The two cameras, however, have a different view of the
same 3D scene in their
respective two-dimensional (2D) image planes. A feature in the 3D scene such
as the left wrist of
the subject is viewed by two cameras at different positions in their
respective 2D image planes.
[00871 A point correspondence is established between every pair
of cameras with
overlapping fields of view for a given scene. Since each camera has a
different view of the same 3D
scene, a point correspondence is two pixel locations (one location from each
camera with
overlapping field of view) that represent the projection of the same point in
the 3D scene. Many
point correspondences are identified for each 3D scene using the results of
the image recognition
engines 112a-112n for the purposes of the external calibration. The image
recognition engines
identify the position of a joint as (x, y) coordinates, such as row and column
numbers, of pixels in
the 2D image planes of respective cameras 114. In one embodiment, a joint is
one of 19 different
types of joints of the subject. As the subject moves through the fields of
view of different cameras,
the tracking engine 110 receives (x, y) coordinates of each of the 19
different types of joints of the
subject used for the calibration from cameras 114 per image.
[00881 For example, consider an image from a camera A and an
image from a camera B both
taken at the same moment in time and with overlapping fields of view. There
are pixels in an image
from camera A that correspond to pixels in a synchronized image from camera B.
Consider that
there is a specific point of some object or surface in view of both camera A
and camera B and that
CA 03177772 2022- 11-3
WO 2021/226392
PCT/US2021/031173
point is captured in a pixel of both image frames. In external camera
calibration, a multitude of such
points are identified and referred to as corresponding points. Since there is
one subject in the field of
view of camera A and camera B during calibration, key joints of this subject
are identified, for
example, the center of left wrist. If these key joints are visible in image
frames from both camera A
and camera B, then it is assumed that these represent corresponding points.
This process is repeated
for many image frames to build up a large collection of corresponding points
for all pairs of cameras
with overlapping fields of view. In one embodiment, images are streamed off of
all cameras at a rate
of 30 FPS (frames per second) or more and a resolution of 1280 by 720 pixels
in full KGB (red,
green, and blue) color. These images are in the form of one-dimensional arrays
(also referred to as
flat arrays).
[0089] In some embodiments, the resolution of the images is
reduced before applying the
images to the inference engines used to detect the joints in the images, such
as a dropping every
other pixel in a row, by reducing the size of the data for each pixel, or
otherwise, so the input images
at the inference engine have smaller amounts of data, and so the inference
engines can operate
faster.
[0090] The large number of images collected above for a subject
can be used to determine
corresponding points between cameras with overlapping fields of view. Consider
two cameras A
and B with overlapping field of view. The plane passing through camera centers
of cameras A. and B
and the joint location (also referred to as feature point) in the 3D scene is
called the "epipolar
plane". The intersection of the epipolar plane with the 2D image planes of the
cameras A and B
defines the "epipolar line". Given these corresponding points, a
transformation is determined that
can accurately map a corresponding point from. camera A to an epipolar line in
camera B's field of
view that is guaranteed to intersect the corresponding point in the image
frame of camera B. Using
the image frames collected above for a subject, the transformation is
generated. It is known in the art
that this transformation is non-linear. The general form is furthermore known
to require
compensation for the radial distortion of each camera's lens, as well as the
non-linear coordinate
transformation moving to and from the projected space. In external camera
calibration, an
approximation to the ideal non-linear transformation is determined by solving
a non-linear
optimization problem. This non-linear optimization function is used by the
tracking engine 110 to
identify the same joints in outputs (arrays of joints data structures) of
different image recognition
CA 03177772 2022- 11-3
WO 2021/226392
PCT/US2021/031173
21
engines 112a-112n, processing images of cameras 114 with overlapping fields of
view. The results
of the internal and external camera calibration are stored in the calibration
database 170.
100911 A variety of techniques for determining the relative
positions of the points in images
of cameras 114 in the real space can be used. For example, Longuet-Higgins
published, "A
computer algorithm for reconstructing a scene from two projections" in Nature,
Volume 293, 10
September 1981. This paper presents computing a three-dimensional structure of
a scene from a
correlated pair of perspective projections when spatial relationship between
the two projections is
unknown. The Longuet-Higgins paper presents a technique to determine the
position of each camera
in the real space with respect to other cameras. Additionally, their technique
allows triangulation of
a subject in the real space, identifying the value of the z-coordinate (height
from the floor) using
images from cameras 114 with overlapping fields of view. An arbitrary point in
the real space, for
example, the end of a shelf in one corner of the real space, is designated as
a (0, 0, 0) point on the (x,
y, z) coordinate system of the real space.
[00921 In an embodiment of the technology, the parameters of the
external calibration are
stored in two data structures. The first data structure stores intrinsic
parameters. The intrinsic
parameters represent a projective transformation from the 3D coordinates into
2D image
coordinates. The first data. structure contains intrinsic parameters per
camera as shown below The
data values are all numeric floating-point numbers. This data structure stores
a 3x3 intrinsic matrix,
represented as "K" and distortion coefficients. The distortion coefficients
include six radial
distortion coefficients and two tangential distortion coefficients. Radial
distortion occurs when light
rays bend more near the edges of a lens than they do at its optical center.
Tangential distortion
occurs when the lens and the image plane are not parallel. The following data
structure shows values
for the first camera only. Similar data is stored for all the cameras 114.
1: (
K: [[x, x, x], [x, x, x], [x, x,
distortion _coefficients: [x, x, x, x, x, x, x, x]
),
CA 03177772 2022- 11-3
WO 2021/226392
PCT/US2021/031173
22
[00931 The second data structure stores per pair of cameras: a
3x3 fundamental matrix (17), a
3x3 essential matrix (E), a 3x4 projection matrix (P), a 3x3 rotation matrix
(R) and a 3x1 translation
vector (t). This data is used to convert points in one camera's reference
frame to another camera's
reference frame. For each pair of cameras, eight homography coefficients are
also stored to map the
plane of the floor 220 from one camera to another. A fundamental matrix is a
relationship between
two images of the same scene that constrains where the projection of points
from the scene can
occur in both images. Essential matrix is also a relationship between two
images of the same scene
with the condition that the cameras are calibrated. The projection matrix
gives a vector space
projection from 3D real space to a subspace. The rotation matrix is used to
perform a rotation in
Euclidean space. Translation vector "f" represents a geometric transformation
that moves every
point of a figure or a space by the same distance in a given direction. The
homography_floor_coefficients are used to combine images of features of
subjects on the floor 220
viewed by cameras with overlapping fields of views. The second data structure
is shown below.
Similar data is stored for all pairs of cameras. As indicated previously, the
x's represents numeric
floating-point numbers.
1: {
2: {
F: [[x, x, [x, x, x], [x, x, x]],
E: [[x, x, x], [x, x, x], [x, x, x]],
P: [[x, x, x, x], [x, x, x, x], [x, x, x, x]],
R: r[x, x, xl, [x, x, x], (x, x,
t: [x, x,
homography floor coefficients: [x, x, x, x, x, x, x, x]
},
CA 03177772 2022- 11-3
WO 2021/226392
PCT/US2021/031173
23
Two-dimensional and Three-dimensional Maps
[00941 An inventory cache, such as location on a shelf, in a
shopping store can be identified
by a unique identifier in a map database (e.g., shelf id). Similarly, a
shopping store can also be
identified by a unique identifier (e.g., store id) in a map database. The two-
dimensional (21)) and
three-dimensional (3D) maps database 150 identifies locations of inventory
caches in the area of real
space along the respective coordinates. For example, in a 2D map, the
locations in the maps define
two dimensional regions on the plane formed perpendicular to the floor 220
i.e., XZ plane as shown
in illustration 360 in Fig. 3. The map defines an area for inventory locations
or shelves where
inventory items are positioned. In Fig. 3, a 2D location of the shelf unit
shows an area formed by
four coordinate positions (xl, y1), (xi, y2), (x2, y2), and (x2, yi). These
coordinate positions define
a 2D region on the floor 220 where the shelf is located. Similar 2D areas are
defined for all
inventory display structure locations, entrances, exits, and designated
unmonitored locations in the
shopping store. This information is stored in the maps database 150.
[00951 In a 3D map, the locations in the map define three
dimensional regions in the 3D real
space defined by X, Y, and Z coordinates. The map defines a volume for
inventory locations where
inventory items are positioned. In illustration 350 in Fig. 3, a 3D view 350
of shelf 1, at the bottom
of shelf unit B 204, shows a volume formed by eight coordinate positions (xi,
yi, zi ), (xl, yl, z2),
(xl, y2, z1), (xi, y2, z2), (x2, yi, z.1), (x2, yi, 7.2), (x2, y2, zi), (x2,
y2, z2) defining a 3D region in
which inventory items are positioned on the shelf 1. Similar 3D regions are
defined for inventory
locations in all shelf units in the shopping store and stored as a 3D map of
the real space (shopping
store) in the maps database 150. The coordinate positions along the three axes
can be used to
calculate length, depth and height of the inventory locations as shown in Fig.
3.
100961 In one embodiment, the map identifies a configuration of
units of volume which
correlate with portions of inventory locations on the inventory display
structures in the area of real
space. Each portion is defined by starting and ending positions along the
three axes of the real space.
Like 2D maps, the 3D maps can also store locations of all inventory display
structure locations,
entrances, exits and designated unmonitored locations in the shopping store.
[0097] The items in a shopping store are arranged in some
embodiments according to a
planogram which identifies the inventory locations (such as shelves) on which
a particular item is
planned to be placed. For example, as shown in an illustration 350 in Fig. 3,
a left half portion of
CA 03177772 2022- 11-3
WO 2021/226392
PCT/US2021/031173
24
shelf 3 and shelf 4 are designated for an item (which is stocked in the form
of cans). The system can
include pre-defined planograms for the shopping store which include positions
of items on the
shelves in the store. The planograms can be stored in the maps database 150.
In one embodiment,
the system can include logic to update the positions of items on shelves in
real time or near real
time.
Convolutional Neural Network
[0098] The image recognition engines in the processing platforms
receive a continuous
stream of images at a predetermined rate. In one embodiment, the image
recognition engines
comprise convolutional neural networks (abbreviated CNN).
[0099] Fig. 4A illustrates processing of image frames by an
example CNN referred to by a
numeral 400. The input image 410 is a matrix consisting of image pixels
arranged in rows and
columns. In one embodiment, the input image 410 has a width of 1280 pixels,
height of 720 pixels
and 3 channels red, blue, and green also referred to as RGB. The channels can
be imagined as three
1280 x 720 two-dimensional images stacked over one another. Therefore, the
input image has
dimensions of 1280 x 720 x 3 as shown in Fig. 4A. As mentioned above, in some
embodiments, the
images are filtered to provide images with reduced resolution for input to the
CNN.
10100j A 2 x 2 filter 420 is convolved with the input image 410.
In this embodiment, no
padding is applied when the filter is convolved with the input Following this,
a nonlinearity
function is applied to the convolved image. In the present embodiment,
rectified linear unit (ReLU)
activations are used. Other examples of nonlinear functions include sigmoid,
hyperbolic tangent
(tanh) and variations of ReLU such as leaky ReLU. A search is performed to
find hyper-parameter
values. The hyper-parameters are Ci, C2õ CN where CN means the number of
channels for
convolution layer "N". Typical values of N and C are shown in Fig. 4A. There
are twenty five (25)
layers in the CNN as represented by N equals 25. The values of C are the
number of channels in
each convolution layer for layers 1 to 25. In other embodiments, additional
features are added to the
CNN 400 such as residual connections, squeeze-excitation modules, and multiple
resolutions.
[0101] In typical CNNs used for image classification, the size
of the image (width and height
dimensions) is reduced as the image is processed through convolution layers.
That is helpful in
feature identification as the goal is to predict a class for the input image.
However, in the illustrated
CA 03177772 2022- 11-3
WO 2021/226392
PCT/US2021/031173
embodiment, the size of the input image (Le. image width and height
dimensions) is not reduced, as
the goal is to not only to identify a joint (also referred to as a feature) in
the image frame, but also to
identify its location in the image so it can be mapped to coordinates in the
real space. Therefore, as
shown Fig. 5, the width and height dimensions of the image remain unchanged
relative to the input
images (with full or reduced resolution) as the processing proceeds through
convolution layers of
the CNN, in this example.
10102j In one embodiment, the CNN 400 identifies one of the 19
possible joints of the
subjects at each element of the image. The possible joints can be grouped in
two categories: foot
joints and non-foot joints. The 19th type of joint classification is for all
non-joint features of the
subject (i.e. elements of the image not classified as a joint).
Foot Joints:
Ankle joint (left and right)
Non-foot Joints:
Neck
Nose
Eyes (left and right)
Ears (left and right)
Shoulders (left and right)
Elbows (left and right)
Wrists (left and right)
Hip (left and right)
Knees (left and right)
Not a joint
[01031 As can be seen, a "joint" for the purposes of this
description is a trackable feature of
a subject in the real space. A joint may correspond to physiological joints on
the subjects, or other
features such as the eye, or nose.
[01041 The first set of analyses on the stream of input images
identifies trackable features of
subjects in real space. In one embodiment, this is referred to as "joints
analysis". In such an
CA 03177772 2022- 11-3
WO 2021/226392
PCT/US2021/031173
26
embodiment, the CNN used for joints analysis is referred to as "joints CNN".
In one embodiment,
the joints analysis is performed thirty times per second over thirty frames
per second received from
the corresponding camera. The analysis is synchronized in time i.e., at 1130th
of a second, images
from all cameras 114 are analyzed in the corresponding joints CNNs to identify
joints of all subjects
in the real space. The results of this analysis of the images from a single
moment in time from plural
cameras is stored as a "snapshot".
[0105] A snapshot can be in the form of a dictionary containing
arrays of joints data
structures from images of all cameras 114 at a moment in time, representing a
constellation of
candidate joints within the area of real space covered by the system. In one
embodiment, the
snapshot is stored in the subject database 140.
[0106] In this example CNN, a softmax function is applied to
every element of the image in
the final layer of convolution layers 430. The softmax function transforms a K-
dimensional vector of
arbitrary real values to a K-dimensional vector of real values in the range
[0, 1] that add up to 1. In
one embodiment, an element of an image is a single pixel. The softmax function
converts the 19-
dimensional array (also referred to a 19-dimensional vector) of arbitrary real
values for each pixel to
a 19-dimensional confidence array of real values in the range [0, 1] that add
up to 1. The 19
dimensions of a pixel in the image frame correspond to the 19 channels in the
final layer of the CNN
which further correspond to 19 types of joints of the subjects.
[0107] A large number of picture elements can be classified as
one of each of the 19 types of
joints in one image depending on the number of subjects in the field of view
of the source camera
for that image.
[0108] The image recognition engines 112a-112n process images to
generate confidence
arrays for elements of the image. A confidence array for a particular element
of an image includes
confidence values for a plurality of joint types for the particular element.
Each one of the image
recognition engines 112a-112n, respectively, generates an output matrix 440 of
confidence arrays
per image. Finally, each image recognition engine generates arrays of joints
data structures
corresponding to each output matrix 540 of confidence arrays per image. The
arrays of joints data
structures corresponding to particular images classify elements of the
particular images by joint
type, time of the particular image, and coordinates of the element in the
particular image. A joint
CA 03177772 2022- 11-3
WO 2021/226392
PCT/US2021/031173
27
type for the joints data structure of the particular elements in each image is
selected based on the
values of the confidence array.
[0109] Each joint of the subjects can be considered to be
distributed in the output matrix 440
as a heat map. The heat map can be resolved to show image elements having the
highest values
(peak) for each joint type. Ideally, for a given picture element having high
values of a particular
joint type, surrounding picture elements outside a range from the given
picture element will have
lower values for that joint type, so that a location for a particular joint
having that joint type can be
identified in the image space coordinates. Correspondingly, the confidence
array for that image
element will have the highest confidence value for that joint and lower
confidence values for the
remaining 18 types of joints.
[0110] In one embodiment, batches of images from each camera 114
are processed by
respective image recognition engines. For example, six contiguously
timestamped images are
processed sequentially in a batch to take advantage of cache coherence. The
parameters for one
layer of the CNN 400 are loaded in memory and applied to the batch of six
image frames. Then the
parameters for the next layer are loaded in memory and applied to the batch of
six images. This is
repeated for all convolution layers 430 in the CNN 400. The cache coherence
reduces processing
time and improves performance of the image recognition engines.
[0111] In one such embodiment, referred to as three-dimensional
(3D) convolution, a further
improvement in performance of the CNN 400 is achieved by sharing information
across image
frames in the batch. This helps in more precise identification of joints and
reduces false positives.
For examples, features in the image frames for which pixel values do not
change across the multiple
image frames in a given batch are likely static objects such as a shelf. The
change of values for the
same pixel across image frames in a given batch indicates that this pixel is
likely a joint. Therefore,
the CNN 400 can focus more on processing that pixel to accurately identify the
joint identified by
that pixel.
Joints Data Structure
[0112] The output of the CNN 400 is a matrix of confidence
arrays for each image per
camera. The matrix of confidence arrays is transformed into an array of joints
data. structures. A
joints data structure 460 as shown in Fig. 4B is used to store the information
of each joint. The joints
CA 03177772 2022- 11-3
WO 2021/226392
PCT/US2021/031173
28
data structure 460 identifies x and y positions of the element in the
particular image in the 2D image
space of the camera from which the image is received. A joint number
identifies the type of joint
identified. For example, in one embodiment, the values range from 1 to 19. A
value of 1 indicates
that the joint is a left-ankle, a value of 2 indicates the joint is a right-
ankle and so on. The type of
joint is selected using the confidence array for that element in the output
matrix 440. For example, in
one embodiment, if the value corresponding to the left-ankle joint is highest
in the confidence array
for that image element, then the value of the joint number is "1".
101131 A confidence number indicates the degree of confidence of
the CNN 400 in
predicting that joint. If the value of confidence number is high, it means the
CNN is confident in its
prediction. An integer-Id is assigned to the joints data structure to uniquely
identify it. Following the
above mapping, the output matrix 440 of confidence arrays per image is
converted into an array of
joints data structures for each image.
101141 The image recognition engines 112a-112n receive the
sequences of images from
cameras 114 and process images to generate corresponding arrays of joints data
structures as
described above. An array of joints data structures for a particular image
classifies elements of the
particular image by joint type, time of the particular image, and the
coordinates of the elements in
the particular image. in one embodiment, the image recognition engines 112a-
112n are
convolutional neural networks CNN 400, the joint type is one of the 19 types
of joints of the
subjects, the time of the particular image is the timestamp of the image
generated by the source
camera 114 for the particular image, and the coordinates (x, y) identify the
position of the element
on a 2D image plane.
[01151 In one embodiment, the joints analysis includes
performing a combination of k-
nearest neighbors, mixture of Gaussians, various image morphology
transformations, and joints
CNN on each input image. The result comprises arrays ofjoints data structures
which can be stored
in the form of a bit mask in a ring buffer that maps image numbers to bit
masks at each moment in
time.
Tracking. Engine
[01161 The subject tracking engine 110 is configured to receive
arrays of joints data
structures generated by the image recognition engines 112a-112n corresponding
to images in
CA 03177772 2022- 11-3
WO 2021/226392 PCT/US2021/031173
29
sequences of images from cameras having overlapping fields of view. The arrays
of joints data
structures per image are sent by image recognition engines 112a-112n to the
tracking engine 110 via
the network(s) 181 as shown in Fig. 1. The tracking engine 110 translates the
coordinates of the
elements in the arrays of joints data structures corresponding to images in
different sequences into
candidate joints having coordinates in the real space. The tracking engine 110
comprises logic to
identify sets of candidate joints having coordinates in real space
(constellations of joints) as subjects
in the real space. In one embodiment, the tracking engine 110 accumulates
arrays of joints data
structures from the image recognition engines for all the cameras at a given
moment in time and
stores this information as a dictionary in the subject database 140, to be
used for identifying a
constellation of candidate joints. The dictionary can be arranged in the form
of key-value pairs,
where keys are camera ids and values are arrays of joints data structures from
the camera. In such an
embodiment, this dictionary is used in heuristics-based analysis to determine
candidate joints and
for assignment of joints to subjects. In such an embodiment, a high-level
input, processing and
output of the tracking engine 110 is illustrated in table 1.
Table 1: Inputs, processing and outputs from subject tracking engine 110 in an
example
embodiment.
Inputs Processing Output
- Create joints dictionary
- List of subjects in the real
Arrays of joints data
- Re-project joint positions
space at a moment in time
structures per image and for
in the fields of view of
each joints data structure
cameras with overlapping
- Unique ID fields of view to
- Confidence number candidate joints
- Joint number
(x, y) position in
image space
CA 03177772 2022- 11-3
WO 2021/226392
PCT/US2021/031173
Grouping Candidate Joints
[01171 The subject tracking engine 110 receives arrays of joints
data structures along two
dimensions: time and space. Along the time dimension, the tracking engine
receives sequentially
timestamped arrays of joints data structures processed by image recognition
engines 112a-112n per
camera. The joints data structures include multiple instances of the same
joint of the same subject
over a period of time in images from cameras having overlapping fields of
view. The (x, y)
coordinates of the element in the particular image will usually be different
in sequentially
timestamped arrays of joints data structures because of the movement of the
subject to which the
particular joint belongs. For example, twenty picture elements classified as
left-wrist joints can
appear in many sequentially timestamped images from a particular camera, each
left-wrist joint
having a position in real space that can be changing or unchanging from image
to image. As a result,
twenty left-wrist joints data structures 600 in many sequentially timestamped
arrays of joints data
structures can represent the same twenty joints in real space over time.
[01181 Because multiple cameras having overlapping fields of
view cover each location in
the real space, at any given moment in time, the same joint can appear in
images of more than one of
the cameras 114. The cameras 114 are synchronized in time, therefore, the
tracking engine 110
receives joints data structures for a particular joint from multiple cameras
having overlapping fields
of view, at any given moment in time. This is the space dimension, the second
of the two
dimensions: time and space, along which the subject tracking engine 110
receives data in arrays of
joints data structures.
[01191 The subject tracking engine 110 uses an initial set of
heuristics stored in a heuristics
database to identify candidate joints data structures from the arrays of
joints data structures. The
goal is to minimize a global metric over a period of time. A global metric
calculator can calculate
the global metric. The global metric is a summation of multiple values
described below. Intuitively,
the value of the global metric is minimum when the joints in arrays of joints
data structures received
by the subject tracking engine 110 along the time and space dimensions are
correctly assigned to
respective subjects. For example, consider the embodiment of the shopping
store with customers
moving in the aisles. If the left-wrist of a customer A is incorrectly
assigned to a customer B, then
the value of the global metric will increase. Therefore, minimizing the global
metric for each joint
CA 03177772 2022- 11-3
WO 2021/226392
PCT/US2021/031173
31
for each customer is an optimization problem. One option to solve this problem
is to try all possible
connections of joints. However, this can become intractable as the number of
customers increases.
101201 A second approach to solve this problem is to use
heuristics to reduce possible
combinations of joints identified as members of a set of candidate joints for
a single subject. For
example, a left-wrist joint cannot belong to a subject far apart in space from
other joints of the
subject because of known physiological characteristics of the relative
positions of joints. Similarly, a
left-wrist joint having a small change in position from image to image is less
likely to belong to a
subject having the same joint at the same position from an image far apart in
time, because the
subjects are not expected to move at a very high speed. These initial
heuristics are used to build
boundaries in time and space for constellations of candidate joints that can
be classified as a
particular subject. The joints in the joints data structures within a
particular time and space boundary
are considered as "candidate joints" for assignment to sets of candidate
joints as subjects present in
the real space. These candidate joints include joints identified in arrays of
joints data structures from
multiple images from a same camera over a period of time (time dimension) and
across different
cameras with overlapping fields of view (space dimension).
Foot Joints
[01211 The joints can be divided for the purposes of a procedure
for grouping the joints into
constellations, into foot and non-foot joints as shown above in the list of
joints. The left and right-
ankle joint types in the current example, are considered foot joints for the
purpose of this procedure.
The subject tracking engine 110 can start identification of sets of candidate
joints of particular
subjects using foot joints. In the embodiment of the shopping store, the feet
of the customers are on
the floor 220 as shown in Fig. 2A. The distance of the cameras 114 to the
floor 220 is known.
Therefore, when combining the joints data structures of foot joints from
arrays of data joints data
structures corresponding to images of cameras with overlapping fields of view,
the subject tracking
engine 110 can assume a known depth (distance along z axis). The value depth
for foot joints is zero
i.e. (x, y, 0) in the (x, y, z) coordinate system of the real space. Using
this information, the subject
tracking engine 110 applies homographic mapping to combine joints data
structures of foot joints
from cameras with overlapping fields of view to identify the candidate foot
joint Using this
mapping, the location of the joint in (x, y) coordinates in image space is
converted to the location in
CA 03177772 2022- 11-3
WO 2021/226392
PCT/US2021/031173
32
the (x, y, z) coordinates in the real space, resulting in a candidate foot
joint. This process is
performed separately to identify candidate left and right foot joints using
respective joints data
structures.
101221 Following this, the subject tracking engine 110 can
combine a candidate left foot
joint and a candidate right foot joint (assigns them to a set of candidate
joints) to create a subject.
Other joints from the galaxy of candidate joints can be linked to the subject
to build a constellation
of some or all of the joint types for the created subject.
101231 If there is only one left candidate foot joint and one
right candidate foot joint then it
means there is only one subject in the particular space at the particular
time. The tracking engine
110 creates a new subject having the left and the right candidate foot joints
belonging to its set of
joints. The subject is saved in the subject database 140. If there are
multiple candidate left and right
foot joints, then the global metric calculator attempts to combine each
candidate left foot joint to
each candidate right foot joint to create subjects such that the value of the
global metric is
minimized.
Non-foot Joints
101241 To identify candidate non-foot joints from arrays of
joints data structures within a
particular time and space boundary, the subject tracking engine 110 uses the
non-linear
transformation (also referred to as a fundamental matrix) from any given
camera A to its
neighboring camera B with overlapping fields of view. The non-linear
transformations are
calculated using a single multi-joint subject and stored in a calibration
database as described above.
For example, for two cameras A and B with overlapping fields of view, the
candidate non-foot joints
are identified as follows. The non-foot joints in arrays of joints data
structures corresponding to
elements in image frames from camera A are mapped to epipolar lines in
synchronized image
frames from camera B. A joint (also referred to as a feature in machine vision
literature) identified
by a joints data structure in an array of joints data structures of a
particular image of camera A will
appear on a corresponding epipolar line if it appears in the image of camera
B. For example, if the
joint in the joints data structure from camera A is a left-wrist joint, then a
left-wrist joint on the
epipolar line in the image of camera B represents the same left-wrist joint
from the perspective of
CA 03177772 2022- 11-3
WO 2021/226392
PCT/US2021/031173
33
camera B. These two points in images of cameras A and B are projections of the
same point in the
3D scene in real space and are referred to as a "conjugate pair".
101251 Machine vision techniques such as the technique by
Longuet-Higgins published in
the paper, titled, "A computer algorithm for reconstructing a scene from two
projections" in Nature,
Volume 293, 10 September 1981, are applied to conjugate pairs of corresponding
points to
determine height of joints from the floor 220 in the real space. Application
of the above method
requires predetermined mapping between cameras with overlapping fields of
view. That data can be
stored in a calibration database as non-linear functions determined during the
calibration of the
cameras 114 described above.
[01261 The subject tracking engine 110 receives the arrays of
joints data structures
corresponding to images in sequences of images from cameras having overlapping
fields of view,
and translates the coordinates of the elements in the arrays of joints data
structures corresponding to
images in different sequences into candidate non-foot joints having
coordinates in the real space.
The identified candidate non-foot joints are grouped into sets of subjects
having coordinates in real
space using a global metric calculator. The global metric calculator can
calculate the global metric
value and attempt to minimize the value by checking different combinations of
non-foot joints. In
one embodiment, the global metric is a sum of heuristics organized in four
categories. The logic to
identify sets of candidate joints comprises heuristic functions based on
physical relationships among
joints of subjects in real space to identify sets of candidate joints as
subjects. Examples of physical
relationships among joints are considered in the heuristics as described
below.
First Category of Heuristics
101271 The first category of heuristics includes metrics to
ascertain similarity between two
proposed subject-joint locations in the same camera view at the same or
different moments in time.
In one embodiment, these metrics are floating point values, where higher
values mean two lists of
joints are likely to belong to the same subject. Consider the example
embodiment of the shopping
store, the metrics determine the distance between a customer's same joints in
one camera from one
image to the next image along the time dimension. Given a customer A in the
field of view of the
camera, the first set of metrics determines the distance between each of
person A's joints from one
CA 03177772 2022- 11-3
WO 2021/226392
PCT/US2021/031173
34
image from the camera to the next image from the same camera. The metrics are
applied to joints
data structures 460 in arrays of joints data structures per image from cameras
114.
101281 In one embodiment, two example metrics in the first
category of heuristics are listed
below:
1. The inverse of the Euclidean 2D coordinate distance (using x, y coordinate
values for a
particular image from a particular camera) between the left ankle-joint of two
subjects on the
floor and the right ankle-joint of the two subjects on the floor summed
together.
2. The sum of the inverse of Euclidean 2D coordinate distance between every
pair of non-foot
joints of subjects in the image frame.
Second Cateizory of Heuristics
[01291 The second category of heuristics includes metrics to
ascertain similarity between
two proposed subject-joint locations from the fields of view of multiple
cameras at the same
moment in time. In one embodiment, these metrics are floating point values,
where higher values
mean two lists of joints are likely to belong to the same subject. Consider
the example embodiment
of the shopping store, the second set of metrics determines the distance
between a customer's same
joints in image frames from two or more cameras (with overlapping fields of
view) at the same
moment in time.
[0130] In one embodiment, two example metrics in the second
category of heuristics are
listed below:
1. The inverse of the Euclidean 2D coordinate distance (using x, y
coordinate values for a
particular image from a particular camera) between the left ankle-joint of two
subjects on the
floor and the right ankle-joint of the two subjects on the floor summed
together. The first
subject's ankle-joint locations are projected to the camera in which the
second subject is visible
through homographic mapping.
2. The sum of all pairs of joints of inverse of Euclidean 2D coordinate
distance between a line and
a point, where the line is the epipolar line of a joint of an image from a
first camera having a first
subject in its field of view to a second camera with a second subject in its
field of view and the
point is the joint of the second subject in the image from the second camera.
Third Category of Heuristics
CA 03177772 2022- 11-3
WO 2021/226392
PCT/US2021/031173
[01311 The third category of heuristics include metrics to
ascertain similarity between all
joints of a proposed subject-joint location in the same camera view at the
same moment in time.
Consider the example embodiment of the shopping store, this category of
metrics determines
distance between joints of a customer in one frame from one camera.
Fourth Category of Heuristics
[01321 The fourth category of heuristics includes metrics to
ascertain dissimilarity between
proposed subject-joint locations. In one embodiment, these metrics are
floating point values. Higher
values mean two lists of joints are more likely to not be the same subject. In
one embodiment, two
example metrics in this category include:
1. The distance between neck joints of two proposed subjects.
2. The sum of the distance between pairs of joints between two subjects.
[0133] In one embodiment, various thresholds which can be
determined empirically are
applied to the above listed metrics as described below:
1. Thresholds to decide when metric values are small enough to consider that a
joint belongs to a
known subject.
2. Thresholds to determine when there are too many potential candidate
subjects that a joint can
belong to with too good of a metric similarity score.
3. Thresholds to determine when collections of joints over time have high
enough metric similarity
to be considered a new subject, previously not present in the real space.
4. Thresholds to determine when a subject is no longer in the real space.
5. Thresholds to determine when the tracking engine I 10 has made a mistake
and has confused two
subjects.
[01341 The subject tracking engine 110 includes logic to store
the sets of joints identified as
subjects. The logic to identify sets of candidate joints includes logic to
determine whether a
candidate joint identified in images taken at a particular time corresponds
with a member of one of
the sets of candidate joints identified as subjects in preceding images. In
one embodiment, the
subject tracking engine 110 compares the current joint-locations of a subject
with previously
recorded joint-locations of the same subject at regular intervals. This
comparison allows the tracking
engine 110 to update the joint locations of subjects in the real space.
Additionally, using this, the
CA 03177772 2022- 11-3
WO 2021/226392
PCT/US2021/031173
36
subject tracking engine 110 identifies false positives (i.e., falsely
identified subjects) and removes
subjects no longer present in the real space.
101351 Consider the example of the shopping store embodiment, in
which the subject
tracking engine 110 created a customer (subject) at an earlier moment in time,
however, after some
time, the subject tracking engine 110 does not have current joint locations
for that particular
customer. It means that the customer was incorrectly created. The subject
tracking engine 110
deletes incorrectly generated subjects from the subject database 140. In one
embodiment, the subject
tracking engine 110 also removes positively identified subjects from the real
space using the above-
described process. Consider the example of the shopping store, when a customer
leaves the
shopping store, the subject tracking engine 110 deletes the corresponding
customer record from the
subject database 140. In one such embodiment, the subject tracking engine 110
updates this
customer's record in the subject database 140 to indicate that "customer has
left the store".
[0136) In one embodiment, the subject tracking engine 110
attempts to identify subjects by
applying the foot and non-foot heuristics simultaneously. This results in
"islands" of connected
joints of the subjects. As the subject tracking engine 110 processes further
arrays of joints data
structures along the time and space dimensions, the size of the islands
increases. Eventually, the
islands of joints merge to other islands of joints forming subjects which are
then stored in the subject
database 140. In one embodiment, the subject tracking engine 1.10 maintains a
record of unassigned
joints for a predetermined period of time. During this time, the tracking
engine attempts to assign
the unassigned joint to existing subjects or create new multi-joint entities
from. these unassigned
joints. The tracking engine 110 discards the unassigned joints after a
predetermined period of time.
It is understood that, in other embodiments, different heuristics than the
ones listed above are used
to identify and track subjects.
[0137] In one embodiment, a user interface output device
connected to the node 102 hosting
the subject tracking engine 110 displays position of each subject in the real
spaces. In one such
embodiment, the display of the output device is refreshed with new locations
of the subjects at
regular intervals.
Detecting Proximity events
CA 03177772 2022- 11-3
WO 2021/226392
PCT/US2021/031173
37
[0138] The technology disclosed can detect proximity events when
the distance between a
source and a sink is below a threshold. Fig 5A shows an example of graphical
illustration of
detected proximity events over a time in the area of real space. The distance
between sources and
sinks are plotted along y-axis and time is represented along x-axis. In the
example graph, a
proximity event 1 is detected when the distance between a source and a sink
falls below the
threshold distance. Note that for a second proximity event to be detected for
the same source and the
same sink, the distance between the source and sink needs to increase above
the threshold distance.
The graph illustrates that the distance between the source and sink increases
above the threshold
distance before a second event (event 2) is detected. A source and a sink can
be an inventory cache
linked to a subject (such as a shopper) in the area of real space or an
inventory cache having a
location on a shelf in an inventory display structure. Therefore, the
technology disclosed can not
only detect item puts and takes from shelves on inventory display structures
but also item hand-offs
or item exchanges between shoppers in the store.
[0139] In one embodiment, the technology disclosed uses the
positions of hand joints of
subjects and positions of shelves to detect proximity events. For example, the
system can calculate
distance of left-hand and right-hand joints, or joints corresponding to hands,
of every subject to left-
hand and right-hand joints of every other subject in the area of real space or
shelf locations at every
time interval. The system can calculate these distances at every second or
less than one second time
interval. In one embodiment, the system can calculate the distances between
hand joints of subjects
and shelves per aisle or per portion of the area of real space to improve
computational efficiency as
the subjects can hand off items to other subjects that are positioned close to
each other. The system
can also use other joints of subjects to detect proximity events, for example,
if one or both hand
joints of a subject are occluded, the system can use left and right elbow
joints of this subject when
calculating the distance to hand joints of other subjects and shelves. If the
elbow joints of the subject
are also occluded, then the system can use left and right shoulder joints of
the subject to calculate its
distance from other subjects and shelves. The system can use the positions of
shelves and other
static objects such as bins, etc. from the location data stored in the maps
database.
[01401 Fig. 5B presents an example illustration of a portion of
the area of real space (such as
a shopping store). The position of subjects in the portion of the area of real
space at a time ti is
shown in the illustration 530. The subjects are illustrated as stick figures
with left and right hand
CA 03177772 2022- 11-3
WO 2021/226392
PCT/US2021/031173
38
joints. At the time ti, there are four subjects 540, 542, 544, and 546 in the
area of real space shown.
The hand joints (left or right) of none of the subjects are closer to the hand
joints (left or right) of
any other subject at the time ti than a pre-determined threshold. The updated
positions of the
subjects 540, 542, 544, and 546 are shown at a time t2 in an illustration 535
in Fig. 5B. The hand
joints of the subjects 540 and 544 are positioned closer than a threshold
distance. The system thus,
detects a proximity event at a time t2. Note that a proximity event does not
necessarily indicate hand
off of items between subjects 540 and 542. The technology disclosed includes
logic that can indicate
the type of the proximity event. A first type of proximity event can be a
"put" event in which the
item is handed off from a source to a sink. For example, a subject (source)
who is holding the item
prior to the proximity event, can give the item to another subject (sink) or
place it on a shelf (sink)
following the proximity event. A second type of proximity events can be a
"take" event in which a
subject (sink) who is not holding the item prior to the proximity event can
take an item from another
subject (source) or a shelf (source) following the event. A third type of
proximity event is a "touch"
event in which there is no exchange of items between a source and a sink.
Example of touch event
can include a subject holding the item on a shelf for a moment and then
putting the item back on the
shelf and moving away from the shelf. Another example of a touch event can
occur when hands of
two subjects move closer to each other such that the distance between the
hands of two subjects is
less than the threshold distance. However, there is no exchange of items from
the source (the subject
who is holding the item prior to the proximity event) to the sink (the subject
who is not holding the
item prior to the proximity event).
[01411 We now describe the subject data structures and process
steps for subject tracking.
Following this, we present the details of the joints CNN model that can be
used to identify and track
subjects in the area of real space. Then we present WhatCNN model which can be
used to predict
items in the hands of subjects in the area of real space. In one embodiment,
the technology disclosed
can use output from the WhatCNN model indicating whether a subject is holding
an item or not. The
WhatCNN can also predict an item identifier of the item that a subject is
holding.
Subject Data Structure
[01421 The joints of the subjects are connected to each other
using the metrics described
above. In doing so, the subject tracking engine 110 creates new subjects and
updates the locations of
CA 03177772 2022- 11-3
WO 2021/226392
PCT/US2021/031173
39
existing subjects by updating their respective joint locations. Fig. 6 shows
the subject data. structure
600 to store the subjects in the area of real space. The data structure 600
stores the subject related
data as a key-value dictionary. The key is a frame number and value is another
key-value dictionary
where key is the camera Id and value is a list of 18 joints (of the subject)
with their locations in the
real space. The subject data is stored in the subject database 140. Every new
subject is also assigned
a unique identifier that is used to access the subject's data in the subject
database 140.
101431 In one embodiment, the system identifies joints of a
subject and creates a skeleton of
the subject. The skeleton is projected into the real space indicating the
position and orientation of the
subject in the real space. This is also referred to as "pose estimation" in
the field of machine vision.
In one embodiment, the system displays orientations and positions of subjects
in the real space on a
graphical user interface (GUI). In one embodiment, the image analysis is
anonymous, i.e., a unique
identifier assigned to a subject created through joints analysis does not
identify personal
identification details (such as names, email addresses, mailing addresses,
credit card numbers, bank
account numbers, driver's license number, etc.) of any specific subject in the
real space.
Process Flow of Subject Tracking
[0144] A. number of flowcharts illustrating subject detection
and tracking logic are described
herein. The logic can be implemented using processors configured as described
above programmed
using computer programs stored in memory accessible and executable by the
processors, and in
other configurations, by dedicated logic hardware, including field
programmable integrated circuits,
and by combinations of dedicated logic hardware and computer programs. With
all flowcharts
herein, it will be appreciated that many of the steps can be combined,
performed in parallel, or
performed in a different sequence, without affecting the functions achieved.
In some cases, as the
reader will appreciate, a rearrangement of steps will achieve the same results
only if certain other
changes are made as well. In other cases, as the reader will appreciate, a
rearrangement of steps will
achieve the same results only if certain conditions are satisfied.
Furthermore, it will be appreciated
that the flow charts herein show only steps that are pertinent to an
understanding of the
embodiments, and it will be understood that numerous additional steps for
accomplishing other
functions can be performed before, after and between those shown.
[0145] Fig. 7 is a .flowchart illustrating process steps for
tracking subjects. The process starts
at step 702. The cameras 114 having field of view in an area of the real space
are calibrated in
CA 03177772 2022- 11-3
WO 2021/226392
PCT/US2021/031173
process step 704. The calibration process can include identifying a (0, 0, 0)
point for (x, y, z)
coordinates of the real space. A first camera with the location (0, 0, 0) in
its field of view is
calibrated. More details of camera calibration are presented earlier in this
application. Following
this, a next camera with overlapping field of view with the first camera is
calibrated. The process is
repeated at step 704 until all cameras 114 are calibrated. In a next process
step of camera calibration,
a subject is introduced in the real space to identify conjugate pairs of
corresponding points between
cameras with overlapping fields of view. Some details of this process are
described above. The
process is repeated for every pair of overlapping cameras. The calibration
process ends if there are
no more cameras to calibrate.
[01461 Video processes are performed at step 706 by image
recognition engines 112a-112n.
In one embodiment, the video process is performed per camera to process
batches of image frames
received from respective cameras. The output of all or some of the video
processes from respective
image recognition engines 112a-112n are given as input to a scene process
performed by the
tracking engine 110 at step 708. The scene process identifies new subjects and
updates the joint
locations of existing subjects. At step 710, it is checked if there are more
image frames to be
processed. If there are more image frames, the process continues at step 706,
otherwise the process
ends at step 712.
[01471 A flowchart in Fig. 8 shows more detailed steps of the
"video process" step 706 in
the flowchart of Fig. 7. At step 802, k-contiguously timestamped images per
camera are selected as
a batch for further processing. In one embodiment, the value of k = 6 which is
calculated based on
available memory for the video process in the network nodes 101a-101n,
respectively hosting image
recognition engines 112a-112n. It is understood that the technology disclosed
can process image
batches of greater than or less than six images. In a next step 804, the size
of images is set to
appropriate dimensions. In one embodiment, the images have a width of 1280
pixels, height of 720
pixels and three channels RGB (representing red, green and blue colors). At
step 806, a plurality of
trained convolutional neural networks (CNN) process the images and generate
arrays of joints data
structures per image. The output of the CNNs are arrays of joints data
structures per image (step
808). This output is sent to a scene process at step 810.
[01481 Fig. 9A is a flowchart showing a first part of more
detailed steps for "scene process"
step 708 in Fig. 7. The scene process combines outputs from multiple video
processes at step 902.
CA 03177772 2022- 11-3
WO 2021/226392
PCT/US2021/031173
41
At step 904, it is checked whether a joints data structure identifies a foot
joint or a non-foot joint. If
the joints data structure is of a foot-joint, homographic mapping is applied
to combine the joints data
structures corresponding to images from cameras with overlapping fields of
view at step 906. This
process identifies candidate foot joints (left and right foot joints). At step
908 heuristics are applied
on candidate foot joints identified in step 906 to identify sets of candidate
foot joints as subjects. It is
checked at step 910 whether the set of candidate foot joints belongs to an
existing subject. If not, a
new subject is created at step 912. Otherwise, the existing subject is updated
at step 914.
101491 A flowchart in Fig. 9B illustrates a second part of more
detailed steps for the "scene
process" step 708. At step 940, the data structures of non-foot joints are
combined from multiple
arrays of joints data structures corresponding to images in the sequence of
images from cameras
with overlapping fields of view. This is performed by mapping corresponding
points from a first
image from a first camera to a second image from a second camera with
overlapping fields of view.
Some details of this process are described above. Heuristics are applied at
step 942 to candidate non-
foot joints. At step 946 it is determined whether a candidate non-foot joint
belongs to an existing
subject. If so, the existing subject is updated at step 948. Otherwise, the
candidate non-foot joint is
processed again at step 950 after a predetermined time to match it with an
existing subject. At step
952 it is checked whether the non-foot joint belongs to an existing subject.
If true, the subject is
updated at step 956. Otherwise, the joint is discarded at step 954.
[0150] In an example embodiment, the processes to identify new
subjects, track subjects and
eliminate subjects (who have left the real space or were incorrectly
generated) are implemented as
part of an "entity cohesion algorithm" performed by the runtime system (also
referred to as the
inference system). An entity is a constellation of joints referred to as
subject above. The entity
cohesion algorithm identifies entities in the real space and updates locations
of the joints in real
space to track movement of the entity.
Classification of Proximity events
[0151] We now describe the technology to identify a type of the
proximity event by
classifying the detected proximity events. The proximity event can be a take
event, a put event, a
hand-off event or a touch event. The technology disclosed can further identify
an item associated
with the identified event. A system and various implementations for tracking
exchanges of inventory
CA 03177772 2022- 11- 3
WO 2021/226392
PCT/US2021/031173
42
items between sources and sinks in an area of real space are described with
reference to Figs. 10A
and 10B. The system and processes described with reference to Figs. 10A and
10B, which are
architectural level schematic of a system in accordance with an
implementation. Because Figs. 10A
and 10B are an architectural diagram, certain details are omitted to improve
the clarity of the
description.
[0152] The technology disclosed comprises of multiple image
processors that can detect put
and take events in parallel. We can also refer to these image processors as
image processing
pipelines that process the sequences of images from cameras 114. The system
can then fuse the
outputs from two or more image processors to generate an output identifying
the event type and the
item associated with the event. The multiple processing pipelines for
detecting put and take events
increases the robustness of the system as the technology disclosed can predict
a take and put of an
item in an area of real space using the output of one of the image processors
when the other image
processors cannot generate a reliable output for that event. The first image
processors 1004 uses
locations of subjects and locations of inventory display structures to detect
"proximity events"
which are further processed to detect put and take events. The second image
processors 1006 use
bounding boxes of hand images of subjects in the area of real space and
perform time series analysis
of classification of hand images to detect region proposals-based put and take
events. The third
images processors 1022 can use masks to remove foreground objects (such as
subjects or shoppers)
from images and process background images (of shelves) to detect change events
(or cliff events)
indicating puts and takes of items. The put and take events (or exchanges or
items between sources
and sinks) detected by the three image processors can be referred to as
"inventory events".
[0153] The same cameras and the same sequences of images are
used by first image
processors 1004 (predicting location-based inventory events), second image
processors 1006
(predicting region proposals-based inventory events) and the third image
processors 1022
(predicting semantic di ffing-based inventory events), in one implementation.
As a result, detections
of puts, takes, transfers (exchanges), or touch of inventory items are
performed by multiple
subsystems (or procedures) using the same input data allowing for high
confidence, and high
accuracy, in the resulting data.
[0154] In Fig. 10A, we present the system architecture
illustrating the first and the second
image processors and fusion logic to combine their respective outputs. In Fig.
10B, we present a
CA 03177772 2022- 11-3
WO 2021/226392
PCT/US2021/031173
43
system architecture illustrating the first and the third image processors and
fusion logic to combine
their respective outputs. It should be noted that all three image processors
can operate in parallel and
the outputs of any combination of the two or more image processors can be
combined. The system
can also detect inventory events using one of the image processors.
Location-based Events and Region Proposals-based Events
101551 Fig. 10A is a high-level architecture of two pipelines of
neural networks processing
image frames received from cameras 114 to generate shopping cart data
structures for subjects in the
real space. The system described here includes per camera image recognition
engines as described
above for identifying and tracking multi-joint subjects. Alternative image
recognition engines can be
used, including examples in which only one "joint" is recognized and tracked
per individual, or
other features or other types of image data over space and time are utilized
to recognize and track
subjects in the real space being processed.
[01561 The processing pipelines run in parallel per camera,
moving images from respective
cameras to image recognition engines 112a-112n via circular buffers 1002 per
camera. In one
embodiment, the first image processors subsystem 1004 includes image
recognition engines 112a-
112n implemented as convolutional neural networks (CNNs) and referred to as
joint CNNs 112a-
112n. As described in relation to Fig. 1, cameras 114 can be synchronized in
time with each other,
so that images are captured at the same time, or close in time, and at the
same image capture rate.
Images captured in all the cameras covering an area of real space at the same
time, or close in time,
are synchronized in the sense that the synchronized images can be identified
in the processing
engines as representing different views at a moment in time of subjects having
fixed positions in the
real space.
[01571 In one embodiment, the cameras 114 are installed in a
shopping store (such as a
supermarket) such that sets of cameras (two or more) with overlapping fields
of view are positioned
over each aisle to capture images of real space in the store. There are N
cameras in the real space,
represented as cainera(i) where the value of i ranges from 1 to N. Each camera
produces a sequence
of images of real space corresponding to its respective field of view.
[01581 In one embodiment, the image frames corresponding to
sequences of images from
each camera are sent at the rate of 30 frames per second (fps) to respective
image recognition
CA 03177772 2022- 11-3
WO 2021/226392
PCT/US2021/031173
44
engines 112a-112n. Each image frame has a timestamp, identity of the camera
(abbreviated as
"camera_id"), and a frame identity (abbreviated as "frame id") along with the
image data. The
image frames are stored in a circular buffer 1502 (also referred to as a ring
buffer) per camera 114.
Circular buffers 1002 store a set of consecutively timestamped image frames
from respective
cameras 114. In some embodiments, an image resolution reduction process, such
as downsampling
or decimation, is applied to images output from the circular buffers 1002,
before input to the Joints
CNN 122a-122n.
101591 A joints CNN processes sequences of image frames per
camera and identifies 18
different types of joints of each subject present in its respective field of
view. The outputs of joints
CNNs 112a-112n corresponding to cameras with overlapping fields of view are
combined to map
the location of joints from 2D image coordinates of each camera to 3D
coordinates of real space.
The joints data structures 460 per subject (j) where j equals Ito x, identify.
locations of joints of a
subject (j) in the real space. The details of subject data structure 460 are
presented in Fig. 4B. In one
example embodiment, the joints data structure 460 is a two-level key-value
dictionary of joints of
each subject. A first key is the frame_number and the value is a second key-
value dictionary with
the key as the camera _id and the value as the list of joints assigned to a
subject.
101601 The data sets comprising subjects identified by joints
data structures 460 and
corresponding image frames from sequences of image frames per camera are given
as input to a
bounding box generator 1008 in the second image processors subsystem 1006 (or
the second
processing pipeline). The second image processors produce a stream of region
proposals-based
events stream, shown as events stream B in Fig. 10A. The second image
processors subsystem
further comprise foreground image recognition engines. In one embodiment, the
foreground image
recognition engines recognize semantically significant objects in the
foreground (i.e., shoppers, their
hands and inventory items) as they relate to puts and takes of inventory items
for example, over time
in the images from each camera. In the example implementation shown in Fig.
10A, the foreground
image recognition engines are implemented as VVhatCNN 1010 and WhenCNN 1012.
The bounding
box generator 1008 implements the logic to process data sets to specify
bounding boxes which
include images of hands of identified subjects in images in the sequences of
images. The bounding
box generator 1008 identifies locations of hand joints in each source image
frame per camera using
locations of hand joints in the multi-joints data structures (also referred to
as subject data structures)
CA 03177772 2022- 11-3
WO 2021/226392
PCT/US2021/031173
600 corresponding to the respective source image frame. In one embodiment, in
which the
coordinates of the joints in subject data structure indicate location of
joints in 3D real space
coordinates, the bounding box generator maps the joint locations from 3D real
space coordinates to
2D coordinates in the image frames of respective source images.
101611 The bounding box generator 1008 creates bounding boxes
for hand joints in image
frames in a circular buffer per camera 114. In some embodiments, the image
frames output from the
circular buffer to the bounding box generator has full resolution, without
down sampling or
decimation, alternatively with a resolution higher than that applied to the
joints CNN. In one
embodiment, the bounding box is a 128 pixels (width) by 128 pixels (height)
portion of the image
frame with the hand joint located in the center of the bounding box. In other
embodiments, the size
of the bounding box is 64 pixels x 64 pixels or 32 pixels x 32 pixels. For m
subjects in an image
frame from a camera, there can be a maximum of 2m hand joints, thus 2m
bounding boxes.
However, in practice fewer than 2in hands are visible in an image frame
because of occlusions due
to other subjects or other objects. In one example embodiment, the hand
locations of subjects are
inferred from locations of elbow and wrist joints. For example, the right-hand
location of a subject is
extrapolated using the location of the right elbow (identified as pl) and the
right wrist (identified as
p2) as extrapolation_amount * (p2 ¨ pl) + p2 where extrapolation_amount equals
0.4. In another
embodiment, the joints CNN 112a-112n are trained using left- and right-hand
images. Therefore, in
such an embodiment, the joints CNN 112a-112n directly identify locations of
hand joints in image
frames per camera. The hand locations per image frame are used by the bounding
box generator
1008 to create a bounding box per identified hand joint.
[0162] WhatCNN 1010 is a convolutional neural network trained to
process the specified
bounding boxes in the images to generate a classification of hands of the
identified subjects. One
trained WhatCNN 1010 processes image frames from one camera. In the example
embodiment of
the shopping store, for each hand joint in each image frame, the WhatCNN 1010
identifies whether
the hand joint is empty. The WhatCNN 1010 also identifies a WU (stock keeping
unit) number of
the inventory item in the hand joint, a confidence value indicating die item
in the hand joint is a non-
SKU item (i.e. it does not belong to the shopping store inventory) and a
context of the hand joint
location in the image frame.
CA 03177772 2022- 11-3
WO 2021/226392
PCT/US2021/031173
46
[0163] The outputs of WhatCNN models 1010 for all cameras 114
are processed by a single
WhenCNN model 1012 for a pre-determined window of time. In the example of a
shopping store,
the WhenCNN 1012 performs time series analysis for both hands of subjects to
identify whether a
subject took a store inventory item from a shelf or put a store inventory item
on a shelf. A stream of
put and take events (also referred to as region proposals-based inventory
events) is generated by the
WhenCNN 1012 and is labeled as events stream B in Fig. 10B. The put and take
events from the
event stream are used to update the log data structures of subjects (also
referred to as shopping cart
data structures including list of inventory items). A log data structure 1020
is created per subject to
keep a record of the inventory items in a shopping cart (or basket) associated
with the subject. The
log data structures per shelf and per store can be generated to indicate items
on shelves and in a
store. The system can include an inventory database to store the log data
structures of subjects,
shelves and stores.
Video Processes and Scene Process to Classify Region Proposals
[0164] In one embodiment of the system, data from a so called
"scene process" and multiple
"video processes" is given as input to WhatCNN model 1010 to generate hand
image classifications.
Note that the output of each video process is given to a separate WhatCNN
model. The output from
the scene process is a joints dictionary. In this dictionary, keys are unique
joint identifiers and values
are unique subject identifiers with which the joint is associated. If no
subject is associated with a
joint, then it is not included in the dictionary. Each video process receives
a joints dictionary from
the scene process and stores it into a ring buffer that maps frame numbers to
the returned dictionary.
Using the returned key-value dictionary, the video processes select subsets of
the image at each
moment in time that are near hands associated with identified subjects. These
portions of image
frames around hand joints can be referred to as region proposals.
[0165] In the example of a shopping store, a "region proposal"
is the frame image of hand
location from one or more cameras with the subject in their corresponding
fields of view. A region
proposal can be generated from sequences of images from all cameras in the
system. It can include
empty hands as well as hands carrying shopping store inventory items and items
not belonging to
shopping store inventory. Video processes select portions of image frames
containing hand joint per
moment in time. Similar slices of foreground masks are generated. The above
(image portions of
CA 03177772 2022- 11-3
WO 2021/226392
PCT/US2021/031173
47
hand joints and foreground masks) are concatenated with the joints dictionary
(indicating subjects to
whom respective hand joints belong) to produce a multi-dimensional array. This
output from video
processes is given as input to the WhatCNN model.
101661 The classification results of the WhatCNN model can be
stored in the region proposal
data structures. All regions for a moment in time are then given back as input
to the scene process.
The scene process stores the results in a key-value dictionary, where the key
is a subject identifier
and the value is a key-value dictionary, where the key is a camera identifier
and the value is a
region's logits. This aggregated data structure is then stored in a ring
butler that maps frame
numbers to the aggregated structure for each moment in time.
[01671 Region proposal data structures for a period of time
e.g., for one second, are given as
input to the scene process. In one embodiment, in which cameras are taking
images at the rate of 30
frames per second, the input includes 30 time periods and corresponding region
proposals. The
system includes logic (also referred to as scene process) that reduces 30
region proposals (per hand)
to a single integer representing the inventory item SKU. The output of the
scene process is a key-
value dictionary in which the key is a subject identifier and the value is the
SKU integer.
[01681 The WhenCNN model 1012 performs a time series analysis to
determine the
evolution of this dictionary over time. This results in identification of
items taken from shelves and
put on shelves in the shopping store. The output of the WhenCNN model is a
key-value dictionary
in which the key is the subject identifier and the value is logits produced by
the WhenCNN. In one
embodiment, a set of heuristics can be used to determine the shopping cart
data structure 1020 per
subject. The heuristics are applied to the output of the WhenCNN, joint
locations of subjects
indicated by their respective joints data structures, and planogmms. The
heuristics can also include
the planograrns that are precomputed maps of inventory items on shelves. The
heuristics can
determine, for each take or put, whether the inventory item is put on a shelf
or taken from a shelf,
whether the inventory item is put in a shopping cart (or a basket) or taken
from the shopping cart (or
the basket) or whether the inventory item is close to the identified subject's
body
[0169] We now refer back to Fig. 10A to present the details or
the first image processors
1004 for location-based put and take detection. The first image processors can
be referred to as the
first image processing pipeline. It can include a proximity event detector
1014 that receives
information about inventory caches linked to subjects identified by joints
data structures 460. The
CA 03177772 2022- 11-3
WO 2021/226392
PCT/US2021/031173
48
proximity event detector includes the logic to process positions of hand
joints (left and right) of
subjects, or other joints corresponding to inventory caches, to detect when a
subject's position is
closer to another subject than a pre-defined threshold such as 10 cm. Other
values of threshold less
than or greater than 10 cm can be used. The distance between the subjects is
calculated using the
positions of their hands (left and right). If one or both hands of a subject
are occluded, the proximity
event detector can use positions of other joints of subjects such as elbow
joint, or shoulder joint, etc.
The above positions calculation logic can be applied per hand per subject in
all image frames in the
sequence of image frames per camera to detect proximity events. In other
embodiments, the system
can apply the distance calculation logic after every 3 frames, 5 frames or 10
frames in the sequence
of frames. The system can use other frame intervals or time intervals to
calculate the distance
between subjects or the distance between subjects and shelves.
[01701 If a proximity event is detected by the proximity event
detector 1014, the event type
classifier 1016 processes the output from the WhatCNN 1010 to classify the
event as one of a take
event, put event, touch event, or a transfer or exchange event. The event type
classifier receives the
holding probability for the hand joints of subjects identified in the
proximity event. The holding
probability indicates a confidence score indicating whether the subject is
holding an item or not. A
large positive value indicates that WhatCNN model has a high level of
confidence that the subject is
holding an item. A large negative value indicates that the model is confident
that the subject is not
holding any item. A close to zero value of the holding probability indicates
that WhatCNN model is
not confident in predicting whether the subject is holding an item or not.
[01711 Fig. 11A present example graphs illustrating holding
probabilities for take, put and
touch events, respectively. The holding probability values are plotted on y-
axis and time is plotted
along the x-axis. The time of proximity event is shown as a vertical broken
line on the three graphs.
[01721 The first graph 1110 in Fig. 11A presents the holding
values for a take event over a
period of time. In one embodiment, the system calculates an average of holding
values for N frames
after the frame in which the proximity event is detected and uses this value
to detect the take event.
For a take event, the difference between average holding probability (over N
frames) after the event
and holding probability in a frame after the event is greater than a
threshold. We can see that the
holding probability value increases after the proximity event in case of a
take event. Note that the
holding probability is for the sink subject who is holding the item in her
hand after the proximity
CA 03177772 2022- 11-3
WO 2021/226392
PCT/US2021/031173
49
event. The sink subject may have been handed the item from a source subject or
she may have taken
the item from a source shelf
101731 The second graph 1120 in Fig. 11A presents the holding
values for a put event over a
period of time. In one embodiment, the system calculates an average of holding
values for N frames
after the frame in which the proximity event is detected and uses this value
to detect the put event.
For a put event, the difference between average holding probability (over N
frames) after the event
and holding probability in a frame after the event is less than a negative
threshold. We can see that
the values of holding probability decrease after the put proximity event. This
is because the source
subject is not holding the item in her hand after handing it over to a sink
subject or putting it on a
sink shelf.
[01741 The third graph 1130 in Fig. 11A presents holding values
for a touch event over a
period of time. In one embodiment, the system calculates an average of holding
values for N frames
before the frame in which the proximity event is detected and uses this value
to detect the touch
event. For a touch event, the difference between average holding probability
(over N frames) before
the event and holding probability in a frame after the event is less than a
negative threshold. We can
see that holding probability is low before the proximity event, its value
increase for a short period of
time after the proximity event occurrence and then falls again. This is
because in a touch event a
subject does not take the item from a shelf or from another subject,
therefore, the holding probability
value decreases after the proximity event.
[01751 Referring back to Fig. 10A, the event type classifier
1016 can take the holding
probability values over N frames before and after the proximity event as input
to detect whether the
event detected is a take event, a put event, a touch event, or a transfer or
exchange event. If a take
event is detected, the system can use the average item class probability from
WhatCNN over N
frames after the proximity event to determine the item associated with the
proximity event. Fig. 11B
illustrates the hand-off or exchange of an item from the source subject to the
sink subject. The sink
subject may also have taken the detected item from a shelf or another
inventory location. This item
can then be added to the log data structure of the sink subject.
[01761 As shown in Fig. 11B, the exchange or transfer of item
between two shoppers (or
subjects) includes two events: a take event and a put event. For the put
event, the system can take
the average item class probability from WhatCNN over N frames before the
proximity event to
CA 03177772 2022- 11-3
WO 2021/226392
PCT/US2021/031173
determine the item associated with the proximity event. The item detected is
handed-off from the
source subject to the sink subject. The source subject may also have put the
item on a shelf or
another inventory location. The detected item can then be removed from the log
data structure of the
source subject. The system detects a take event for the source subject and
adds the item to the
subject's log data structure. A touch event does not result in any changes to
the log data structures of
the source and sink in the proximity event
Methods to Detect Proximity events
10177] We present examples of methods to detect proximity
events. One example is based
on heuristics using data about the locations of joints such as hand joints,
and other examples use
machine learning models that process data about locations of joints.
Combinations of heuristics and
machine learning models can used in some embodiments
Method 1; Using Heuristics to Detect Proximity events
10178] The system detects positions of both hands of shoppers
(or subjects) per frame per
camera in the area of real space. Other joints or other inventory caches which
move over time and
are linked to shoppers can be used. The system calculates distances of left
hand and right hand of
each shopper to left hand and right hands of other shoppers in the area of
real space. In one
embodiment, the system calculates distances between hands of shoppers per
portion of the area of
real space, for example in each aisle of the shopping store. The system also
calculates distances of
left hand and right hand of each shopper per frame per camera to the nearest
shelf in the inventory
display structure. The shelves can be represented by a plane in a 3D
coordinate system or by a 3D
mesh. The system analyzes the time series of hand distances over time by
processing sequences of
image frames per camera.
[0179] The system selects a hand (left or right) per subject per
frame that has a minimum
distance (of the two hands) to the hand (left or right) of another shopper or
to a shelf (i.e. fixed
inventory cache). The system also determines if the hand is "in the shelf'.
The hand is considered
"in the shelf" if the (signed) distance between the hand and the shelf is
below a threshold. A
negative distance between the hand and shelf indicates that the hand has gone
past the plane of the
shelf If the hand is in the shelf for more than a pre-defined number of frames
(such as M frames),
CA 03177772 2022- 11-3
WO 2021/226392
PCT/US2021/031173
51
then the system detects a proximity event when the hand moves out of the
shelf. The system
determines that the hand has moved out of the shelf when the distance between
the hand and shelf
increases above a threshold distance. The system assigns a timestamp to the
proximity event which
can be a midpoint between the entrance time of the hand in the shelf and the
exit time of the hand
from the shelf. The hand associated with the proximity event is the hand (left
or right) that has the
minimum distance to the shelf at the time of the proximity event. Note that
the entrance time can be
the timestamp of the frame in which the distance between the shelf and hand
falls below the
threshold as mentioned above. The exit time can be the timestamp of the frame
in which the distance
between the shelf and the hand increases above the threshold.
Method 2: Applying a Decision Tree Model to Detect Proximity events
[01801 The second method to detect proximity events uses a
decision tree model that uses
heuristics and/or machine learning. The heuristics-based method to detect the
proximity event might
not detect proximity events when one or both hands of subjects are occluded in
image frames from
the sensors. This can result in missed detections of proximity events which
can cause errors in
updates to log data structures of shoppers. Therefore, the system can include
an additional method
to detect proximity events for robust event detections. If the system cannot
detect one or both hands
of an identified subject in an image frame, the system can use (left or right)
elbow joint positions
instead. The system can apply the same logic as described above to detect the
distance of the elbow
joint to a shelf or (left or right) hand of another subject to detect
proximity event, if the distance falls
below a threshold distance. If the elbow of the subject is occluded as well,
then the system can use
shoulder joint to detect a proximity event.
101811 Shopping stores can use different types of shelves having
different properties, e.g.,
depth of shelf, height of shelf, and space between shelves, etc. The
distribution of occlusions of
subjects (or portions of subjects) induced by shelves at different camera
angles is different, we can
train one or more decision tree models using labeled data. The labeled data
can include corpus of
example image data. We can train a decision tree that takes in a sequence of
distances, with some
missing data to simulate occlusions, of shelves to joints over a period of
time. The decision tree
outputs whether an event happened in the time range or not. In case of a
proximity event prediction,
the decision tree also predicts the time of the proximity event (relative to
the initial frame).
CA 03177772 2022- 11-3
WO 2021/226392
PCT/US2021/031173
52
[0182] We present an example decision tree in Fig. 18A for
predicting location-based events
using distance of joints to shelves. The inputs to the decision tree are
median distances of three-
dimensional keypoints (3D keypoints) to shelves. A 3D keypoint can represent a
three-dimensional
position in the area of real space. The three-dimensional position can be a
position of a joint in the
area of real space. The outputs from the decision tree model are event
classifications i.e., event or no
event. The example decision tree in Fig. 18A has a depth of 3. it is
understood that decision trees of
depths greater than or less than 3 can be used. The example decision tree
illustrates detection of
location-based events using positions of left joints of subjects (e.g., left
hand, left elbow, and left
shoulder). Similar decision tree can be trained using right joints of subjects
(e.g., right hand, right
elbow, and right shoulder). Positions of other joints can also be used for
predicting location-based
events.
[0183] The example decision tree 1800 in Fig. 18A includes a
root node at depth 0, two
nodes at depth 1, four nodes at depth 1, and eight nodes at depth 3. The nodes
at depth 3 are also
known as leaf nodes as they do not have any child nodes. At each node of the
decision tree 1800, we
present example parameter values. The distance of joints to shelves is
compared with threshold
values. For example, at the root node, the position of left hand is compared
with a threshold of -
11.08. Note that negative values indicate an overlap of shelf with a joint
position as described above.
Similarly, positions of other joints such as left shoulder and left elbow are
compared with threshold
values at other nodes as shown in the example decision tree. At each node, the
decision tree
compares positions of left joints of subjects (such as left hand, left elbow
and left shoulder) with
threshold values. The technology disclosed can use similar decision tree for
positions of right joints
of subjects (such as right hand, right elbow, and right shoulder). Other
joints of the subjects can also
be used in the decision tree for event classification.
[0184] The nodes of example decision tree also show other
parameters such as "gini",
"samples", "value", and "class". A "gini" score is a metric that quantifies
the purity of the node. A
"gini" score greater than zero implies that samples contained within that node
belong to different
classes. A "OM" score of zero means that the node is pure i.e., within that
node only a single class
of samples exist. The value of "samples" parameter indicates the number of
samples in the dataset.
As we move to different levels of the tree, the value of the "samples"
parameter changes to indicate
the number of samples contained at respective nodes. The "value" is a list
parameter that indicates
CA 03177772 2022- 11-3
WO 2021/226392
PCT/US2021/031173
53
the number of samples falling in each class (or category). The first value in
the list indicates number
of samples in the "no event" class and the second value in the list indicates
number of samples in the
"event" class. Finally, the "class" parameter shows the prediction of a given
node. The class
prediction can be determined from wthe "value" list Whichever class occurs the
most within the
node is selected as the predicted class.
Method 3: Applying a Random Forest Model to Detect Proximity events
[0185] The third method for detecting proximity events uses an
ensemble of decision trees.
In one embodiment, we can use the trained decision trees from the method 2
above to create the
ensemble random forest. Random forest classifier (also referred to as random
decision forest) is an
ensemble machine learning technique. Ensembled techniques or algorithms
combine more than one
technique of the same or different kind for classifying objects. The random
forest classifier consists
of multiple decision trees that operate as an ensemble. Each individual
decision tree in random
forest acts as base classifier and outputs a class prediction. The class with
the most votes becomes
the random forest model's prediction. The fundamental concept behind random
forests is that a large
number of relatively uncorrelated models (decision trees) operating as a
committee will outperform
any of the individual constituent models.
10186i Fig. 18B illustrates training of a random forest model
and application of a trained
model in production. A random forest classifier with multiple decision trees
and a depth of 2 to 8 or
more can be used. Increasing the number of trees can increase the model
performance however, it
can also increase the time required for training. A training database 1811
including features for
labeled images is used to train the random forest classifier as shown in the
illustration 1801. In one
embodiment, the training database comprises of sequences of labeled image
frames with an initial
frame including the distance between the (left or right) hand of a subject is
positioned closer to
another hand of a subject or a shelf. The sequence can include a series of
image frames including the
frames in which the distance between the hands or the hand and the shelf
becomes (negative)
indicating occlusion or overlap of a hand by another hand or shelf. The
sequence of frames ends
when the hands move away from each other or the shelf.
[0187] Decision trees are prone to overfttting. To overcome this
issue, bagging technique is
used to train the decision trees in random forest. Bagging is a combination of
bootstrap and
aggregation techniques. In bootstrap, during training, we take a sample of
rows from our training
CA 03177772 2022- 11-3
WO 2021/226392
PCT/US2021/031173
54
database and use it to train each decision tree in the random forest. For
example, a subset of features
for the selected rows can be used in training of decision tree 1. Therefore,
the training data for
decision tree 1 can be referred to as row sample 1 with column sample 1 or RS1-
I-CS1. The columns
or features can be selected randomly. The decision tree 2 and subsequent
decision trees in the
random forest are trained in a similar manner by using a subset of the
training data. Note that the
training data for decision trees can be generated with replacement i.e., same
row data can be used in
training of multiple decision trees.
101881 The second part of bagging technique is the aggregation
part which is applied during
production. Each decision tree outputs a classification whether the proximity
event occurred or not.
In case of binary classification, it can be 1 (indicating the proximity event
occurred) or 0 (indicating
the proximity event did not occur). The output of the random forest is the
aggregation of outputs of
decision trees in the random forest with a majority vote selected as the
output of the random forest.
By using votes from multiple decision trees, a random forest reduces high
variance in results of
decision trees, thus resulting in good prediction results. By using row and
column sampling to train
individual decision trees, each decision tree becomes an expert with respect
to training records with
selected features.
101891 During training, the output of the random forest is
compared with ground truth labels
and a prediction error is calculated. During backward propagation, the weights
are adjusted so that
the prediction error is reduced. The trained random forest algorithm 1821 is
used to classify features
from production images. The trained random forest can predict whether the
proximity event
occurred or not. The random forest can also predict an expected time of the
proximity event with
respect to the initial frame in the sequence of image frames.
101901 The technology disclosed can generate separate event
streams in parallel for the same
inventory events. For example, as shown in Fig. I OA, the first image
processors generate an event
stream A of location-based put and take events. As described above, the first
image processors can
also detect touch events. As touch events do not result in a put or take, the
system does not update
log data structures of sources and sinks when it detects a touch event. The
event stream A can
include location-based put and take events and can include the item identifier
associated with the
event. The location-based events in the event stream A can also include the
subject identifier of the
source subject or the sink subject, time and location of the event in the area
of real space. In one
CA 03177772 2022- 11-3
WO 2021/226392
PCT/US2021/031173
embodiment, the location-based event can also include shelf identifier of the
source shelf or the sink
shelf.
101911 The second image processors produce a second event stream
B including put and take
events based on hand-image processing of WhatCNN and time series analysis of
output WhatCNN
by WhenCNN. The region proposals-based put and take events in the event stream
B can include
item identifiers, the subjects or shelves associated with the event, time and
location of the event in
the real space. The events in the both event stream A and event stream B can
include confidence
scores identifying the confidence of the classifier.
101921 The technology disclosed includes event fusion logic 1018
to combine events from
event stream A and event stream B to increase the robustness of event
predictions in the area of real
space. In one embodiment, the event fusion logic determines for each event in
event stream A, if
there is a matching event in event stream B. The events are matched, if both
events are of the same
event type (put, take), if the event in event stream B has not been already
matched to an event in
event stream B, and if the event in event stream B is identified in a frame
within a threshold of
number of frames preceding or following the image frame in which the proximity
event is detected.
As described above, the cameras 114 can be synchronized in time with each
other, so that images
are captured at the same time, or close in time, and at the same image capture
rate. Images captured
in all the cameras covering an area of real space at the same time, or close
in time, are synchronized
in the sense that the synchronized images can be identified in the processing
engines as representing
different views at a moment in time of subjects having fixed positions in the
real space Therefore, if
an event is detected in a frame x in event stream A, the matching logic
considers events in frame x
N, where the value of N can be set as 1, 3, 5 or more. If a matching event is
found in event stream B,
the technology disclosed uses a weighted combination of event predictions to
generate an item put
or take prediction. For example, in one embodiment, the technology disclosed
can assign 50 percent
weight to events of stream A and 50 percent weight to matching events from
stream B and use the
resulting output to update the log data structures 1020 of source and sinks.
In another embodiment,
the technology disclosed can assign more weightage to events from one of the
streams when
combining the events to predict put and lake of items.
[01931 If the event fusion logic cannot find a matching event in
event stream B to an event in
event stream A, the technology disclosed can wait for a threshold number of
frames to pass. For
CA 03177772 2022- 11-3
WO 2021/226392
PCT/US2021/031173
56
example, if the threshold is set as 5 frames, the system can wait until five
frames following the
frame in which the proximity event is detected, are processed by the second
image processors. If a
matching event is not found after threshold number of frames, the system can
use item put or take
prediction from the location-based event to update the log data structure of
the source and the sink.
The technology disclosed can apply the same matching logic for events in the
event stream B. Thus,
for an event in the events stream B, if there is no matching event in the
event stream A, the system
can use the item put or take detection from region proposals-based prediction
to update the log data
structures 1020 of source and sink subject. Therefore, the technology
disclosed can produce robust
event detections even when one of the first or the second image processors
cannot predict a put or a
take event or when one technique predicts a put or a take event with low
confidence.
Location-based Events and Semantic Diffing-based Events
[01941 We now present a third image processors 1022 (also
referred to as the third image
processing pipeline) and the logic to combine the item put and take
predictions from this technique
to item put and take predictions from the first image processors 1004. Note
that item put and take
predictions from third image processors can be combined with item put and take
predictions from
second image processors 1006 in a similar manner. Fig. 10B is a high-level
architecture of pipelines
of neural networks processing image frames received from cameras 114 to
generate shopping cart
data structures for subjects in the real space. The system described here
includes per camera image
recognition engines as described above for identifying and tracking multi-
joint subjects.
[01951 The processing pipelines run in parallel per camera,
moving images from respective
cameras to image recognition engines 112a-112n via circular buffers 1002 per
camera. We have
described the details of first image processors 1004 with reference to Fig.
10A. The output from first
image processors is an events stream A. The technology disclosed includes
event fusion logic 1018
to combine the events in the events stream A to matching events in an events
stream C which is
output from the third image processors.
[01961 A "semantic diffing" subsystem (also referred to as third
image processors 1022)
includes background image recognition engines, receiving corresponding
sequences of images from
the plurality of cameras and recognize semantically significant differences in
the background (i.e.
inventory display structures like shelves) as they relate to puts and takes of
inventory items for
CA 03177772 2022- 11-3
WO 2021/226392
PCT/US2021/031173
57
example, over time in the images from each camera. The third image processors
receive joint data
structures 460 from joints CNNs 112a-112n and image frames from cameras 114 as
input. The third
image processors mask the identified subjects in the foreground to generate
masked images. The
masked images are generated by replacing bounding boxes that correspond with
foreground subjects
with background image data. Following this, the background image recognition
engines process the
masked images to identify and classify background changes represented in the
images in the
corresponding sequences of images. In one embodiment, the background image
recognition engines
comprise convolutional neural networks.
[0197] The third image processors process identified background
changes to predict takes of
inventory items by identified subjects and of puts of inventory items on
inventory display structures
by identified subjects. The set of detections of puts and takes from semantic
diffing system are also
referred to as background detections of puts and takes of inventory items. In
the example of a
shopping store, these detections can identify inventory items taken from the
shelves or put on the
shelves by customers or employees of the store. The semantic diffing subsystem
includes the logic
to associate identified background changes with identified subjects. We now
present the details of
components of the semantic diffing subsystem. or third image processors 1022
as shown inside the
broken line on the right side of Fig. 10B.
[0198] The system comprises of the plurality of cameras 114
producing respective sequences
of images of corresponding fields of view in the real space. The field of view
of each camera
overlaps with the field of view of at least one other camera in the plurality
of cameras as described
above. In one embodiment, the sequences of image frames corresponding to the
images produced by
the plurality of cameras 114 are stored in a circular buffer 1002 (also
referred to as a ring buffer) per
camera 114. Each image frame has a tinriestamp, identity of the camera
(abbreviated as
"camera_id"), and a frame identity (abbreviated as "frame_id") along with the
image data. Circular
buffers 1002 store a set of consecutively timestamped image frames from
respective cameras 114. In
one embodiment, the cameras 114 are configured to generate synchronized
sequences of images.
[0199] The first image processors 1004, include joints CNN 112a-
112n, receiving
corresponding sequences of images from the plurality of cameras .114 (with or
without image
resolution reduction). The technology includes subject tracking engine to
process images to identify
subjects represented in the images in the corresponding sequences of images.
In one embodiment,
CA 03177772 2022- 11-3
WO 2021/226392
PCT/US2021/031173
58
the subject tracking engines can include convolutional neural networks (CNNs)
referred to as joints
CNN 112a112n. The outputs of joints CNNs 112a-112n corresponding to cameras
with
overlapping fields of view are combined to map the location of joints from 2D
image coordinates of
each camera to 3D coordinates of real space. The joints data structures 460
per subject (j) where j
equals 1 to x, identify locations of joints of a subject (j) in the real space
and in 2D space for each
image. Some details of subject data structure 600 are presented in Fig. 6.
10200] A background image store 1028, in the semantic diffing
subsystem or third image
processors 1022, stores masked images (also referred to as background images
in which foreground
subjects have been removed by masking) for corresponding sequences of images
from cameras 114.
The background image store 1028 is also referred to as a background buffer. In
one embodiment, the
size of the masked images is the same as the size of image frames in the
circular buffer 1002. In one
embodiment, a masked image is stored in the background image store 1028
corresponding to each
image frame in the sequences of image frames per camera.
[0201] The semantic diffing subsystem 2604 (or the second image
processors) includes a
mask generator 1024 producing masks of foreground subjects represented in the
images in the
corresponding sequences of images from a camera. In one embodiment, one mask
generator
processes sequences of images per camera. In the example of the shopping
store, the foreground
subjects are customers or employees of the store in front of the background
shelves containing items
for sale.
[0202] In one embodiment, the joint data structures 460 per
subject and image frames from
the circular buffer 1002 are given as input to the mask generator 1024. The
joint data structures
identify locations of foreground subjects in each image frame. The mask
generator 1024 generates a
bounding box per foreground subject identified in the image frame. In such an
embodiment, the
mask generator 1024 uses the values of the x and y coordinates of joint
locations in 2D image frame
to determine the four boundaries of the bounding box. A minimum value of x
(from all x values of
joints for a subject) defines the left vertical boundary of the bounding box
for the subject. A
minimum value of y (from all y values of joints for a subject) defines the
bottom horizontal
boundary of the bounding box. Likewise, the maximum values of x and y
coordinates identify the
right vertical and top horizontal boundaries of the bounding box. In a second
embodiment, the mask
generator 1024 produces bounding boxes for foreground subjects using a
convolutional neural
CA 03177772 2022- 11-3
WO 2021/226392
PCT/US2021/031173
59
network-based person detection and localization algorithm. In such an
embodiment, the mask
generator 1024 does not use the joint data structures 460 to generate bounding
boxes for foreground
subjects.
102031 The semantic diffing subsystem (or the third image
processors 1022) include a mask
logic to process images in the sequences of images to replace foreground image
data representing
the identified subjects with background image data from the background images
for the
corresponding sequences of images to provide the masked images, resulting in a
new background
image for processing. As the circular buffer receives image frames from
cameras 114, the mask
logic processes images in the sequences of images to replace foreground image
data defined by the
image masks with background image data. The background image data is taken
from the
background images for the corresponding sequences of images to generate the
corresponding
masked images.
[02041 Consider, the example of the shopping store. Initially at
time s =0, when there are no
customers in the store, a background image in the background image store 1028
is the same as its
corresponding image frame in the sequences of images per camera. Now consider
at time t = 1, a
customer moves in front of a shelf to buy an item in the shelf. The mask
generator 1024 creates a
bounding box of the customer and sends it to a mask logic component 1026. The
mask logic
component 1026 replaces the pixels in the image frame at t = 1 inside the
bounding box by
corresponding pixels in the background image frame at I = 0. This results in a
masked image at t = 1
corresponding to the image frame at / = 1 in the circular buffer 1002. The
masked image does not
include pixels for foreground subject (or customer) which are now replaced by
pixels from the
background image frame at t ¨ 0. The masked image at t = 1 is stored in the
background image store
1028 and acts as a background image for the next image frame at 2 in the
sequence of images
from the corresponding camera.
[02051 In one embodiment, the mask logic component 1026
combines, such as by averaging
or summing by pixel, sets of N masked images in the sequences of images to
generate sequences of
factored images for each camera. In such an embodiment, the second image
processors identify and
classify background changes by processing the sequence of factored images. A
factored image can
be generated, for example, by taking an average value for pixels in the N
masked images in the
sequence of masked images per camera. In one embodiment, the value of N is
equal to the frame
CA 03177772 2022- 11-3
WO 2021/226392
PCT/US2021/031173
rate of cameras 114, for example if the frame rate is 30 FPS (frames per
second), the value of N is
30. In such an embodiment, the masked images for a time period of one second
are combined to
generate a factored image. Taking the average pixel values minimizes the pixel
fluctuations due to
sensor noise and luminosity changes in the area of real space.
[02061 The third image processors identify and classify
background changes by processing
the sequence of factored images. A factored image in the sequences of factored
images is compared
with the preceding factored image for the same camera by a bit mask calculator
1032. Pairs of
factored images 1030 are given as input to the bit mask calculator 1032 to
generate a bit mask
identifying changes in corresponding pixels of the two factored images. The
bit mask has Is at the
pixel locations where the difference between the corresponding pixels'
(current and previous
factored image) RGB (red, green and blue channels) values is greater than a
"difference threshold".
The value of the difference threshold is adjustable. In one embodiment, the
value of the difference
threshold is set at 0.1.
[02071 The bit mask and the pair of factored images (current and
previous) fromn. sequences
of factored images per camera are given as input to background image
recognition engines. In one
embodiment, the background image recognition engines comprise convolutional
neural networks
and are referred to as ChangeC.NN 1034a-1034n. A single ChangeCNN processes
sequences of
factored images per camera. In another embodiment, the masked images from
corresponding
sequences of images are not combined. The bit mask is calculated from. the
pairs of masked images.
In this embodiment, the pairs of masked images and the bit mask is then given
as input to the
ChangeCNN.
[0208] The input to a ChangeCNN model in this example consists
of seven (7) channels
including three image channels (red, green and blue) per factored image and
one channel for the bit
mask. The ChangeCNN comprises of multiple convolutional layers and one or more
fully connected
(FC) layers. In one embodiment, the ChangeCNN comprises of the same number of
convolutional
and FC layers as the Joints CNN 112a-112n as illustrated in Fig. 4A.
[0209] The background image recognition engines (ChangeCNN 1034a-
1034n) identify and
classify changes in the factored images and produce change data structures for
the corresponding
sequences of images. The change data structures include coordinates in the
masked images of
identified background changes, identifiers of an inventory item subject of the
identified background
CA 03177772 2022- 11-3
WO 2021/226392
PCT/US2021/031173
61
changes and classifications of the identified background changes. The
classifications of the
identified background changes in the change data structures classify whether
the identified inventory
item has been added or removed relative to the background image.
102101 As multiple items can be taken or put on the shelf
simultaneously by one or more
subjects, the ChangeCNN generates a number "B" overlapping bounding box
predictions per output
location. A bounding box prediction corresponds to a change in the factored
image. Consider the
shopping store has a number "C" unique inventory items, each identified by a
unique SKU. The
ChangeCNN predicts the SKU of the inventory item subject of the change.
Finally, the ChangeCNN
identifies the change (or inventory event type) for every location (pixel) in
the output indicating
whether the item identified is taken from the shelf or put on the shelf. The
above three parts of the
output from ChangeCNN are described by an expression "5 * B + C + 1". Each
bounding box "B"
prediction comprises of five (5) numbers, therefore "B" is multiplied by 5.
These five numbers
represent the "x" and "y" coordinates of the center of the bounding box, the
width and height of the
bounding box. The fifth number represents ChangeCNN model's confidence score
for prediction of
the bounding box. "B" is a hyperparameter that can be adjusted to improve the
performance of the
ChangeCNN model. In one embodiment, the value of "B" equals 4. Consider the
width and height
(in pixels) of the output from ChangeCNN is represented by W and H,
respectively. The output of
the ChangeCNN is then expressed as "W * H * (5 * B + C + 1)". The bounding box
output model is
based on object detection system proposed by Redmon and Farhadi in their
paper, "YOL09000:
Better, Faster, Stronger" published on December 25, 2016. The paper is
available at
https://arxiv.orWpdf/1612.08242.pdf.
[02111 The outputs of ChangeCNN 1034a-1034n corresponding to
sequences of images
from cameras with overlapping fields of view are combined by a coordination
logic component
1036. The coordination logic component processes change data structures from
sets of cameras
having overlapping fields of view to locate the identified background changes
in real space. The
coordination logic component 1036 selects bounding boxes representing the
inventory items having
the same SKU and the same inventory event type (take or put) from multiple
cameras with
overlapping fields of view. The selected bounding boxes are then triangulated
in the 3D real space
using triangulation techniques described above to identify the location of the
inventory item in 3D
real space. Locations of shelves in the real space are compared with the
triangulated locations of the
CA 03177772 2022- 11-3
WO 2021/226392
PCT/US2021/031173
62
inventory items in the 3D real space. False positive predictions are
discarded. For example, if
triangulated location of a bounding box does not map to a location of a shelf
in the real space, the
output is discarded. Triangulated locations of bounding boxes in the 3D real
space that map to a
shelf are considered true predictions of inventory events.
102121 In one embodiment, the classifications of identified
background changes in the
change data structures produced by the second image processors classify
whether the identified
inventory item has been added or removed relative to the background image. In
another
embodiment, the classifications of identified background changes in the change
data structures
indicate whether the identified inventory item has been added or removed
relative to the background
image and the system includes logic to associate background changes with
identified subjects. The
system makes detections of takes of inventory items by the identified subjects
and of puts of
inventory items on inventory display structures by the identified subjects.
[0213) A log generator component can implement the logic to
associate changes identified
by true predictions of changes with identified subjects near the location of
the change. In an
embodiment utilizing the joints identification engine to identify subjects,
the log generator can
determine the positions of hand joints of subjects in the 3D real space using
joint data structures
460. A subject whose hand joint location is within a threshold distance to the
location of a change at
the time of the change is identified. The log generator associates the change
with the identified
subject.
[0214] In one embodiment, as described above, N masked images
are combined to generate
factored images which are then given as input to the ChangeCNN. Consider, N
equals the frame rate
(frames per second) of the cameras 114. Thus, in such an embodiment, the
positions of hands of
subjects during a one second time period are compared with the location of the
change to associate
the changes with identified subjects. If more than one subject's hand joint
locations are within the
threshold distance to a location of a change, then association of the change
with a subject is deferred
to output of first image processors or second image processors.
[0215] The technology disclosed can combine the events in an
events stream C from
semantic diffing model with events in the events stream A from location-based
event detection
model. The location-based put and take events are matched to put and take
events from semantic
diffing model by the event fusion logic component 1018. As described above,
the semantic diffing
CA 03177772 2022- 11-3
WO 2021/226392
PCT/US2021/031173
63
events (or diff events) classify items put or taken from shelves based on
background image
processing. In one embodiment, the diff events can be combined with existing
shelf maps from the
maps of shelves including item information or planograms to determine likely
items associated with
pixel changes represented by diff events. The cliff events may not be
associated with a subject at the
time of detection of the event and may not result in update of log data
structure of any source subject
or sink subject. The technology disclosed includes logic to match the diff
events that may have been
associated with a subject or not associated with a subject with a location-
based put and take event
from events stream A and a region proposals-based put and take event from
events stream B.
[0216j Semantic diffing events are localized to an area in the
2D image plane in image
frames from cameras 114 and have a start time and end time associated with
them. The event fusion
logic matches the semantic diffing events from event stream C to events in
events stream A and
events stream B by in between the start and end time of the semantic diffing
event. The location-
based put and take events and region proposals-based put and take events have
3D positions
associated with them based on the hand joint positions in the area of real
space. The technology
disclosed includes logic to project the 3D positions of the location-based put
and take events and
region proposal-based put and take events to 2D image planes and compute
overlap with the
semantic diffing-based events in the 2D image planes. The following three
scenarios can result
based on how many predicted events from events streams A. and B overlap with a
semantic duffing
event (also referred to as a diff event).
[0217] (1) If no event from events stream A and B overlap with a
diff event in the time range
of the diff event then in this case, the technology disclosed can associate
the diff event with the
closest person to the shelf in the time range of the cliff event.
102181 (2) If one event from events stream A or events stream B
overlaps with the diff event
in the time range of the diff event then in this case, the system combines the
matched event to the
diff event by taking a weighted combination of the item predictions from the
event stream (A or B)
which predicted the event and the item prediction from diff event.
[0219] (3) If two or more events from events streams A or B
overlap with the diff event in
the time range of the diff event, the system selects one of the matched events
from events streams A
or B. The event that has the closest item classification probability value to
the item classification
probability value in the diff event can be selected. The system can then take
a weighted average of
CA 03177772 2022- 11-3
WO 2021/226392
PCT/US2021/031173
64
the item classification from the diff event and the item classification from
the selected event from
events stream A or events stream B.
102201 Fig. 10C shows coordination logic module 1052 combining
results of multiple
WhatCNN models and giving it as input to a single WhenCNN model. As mentioned
above, two or
more cameras with overlapping fields of view capture images of subjects in
real space. joints of a
single subject can appear in image frames of multiple cameras in respective
image channel 1050. A
separate WhatCNN model identifies SKUs of inventory items in hands
(represented by hand joints)
of subjects. The coordination logic module 1052 combines the outputs of
WhatCNN models into a
single consolidated input for the WhenCNN model. The WhenCNN model operates on
the
consolidated input to generate the shopping cart of the subject.
[02211 An example inventory data structure 1020 (also referred
to as a log data structure) is
shown in Fig. 10D. This inventory data structure stores the inventory of a
subject, shelf or a store as
a key-value dictionary. The key is the unique identifier of a subject, shelf
or a store and the value is
another key value-value dictionary where key is the item identifier such as a
stock keeping unit
(SKU) and the value is a number identifying the quantity of item along with
the "frame id" of the
image frame that resulted in the inventory event prediction. The frame
identifier ("frame_id") can be
used to identify the image frame which resulted in identification of an
inventory event resulting in
association of the inventory item with the subject, shelf, or the store. In
other embodiments, a
"camera_id" identifying the source camera can also be stored in combination
with the frame_id in
the inventory data structure 1020. In one embodiment, the "frame_id" is the
subject identifier
because the frame has the subject's hand in the bounding box. In other
embodiments, other types of
identifiers can be used to identify subjects such as a "subject_id" which
explicitly identifies a
subject in the area of real space.
[0222] When a put event is detected, the item identified by the
SKU in the inventory event
(such as location-based event, region proposals-based event, or semantic
diffing event) is removed
from the log data structure of the source subject. Similarly, when a take
event is detected, the item
identified by the SKU in the inventory event is added to the log data
structure of the sink subject. In
an item hand-off or exchange between subjects, the log data structures of both
subjects in the hand-
off are updated to reflect the item exchange from source subject to sink
subject. Similar logic can be
CA 03177772 2022- 11-3
WO 2021/226392
PCT/US2021/031173
applied when subjects take items from shelves or put items on the shelves. Log
data structures of
shelves can also be updated to reflect the put and take of items.
102231 The shelf inventory data structure can be consolidated
with the subject's log data
structure, resulting in reduction of shelf inventory to reflect the quantity
of item taken by the
customer from the shelf. If the item was put on the shelf by a shopper or an
employee stocking items
on the shelf, the items get added to the respective inventory locations'
inventory data structures.
Over a period of time, this processing results in updates to the shelf
inventory data structures for all
inventory locations in the shopping store. Inventory data structures of
inventory locations in the area
of real space are consolidated to update the inventory data structure of the
area of real space
indicating the total number of items of each SKU in the store at that moment
in time. In one
embodiment, such updates are performed after each inventory event. In another
embodiment, the
store inventory data structures are updated periodically.
[0224) In the following process flowcharts (Figs. 12 to 17), we
present process steps for
subject identification using Joints CNN, hand recognition using WhatCN'N, time
series analysis
using WhenCNN, detection of proximity events and proximity event types (put,
take, touch),
detection of item in a proximity event, and fusion of multiple inventory
events streams.
Joints CNN ¨ Identification and Update of Subjects
[0225] Fig. 12 is a flowchart of processing steps performed by
Joints CNN 112a-112n to
identify subjects in the real space. In the example of a shopping store, the
subjects are shoppers or
customers moving in the store in aisles between shelves and other open spaces.
The process starts at
step 1202. Note that, as described above, the cameras are calibrated before
sequences of images
from cameras are processed to identify subjects. Details of camera calibration
are presented above.
Cameras 114 with overlapping fields of view capture images of real space in
which subjects are
present (step 1204). In one embodiment, the cameras are configured to generate
synchronized
sequences of images. The sequences of images of each camera are stored in
respective circular
buffers 1002 per camera. A circular buffer (also referred to as a ring buffer)
stores the sequences of
images in a sliding window of time. In an embodiment, a circular buffer stores
110 image frames
from a corresponding camera In another embodiment, each circular buffer 1002
stores image
CA 03177772 2022- 11-3
WO 2021/226392
PCT/US2021/031173
66
frames for a time period of 3.5 seconds. It is understood, in other
embodiments, the number of
image frames (or the time period) can be greater than or less than the example
values listed above.
[02261 Joints CNNs 112a-112n, receive sequences of image frames
from corresponding
cameras 114 as output from a circular buffer, with or without resolution
reduction (step 1206). Each
Joints CNN processes batches of images from a corresponding camera through
multiple convolution
network layers to identify joints of subjects in image frames from
corresponding camera. The
architecture and processing of images by an example convolutional neural
network is presented Fig.
4A. As cameras 114 have overlapping fields of view, the joints of a subject
are identified by more
than one joints-CNN. The two-dimensional (2D) coordinates of joints data
structures 460 produced
by Joints CNN are mapped to three dimensional (3D) coordinates of the real
space to identify joints
locations in the real space. Details of this mapping are presented above in
which the subject tracking
engine 110 translates the coordinates of the elements in the arrays of joints
data structures
corresponding to images in different sequences of images into candidate joints
having coordinates in
the real space.
[0227] The joints of a subject are organized in two categories
(foot joints and non-foot
joints) for grouping the joints into constellations, as discussed above. The
left and right-ankle joint
type in the current example, are considered foot joints for the purpose of
this procedure. At step
1208, heuristics are applied to assign a candidate left foot joint and a
candidate right foot joint to a
set of candidate joints to create a subject. Following this, at step 1210, it
is determined whether the
newly identified subject already exists in the real space. If not, then a new
subject is created at step
1214, otherwise, the existing subject is updated at step 1212.
[0228] Other joints from the galaxy of candidate joints can be
linked to the subject to build a
constellation of some or all of the joint types for the created subject. At
step 1216, heuristics are
applied to non-foot joints to assign those to the identified subjects. A
global metric calculator can
calculate the global metric value and attempts to minimize the value by
checking different
combinations of non-foot joints. In one embodiment, the global metric is a sum
of heuristics
organized in four categories as described above.
[0229] The logic to identify sets of candidate joints comprises
heuristic functions based on
physical relationships among joints of subjects in real space to identify sets
of candidate joints as
subjects. At step 1218, the existing subjects are updated using the
corresponding non-foot joints. If
CA 03177772 2022- 11-3
WO 2021/226392
PCT/US2021/031173
67
there are more images for processing (step 1220), steps 1206 to 1218 are
repeated, otherwise the
process ends at step 1222. A first data sets are produced at the end of the
process described above.
The first data sets identify subject and the locations of the identified
subjects in the real space. In
one embodiment, the first data sets are presented above in relation to Figs.
10A and 1013 as joints
data structures 460 per subject.
WhatCNN ¨ Classification of Hand Joints
102301 Fig. 13 is a flowchart illustrating process steps to
identify inventory items in hands of
subjects (shoppers) identified in the real space. As the subjects move in
aisles and opens spaces,
they pick up inventory items stocked in the shelves and put items in their
shopping cart or basket.
The image recognition engines identify subjects in the sets of images in the
sequences of images
received from the plurality of cameras. The system includes the logic to
process sets of images in
the sequences of images that include the identified subjects to detect takes
of inventory items by
identified subjects and puts of inventory- items on the shelves by identified
subjects.
[02311 In one embodiment, the logic to process sets of images
includes, for the identified
subjects, generating classifications of the images of the identified subjects.
The classifications can
include, predicting whether the identified subject is holding an inventory
item. The classifications
can include a first nearness classification indicating a location of a hand of
the identified subject
relative to a shelf. The classifications can include, a second nearness
classification indicating a
location a hand of the identified subject relative to a body of the identified
subject. The
classifications can further include, a third nearness classification
indicating a location of a hand of
an identified subject relative to a basket associated with the identified
subject. The classification can
include a fourth nearness classification of the hand that identifies location
of a hand of a subject
positioned close to the hand of another subject. Finally, the classifications
can include an identifier
of a likely inventory item.
[02321 In another embodiment, the logic to process sets of
images includes, for the identified
subjects, identifying bounding boxes of data representing hands in images in
the sets of images or
the identified subjects. The data in the bounding boxes is processed to
generate classifications of
data within the bounding boxes for the identified subjects. In such an
embodiment, the
classifications can include predicting whether the identified subject is
holding an inventory item.
CA 03177772 2022- 11-3
WO 2021/226392
PCT/US2021/031173
68
The classifications can include, a first nearness classification indicating a
location of a hand of the
identified subject relative to a shelf. The classifications can include, a
second nearness classification
indicating a location of a hand of the identified subject relative to a body
of the identified subject.
The classifications can include, a third nearness classification indicating a
location of a hand of the
identified subject relative to a basket associated with an identified subject.
The classification can
include a fourth nearness classification of the hand that identifies location
of a hand of a subject
positioned close to the hand of another subject. Finally, the classifications
can include an identifier
of a likely inventory item.
10233] The process starts at step 1302. At step 1304, locations
of hands (represented by hand
joints) of subjects in image frames are identified. The bounding box generator
1304 identifies hand
locations of subjects per frame from each camera using joint locations
identified in the first data sets
generated by Joints CNNs 112a-112n. Following this, at step 1306, the bounding
box generator
1008 processes the first data sets to specify bounding boxes which include
images of hands of
identified multi-joint subjects in images in the sequences of images. Details
of bounding box
generator are presented above with reference to Fig. 10A.
[0234] A second image recognition engine receives sequences of
images from the plurality
of cameras and processes the specified bounding boxes in the images to
generate a classification of
hands of the identified subjects (step 1308). In one embodiment, each of the
image recognition
engines used to classify the subjects based on images of hands comprises a
trained convolutional
neural network referred to as a WhatCNN 1010. WhatCNNs are arranged in multi-
CNN pipelines as
described above in relation to Fig. 10A. In one embodiment, the input to a
WhatCNN is a multi-
dimensional array BxWxHxC (also referred to as a BxWxHxC tensor). "13" is the
batch size
indicating the number of image frames in a batch of images processed by the
WhatCNN. "W" and
"H" indicate the width and height of the bounding boxes in pixels, "C" is the
number of channels. In
one embodiment, there are 30 images in a batch (B=30), so the size of the
bounding boxes is 32
pixels (width) by 32 pixels (height). There can be six channels representing
red, green, blue,
foreground mask, forearm mask and upperarin mask, respectively. The foreground
mask, forearm
mask and upperarm mask are additional and optional input data sources for the
WhatCNN in this
example, which the CNN can include in the processing to classify information
in the RGB image
data. The foreground mask can be generated using mixture of Gaussian
algorithms, for example.
CA 03177772 2022- 11-3
WO 2021/226392
PCT/US2021/031173
69
The forearm mask can be a line between the wrist and elbow providing context
produced using
information in the Joints data structure. Likewise, the upperarm mask can be a
line between the
elbow and shoulder produced using information in the Joints data structure.
Different values of B,
W, H and C parameters can be used in other embodiments. For example, in
another embodiment, the
size of the bounding boxes is larger e.g., 64 pixels (width) by 64 pixels
(height) or 128 pixels
(width) by 128 pixels (height).
10235j Each WhatCNN 1010 processes batches of images to generate
classifications of
hands of the identified subjects. The classifications can include whether the
identified subject is
holding an inventory item. The classifications can further include one or more
classifications
indicating locations of the hands relative to the shelf and relative to the
subject, relative to a shelf or
a basket, and relative to a hand or another subject, usable to detect puts and
takes. In this example, a
first nearness classification indicates a location of a hand of the identified
subject relative to a shelf.
The classifications can include a second nearness classification indicating a
location a hand of the
identified subject relative to a body of the identified subject. A subject may
hold an inventory item
during shopping close to his or her body instead of placing the item in a
shopping cart or a basket.
The classifications can further include a third nearness classification
indicating a location of a hand
of the identified subject relative to a basket associated with an identified
subject. A "basket" in this
context can be a bag, a basket, a cart or other object used by the subject to
hold the inventory items
during shopping. The classification can include a fourth nearness
classification of the hand that
identifies location of a hand of a subject positioned close to the hand of
another subject. Finally, the
classifications can include an identifier of a likely inventory item. The
final layer of the WhatCNN
1010 produces logits which are raw values of predictions. The logits are
represented as floating
point values and further processed, as described below, for generating a
classification result. In one
embodiment, the outputs of the WhatCNN model, include a multi-dimensional
array BxL (also
referred to as a BxL tensor). "B" is the batch size, and "L = N4-5" is the
number of logits output per
image frame. "N" is the number of SKUs representing "N" unique inventory items
for sale in the
shopping store.
[0236] The output "L" per image frame is a raw activation from
the WhatCNN 1010. Logits
"L" are processed at step 1310 to identify inventory item and context. The
first "N" logits represent
confidence that the subject is holding one of the "N" inventory items. Logits
"L" include an
CA 03177772 2022- 11-3
WO 2021/226392
PCT/US2021/031173
additional five (5) logits which are explained below. The first logit
represents confidence that the
image of the item in hand of the subject is not one of the store SKIJ items
(also referred to as non-
SKU item). The second logit indicates a confidence whether the subject is
holding an item or not A
large positive value indicates that WhatCNN model has a high level of
confidence that the subject is
holding an item. A large negative value indicates that the model is confident
that the subject is not
holding any item. A close to zero value of the second logit indicates that
WhatCNN model is not
confident in predicting whether the subject is holding an item or not. The
value of the holding logit
is provided as input to the proximity event detector for location-based put
and take detection.
10237] The next three logits represent first, second and third
nearness classifications,
including a first nearness classification indicating a location of a hand of
the identified subject
relative to a shelf, a second nearness classification indicating a location of
a hand of the identified
subject relative to a body of the identified subject, a third nearness
classification indicating a
location of a hand of the identified subject relative to a basket associated
with an identified subject.
Thus, the three logits represent context of the hand location with one logit
each indicating
confidence that the context of the hand is near to a shelf, near to a basket
(or a shopping cart), or
near to a body of the subject. In one embodiment, the output can include a
fourth logit representing
context of the hand of a subject positioned close to hand of another subject.
In one embodiment, the
WhatCNN is trained using a training dataset containing hand images in the
three contexts: near to a
shelf, near to a basket (or a shopping cart), and near to a body of a subject.
In another embodiment,
the WhatCNN is trained using a training dataset containing hand images in the
four contexts: near to
a shelf, near to a basket (or a shopping cart), and near to a body of a
subject, near to hand of another
subject. In another embodiment, a "nearness" parameter is used by the system
to classify the context
of the hand. In such an embodiment, the system determines the distance of a
hand of the identified
subject to the shelf, basket (or a shopping cart), and body of the subject to
classify the context.
[0238] The output of a WhatCNN is "L" logits comprised of N SKI]
logits, 1 Non-SKU
logit, I holding logit, and 3 context logits as described above. The SKU
logits (first N logits) and the
non-SKU logit (the first logit following the N logits) are processed by a
softmax function. As
described above with reference to Fig. 4A, the softmax function transforms a K-
dimensional vector
of arbitrary real values to a K-dimensional vector of real values in the range
[0, 1] that add up to 1.
A softmax function calculates the probabilities distribution of the item over
N 1 items. The output
CA 03177772 2022- 11-3
WO 2021/226392
PCT/US2021/031173
71
values are between 0 and 1, and the sum of all the probabilities equals one.
The softma.x function
(for multi-class classification) returns the probabilities of each class. The
class that has the highest
probability is the predicted class (also referred to as target class). The
value of the predicted item
class is averaged over N frames before and after the proximity event to
determine the item
associated with the proximity event.
[0239] The holding logit is processed by a sigmoid function. The
sigmoid function takes a
real number value as input and produces an output value in the range of 0 to
1. The output of the
sigmoid function identifies whether the hand is empty or holding an item. The
three context logits
are processed by a softmax function to identify the context of the hand joint
location. At step 1312,
it is checked if there are more images to process. If true, steps 1304-1310
are repeated, otherwise the
process ends at step 1314.
WhenCNN ¨ Time Series Analysis to Identify Puts and Takes of Items
[0240] In one embodiment, the technology disclosed performs time
sequence analysis over
the classifications of subjects to detect takes and puts by the identified
subjects based on foreground
image processing of the subjects. The time sequence analysis identifies
gestures of the subjects and
inventory items associated with the gestures represented in the sequences of
images.
[0241] The outputs of WhatCNNs 1010 are given as input to the
WhenCNN 1012 which
processes these inputs to detect puts and takes of items by the identified
subjects. The system
includes logic, responsive to the detected takes and puts, to generate a log
data structure including a
list of inventory items for each identified subject. In the example of a
shopping store, the log data
structure is also referred to as a shopping cart data structure 1020 per
subject.
102421 Fig. 14 presents a process implementing the logic to
generate a shopping cart data
structure per subject. The process starts at step 1402. The input to WhenCNN
1012 is prepared at
step 1404. The input to the WhenCNN is a multi-dimensional array BxCxTxCanris,
where B is the
batch size, C is the number of channels, T is the number of frames considered
for a window of time,
and Cams is the number of cameras 114. In one embodiment, the batch size "B"
is 64 and the value
of"-r- is 110 image frames or the number of image frames in 3.5 seconds of
time. It is understood
that other values of hatch size "B" greater than or less than 64 can be used
Similarly, the value of
CA 03177772 2022- 11-3
WO 2021/226392
PCT/US2021/031173
72
the parameter "T" can be set greater than or less than 110 images frames or a
time period greater
than or less than 3.5 seconds can be used to select the number of frames for
processing.
102431 For each subject identified per image frame, per camera,
a list of 10 logits per hand
joint (20 logits for both hands) is produced. The holding and context logits
are part of the "L" logits
generated by WhatCNN 1010 as described above.
holding, # 1 logit
context, #3 logits
slice_dot(sku, log_sku), # 1 logit
slice_dot(sku, log_other_sku), # 1 logit
slice_dot(sku, roll(log_sku, -30)), # 1 logit
slice_dot(sku, roll(log_sku, 30)), # 1 logit
slice_dot(sku, roll(log_other_sku, -30)), # 1 logit
slice_dot(sku, roll(log_other_sku, 30)) # 1 logit
102441 The above data structure is generated for each hand in an
image frame and also
includes data about the other hand of the same subject. For example, if data
is for the left hand joint
of a subject, corresponding values for the right hand are included as "other"
logits. The fifth logit
(item number 3 in the list above referred to as log_sku) is the log of SKU
logit in "L" logits
described above. The sixth logit is the log of SK.0 logit for other hand. A
"roll" function generates
the same information before and after the current frame. For example, the
seventh logit (referred to
as roll(log_sku, -30)) is the log of the SKU logit, 30 frames earlier than the
current frame. The
eighth logit is the log of the SKU logits for the hand, 30 frames later than
the current frame. The
ninth and tenth data values in the list are similar data for the other hand 30
frames earlier and 30
frames later than the current frame. A similar data structure for the other
hand is also generated,
resulting in a total of 20 logits per subject per image frame per camera.
Therefore, the number of
channels in the input to the WhenCNN is 20 (i.e. C=20 in the multi-dimensional
array
BxexTxCams), whereas "Cams" represents the number of cameras in the area of
real space.
CA 03177772 2022- 11-3
WO 2021/226392
PCT/US2021/031173
73
[0245] For all image frames in the batch of image frames (e.g.,
B 64) from each camera,
similar data structures of 20 hand logits per subject, identified in the image
frame, are generated. A
window of time (T = 3.5 seconds or 110 image frames) is used to search forward
and backward
image frames in the sequence of image frames for the hand joints of subjects.
At step 1406, the 20
hand logits per subject per frame are consolidated from multiple WhatCNNs. In
one embodiment,
the batch of image frames (64) can be imagined as a smaller window of image
frames placed in the
middle of a larger window of image frame 110 with additional image frames for
forward and
backward search on both sides. The input BxCxTxCams to WhenCNN 1012 is
composed of 20
logits for both hands of subjects identified in batch "B" of image frames from
all cameras 114
(referred to as "Cams"). The consolidated input is given to a single trained
convolutional neural
network referred to as WhenCNN model 1508.
[0246] The output of the WhenCNN model comprises of 3 logits,
representing confidence in
three possible actions of an identified subject: taking an inventory item from
a shelf, putting an
inventory item back on the shelf, and no action. The three output logits are
processed by a softrnax
function to predict an action performed. The three classification logits are
generated at regular
intervals for each subject and results are stored per person along with a time
stamp. In one
embodiment, the three logits are generated every twenty frames per subject. In
such an embodiment,
at an interval of every 20 image frames per camera, a window of 110 image
frames is formed around
the current image frame.
[0247] A time series analysis of these three logits per subject
over a period of time is
performed (step 1408) to identify gestures corresponding to tame events and
their time of occurrence.
A non-maximum suppression (NMS) algorithm is used for this purpose. As one
event (i.e. put or
take of an item by a subject) is detected by WhenCNN 1012 multiple times (both
from the same
camera and from multiple cameras), the NMS removes superfluous events for a
subject. NMS is a
rescoring technique comprising two main tasks: "matching loss" that penalizes
superfluous
detections and "joint processing" of neighbors to know if there is a better
detection close-by.
[0248] The true events or takes and puts for each subject are
further processed by calculating
an average of the SKU logits for 30 image frames prior to the image frame with
the true event.
Finally, the arguments of the maxima (abbreviated arg max or argmax) is used
to determine the
largest value. The inventory item classified by the argmax value is used to
identify the inventory
CA 03177772 2022- 11-3
WO 2021/226392
PCT/US2021/031173
74
item put or take from the shelf. The inventory item is added to a log of
SKI.Js (also referred to as
shopping cart or basket) of respective subjects in step 1410. The process
steps 1404 to 1410 are
repeated, if there is more classification data (checked at step 1412). Over a
period of time, this
processing results in updates to the shopping cart or basket of each subject.
The process ends at step
1414.
[0249] We now present process flowcharts for location-based
event detection, item detection
in location-based events and fusion of location-based events stream with
region proposals-based
events stream and semantic diffing-based events stream.
Process Flowchart for Proximity event Detection
[0250) Fig. 15 presents a flowchart of process steps for
detecting location-based events in
the area of real space. The process starts at a step 1502. The system
processes 2D images from a
plurality of sensors to generate 3D positions of subjects in the area of real
space (step 1504). As
described above, the system uses image frames from synchronized sensors with
overlapping fields
of views for 3D scene generation. In one embodiment, the system uses joints to
create and track
subjects in the area of real space. The system calculates distances between
hand joints (both left and
right hands) of subjects at regular time intervals and compares the distances
with a threshold. If the
distance between hand joints of two subjects is below a threshold (step 1510),
the system continues
the process steps for detecting the type of the proximity event (put, take or
touch). Otherwise, the
system repeats steps 1504 to 1510 for detecting proximity events.
[0251] At a step 1512, the system calculates average holding
probability over N frames after
the frame in which the proximity event was detected for the subjects whose
hands were positioned
closer than the threshold. Note that WhatCNN model described above outputs
holding probability
per hand per subject per frame which is used in this process step. The system
calculates difference
between average holding probability over N frames after the proximity event
and the holding
probability in a frame following the frame in which proximity event is
detected. If the result of the
difference is greater than a threshold (step 1514), the system detects a take
event (step 1516) for the
subject in the image frame. Note that when one subject hands-off an item to
another subject, the
location-based event can have a take event (for the subject who takes the
item) and a put event (for
the subject who hands-off the item). The system processes the logic described
in this flowchart for
CA 03177772 2022- 11-3
WO 2021/226392
PCT/US2021/031173
each hand joint in the proximity event thus the system is able to detect both
take and put events for
the subjects in the location-based events. If at step 1514, it is determined
that the difference between
the average holding probability value over N frames after the event and the
holding probability
value in the frame following the proximity event is not greater than the
threshold (step 1514), the
system compares the difference to a negative threshold (step 1518). If the
difference is less than the
negative threshold then the proximity event can be a put event, however, it
can also indicate a touch
event. Therefore, the system calculates the difference between average holding
probability value
over N frames before the proximity event and holding probability value after
the proximity event
(step 1520). If the difference is less than a negative threshold, the system
detects a touch event (step
1526). Otherwise, the system detects a put event (step 1524). The process ends
at a step 1528.
Process Flowchart for Item Detection
[0252) Fig. 16 presents a process flowchart for item detection
in a proximity event. The
process starts at a step 1602. The event type is detected at a step 1604. We
presented detailed
process steps of event type detection in the process flowchart in Fig. 15. If
a take event is detected
(step 1606), the process continues at a step 1610. The system determines
average item class
probability by taking an average of item class probability values from WhatCNN
over N frames
after the frame in which proximity event is detected. If a put event is
detected the process continues
at a step 1612 in the process flowchart. The system determines average item
class probability by
taking an average of item class probability values from WhatCN'N over N frames
before the frame
in which proximity event is detected.
[0253] At a step 1614, the system checks if event streams from
other event detection
techniques have a matching event. We have presented details of two parallel
event detection
techniques above: a region proposals-based event detection technique (also
referred to as second
image processors) and a semantic &fling-based event detection technique (also
referred to as third
image processors). If a matching event is detected from other event detection
techniques, the system
combines the two events using event fusion logic in a step 1616. As described
above, the event
fusion logic can include weighted combination of events from multiple event
streams. If no
matching event is detected from other events streams, then the system can use
the item classification
CA 03177772 2022- 11-3
WO 2021/226392
PCT/US2021/031173
76
from location-based event. The process continues at a step 1618 in which the
subject's log data
structure is updated using the item classification and the event type. The
process ends at a step 1620.
Process Flowchart for Events Stream Fusion
102541 Fig. 17 presents detailed process steps for event fusion
logic step 1616 from Fig. 16.
The system determines a matching event from region proposals-based technique
at a step 1706 and
semantic diffing-based technique at a step 1708. If no matching event is
detected from other event
streams, the system uses the detected event to update the log data structure
of the subject (step
1710). If matching events are detected from region proposals-based technique,
the system calculates
a weighted combination of events from both stream (step 1712) to update the
log data structure of
the subject. If matching event is detected from semantic diffing-based
technique (step 1708), the
system determines if more than one event from semantic diffing-based technique
matches the
location-based event (step 1714). If there are more than one matching events
from semantic diffing-
based technique, then the matching event with closest item class probability
value to the item class
probability value in the location-based event is selected (step 1716). The
system calculates a
weighted combination of events at a step 1718. The output from process step
1616 is used to update
log data structures of subjects as shown in the process flowchart in Fig. 16.
Example Architecture of What-CNN Model
[0255] Fig. 19 presents an example architecture of WhatCNN model
1010. In this example
architecture, there are a total of 26 convolutional layers. The dimensionality
of different layers in
terms of their respective width (in pixels), height (in pixels) and number of
channels is also
presented. The first convolutional layer 1913 receives input 1911 and has a
width of 64 pixels,
height of 64 pixels and has 64 channels (written as 64x64x64). The details of
input to the WhatCNN
are presented above. The direction of arrows indicates flow of data from one
layer to the following
layer. The second convolutional layer 1915 has a dimensionality of 32x32x64.
Followed by the
second layer, there are eight convolutional layers (shown in box 1917) each
with a dimensionality of
32x32x64. Only two layers 1919 and 1921 are shown in the box 1917 for
illustration purposes. This
is followed by another eight convolutional layers 1923 of 16x16x128
dimensions. Two such
convolutional layers 1925 and 1927 are shown in Fig. 19. Finally, the last
eight convolutional layers
CA 03177772 2022- 11-3
WO 2021/226392
PCT/US2021/031173
77
1929, have a dimensionality of 8x8x256 each. Two convolutional layers 1931 and
1933 are shown
in the box 1929 for illustration.
[02561 There is one fully connected layer 1935 with 256 inputs
from the last convolutional
layer 2133 producing N+5 outputs. As described above, "N" is the number of
SKUs representing
"N" unique inventory items for sale in the shopping store. 'Ihe five
additional logits include the first
logit representing confidence that item in the image is a non-SKU item, and
the second logit
representing confidence whether the subject is holding an item. The next three
logits represent first,
second and third nearness classifications, as described above. The final
output of the WhatCNN is
shown at 1937. The example architecture uses batch normalization (BN).
Distribution of each layer
in a convolutional neural network (CNN) changes during training and it varies
from one layer to
another. This reduces convergence speed of the optimization algorithm. Batch
normalization (Ioffe
and Szegedy 2015) is a technique to overcome this problem. ReLU (Rectified
Linear Unit)
activation is used for each layer's non-linearity except for the final output
where softmax is used.
[02571 Figs. 20, 21, and 22 are graphical visualizations of
different parts of an
implementation of WhatCNN 1010. The figures are adapted from graphical
visualizations of a
WhatCNN model generated by TensorBoardTm. TensorBoarem is a suite of
visualization tools for
inspecting and understanding deep learning models e.g., convolutional neural
networks.
[02581 Fig. 20 shows a high-level architecture of the
convolutional neural network model
that detects a single hand ("single hand" model 2010). WhatCNN model 1010
comprises two such
convolutional neural networks for detecting left and right hands,
respectively. In the illustrated
embodiment, the architecture includes four blocks referred to as block0 2016,
blockl 2018, block2
2020, and block3 2022. A block is a higher-level abstraction and comprises
multiple nodes
representing convolutional layers. The blocks are arranged in a sequence from
lower to higher such
that output from one block is input to a successive block. The architecture
also includes a pooling
layer 2014 and a convolution layer 2012. In between the blocks, different non-
linearities can be
used. In the illustrated embodiment, a ReLU non-linearity is used as described
above.
[02591 In the illustrated embodiment, the input to the single
hand model 2010 is a
BxWx1-1xC tensor defined above in description of WhatCNN 1506. "B" is the
batch size, "W" and
"H" indicate the width and height of the input image, and "C" is the number of
channels. The output
CA 03177772 2022- 11-3
WO 2021/226392
PCT/US2021/031173
78
of the single hand model 2010 is combined with a second single hand model and
passed to a fully
connected network.
102601 During training, the output of the single hand model 2010
is compared with ground
truth. A prediction error calculated between the output and the ground truth
is used to update the
weights of convolutional layers. In the illustrated embodiment, stochastic
gradient descent (SGD) is
used for training WhatCNN 1010.
102611 Fig. 21 presents further details of the block 2016 of
the single hand convolutional
neural network model of Fig. 20. It comprises four convolutional layers
labeled as cony in box
2110, convl 2118, conv2 2120, and conv3 2122. Further details of the
convolutional layer cony are
presented in the box 2110. The input is processed by a convolutional layer
2112. The output of the
convolutional layer is processed by a batch normalization layer 2114. ReLU non-
linearity 2116 is
applied to the output of the batch normalization layer 2114. The output of the
convolutional layer
conv0 is passed to the next layer cony]. 2118. The output of the final
convolutional layer conv3 is
processed through an addition operation 2124. This operation sums the output
from the layer conv3
2322 to unmodified input coming through a skip connection 2126. It has been
shown by He et al. in
their paper titled, "Identity mappings in deep residual networks" (published
at
https://arxiv.org/pdf/1603.05027.pdf on July 25, 2016) that forward and
backward signals can be
directly propagated from one block to any other block. The signal propagates
unchanged through the
convolutional neural network. This technique improves training and test
performance of deep
convolutional neural networks.
[02621 As described with reference to Fig. 19, the output of
convolutional layers of a
WhatCNN is processed by a fully connected layer. The outputs of two single
hand models 2010 are
combined and passed as input to a fully connected layer. Fig. 22 is an example
implementation of a
fully connected layer (FC) 2210. The input to the FC layer is processed by a
reshape operator 2212.
The reshape operator changes the shape of the tensor before passing it to a
next layer 2220.
Reshaping includes flattening the output from the convolutional layers i.e.,
reshaping the output
from a multi-dimensional matrix to a one-dimensional matrix or a vector. The
output of the reshape
operator 2212 is passed to a matrix multiplication operator labelled as MatMul
2222.The output
from the MatMul operator 2222 is passed to a matrix plus addition operator
labelled as xw..plus...1)
2224. For each input "x", the operator 2224 multiplies the input by a matrix
"w" and a vector "b" to
CA 03177772 2022- 11-3
WO 2021/226392
PCT/US2021/031173
79
produce the output. "w" is a trainable parameter associated with the input "x"
and "b" is another
trainable parameter which is called bias or intercept. The output 2226 from
the fully connecter layer
2210 is a BxL tensor as explained above in the description of WhatCNN 1010.
"B" is the batch size,
and "L = N+5" is the number of logits output per image frame. "N" is the
number of SKUs
representing "N" unique inventory items for sale in the shopping store.
Training of WhatCNN Model
102631 A training data set of images of hands holding different
inventory items in different
contexts, as well as empty hands in different contexts is created. To achieve
this, human actors hold
each unique SKU inventory item in multiple different ways, at different
locations of a test
environment. The context of their hands ranges from being close to the actor's
body, being close to
the store's shelf, and being close to the actor's shopping cart or basket The
actor performs the above
actions with an empty hand as well. This procedure is completed for both left
and right hands.
Multiple actors perform these actions simultaneously in the same test
environment to simulate the
natural occlusion that occurs in real shopping stores.
[0264] Cameras 114 takes images of actors performing the above
actions. In one
embodiment, twenty cameras are used in this process. The joints CNNs 112a-112n
and the tracking
engine 110 process the images to identify joints. The bounding box generator
1008 creates bounding
boxes of band regions similar to production or inference. Instead of
classifying these hand regions
via the WhatCNN 1010, the images are saved to a storage disk. Stored images
are reviewed and
labelled. An image is assigned three labels: the inventory item SK.U, the
context, and whether the
hand is holding something or not. This process is performed for a large number
of images (up to
millions of images).
102651 The image files are organized according to data
collection scenes. The naming
convention for image file identifies content and context of the images. A
first part of the file name
identifies the data collection scene and also includes the timestamp of the
image. A second part of
the file name identifies the source camera e.g., "camera 4". A third part of
the file name identifies
the frame number from the source camera, e.g., a file name can include a value
such as 94,600th
image frame from camera 4. A fourth part of the file name identifies ranges of
x and y coordinates
region in the source image frame from which this hand region image is taken.
In the illustrated
CA 03177772 2022- 11-3
WO 2021/226392
PCT/US2021/031173
example, the region is defined between x coordinate values from pixel 117 to
370 and y coordinates
values from pixels 370 and 498. A fifth part of the file name identifies the
subject identifier of the
actor in the scene, e.g., subject with an identifier "3". Finally, a sixth
part of the file name identifies
the SKU number (e.g., item...68) of the inventory item, identified in the
image.
102661 In training mode of the WhatCNN 1010, forward passes and
backpropagations are
performed as opposed to production mode in which only forward passes are
performed. During
training, the WhatCNN generates a classification of hands of the identified
subjects in a forward
pass. The output of the WhatCNN is compared with the ground truth. In the
backpropagation, a
gradient for one or more cost functions is calculated. The gradient(s) are
then propagated to the
convolutional neural network (CNN) and the fully connected (PC) neural network
so that the
prediction error is reduced causing the output to be closer to the ground
truth. In one embodiment,
stochastic gradient descent (SGD) is used for training WhatCNN 1010.
[02671 In one embodiment, 64 images are randomly selected from
the training data and
augmented. The purpose of image augmentation is to diversify the training data
resulting in better
performance of models. The image augmentation includes random flipping of the
image, random
rotation, random hue shifts, random Gaussian noise, random contrast changes,
and random cropping.
The amount of augmentation is a hyperparameter and is tuned through
hyperparameter search. The
augmented images are classified by WhatCNN 1010 during training. The
classification is compared
with ground truth and coefficients or weights of WhatCNN 1010 are updated by
calculating gradient
loss function and multiplying the gradient with a learning rate. The above
process is repeated many
times (e.g., approximately 1000 times) to form an epoch. Between 50 to 200
epochs are performed.
During each epoch, the learning rate is slightly decreased following a cosine
annealing schedule.
Training of WhenCNN Model
[02681 Training of WhenCNN 1012 is similar to the training of
'WhatCNN 1010 described
above, using backpropagations to reduce prediction error. Actors perform a
variety of actions in the
training environment. In the example embodiment, the training is performed in
a shopping store
with shelves stocked with inventory items. Examples of actions performed by
actors include, take an
inventory item from a shelf, put an inventory item back on a shelf, put. an
inventory item into a
shopping cart (or a basket), take an inventory item back from the shopping
cart, swap an item
CA 03177772 2022- 11-3
WO 2021/226392
PCT/US2021/031173
81
between left and right hands, put an inventory item into the actor's nook. A
nook refers to a location
on the actor's body that can hold an inventory item besides the left and right
hands. Some examples
of nook include, an inventory item squeezed between a forearm and upper arm,
squeezed between a
forearm and a chest, squeezed between neck and a shoulder.
[02691 The cameras 114 record videos of all actions described
above during training. The
videos are reviewed, and all image frames are labelled indicating the
timestamp and the action
performed. These labels are referred to as action labels for respective image
frames. The image
frames are processed through the multi-CNN pipelines up to the WhatC.NNs 1010
as described
above for production or inference. The output of WhatCNNs along with the
associated action labels
are then used to train the WhenCNN 1012, with the action labels acting as
ground truth. Stochastic
gradient descent (SGD) with a cosine annealing schedule is used for training
as described above for
training of WhatCNN 1010.
[02701 In addition to image augmentation (used in training of
WhatCN'N), temporal
augmentation is also applied to image frames during training of the WhenCNN.
Some examples
include mirroring, adding Gaussian noise, swapping the logits associated with
left and right hands,
shortening the time, shortening the time series by dropping image frames,
lengthening the time
series by duplicating frames, and dropping the data points in the time series
to simulate spottiness in
the underlying model generating input for the WhenCNN. Mirroring includes
reversing the time
series and respective labels, for example a put action becomes a take action
when reversed.
Process Flow of Background Image Semantic Diffing
[0271] Figs. 23A and 23B present detailed steps performed by the
semantic diffing
technique (also referred to as third image processors 1022) to track changes
by subjects in an area of
real space. In the example of a shopping store the subjects are customers and
employees of the store
moving in the store in aisles between shelves and other open spaces. The
process starts at step 2302.
As described above, the cameras 114 are calibrated before sequences of images
from cameras are
processed to identify subjects. Details of camera calibration are presented
above. Cameras 114 with
overlapping fields of view capture images of real space in which subjects are
present. In one
embodiment, the cameras are configured to generate synchronized sequences of
images at the rate of
N frames per second. The sequences of images of each camera are stored in
respective circular
CA 03177772 2022- 11-3
WO 2021/226392
PCT/US2021/031173
82
buffers 1002 per camera at step 2304. A circular buffer (also referred to as a
ring buffer) stores the
sequences of images in a sliding window of time. The background image store
1028 is initialized
with initial image frame in the sequence of image frames per camera with no
foreground subjects
(step 2306).
102721 As subjects move in front of the shelves, bounding boxes
per subject are generated
using their corresponding joint data structures 460 as described above (step
2308). At a step 2310, a
masked image is created by replacing the pixels in the bounding boxes per
image frame by pixels at
the same locations from the background image from the background image store
1028. The masked
image corresponding to each image in the sequences of images per camera is
stored in the
background image store 1028. The ith masked image is used as a background
image for replacing
pixels in the following (1 1) image frame in the sequence of image frames per
camera.
[02731 At a step 2312, N masked images are combined to generate
factored images. At a
step 2314, a difference heat map is generated by comparing pixel values of
pairs of factored images.
In one embodiment, the difference between pixels at a location (x, y) in a 2D
space of the two
factored images (fil andfi2) is calculated as shown below in equation 1:
i[x, y][red] ¨ f i2[x, y][redp2 (f il[x , y][g reen] ¨ fi21x, [greenD2
41((f t = (1)
4-([ ii[x,y][blue] f i2[x,y][blue])2)
102741 The difference between the pixels at the same x and y
locations in the 21) space is
determined using the respective intensity values of red, green and blue (KGB)
channels as shown in
the equation. The above equation gives a magnitude of the difference (also
referred to as Euclidean
norm) between corresponding pixels in the two factored images.
102751 The difference heat map can contain noise due to sensor
noise and luminosity
changes in the area of real space. In Fig 23B, at a step 2316, a bit mask is
generated for a difference
heat map. Semantically meaningful changes are identified by clusters of is
(ones) in the bit mask.
These clusters correspond to changes identifying inventory items taken from
the shelf or put on the
shelf. However, noise in the difference heat map can introduce random is in
the bit mask.
Additionally, multiple changes (multiple items take from or put on the shelf)
can introduce
overlapping clusters of is. At a next step (2318) in the process flow, image
morphology operations
are applied to the bit mask. The image morphology operations remove noise
(unwanted I s) and also
CA 03177772 2022- 11-3
WO 2021/226392
PCT/US2021/031173
83
attempt to separate overlapping clusters of is. This results in a cleaner bit
mask comprising clusters
of is corresponding to semantically meaningful changes.
102761 Two inputs are given to the morphological operation. The
first input is the bit mask
and the second input is called a structuring element or kernel. Two basic
morphological operations
are "erosion" and "dilation". A kernel consists of is arranged in a
rectangular matrix in a variety of
sizes. Kernels of different shapes (for example, circular, elliptical or cross-
shaped) are created by
adding O's at specific locations in the matrix. Kernels of different shapes
are used in image
morphology operations to achieve desired results in cleaning bit masks. In
erosion operation, a
kernel slides (or moves) over the bit mask. A pixel (either 1 or 0) in the bit
mask is considered 1 if
all the pixels under the kernel are is. Otherwise, it is eroded (changed to
0). Erosion operation is
useful in removing isolated is in the bit mask. However, erosion also shrinks
the clusters of is by
eroding the edges.
[02771 Dilation operation is the opposite of erosion. In this
operation, when a kernel slides
over the bit mask, the values of all pixels in the bit mask area overlapped by
the kernel are changed
to I, if value of at least one pixel under the kernel is I. Dilation is
applied to the bit mask after
erosion to increase the size clusters of is. As the noise is removed in
erosion, dilation does not
introduce random noise to the bit mask. A combination of erosion and dilation
operations are
applied to achieve cleaner bit masks. For example, the following line of
computer program. code
applies a 3x3 filter of is to the bit mask to perform an "open" operation
which applies erosion
operation followed by dilation operation to remove noise and restore the size
of clusters of Is in the
bit mask as described above. The above computer program code uses OpenCV (open-
source
computer vision) library of programming functions for real time computer
vision applications. The
library is available at https://opencv.org/.
_bit_mask cv2.morphologyEx(bit_mask, cv2.MORPH_OPEN, self kemel_3x3,
[02781 A "close" operation applies dilation operation followed
by erosion operation. It is
useful in closing small holes inside the clusters of ls. The following program
code applies a close
operation to the bit mask using a 30)(30 cross-shaped filler.
_bit_ma.sk cv2.morphologyEx(bit_niask, cv2.MORPH_CLOSE,
self.kernel_30x30_cross,
dst=....bit_nnask).
CA 03177772 2022-11-3
WO 2021/226392
PCT/US2021/031173
84
[0279] The bit mask and the two factored images (before and
after) are given as input to a
convolutional neural network (referred to as ChangeCNN above) per camera. The
outputs of
ChangeCNN are the change data structures. At a step 2322, outputs from
ChangeCNNs with
overlapping fields of view are combined using triangulation techniques
described earlier. A location
of the change in the 3D real space is matched with locations of shelves. If
location of an inventory
event maps to a location on a shelf, the change is considered a true event
(step 2324). Otherwise, the
change is a false positive and is discarded. True events are associated with a
foreground subject. At
a step 2326, the foreground subject is identified. In one embodiment, the
joints data structure 460 is
used to determine location of a hand joint within a threshold distance of the
change. If a foreground
subject is identified at the step 2328, the change is associated to the
identified subject at a step 2330.
If no foreground subject is identified at the step 2328, for example, due to
multiple subjects' hand
joint locations within the threshold distance of the change. Then the
detection of the change by
region proposals subsystem is selected at a step 2332. The process ends at a
step 2334.
Training the ChaniteCNN
[0280] A training data set of seven channel inputs is created to
train the ChangeCNN. One or
more subjects acting as customers, perform take and put actions by pretending
to shop in a shopping
store. Subjects move in aisles, taking inventory items from shelve and putting
items back on the
shelves. Images of actors performing the take and put actions are collected in
the circular buffer
1002. The images are processed to generate factored images as described above.
Pairs of factored
images 1030 and corresponding bit mask output by the bit mask calculator 1032
are reviewed to
visually identify a change between the two factored images. For a factored
image with a change, a
bounding box is manually drawn around the change. This is the smallest
bounding box that contains
the cluster of ls corresponding to the change in the bit mask. The SKIJ number
for the inventory
item in the change is identified and included in the label for the image along
with the bounding box.
An event type identifying take or put of inventory item is also included in
the label of the bounding
box. Thus, the label for each bounding box identifies, its location on the
factored image, the SKIJ of
the item and the event type. A factored image can have more than one bounding
boxes. The above
process is repeated for every change in all collected factored images in the
training data set. A pair
of factored images along with the bit mask forms a seven-channel input to the
ChangeCNN.
CA 03177772 2022- 11-3
WO 2021/226392
PCT/US2021/031173
[0281] During training of the ChangeCNN, forward passes and
backpropagations are
performed. In the forward pass, the ChangeCNN identify and classify background
changes
represented in the factored images in the corresponding sequences of images in
the training data set
The ChangeCNN process identified background changes to make a first set of
detections of takes of
inventory items by identified subjects and of puts of inventory items on
inventory display structures
by identified subjects. During backpropagation the output of the ChangeCNN is
compared with the
ground truth as indicated in labels of training data set. A gradient for one
or more cost functions is
calculated. The gradient(s) are then propagated to the convolutional neural
network (CNN) and the
fully connected (FC) neural network so that the prediction error is reduced
causing the output to be
closer to the ground truth. In one embodiment, a softmax function and a cross-
entropy loss function
is used for training of the ChangeCNN for class prediction part of the output.
The class prediction
part of the output includes an SKU identifier of the inventory item and the
event type i.e., a take or a
put.
[0282] A second loss function is used to train the ChangeCNN for
prediction of bounding
boxes. This loss function calculates intersection over union (IOU) between the
predicted box and the
ground truth box. Area of intersection of bounding box predicted by the
ChangeCNN with the true
bounding box label is divided by the area of the union of the same bounding
boxes. The value of
IOU is high if the overlap between the predicted box and the ground truth
boxes is large. If more
than one predicted bounding boxes overlap the ground truth bounding box, then
the one with highest
IOU value is selected to calculate the loss function. Details of the loss
function are presented by
Redmon et. al., in their paper, "You Only Look Once: Unified, Real-Time Object
Detection"
published on May 9, 2016. The paper is available at
https://arxiv.orglpdf/1506.02640.pdf
Computer System
[0283] Fig. 24 presents an architecture of a network hosting
image recognition engines. The
system includes a plurality of network nodes 101a-101n in the illustrated
embodiment. In such an
embodiment, the network nodes are also referred to as processing platforms.
Processing platforms
101a-101n and cameras 2412, 2414, 2416, ... 2418 are connected to network(s)
2481.
[0284] Fig. 24 shows a plurality of cameras 2412, 2414, 2416,
... 2418 connected to the
network(s). A large number of cameras can be deployed in particular systems.
In one embodiment,
CA 03177772 2022- 11-3
WO 2021/226392
PCT/US2021/031173
86
the cameras 2412 to 2418 are connected to the network(s) 2481 using Ethernet-
based connectors
2422, 2424, 2426, and 2428, respectively. In such an embodiment, the Ethernet-
based connectors
have a data transfer speed of 1 gigabit per second, also referred to as
Gigabit Ethernet It is
understood that in other embodiments, cameras 114 are connected to the network
using other types
of network connections which can have a faster or slower data transfer rate
than Gigabit Ethernet.
Also, in alternative embodiments, a set of cameras can be connected directly
to each processing
platform, and the processing platforms can be coupled to a network.
102851 Storage subsystem 2430 stores the basic programming and
data constructs that
provide the functionality of certain embodiments of the present invention. For
example, the various
modules implementing the functionality of proximity event detection engine may
be stored in
storage subsystem 2430. The storage subsystem 2430 is an example of a computer
readable memory
comprising a non-transitory data storage medium, having computer instructions
stored in the
memory executable by a computer to perform the all or any combination of the
data processing and
image processing functions described herein, including logic to identify
changes in real space, to
track subjects, to detect puts and takes of inventory items, and to detect
hand off of inventory items
from one subject to another in an area of real space by processes as described
herein. In other
examples, the computer instructions can be stored in other types of memory,
including portable
memory, that comprise a non-transitory data storage medium or media, readable
by a computer.
[0286] These software modules are generally executed by a
processor subsystem 2450. The
processor subsystem 2450 can include sequential instruction processors such as
CPUs and GPUs,
data flow instruction processors, such as FPGAs configured by instructions in
the form of bit files,
dedicated logic circuits supporting some or all of the functions of the
processor subsystem, and
combinations of one or more of these components. The processor subsystem may
include cloud-
based processors in some embodiments.
[0287] A host memory subsystem 2432 typically includes a number
of memories including a
main random-access memory (RAM) 2434 for storage of instructions and data
during program
execution and a read-only memory (ROM) 2436 in which fixed instructions are
stored. In one
embodiment, the RAM 2434 is used as a buffer for storing video streams from
the cameras 114
connected to the platform 101a.
CA 03177772 2022- 11-3
WO 2021/226392
PCT/US2021/031173
87
[0288] A file storage subsystem 2440 provides persistent storage
for program and data files.
In an example embodiment, the storage subsystem 2440 includes four 120
Gigabyte (GB) solid state
disks (S SD) in a RAID 0 (redundant array of independent disks) arrangement
identified by a
numeral 2442. In the example embodiment, in which CNN is used to identify
joints of subjects, the
RAID 0 2442 is used to store training data. During training, the training data
which is not in RAM
2434 is read from RAID 0 2442. Similarly, when images are being recorded for
training purposes,
the data which is not in RAM 2434 is stored in RAID 02442. In the example
embodiment, the hard
disk drive (HUD) 2446 is a 10 terabyte storage. It is slower in access speed
than the RAID 0 2442
storage. The solid state disk (SSD) 2444 contains the operating system and
related files for the
image recognition engine 112a.
[0289] In an example configuration, three cameras 2412, 2414,
and 2416, are connected to
the processing platform 101a. Each camera has a dedicated graphics processing
unit GPU 1 2462,
GPU 2 2464, and GPU 3 2466, to process images sent by the camera. It is
understood that fewer
than or more than three cameras can be connected per processing platform.
Accordingly, fewer or
more GPUs are configured in the network node so that each camera has a
dedicated GPU for
processing the image frames received from the camera. The processor subsystem
2450, the storage
subsystem 2430 and the GPUs 2462, 2464, and 2466 communicate using the bus
subsystem 2454.
[0290] A number of peripheral devices such as a network
interface subsystem, user interface
output devices, and user interface input devices are also connected to the bus
subsystem 2454
forming part of the processing platform 101a. These subsystems and devices are
intentionally not
shown in Fig. 24 to improve the clarity of the description. Although bus
subsystem 2454 is shown
schematically as a single bus, alternative embodiments of the bus subsystem
may use multiple
busses.
[0291] In one embodiment, the cameras 2412 can be implemented
using Chameleon3 1.3
MP Color USB3 Vision (Sony ICX445), having a resolution of 1288 x 964, a frame
rate of 30 FPS,
and at 1.3 MegaPixels per image, with Varifocal Lens having a working distance
(mm) of 300 - oo, a
field of view field of view with a 1/3" sensor or 98.2' - 23.8'.
[0292] A first system, method and computer program product are
provided for tracking
exchanges of inventory items by subjects in an area of real space, comprising
a processing system
CA 03177772 2022- 11-3
WO 2021/226392
PCT/US2021/031173
88
configured to receive a plurality of sequences of images of corresponding
fields of view in the real
space, the processing system including
an image recognition logic, receiving sequences of images from the plurality
of sequences,
the image recognition logic processing the images in sequences to identify
locations of first and
second subjects over time represented in the images; and
logic to process the identified locations of the first and second subjects
over time to detect an
exchange of an inventory item between the first and second subjects.
102931 The first system, method and computer program product can
include a plurality of
sensors, sensors in the plurality of sensors producing respective sequences in
the plurality of
sequences of images of corresponding fields of view in the real space, the
field of view of each
sensor overlapping with the field of view of at least one other sensor in the
plurality of sensors.
[02941 The first system, method and computer program product is
provided wherein the
image recognition logic includes an image recognition engine to detect the
inventory item of the
detected exchange.
[02951 The first system, method and computer program product is
provided, wherein the
locations of the first and second subjects include locations corresponding to
hands of the first and
second subjects, and wherein the image recognition logic includes an image
recognition engine to
detect the inventory item in the hands of the first and second subjects in the
detected exchange.
[0296] The first system, method and computer program product is
provided, wherein the
image recognition logic includes a neural network trained to detect joints of
subjects in images in
the sequences of images, and heuristics to identify constellations of detected
joints as locations of
subjects, the image recognition logic further including logic to produce
locations corresponding to
hands of the first and second subjects in the detected joints, and a neural
network trained to detect
inventory items in hands of the first and second subjects in images in the
sequences of images.
[0297] The first system, method and computer program product is
provided, wherein the
logic to process locations of the first and second subjects over time includes
logic to detect
proximity events when distance between locations of the first and second
subjects is below a pre-
determined threshold, wherein the locations of the subjects include three-
dimensional positions in
the area of real space.
CA 03177772 2022- 11-3
WO 2021/226392
PCT/US2021/031173
89
[0298] The first system, method and computer program product is
provided, wherein the
logic to process locations over time includes a trained neural network to
detect a likelihood that the
first and second subjects are holding an inventory item in images preceding
the proximity event and
in images following the proximity event
[02991 The first system, method and computer program product is
provided, wherein the
logic to process locations over time includes a trained decision tree network
to detect the proximity
event.
[0300] The first system, method and computer program product is
provided, wherein the
logic to process locations over time includes a trained random forest network
to detect the proximity
event.
[03011 A second system method and computer program product are
provided for detecting
exchanges of inventory items in an area of real space, for a method including:
receiving a plurality of sequences of images of corresponding fields of view
in the real
space;
processing the sequences of images to identify locations of first sources and
first sinks,
wherein the first sources and the first sinks represent subjects in three
dimensions in the area of real
space;
receiving positions of second sources and second sinks in three dimensions in
the area of real
space, wherein the second sources and the second sinks represent locations on
inventory display
structures in the area of real space; and
processing the identified locations of the first sources and the first sinks
and locations of the
second sources and second sinks over time to detect an exchange of an
inventory item between
sources and sinks in the first sources and the first sinks and sources and
sinks in a combined first and
second sources and sinks, by determining a proximity event in case distance
between location of a
source in the first sources and second sources is below a pre-determined
threshold to location of a
sink in the first sinks and second sinks, or
distance between location of a sink in the first sinks and second sinks is
below a pre-
determined threshold to location of a source in a combined first and second
sources, and processing
images before and after a determined proximity event to identify an exchange
by detecting a
condition,
CA 03177772 2022- 11-3
WO 2021/226392
PCT/US2021/031173
wherein the source in the first sources and second sources holds the inventory
item of the
exchange prior to the detected proximity event and does not hold the inventory
item after the
detected proximity event and the sink in the first sinks and second sinks does
not hold the inventory
item of the exchange prior to the detected proximity event and holds the
inventory item after the
detected proximity event
[0302] A third system method and computer program product are
provided for detecting
exchanges of inventory items in an area of real space, for a method for fusing
inventory events in an
area of real space, the method including:
receiving a plurality of sequences of images of corresponding fields of view
in the real
space;
processing the sequences of images to identify locations of sources and sinks
over time
represented in the images, wherein the sources and sinks represent subjects in
three dimensions in
the area of real space;
using redundant procedures to detect an inventory event indicating exchange of
an item
between a source and a sink;
producing streams of inventory events using the redundant procedures, the
inventory events
including classification of the item exchanged;
matching an inventory event in one stream of the inventory events with
inventory events in
other streams of the inventory events within a threshold of a number of frames
preceding or
following the detection of the inventory event; and
generating a fused inventory event by weighted combination of the item
classification of the
item exchanged in the inventory event and the item exchanged in the matched
inventory event.
103031 A fourth system method and computer program product are
provided for detecting
exchanges of inventory items in an area of real space, for a method for fusing
inventory events in an
area of real space, the method including:
receiving a plurality of sequences of images of corresponding fields of view
in the real
space;
processing the sequences of images to identify locations of sources and sinks
over time
represented in the images, wherein the sources and sinks represent subjects in
three dimensions in
the area of real space;
CA 03177772 2022- 11-3
WO 2021/226392
PCT/US2021/031173
91
detecting a proximity event indicating exchange of an item between a source
and a sink
when distance between the source and the sink is below a pre-determined
threshold,
producing a stream of proximity events over time, the proximity events
including
classifications of items exchanged between the sources and the sinks;
processing bounding boxes of hands in images in the sequences of images to
produce
holding probabilities and classifications of items in the hands;
performing a time sequence analysis of the holding probabilities and
classifications of items
to detect region proposals events and producing a stream of region proposal
events over time;
matching a proximity event in the stream of proximity events with events in
the stream of
region proposals events within a threshold of a number of frames preceding or
following the
detection of the proximity event; and
generating a fused inventory event by weighted combination of the item
classification of the
item exchanged in the proximity event and the item exchanged in the matched
region proposals
event.
[03041 A fifth system method and computer program product are
provided for detecting
exchanges of inventory items in an area of real space, for a method for fusing
inventory events in an
area of real space, the method including:
receiving a plurality of sequences of images of corresponding fields of view
in the real
space;
processing the sequences of images to identify locations of sources and sinks
over time
represented in the images, wherein the sources and sinks represent subjects in
three dimensions in
the area of real space;
detecting a proximity event indicating exchange of an item between a source
and a sink
when distance between the source and the sink is below a pre-determined
threshold,
producing a stream of proximity events over time, the proximity events
including
classifications of items exchanged between the sources and the sinks;
masking foreground source and sinks in images in the sequences of images to
generate
background images of inventory display structures;
CA 03177772 2022- 11-3
WO 2021/226392
PCT/US2021/031173
92
processing background images to detect semantic diffing events including item
classifications and sources and sinks associated with the classified items and
producing a stream of
semantic diffing events over time;
matching a proximity event in the stream of proximity events with events in
the stream of
semantic diffing events within a threshold of a number of frames preceding or
following the
detection of the proximity event; and
generating a fused inventory event by weighted combination of the item
classification of the
item exchanged in the proximity event and the item exchanged in the matched
semantic diffing
event.
CA 03177772 2022- 11-3