Note: Descriptions are shown in the official language in which they were submitted.
WO 2022/006287
PCT/US2021/039916
METHODS FOR MEASURING DUST AND LINT
CROSS-REFERENCE TO RELATED APPLICATIONS
[0001] This application claims the priority benefit of U.S. Provisional
Application Ser. No.
63/046,053 filed June 30, 2020 entitled -METHODS FOR MEASURING DUST AND
LINT- which is incorporated by reference herein in its entirety.
FIELD OF THE ART
[0002] The present disclosure generally relates to methods for the measurement
of dust and
lint particles, such as dust and lint particles that may originate from and/or
are produced
during the manufacture or production of paper, cloth or textiles, for example,
tissue and other
printed fine paper and board grades, and/or the dust and lint particles that
may originate from
and/or are produced during the use of paper, cloth or textiles, for example,
tissue and other
printed fine paper and board grades.
BACKGROUND
[0003] Dusting and linting represent major areas of concern for paper
manufacturers. The
various problems and concerns related to dusting and linting represent
millions of euros in
additional costs during the manufacturing of tissue and other printed fine
paper and board
grades. These issues generally affect the safety, productivity, and/or
manufacturing costs of
paper making processes as well as the performance and overall end-user
satisfaction with the
final product.
[0004] Dusting, in some instances referred to as sheet dusting, typically
takes place at the
tissue manufacturing and converting sites, generally from Yankee doctor
creping processes,
sheet rewinders, and converting /embossing processes. Dusting at manufacturing
and
converting sites leads to at least three areas of concern: safety/OSHA-related
concerns, such
the generation of small air-suspended particles being breathed by operators;
fire hazard
concerns, as dust/fines can build up on equipment and ceiling rafters over
time and can be a
major contributing factor in fires and explosions; and cost of control /
removal of dust
1
CA 03183166 2022- 12- 16
WO 2022/006287
PCT/US2021/039916
particles, as the current methods include vacuums, frequent sweepings, and/or
shut downs, all
of which carry significant cost for the producer.
[0005] Linting, in some instances referred to as sheet linting, typically
takes place at the point
of end use. Particles can fall off of the end product, e.g., facial tissue,
e.g., bath tissue, and
lead to problems such as, for example: toilet tissue - lint can build up on
the bathroom floors,
thereby causing customer dissatisfaction; paper towels - when cleaning glass
surfaces, fine
lint particles can be left on the surface, thereby causing customer
dissatisfaction. Moreover,
sheet pilling may occur, which, in the example of bath tissue, occurs when
sheet surface
fibers (non-bound) roll up on the sheet, often causing customer
dissatisfaction.
[0006] Currently, the paper industry has few options or tools suitable for
determining the
quantity, amount, and/or number of dust and lint particles that can be
dislodged from a
product in the manufacturing site or by end consumer usage. Moreover, the
currently existing
options are often expensive, produce questionable result trends, and are not
portable. As such,
there is high interest and a significant need in the industry for improved
dust and lint particle
measurement methods and arrangements.
BRIEF SUMMARY
[0007] The present disclosure generally relates to a method of measuring the
number and/or
amount of dust and lint particles comprised or deposited onto a paper, textile
or cloth sample,
optionally during manufacturing, production or use of a paper, textile or
cloth sample,
wherein said method comprises:
(i) contacting one or more paper, textile or cloth samples with a non-adhesive
textile or
cloth substrate, optionally a felt pad;
(ii) applying friction and/or pressure to the one or more paper, textile or
cloth samples
which are in contact with the non-adhesive textile or cloth substrate such
that dust
and lint particles are transferred onto the non-adhesive textile or cloth
substrate;
(iii) measuring the number of dust and lint particles on the non-adhesive
textile or cloth
substrate, which number represents or is correlated to the number and/or
amount of
dust and lint particles which are comprised or deposited onto the paper,
textile or
cloth sample during manufacturing, production or use; and
(iv) optionally cleaning the non-adhesive textile or cloth substrate prior to
repeating steps
i.-iii.
2
CA 03183166 2022- 12- 16
WO 2022/006287
PCT/US2021/039916
[0008] In some embodiments, the number and/or of amount of dust and lint
particles
transferred onto the non-adhesive textile or cloth substrate, optionally a
felt pad, represents or
is correlated to the number and/or of amount of dust and lint particles
deposited onto the
paper, textile or cloth sample during manufacture, production or use of said
paper, textile or
cloth sample. In some embodiments, the number and/or of amount of dust and
lint particles
transferred onto the non-adhesive textile or cloth substrate, optionally a
felt pad, represents or
is correlated to the number and/or of amount of dust and lint particles
deposited onto the
paper, textile or cloth sample during use of the paper, textile or cloth
sample, such as use by
the end-user. In some embodiments, one or more baseline measurements are
performed as a
part of the method, optionally wherein said baseline measurements are
performed by
acquiring one or more images of the paper or cloth substrate and analyzing the
images for
dust and lint particles. In some embodiments, the method is performed in part
or entirely
automatically. In some embodiments, said method is performed in-line with a
paper, textile or
cloth manufacturing process. In some embodiments, step (iii) comprises in part
analysis of
the amount of dust and lint particles in part by the formula as follows: Dust
& Lint Particle
Count (D&L) =11 (D&L A1¨ Baseline A1) (D&L A2¨ Baseline A2)... + (D&L AN -
Baseline AN)1 / AN (Al, A2... AN) represent each of any number of measurement
points during
a test run or baseline measurement, optionally, N is 3. In some embodiments,
step (iii) may
comprise in part acquiring one or more reflectance images. In some
embodiments, step (iii)
may comprise in part acquiring one or more reflectance images using an optical
device
equipped with a machine vision camera and microscopic macro-lens, optionally
wherein the
device further comprises one or more LED lights, in some instances 8 white LED
lights,
which may be used to illuminate the surface. In some embodiments, the vertical
angle
between the LED and the surface may be about 25 degrees or less, 25 degrees or
more, 30
degrees or more, 35 degrees or more, 40 degrees or more, 45 degrees or more,
50 degrees or
more, 55 degrees or more, or 60 degrees or more. In some embodiments, the LEDs
may be
evenly spaced around the target measurement area, optionally in some instances
a 45 degree
horizontal angle between the LEDs. In some embodiments, step (iii) may further
comprise
use of image analysis software may be used to analyze collected reflectance
images. hi some
embodiments, image analysis software may be used to remove false objects from
the
reflectance images, such as, for example, scratches on the surface. In some
embodiments,
image analysis software may be used in part to classify dust and lint
particles into desired
classes, such as fiber, fine, or starch.
3
CA 03183166 2022- 12- 16
WO 2022/006287
PCT/US2021/039916
[0009] In some embodiments, said method further comprises assigning particle
types to each
measured particle, which optionally particle types optionally comprise fibers,
fines, starch,
and/or ash. In some embodiments, the sample comprises a paper product and/or
board based
product and/or fiber-based product including but not limited to fiber-based
products,
handsheets, board-based products, bath tissue, facial tissue, base sheet,
parent roll, converted
product, converted finished sheet, beverage carriers, toweling, milk and juice
cartons, food
trays, paper bags, liner board for corrugated containers, packaging board
grade, and tissue
and towel grade, paper materials, paper towels, diapers, sanitary napkins,
training pants,
pantiliners, incontinence briefs, tampons, pee pads, litter box liners, coffee
filters, air filters,
dryer pads, floor cleaning pads, absorbent facial tissue, absorbent bathroom
tissue, napkins,
wrapping paper, and other paperboard products such as cartons and bag paper;
uncreped
and/or creped paper; fine paper; optionally wherein the sample comprises bath
tissue and/or
facial tissue. In some embodiments, the sample comprises a coated paper sample
and/or a
paper-based product on which printed type and/or images are to be placed. In
some
embodiments, the dust and lint measurement is combined and/or analyzed with
other data for
understanding of cause and effect relationships during paper product
production and/or use of
paper products.
[0010] In some embodiments, said non-adhesive textile or cloth substrate
comprises a felt
pad, optionally a black felt pad. In some embodiments, one or more weighted
surfaces are
used to apply friction and/or pressure to the one or more paper, textile or
cloth samples. In
some embodiments, the friction and/or pressure is applied mechanically,
optionally while
measuring the amount of dust and/or lint particles produced by a paper,
textile or cloth
sample during a paper or cloth making process. In some embodiments, said non-
adhesive
textile or cloth substrate is black or optionally another dark color,
optionally brown, red,
purple, orange, blue or green. In some embodiments, one or more weighted
surfaces are used
to apply friction and/or pressure to the one or more paper, textile or cloth
samples, wherein
said weight surfaces comprise one or more felt pads. In some embodiments, the
non-adhesive
textile or cloth substrate is any size and/or shape. In some embodiments, the
amount of
pressure applied is any amount of pressure. In some embodiments, the amount of
pressure
applied is 1 Pa or less, 1 Pa or more, 5 Pa or more, 10 Pa or more, 15 Pa or
more, 20 Pa or
more, 25 Pa or more, 30 Pa or more, 35 Pa or more, 40 Pa or more, 45 Pa or
more, 50 Pa or
more, 60 Pa or more, 70 Pa or more, 80 Pa or more, 90 Pa or more, 100 Pa or
more, 125 Pa or
more, 150 Pa or more, 159 Pa or more, 175 Pa or more, or 200 Pa or more. In
some
embodiments, one or more weighted surfaces are used to apply friction and/or
pressure to the
4
CA 03183166 2022- 12- 16
WO 2022/006287
PCT/US2021/039916
one or more paper, textile or cloth samples, wherein the total weight placed
on top of the
sample is about 10 g or more, about 35 g or more, about 70 g or more, about
100 g or more,
about 200 g or more, about 300 g or more, about 400 g or more, about 500 g or
more;
optionally from about 35 g to about 500 g, further optionally from about 10 g
to about 100 g.
In some embodiments, 2 or more, 3 or more, 4 or more, 5 or more, 6 or more, 7
or more, 8 or
more, 9 or more, or 10 or more, 25 or more, 50 or more, or 100 or more
measurement points
are used for collecting data during a single test run.
[0011] In some embodiments, the sample is one or more cloth or textile samples
comprised
of natural and/or synthetic materials or fibers, e.g., acetate, ANTRON,
bamboo, Bisso, blend,
boiled wool, boucle, carbon-infused, charmeuse, chenille, chiffon, chino,
chintz, combed
cotton, Coolmax, corduroy, cotton, cotton lisle, damask, double knit, ecosil
polyester,
Egyptian cotton, elastane, eyelet, faille, fiberfill, French terry, gaberdine,
hydrophilic fabric,
hydrophobic fabric, interlock knit, Italian nylon, jacquard, jacquard knit,
jersey, knit, lace,
lame, latex, linen, lining, Lycra , lyocell, memory foam, mercerized cotton,
merino wool,
mesh, micro modal, microfiber, microfleece, modal, neoprene, nylon, olefin,
panne, Peruvian
pima cotton, pima cotton, pique, polyamide, polyester. powernet, rayon, rib
knit, a sanforized
cloth or textile, satin, silicone, silk, soy, spandex, spannette, supplex
nylon, tactel, Tencel,
themastat, tricot, velour, velvet, viscose, vinyl, wool, a woven cloth or
textile, x-static silver
fiber and combinations of any of the foregoing.
1100121 In some embodiments, the sample comprises one or more textile samples,
optionally
carpet or geotextile sample, comprised of natural and/or synthetic fibers. In
some
embodiments, any of the methods described herein may be repeated with
different cloth,
textile or paper samples, optionally of the same size and/or shape as the
first cloth, textile or
paper sample.
[0013] Additionally, the present disclosure generally relates to a method of
measuring the
number and/or amount of dust and lint particles comprised on or deposited onto
a paper,
textile or cloth sample during manufacturing, production or use of any of the
foregoing,
wherein said method comprises:
(i) contacting one or more paper, textile or cloth samples with a non-
adhesive cloth
or textile substrate, optionally a felt pad;
(ii) applying friction and/or pressure to the one or more paper, textile or
cloth
materials which are in contact with the non-adhesive cloth or textile
substrate,
optionally a felt pad, such that dust and lint particles are transferred onto
the non-
adhesive cloth or textile substrate;
CA 03183166 2022- 12- 16
WO 2022/006287
PCT/US2021/039916
(iii) measuring the number of dust and lint particles which are transferred
onto the
non-adhesive cloth or textile substrate, optionally a felt pad, which number
represents the number and/or amount of dust and lint particles comprised on or
deposited onto the paper, textile or cloth sample during manufacturing,
production
or use; and
(iv) optionally cleaning the non-adhesive cloth or textile substrate prior
to repeating
steps(i) to (iii); wherein said method is optionally performed in part or
entirely: a.
automatically; or b. manually.
BRIEF DESCRIPTION OF THE SEVERAL VIEWS OF THE DRAWING
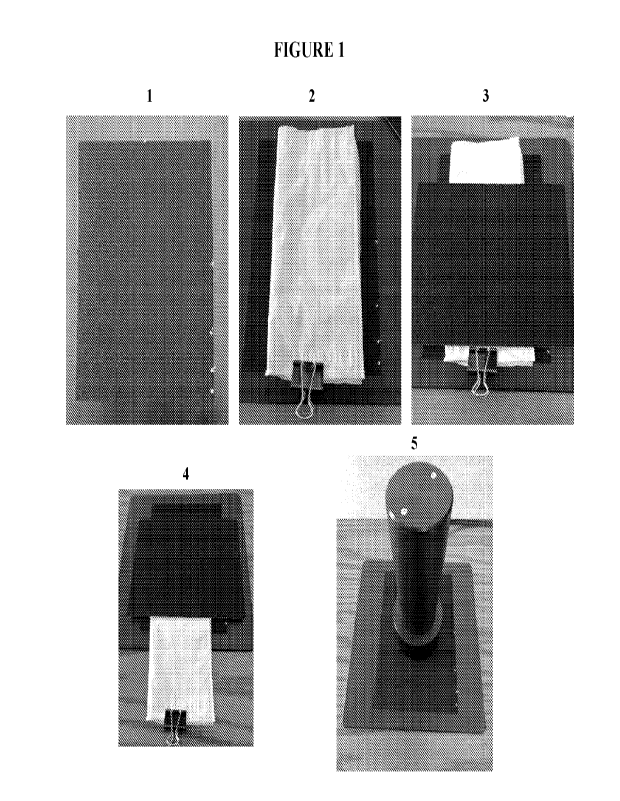
[0014] Figure 1 (FIG. 1) presents an image outlining an exemplary method of
measuring
dust and lint in accordance with Example 1.
[0015] Figure 2 (FIG. 2) presents an imaging system comprising a KEMVIEW
Generation
II (Gen II) sheet structure analyzer ("SSA-) unit used for dust and lint
measurement in
accordance with Examples 1-5.
[0016] Figure 3 (FIG. 3) presents dust and lint measurement data obtained in
accordance
with Example 1.
[0017] Figure 4 (FIG. 4) presents dust and lint measurement data obtained in
accordance
with Example 1.
[0018] Figure 5 (FIG. 5) presents a baseline image and a test run image
obtained in
accordance with Example 1.
[0019] Figure 6 (FIG. 6) presents dust and lint measurement data obtained in
accordance
with Example 1.
[0020] Figure 7 (FIG. 7) presents an image of color-coded dust and lint
particles obtained in
accordance with Example 1.
[0021] Figure 8 (FIG. 8) presents dust and lint measurement data obtained in
accordance
with Example 2.
[0022] Figure 9 (FIG. 9) presents a baseline image and test run images
obtained in
accordance with Example 2.
[0023] Figure 10 (FIG. 10) presents dust and lint measurement data obtained in
accordance
with Example 2.
6
CA 03183166 2022- 12- 16
WO 2022/006287
PCT/US2021/039916
[0024] Figure 11 (FIG. 11) presents a baseline image and test run images
obtained in
accordance with Example 2.
[0025] Figure 12 (FIG. 12) presents an image outlining an exemplary method of
measuring
dust and lint in accordance with Example 3.
[0026] Figure 13A (FIG. 13A) presents dust and lint measurement data obtained
in
accordance with Example 3 (Y-axis) and the GMT dry tensile strength index (X-
axis) of each
sample.
[0027] Figure 13B (FIG. 13B) presents dust and lint measurement data obtained
in
accordance with Example 3 (Y-axis) and the GMT dry tensile strength index (X-
axis) of each
sample.
[0028] Figure 13C (FIG. 13C) presents dust and lint measurement data obtained
in
accordance with Example 3 (Y-axis) and the TSA Hand Feel as measured by the TP
II
algorithm (X-axis) of each sample.
[0029] Figure 13D (FIG. 13D) presents dust and lint measurement data obtained
in
accordance with Example 3 (Y-axis) and the free fiber ends folded (#/cm2) (X-
axis) of each
sample.
[0030] Figure 14 (FIG. 14) presents the GMT wet and dry tensile strength
values of
different bath tissue samples used in accordance with Example 3.
[0031] Figure 15 (FIG. 15) presents dust and lint measurement data obtained in
accordance
with Example 4.
[0032] Figure 16 (FIG. 16) presents an image of a black felt pad used in
accordance with the
methods of Example 5.
[0033] Figure 17A (FIG. 17A) presents an image of a black felt pad and imaging
system
comprising a KemViewTm Gen 11 camera used in accordance with Example 5.
[0034] Figure 17B (FIG. 17B) presents an image of a black felt pad and imaging
system
comprising a KemViewTM Gen II camera used in accordance with Example 5.
[0035] Figure 1 SA (FIG. ISA) presents an image of a paperboard used in
accordance with
the methods of Example 5.
[0036] Figure 18B (FIG. 18B) presents an image of a black felt pad and imaging
system
comprising a KemViewTM Gen II camera used in accordance with Example 5.
[0037] Figure 18C (FIG. 18C) presents an image of a black felt pad and a bath
tissue sample
used in accordance with Example 5.
[0038] Figure 18D (FIG. 18D) presents an image of a test run performed in
accordance with
Example 5.
7
CA 03183166 2022- 12- 16
WO 2022/006287
PCT/US2021/039916
[0039] Figure 19A (FIG. 19A) presents a schematic of a dust and lint test
method in
accordance with Example 5.
[0040] Figure 19B (FIG. 19B) presents a schematic of a dust and lint test
method in
accordance with Example 5.
[0041] Figure 20 (FIG. 20) presents dust and lint measurement data obtained in
accordance
with Example 5.
[0042] Figure 21 (FIG. 21) presents dust and lint measurement data obtained in
accordance
with Example 5.
[0043] Figure 22 presents a schematic of a dust and lint test method in
accordance with
Example 6.
[0044] Figure 23 presents a schematic of a dust and lint test method in
accordance with
Example 6.
[0045] Figure 24 presents a schematic of a dust and lint test method in
accordance with
Example 6.
[0046] Figure 25 presents a schematic of an embodiment of an imaging system
for use with
the methods described herein.
[0047] Figure 26 presents a schematic of a measurement system including a
computer device
for use with the methods described herein.
[0048] Figure 27 presents a flow chart of an example of using images for data
analysis, e.g.,
as a part of dust and lint particle measurement.
[0049] Figure 28 presents an example of an imaging arrangement/system for use
with the
methods described herein.
[0050] Figure 29 presents an example of an imaging arrangement/system for use
with the
methods described herein.
[0051] Figure 30 presents an example of an imaging arrangement/system
comprising
polarizers for use with the methods described herein.
DETAILED DESCRIPTION
DEFINITIONS
[0052] As used herein the singular forms "a", "an", and "the" include plural
referents unless
the context clearly dictates otherwise. All technical and scientific terms
used herein have the
8
CA 03183166 2022- 12- 16
WO 2022/006287
PCT/US2021/039916
same meaning as commonly understood to one of ordinary skill in the art to
which this
invention belongs unless clearly indicated otherwise.
[0053] As used herein, the terms -papermaking process", -papermaking
application", and the
like, generally refer to any process in which any form of paper and/or
paperboard product
may be produced. For example, such processes include making paper products
from pulp,
such as methods comprising forming an aqueous cellulosic papermaking furnish,
draining the
furnish to form a sheet, and drying the sheet. The steps of forming the
papermaking furnish,
draining and drying may be carried out in any conventional manner generally
known in the
art. Papermaking processes further includes processes such as embossing and/or
printing type
on paper products.
[0054] As used herein, the terms -paper sample" and "paper product" are used
interchangeably and generally refer to any paper or paper comprising product,
such as those
arising for a papermaking process, as described herein. In some instances, a
paper sample
may comprise a converted roll and/or a commercial paper product.
[0055] As used herein, the terms "cloth sample" and "cloth product" are used
interchangeably and generally refer to any cloth or cloth comprising product,
such as those
arising from a clothmaking process. Cloth samples may include, but are not
limited to, cloths
comprising acetate, ANTRON, bamboo, Bisso, blend, boiled wool, boucle, carbon-
infused,
charmeuse, chenille, chiffon, chino, chintz, combed cotton, COOLMAX ,
corduroy, cotton,
cotton lisle, damask, double knit, ecosil polyester, Egyptian cotton,
elastane, eyelet, faille,
fiberfill, French terry, gaberdine, hydrophilic fabric, hydrophobic fabric,
interlock knit,
Italian nylon, jacquard, jacquard knit, jersey, knit, lace, lame, latex,
linen, lining, Lycra ,
lyocell, memory foam, mercerized cotton, merino wool, mesh, micro modal,
microfiber,
microfleece, modal, neoprene, nylon, olefin, panne, Peruvian pima cotton, pima
cotton,
pique, polyamide, polyester, powemet, rayon, rib knit, a sanforized cloth,
satin, silicone, silk,
soy, spandex, spannette, supplex nylon, tactel, Tencel, themastat, tricot,
velour, velvet,
vicose, vinyl, wool, a woven cloth, and/or x-static silver fibers or
combnations of any of the
foregoing.
[0056] As used herein the term "textile sample" or "textile product" refers to
any flexible
material consisting of a network of natural or artificial fibers (yarn or
thread) produced by
spinning raw fibers, e.g., of wool, flax, cotton, hemp, or other materials to
produce long
strands. Textiles are formed by weaving, knitting, crocheting, knotting,
tatting, felting, or
braiding. Textiles are generally classified according to their component
fibers, e.g., into silk,
wool, linen, cotton, such synthetic fibers as rayon, nylon, and polyesters,
and some inorganic
9
CA 03183166 2022- 12- 16
WO 2022/006287
PCT/US2021/039916
fibers, such as cloth of gold, glass fiber, and asbestos cloth. Textiles can
also be classified as
natural textiles and synthetic textiles. The main types of natural textiles
are cotton, silk,
denim, flannel, hemp, leather, linen, velvet, and wool; the major types of
synthetic textiles
include nylon, polyester, acetate, acrylic, polar fleece, rayon and spandex.
Textiles may be
used to produce different materials such as cloth, carpets, and geotextiles.
[0057] The terms "dust particles" and "lint particles" are used
interchangeably herein to refer
to particles that originate from a papermaking process and/or from a paper
product itself,
such as particles from a fibrous structure that can become airborne after the
fibrous structure
has been subjected to a force and/or loose particles on a sheet surface, which
may in some
instances either negatively affect the sheet quality or negatively affect
performance during
final use by an end-user; and/or to particles that originate from cloth or a
clothmaking
process. In some instances, during a papermaking process, dust particles may
leave the sheet
during its manufacturing, rewinding, and/or converting process and enter into
the surrounding
environment. These particles can build up on surfaces throughout the building,
equipment
within the building, and/or can be breathed in by machine operators. Buildup
of dust and/or
lint particles on surfaces can pose fire risks, and particles breathed in by
machine operators
can cause health concerns. In addition to dust particles released during the
papermaking
applications, such as manufacturing and converting operations related to paper
production,
dust particles may be released during dispensing of the final paper product,
e.g., tissue paper,
by the end-user.
[0058] In some instances, particles, such as lint particles, that are loose on
a paper sheet
surface can negatively affect the sheet quality or its final use. For example,
regarding fine
paper, particle buildup, such as dust and/or lint particle buildup, may affect
printing sheet
quality, printing roll deposit buildup, and downtime for clean-up. As a
further example, in
some instances dust and/or lint particles originating from bath tissue can
buildup on the floor
below the tissue roll during use by an end-user. As a further example, in some
instances,
paper towels can leave (deposit) small fibers on a glass surface when washing
a window,
thereby leading to end-user dissatisfaction.
[0059] In some instances, particles such as dust or lint particles that
originated from a
fibrous structure can remain on a surface of a paper product after the fibrous
structure has
come into contact with another surface. For example, in some instances
dust/lint particles can
be released from the paper product during use of the product, such as, for
example, surface
wiping with paper towel, body hygiene using tissues such as bath tissue, and
facial hygiene
using a paper product such as a napkin or facial tissue.
CA 03183166 2022- 12- 16
WO 2022/006287
PCT/US2021/039916
[0060] Types of dust/lint particles include but are not limited to: fibers,
fines, starch, and ash.
Fiber particles generally have the greatest length (approximately 0.2-3.5 mm
in some
instances) of the types of dust and lint particles and generally include
eucalyptus and acacia,
Scandinavian pine, Southern pine fibers, virgin and recycled fibers, fiber
product
mechanically and/or chemically, hardwoods, softwoods, nonwoods, fibers
originated from
different species, bleached fibers, and/or unbleached fibers. Fines generally
include shorter
length fibers (approximately 0.2 mm in some instances) that also have a low
width.
Moreover, it is generally understood that fines refer to small cellulosic
materials that are of
such size so as to pass through a forming fabric. Furthermore, an industry-
recognized method
(TAPPI Useful Method) refers to fines as objects small enough to pass through
a conical hole
having a minimum diameter of 76 microns. In some instances, fines can have a
significant
impact on processing, particularly with regard to filtering or drainage
operations. Starch
particles are particles that are generally of a length of about 1-10 lam and a
width of 1.5-9
p.m, and in some instances appear as platelet-like shapes. Ash particles
generally comprise a
greater circularity and platelet surface area as compared to the other
particle types.
METHODS FOR MEASURING DUST AND LINT
[0061] As discussed supra, dust and lint particles that are generated during
papermaking
applications and/or during use of paper products represent major areas of
concern for paper
manufactures and dealers. The currently available technologies for measuring
dust and lint
particles are often bulky, non-portable (or at least not easily portable),
expensive, and
inaccurate. Moreover, current technologies rely on automated, motorized
devices, which in
many instances contribute to their bulk and expense. Furthermore, some
currently available
technologies are limited to only having the capability to test a small subset
of specific product
types. For example, some methods may only work accurately with printing and
writing
papers but not with bath and/or facial tissue samples, thereby requiring users
to buy and
maintain multiple instruments if they are to test samples of various different
types.
[0062] As such, the present disclosure generally relates to methods for
measuring dust and
lint particles, which methods provide significant advantages to users as well
as the potential
to save millions in costs for paper product manufactures. More specifically,
the present
disclosure generally relates a method of measuring the number and/or amount of
dust and lint
particles comprised or deposited onto a paper, textile or cloth sample,
optionally during
manufacturing, production or use, wherein said method comprises: i. contacting
one or more
11
CA 03183166 2022- 12- 16
WO 2022/006287
PCT/US2021/039916
paper, textile or cloth samples with a non-adhesive textile or cloth
substrate, optionally a felt
pad; ii. applying friction and/or pressure to the one or more paper, textile
or cloth samples
which are in contact with the non-adhesive textile or cloth substrate such
that dust and lint
particles are transferred onto the non-adhesive textile or cloth substrate;
iii. measuring the
number of dust and lint particles on the non-adhesive textile or cloth
substrate, which number
represents or is correlated to the number and/or amount of dust and lint
particles which are
comprised or deposited onto the paper, textile or cloth sample during
manufacturing,
production or use; and iv. optionally cleaning the non-adhesive textile or
cloth substrate prior
to repeating steps i.-iii. The present methods provide many advantages over
existing
technologies, such as, for example, portability, low cost, manual operation,
ability to test
virtually any paper product, and the ability for advanced root cause analysis
of the linting
issue through the correlation between sheet structure properties (e.g.
pinholes, free fiber ends,
crepe bars, surface roughness) and dust/lint particle count of a tested
sample. Moreover, the
present methods allow for dust/lint particles to be separated into different
categories during
analysis, as discussed further infra.
[0063] In some embodiments, the number and/or of amount of dust and lint
particles
transferred onto the non-adhesive textile or cloth substrate, optionally a
felt pad, may
represent or may be correlated to the number and/or of amount of dust and lint
particles
deposited onto the paper, textile or cloth sample during manufacture,
production or use of
said paper, textile or cloth sample. In some embodiments, the number and/or of
amount of
dust and lint particles transferred onto the non-adhesive textile or cloth
substrate, optionally a
felt pad, may represent or may be correlated to the number and/or of amount of
dust and lint
particles deposited onto the paper, textile or cloth sample during use of the
paper, textile or
cloth sample, such as use by the end-user. In some embodiments, the method may
be
performed at least in part or entirely manually. In some embodiments, the
method may be
performed at least in part or entirely automatically. In some embodiments,
said method may
be performed in-line with a paper, textile, or cloth manufacturing process. In
some
embodiments, said textile or cloth substrate may comprise a felt pad,
optionally a black felt
pad.
[0064] In some embodiments, applying friction may arise when a sample, e.g.,
textile or cloth
or paper sample, may be moved to a direction parallel to the non-adhesive
cloth or textile
substrate while pressure is applied, in some instances in the form of a
weighted surface.
[0065] In some embodiments, the friction and/or pressure may be applied
mechanically,
optionally while measuring the amount of dust and/or lint particles produced
by a paper or
12
CA 03183166 2022- 12- 16
WO 2022/006287
PCT/US2021/039916
cloth sample during a paper or cloth making process. In some embodiments, said
textile or
cloth substrate may be black or optionally another dark color, optionally
brown, red, purple,
orange, blue or green. In some embodiments, one or more weighted surfaces may
be used to
apply friction and/or pressure to the one or more paper or cloth samples,
wherein said weight
surfaces comprise one or more felt pads. In some embodiments, the textile or
cloth substrate
may be any size and/or shape. In some embodiments, the amount of pressure
applied may be
any amount of pressure. In some embodiments, the amount of pressure applied
may be 1 Pa
or less, 1 Pa or more, 5 Pa or more, 10 Pa or more, 15 Pa or more, 20 Pa or
more, 25 Pa or
more, 30 Pa or more, 35 Pa or more, 40 Pa or more, 45 Pa or more, 50 Pa or
more, 60 Pa or
more, 70 Pa or more, 80 Pa or more, 90 Pa or more, 100 Pa or more, 125 Pa or
more, 150 Pa
or more, 159 Pa or more, 175 Pa or more, or 200 Pa or more.
[0066] In some embodiments, the method comprises performing the following
steps in part
or entirely manually:
(i) providing a first felt pad, wherein the first felt pad optionally
comprises an
adhesive bottom;
(ii) optionally marking the first felt pad one or more times to provide one
or more
visually discernible markings;
(iii) providing a binder clip;
(iv) providing a paper or cloth sample;
(v) securing the first felt pad to a surface;
(vi) placing the binder clip on the paper or cloth sample;
(vii) placing the paper or cloth sample on the first felt pad;
(viii) placing one or more weighted surfaces, optionally in the form of a
second felt pad,
the top of the paper or cloth sample;
(ix) pulling the paper or cloth sample through the first pad and weighted
surface;
(x) removing the weighted surface;
(xi) measuring the number of dust and lint particles on the felt pad, and
(xii) optionally cleaning the first felt pad prior to repeating steps (i) to
(xi).
[0067] In some embodiments, the textile or cloth substrate and/or the first
and/or second felt
pad is black or optionally another dark color, optionally brown, red, purple,
orange, blue or
green. In some embodiments, the adhesive bottom of the first pad may be used
to secure the
first pad to a surface. In some embodiments, paperboard or corkboard and
pushpins may
additionally be provided. In such instances, the first felt pad may be placed
on the paperboard
or corkboard surface, and pushpins may be inserted into the corkboard or
paperboard such
13
CA 03183166 2022- 12- 16
WO 2022/006287
PCT/US2021/039916
that the bottom of each of the felt pad contacts the pushpins. In some
embodiments, the first
pad may be secured to the surface manually.
[0068] In some embodiments, the textile or cloth substrate and/or the first
and/or second felt
pad and/or weighted surface may be any size or shape. In some instances, the
textile or cloth
substrate and/or the first and/or second felt pad and/or weighted surface may
be rectangular in
shape. In some instances, the textile or cloth substrate and/or the first and
second felt pads
may both be rectangular in shape. In some of these instances, when the second
felt pad is
placed on top of the sample, the second felt pad may be oriented parallel to
the first felt pad.
In some of these instances, when the second felt pad is placed on top of the
sample, the
second felt pad may be oriented perpendicular to the first felt pad. In some
instances, the
textile or cloth substrate may comprise a felt pad, optionally a black felt
pad, such as, for
example, one manufactured by 3M (8" x 6" x 1/5"). In some embodiments, the
surface of the
weighted surface that contacts the sample may be smooth. For example, in
instances where
the weight surface may comprise a second felt pad, the smooth side of the felt
pad may
contact the sample rather than the felt side of the pad.
[0069] In some embodiments, the amount of pressure placed on a paper or cloth
sample, such
as in the form of the one or more weighted surfaces placed upon a sample, may
be an amount
of pressure suitable for a given sample type. For example, in some instances
when testing
relatively weak/delicate samples, such as bath or facial tissue, a relatively
lower pressure may
be desired to be applied as opposed to the pressure used when testing
relatively stronger
samples, such as, for example, boarding, printing, or wipes.
[0070] In some embodiments, the one or more weighted surfaces may comprise one
or more
additional felt pads. In some instances, each pad may weigh approximately 35
g.
[0071] In some instances, the pressure applied may be as exemplified in TABLE
1:
TABLE 1
Cloth Cloth Cloth Top/Weighted
Pressure
Pressure
Substrate Substrate Substrate Surface Mass
(Pa) (milli
psi)
Length (m) Width (m) Area (m2) (g)
0.203 0.152 0.031 35 11.1
1.6
0.203 0.152 0.031 70 22.3
3.2
0.203 0.152 0.031 100 31.8
4.6
0.203 0.152 0.031 200 63.6
9.2
0.203 0.152 0.031 300 95.4
13.8
14
CA 03183166 2022- 12- 16
WO 2022/006287
PCT/US2021/039916
0.203 0.152 0.031 400 127.2 18.4
0.203 0.152 0.031 500 159.0 23.1
[0072] In some instances, the method may be performed in-line during a paper
or cloth
making process. For example, components for measuring dust and lint, such as,
for example,
an imaging system such as one comprising a KemViewTM Gen II SSA camera and/or
a textile
or cloth substrate, such as a felt pad, may be placed in-line after the diyer
and before the
tumup reel. In some instances, when placed in-line, dust and lint may be
collected on the
textile or cloth substrate by the textile or cloth substrate contacting a
sheet surface, where the
contacting can be at a desired pressure and for a desired length of time. In
some instances, the
dust and lint particles may be measured using an imaging system such as one
comprising a
KemViewTM Gen II SSA software for analysis, and the types of particles
identified. In some
instances, after the first measurement, the textile or cloth substrate can be
removed and
another new substrate used in its place, or, in other instances, a brush
and/or air blower can be
placed in-line and used to remove dust and lint particles from the felt pad.
In some instances,
the textile or cloth substrate may be attached to a mechanical support adjust
which may be
used to position the textile or cloth substrate and/or apply varying amounts
of pressure. In
some instances, the camera may be attached to a mechanical support adjust to
position the
camera during the run.
[0073] In some instances, the textile or cloth substrate and/or the first felt
pad may be marked
one or more times with one or more visually discernible markings, such as
marked with a
white marker, for example. The markings may be at different distances, such
that the
distances may be used as reference points when making dust and lint particle
measurements,
such as during image acquisition, e.g., reference points for alignment of the
camera prior to
image acquisition. In some instances, the first felt pad may be marked 1 or
more times, 2 or
more times, 3 or more times, 4 or more times, 5 or more times, 6 or more
times, 7 or more
times, 8 or more times, 9 or more times, 10 or more times, 20 or more times,
30 or more
times, 40 or more times, 50 or more times, or 100 or more times.
[0074] In some instances, the method may comprise making one or more baseline
measurements, wherein said baseline measurements may comprise measuring the
amount
and/or number of dust and lint particles on the textile or cloth substrate
prior to a test run. For
example, in some instances, a first (bottom) textile or cloth substrate e.g.,
a felt pad may be
subjected to dust and lint particle measurement prior to sample analysis such
that any
CA 03183166 2022- 12- 16
WO 2022/006287
PCT/US2021/039916
background dust and lint particles may be accounted for in test sample
analysis. In some
instances, a baseline measurement may be performed by acquiring one or more
images and
analyzing the images for dust and lint particles, such as by using an imaging
system such as
one comprising a KemViewTM Generation II SSA camera and software. In some
instances,
more than one image may be acquired and subjected to analysis, and the
dust/lint particle
count used as the baseline amount may be an average of the amounts of the more
than one
images. In some embodiments, baseline measurements and dust and lint
measurements may
be taken at corresponding locations on the textile or cloth substrate.
[0075] In some embodiments, more than one weighted surface, e.g., felt pad,
may be placed
on top of the sample prior to apply friction/pressure. For instance, two or
more, three or more,
four or more, or five or more weighted surfaces, e.g., felt pads, may be
placed on top of the
sample. In some instances, any type of object may be placed on top of the
sample so as to
provide more weight. In some embodiments, the amount of weight placed on the
sample, e.g.,
in the form of two or more top pads, may be from about 10 g to about 100 g, in
some
instances from about 35 g to about 500 g. In some embodiments, the amount of
weight used
during the method may be an amount of weight that is dependent on the
substrate, i.e., some
substrates may require more or less weight than a different type of substrate
to produce
desired results.
[0076] In some embodiments, the weighted surface, e.g., second felt pad, may
be held in
place manually while the sample is pulled through the first pad and the
weighted surface. In
some instances, as discussed supra, pushpins may be used to hold the weighed
surface in
place while the sample is pulled through the first felt pad and the weighted
surface.
[0077] In some instances, the binder clip may not maintain contact with the
surface while the
sample is pulled through the first felt pad and the weight surface. In some
instances, the
binder clip may contact the surface while the sample is pulled through the
first felt pad and
the weighted surface. In some instances, the binder clip may contact the
surface during the
entirety of the sample being pulled through the first felt pad and the
weighted surface.
[0078] In some instances, measuring the number of dust and lint particles on
the surface of
the one or more paper, cloth, or textile samples may comprise at least in part
acquiring one or
more images and analyzing the images for dust and lint particles, such as by
using an imaging
system such as one comprising a KemViewTM Generation II SSA camera and
software and/or
an arrangement or method as described in U.S. Patent No. 9,816,977 and/or U.S.
Patent No.
9,721,377, which are hereby incorporated by reference in their entirety. For
example, in the
aforementioned U.S. Patents, reflectance-based measurements and analysis are
discussed, and
16
CA 03183166 2022- 12- 16
WO 2022/006287
PCT/US2021/039916
these types of reflectance-based measurements may be used with the methods of
the present
disclosure. In some embodiments, the device and/or method used for detecting
the dust
and/or lint may comprise at least in part use of a device as pictured Figure
2, i.e., a sheet
structure analyzer unit, referred to as the KemViewTM Generation II Sheet
Structure Analyzer
("SSA-) portable unit. Such devices may be used to measure and/or perform 3-D
analysis
related to such sheet properties as: crepe bar frequency and count; crepe bar
width and length;
intensity / distribution of creping; embossing pattern; sheet roughness;
pinholes; and free
fiber ends (FFE). In some instances, more than one image may be acquired and
subjected to
analysis, and the dust/lint particle count for a given sample may be an
average of the dust/lint
particle count from the more than one images, while accounting for any
background amount
of dust/lint particles. For example, analysis of the number or amount of
dust/lint particles
may be performed according to the formula as follows: Dust & Lint Particle
Count (D&L) = [
(D&L A1- Baseline Ai) + (D&L A2 - Baseline Az)... + (D&L AN ¨ Baseline AN) I /
AN (Al,
A2... AN represent each of any number of measurement points during a test run
or baseline
measurement, optionally, N may be 2 or more, further optionally 3 or more. In
some
embodiments, 2 or more, 3 or more, 4 or more, 5 or more, 6 or more, 7 or more,
8 or more, 9
or more, or 10 or more, 25 or more, 50 or more, or 100 or more measurement
points may be
used for collecting data during a single test run or baseline measurement. In
some
embodiments, the measured number or amount of dust and lint particles may be
used to
indirectly determine the average number of dust and lint particles comprised
on a specific
surface area of the at least one paper or cloth sample.
[0079] In some embodiments, measuring the number of dust and lint particles on
the non-
adhesive textile or cloth substrate may comprise at least in part image
acquisition and
analysis. In some embodiments, one or more reflectance images of the surface
of the non-
adhesive textile or cloth substrate may be taken using an optical device
equipped with a
machine vision camera and microscopic macro-lens. In some embodiments, during
image
acquisition, the surface may be illuminated with one or more LED lights, in
some instances 8
white LED lights. In some embodiments, dust and lint particles of any size
and/or color
and/or shape may be identified. In some embodiments, the vertical angle
between the LED
and the surface may be about 25 degrees or less, 25 degrees or more, 30
degrees or more, 35
degrees or more, 40 degrees or more, 45 degrees or more, 50 degrees or more,
55 degrees or
more, or 60 degrees or more. In some embodiments, the LEDs may be evenly
spaced around
the target measurement area, optionally in some instances a 45 degree
horizontal angle
between the LEDs.
17
CA 03183166 2022- 12- 16
WO 2022/006287
PCT/US2021/039916
[0080] In some embodiments, image analysis software may be used to analyze
collected
reflectance images. In some embodiments, image analysis software may be used
to remove
false objects from the reflectance images, such as, for example, scratches on
the surface. In
some embodiments, collected reflectance images may be transformed to a
greyscale image,
which in some instances may be binarized (converted to black and white image)
by using a
desired threshold value. In some embodiments, image analysis software may be
used to
process images by using morphological operations to smoothen the objects and
remove false
dust/lint particles, such as, for example, a small dust particle inside of
larger dust particles. In
some embodiments, image analysis software may be used in part to analyze the
size and/or
shape of the dust and lint particles (and other objects in the field of view),
and in some
instances the size and the shape, may be used in part to classify particles
into a desired class,
such as fiber, fine, or starch, based on these properties.
[0081] In some instances, measuring dust and lint particles may comprise
analyzing each
particle to assign a particle type, as may be performed using an imaging
system such as one
comprising a KemViewTM Generation II SSA camera and software. In some
instances,
assigning a particle type may further comprise color coding each particle type
in an image
taken during dust/lint measurement. Such particle types may include fibers,
fines, starch,
and/or ash. In some instances, if desired, starch and ash may be further sub-
segmented by
spraying the surface with iodine causing starch particle to turn dark blue and
can then be
identified and measured.
[0082] In some instances, the textile or cloth substrate may be cleaned prior
to using for one
or more additional test runs. In some instances, cleaning may occur with a
toothbrush and/or
brush and/or small brush and/or a vacuum. In some embodiments, a method as
described
herein may be repeated one or more times with one or more different paper or
cloth or textile
samples, optionally of the same size and/or shape as the first paper or cloth
or textile sample.
In some instances, the textile or cloth substrate may be cleaned using a
blower, such as one
that may be placed in-line during a paper or cloth making process.
[0083] In some embodiments, the sample may comprise a length such that that
sample length
is at least greater than the length of the textile or cloth substrate. In some
embodiments, the
sample size may be any size and/or the sample shape may be any shape,
optionally a square,
rectangle, or circle. In some embodiments, the sample size may be about 5 cm
or less, 5 cm
or more, 6 cm or more, 7 cm or more, 8 cm or more, or about 10 cm or more in
width and/or
about 1 cm or less, about 1 cm or more, about 2 cm or more, about 5 cm or
more, about 10
cm or more, about 15 cm or more, about 20 cm or more, about 30 cm or more, or
about 33
18
CA 03183166 2022- 12- 16
WO 2022/006287
PCT/US2021/039916
cm or more in any dimension, e.g., length, e.g., width, e.g., diameter, e.g.,
radius. In some
embodiments, the width of the sample may be equal to or less than then width
of the textile or
cloth substrate.
[0084] In some embodiments, the sample may comprise a paper product. In some
embodiments, the sample may comprise a paper product and/or board based
product and/or
fiber-based product. Such products include but are not limited to, for
example, fiber-based
products, e.g., handsheets, board-based products, bath tissue, facial tissue,
base sheet, parent
roll, converted product, converted finished sheet, beverage carriers,
toweling, milk and juice
cartons, food trays, paper bags, liner board for corrugated containers,
packaging board grade,
and tissue and towel grade, paper materials, paper towels, diapers, sanitary
napkins, training
pants, pantiliners, incontinence briefs, tampons, pee pads, litter box liners,
coffee filters, air
filters, dryer pads, floor cleaning pads, absorbent facial tissue, absorbent
bathroom tissue,
napkins, wrapping paper, and other paperboard products such as cartons and bag
paper. In
some embodiments, the sample may comprise uncreped and/or creped paper. In
some
embodiments, the method may measure dust and/or lint from fine paper and/or
board linting
and/or premium bath, facial, and towel linting and dusting. In some
embodiments, the sample
may comprise converted sheets and/or commercial paper products.
[0085] In some instances, the sample may comprise bath tissue and/or facial
tissue. In some
instances, either sample side may be tested, such as, for instance, Yankee vs.
wire, outside
roll vs. inside roll, embossed vs. smooth. In some instances, the sample may
be pulled
through in any direction, e.g., the machine direction, e.g., the cross
direction. In some
embodiments, the method may comprise testing of a coated paper sample. In some
embodiments, the method may comprise testing of a paper-based product on which
printed
type and/or images may be placed.
[0086] In some embodiments, the sample may comprise one or more cloth samples.
Cloth
samples may include, but are not limited to, cloths comprising one or more
fabrics
comprising acetate, ANTRON, bamboo, Risso, blend, boiled wool, boucle, carbon-
infused,
charmeuse, chenille, chiffon, chino, chintz, combed cotton, Coolmax ,
corduroy, cotton,
cotton lisle, damask, double knit, ecosil polyester, Egyptian cotton,
elastane, eyelet, faille,
fiberfill, French terry, gaberdine, hydrophilic fabric, hydrophobic fabric,
interlock knit,
Italian nylon, jacquard, jacquard knit, jersey, knit, lace, lame, latex,
linen, lining, Lycra ,
lyocell, memory foam, mercerized cotton, merino wool, mesh, micro modal,
microfiber,
microfleece, modal, neoprene, nylon, olefin, panne, Peruvian pima cotton, pima
cotton,
pique, polvamide, polyester, powernet, rayon, rib knit, a sanforized cloth or
textile, satin,
19
CA 03183166 2022- 12- 16
WO 2022/006287
PCT/US2021/039916
silicone, silk, soy, spandex, spannette, supplex nylon, tactel, Tencel,
themastat, tricot, velour,
velvet, vicose, vinyl, wool, woven, x-static silver fiber and combinations of
any of the
foregoing.
[00871 In some embodiments, the sample may comprise one or more textile
samples. Textile
samples may include, but are not limited to, samples comprising cotton, silk,
denim, flannel,
hemp, leather, linen, velvet, and wool; the major types of synthetic textiles
include nylon,
polyester, acetate, acrylic, polar fleece, rayon and/or spandex and/or blends
thereof In some
embodiments, the sample may comprise one or more cloth or textile samples
comprised of
natural and/or synthetic materials or fibers, e.g., acetate, ANTRON, bamboo,
Bisso, blend,
boiled wool, boucle, carbon-infused, charmeuse, chenille, chiffon, chino,
chintz, combed
cotton, Coolmaxg, corduroy, cotton, cotton lisle, damask, double knit, ecosil
polyester,
Egyptian cotton, elastane, eyelet, faille, fiberfill, French terry, gaberdine,
hydrophilic fabric,
hydrophobic fabric, interlock knit, Italian nylon, jacquard, jacquard knit,
jersey, knit, lace,
lame, latex, linen, lining, Lycra , lyocell, memory foam, mercerized cotton,
merino wool,
mesh, micro modal, microfiber, microfleece, modal, neoprene, nylon, olefin,
panne, Peruvian
pima cotton, pima cotton, pique, polyamide, polyester. powernet, rayon, rib
knit, a sanforized
cloth or textile, satin, silicone, silk, soy, spandex, spannette, supplex
nylon, tactel, Tencel,
themastat, tricot, velour, velvet, vicose, vinyl, wool, woven, x-static silver
fiber and
combinations of any of the foregoing. In some embodiments, the sample may
comprise one
or more textile samples, optionally carpet or geotextile sample, comprised of
natural and/or
synthetic fibers.
[0088] In some instances, the sample is pulled between the cloth or textile
substrate, e.g., first
felt pad, and weighted surface manually. In some instances, the sample is
pulled between the
cloth or textile substrate, e.g., first felt pad, and weighted surface in an
automated and/or
mechanical manner.
[0089] In some embodiments, following dust and lint measurement, the dust and
lint
measurements may be combined and/or analyzed with other data for understanding
of cause
and effect relationships during paper or textile or cloth product production
and/or use. For
example, some common causes of dusting and linting in tissue comprise too high
of a free
fiber end (FFE) count, too high of a crepe bar count, and blade wear that may
lead the sheet
to pick and develop pinholes. Such conditions can be measured, for instance,
by an imaging
system such as one comprising the KemViewTM Generation II SSA system, which
may also
be used with the methods described herein. Some possible causes that increase
the tendency
for dust and lint accumulation (sheet dusting and sheet linting) which may be
identified with
CA 03183166 2022- 12- 16
WO 2022/006287
PCT/US2021/039916
the aforementioned combined data analysis include, but are not limited to,
electrostatic
charge on the sheet; pinholes formed from creping or deposits; too high and/or
too many
unbound free fiber ends; no or low cationic polymers in sheet tissue; doctor
blade wear which
may cause picking, pinholes in the sheet; low sheet moisture creping: higher
usage of
eucalyptus fibers; too low ratio of release / adhesive ratio; too many crepe
bars per unit of
measure; too low sheet dry tensile strength, and the treatments associated
with such problems
that may be used include, but are not limited to, strength additive with less
refining; wet end
or sheet spray softener; anti-stat; cationic functional promoters; crepe
control package.
[0090] In some embodiments, the methods described herein may be used for
analysis of any
type of paper product, paper-containing product, product resulting from a
paper-making
process, and/or analysis of components or process used during paper
production. For
example, such applications include evaluation of new products in a creping
program;
evaluation of blades of different bevels; blade wear effect on sheet
production; effect of dry
strength resins and softener applications; comparison of sheets creped at
different sheet
moistures; measurement of sheet structure profile in cross machine direction;
degradation of
crepe at the felt seam mark; effect of basis weight reduction; replacement of
virgin fiber with
recycled fiber; comparison of mechanical and chemical fibers; comparison of
bleached vs
unbleached fibers; and/or comparison of different wood and non-wood fiber
species.
[0091] In some embodiments, the method of dust and lint measurements described
herein
may not comprise submersion of any of the components in water or other aqueous
media.
[0092] In instances of methods of dust and lint measurement which may comprise
use of an
imaging system such as one comprising the KemViewTM Generation II SSA system,
i.e.,
camera and/or software, sometimes referred to as KemViewTM device, KemViewTM
camera,
KemView'm SSA, and the like, and/or a similar reflectance-based measuring
system, such
methods may proceed at least in part as generally described as follows and as
described in as
described in U.S. Patent No. 9,816,977 and/or U.S. Patent No. 9,721,377,
incorporated by
reference in their entireiy. Imaging systems for use at least in part with the
methods described
herein are further described infra.
[0093] In some embodiments, methods of measuring dust and lint may comprise
using
images captured with an imaging system. In some embodiments, a the surface of
the non-
adhesive cloth substrate can be exposed to one or more light sources that are
directed at the
surface from two or more different directions relative to the material. An
imaging system can
be used to capture two or more images of the surface, each captured while it
is illuminated by
one of the light sources. In each image, the light generates highlights and
shadows which help
21
CA 03183166 2022- 12- 16
WO 2022/006287
PCT/US2021/039916
to define the topography of the surface. Data from the images can be
transformed (e.g., to a
two dimensional spectrum (e.g., Welch spectrum)), smoothed, and analyzed, to
provide a data
set that can be used to characterize the dust and lint particles. For example,
the type of dust
and lint particles may be classified based on particle subtype, as discussed
herein..
[0094] Referring to Figure 25, in an exemplary embodiment, an imaging system
200 can
include a camera system 210 and a lighting system 220. The imaging system 200
may be
configured to capture one or more images of the surface of the non-adhesive
textile or cloth
substrate, which extends, generally, in a first direction 234 and a second
direction 236, and
has a first surface 232 having a three-dimensional configuration. The camera
system 210 may
include a camera 212 that may be mounted in a relatively fixed configuration
relative to the
surface 232 of the non-adhesive textile or cloth substrate 230. The camera 212
may be,
directed at the surface 232, so that it may obtain one or more images as the
lighting system
220 illuminates the non-adhesive textile or cloth substrate. In some
embodiments, the camera
212 may be a digital camera. In some embodiments, the camera 212 may be
disposed from
about 10 to about 50 cm from the material. In some embodiments, the viewing
window and
angle of the camera 212 may be constant, unchanged between successive images.
In some
embodiments, the image captured by the camera may have a rectangular shape. In
some
embodiments, the image may comprise a plurality of pixels, such as an array of
pixels.
[0095] In some embodiments, the lighting system 220 may include one or more
light sources
222. Each light source 222 may be oriented to illuminate the surface 232 of
the non-adhesive
textile or cloth substrate from a different direction. For example, the
orientation of each light
source 222 may be defined, at least in part, by a first angular orientation
relative to the first
234 and second 236 direction of the non-adhesive textile or cloth substrate,
and a second (tilt
or slant) angular orientation 242, relative to the surface 232. In some
embodiments, the first
angular orientation and the second angular orientation 242 of each of the
light sources 222
may be any angle to provide a necessary or desired illumination effect on the
non-adhesive
textile or cloth substrate. For example, in some embodiments, the first
angular orientation of
a light source 222 may be from 0 degrees to about 180 degrees from the first
direction 234 of
the non-adhesive textile or cloth substrate. In some embodiments, the first
angular orientation
of a light source 222 may be from about 0 degrees to about 180 degrees from
the second
direction 236 of the non-adhesive textile or cloth substrate. In some
embodiments, the second
angular orientation 242 of a light source 222 may be from about 15 to about 85
degrees
relative to the first surface 232 of the non-adhesive textile or cloth
substrate. In some
embodiments, the lighting system 220 can include two, three, four, or more
light sources 222,
22
CA 03183166 2022- 12- 16
WO 2022/006287
PCT/US2021/039916
each having a different orientation. In some embodiments, a single light
source 222 may be
used and can be moved to various positions to illuminate the first surface 232
of the non-
adhesive textile or cloth substrate from different orientations. In some
embodiments, at least
two lights 222 are provided, each light 222 being directed at a first surface
232 of the non-
adhesive textile or cloth substrate, each light 222 disposed on opposite sides
of the non-
adhesive textile or cloth substrate and directed at the non-adhesive textile
or cloth substrate
230 at an angle (e.g., a slant angle of about 15 to 85 degrees or higher
relative to the surface
232 non-adhesive textile or cloth substrate 230). In some embodiments, a first
light 222 can
be positioned at approximately 45 degrees to the first direction 234 of the
non-adhesive
textile or cloth substrate 230, and a second light can be positioned
substantially orthogonal to
the first light. In some embodiments, the lighting system 220 can include a
lighting system
220 that can adjust (e.g., turn on and off, as well as adjust the intensity)
the light sources 222
at certain times. In some embodiments, the one or more light sources 222 can
be about 10 to
50 cm from the first surface 232 of the non-adhesive textile or cloth
substrate 230. In some
embodiments, the one or more light sources 222 can be any suitable source of
illumination,
including, for example, light emitting diodes (LEDS), for example, white LEDS.
In an
exemplary embodiment, the lighting system 220 comprises four LEDs, which are
located at
four comers of a tissue sample.
[0096] In some embodiments, a computing device (e.g., FIG. 26) can be in
communication
with the imaging system 200. For example, the computing device 10 may control
various
aspects of the lighting system 220 and/or various aspects of the camera system
210. For
example, the computing device 10 may control the timing of when the light
sources 222 are
illuminated and/or when the camera system 210 captures digital images. In some
embodiments, the computing device 10 may be configured to receive information
from the
lighting system 220. In some embodiments, the computing device 10 may be
configured to
receive information from the camera system 210.
[0097] In some embodiments, a method for measuring dust and lint may comprise
directing
light onto a surface of a non-adhesive textile or cloth substrate from two or
more directions.
As the surface of the non-adhesive textile or cloth substrate is illuminated
by the light from a
particular direction, an imaging system captures an image of the surface. In
some
embodiments, the imaging system is configured so that that it captures
successive images of
an identical portion of the surface of the surface (and from the same
direction), while it is
illuminated from different lighting perspectives. Each of the different
lighting perspectives
generates highlights and shadows on different areas of the surface, depending
on the
23
CA 03183166 2022- 12- 16
WO 2022/006287
PCT/US2021/039916
orientation of the light source. The measured light intensity for two or more
images (each
illuminated from a different direction) of the same portion of the surface may
provide
information regarding dust and lint particles, e.g., amount, e.g., type. Using
the information
captured in the image, each pixel or group of pixels may be assigned one or
more data values,
including, for example, a gray scale value, a surface normal vector, and/or a
gradient value.
This data can provide sufficient information to determine, for example, the
amount and/or
types of dust and lint particles present on the surface. For example, the
reflected light
captured in two or more overlayed pixels can be used to approximate a surface
normal vector
for any portion of the surface corresponding to that pixel. The term "surface
normal" refers to
a vector that is perpendicular to the tangent plane of the first surface of
the surface at a
particular surface location. Using the surface normal vectors, one can
characterize the
topography in the surface. For example, the image or series of successive
images
corresponding to a material, can be converted to an array (or arrays) of
pixels. Each pixel can
be assigned a surface normal vector. The array of surface normal vectors can
help to
characterize contours of the surface, e.g., the locations of dust and lint
particles on the
surface, types of dust and lint particles, etc..
[0098] In some embodiments, the surface normal vectors can be converted or
correlated to
gradient image data. For example, in some embodiments, the gradient image data
of each
pixel measures the change in value of the surface normal vectors of that
location in the
original image when comparing in a given direction. In some embodiments, the
surface
normal vector includes x component (MD), y component (CD), and z component.
The MD
gradient image can be computed by dividing the x (MD) component by z component
for each
pixel.
[0099] In some embodiments, the gradient image data can be analyzed to
characterize surface
comprising the dust and lint particles. In some embodiments, a two dimensional
Fourier
transform can be computed from the gradient image data. In some embodiments,
the two-
dimensional Fourier transform can convert the spatial gradient image data into
frequency
space. The Fourier transform for f(x) is denoted as F(k) and it describes the
amplitude and
phase for each frequency and orientation of two dimensional sinusoidal wave so
that when
summed they produce f(x). In other words, the transformation assigns a series
of sine waves
to the gradient image data such that the sum of the amplitudes of the sine
waves corresponds
to the grey scale values of the individual pixels in the original gradient
image.
[0100] A two dimensional Fourier spectrum can show the variance and
orientation of each
frequency from the image. In some instances, a power spectrum, which is
reliable for the
24
CA 03183166 2022- 12- 16
WO 2022/006287
PCT/US2021/039916
wavelength of periodic waves found from the image, can be selected to further
analyze the
Fourier spectrum.
[0101] In some embodiments, a two dimensional power spectrum can be computed
from the
two dimensional Fourier transform. In some embodiments, the two dimensional
power
spectrum can be computed by calculating the sum of the squared amplitudes of
the sine
waves functions, where the value of the amplitudes represents the "power".
[0102] Practically speaking the dust and lint particles do not necessarily
have a uniform
structure (e.g., orientation, wavelength, etc.). These phenomena may decrease
the accuracy of
wavelength estimation from the power spectrum, where the high variance marking
spots
widens in kMD and kCD directions. Regular marking spots may produce higher
intensity
spots in the power spectrum. The term "marking spots" refers to areas where
the difference
between the original and smoothed pixel values are at a maximum.
[0103] Dust and lint particles do not necessarily form perfectly sinusoidal
waves on the non-
adhesive textile or cloth surface so regular marking spot patterns are not
formed.
[0104] In some embodiments, the two dimensional power spectrum can be smoothed
to
produce a smoothed two dimensional power spectrum.
[0105] In some embodiments, the smoothing can be accomplished by obtaining a
two
dimensional filtered power spectrum (e.g., two dimensional median filtered
power spectrum).
Two dimensional filtering includes replacing each point with a value (e.g., a
median value) of
the values of the points that are adjacent on a two dimensional plane. In some
embodiments,
the filter can be a non-linear smoothing method, in which the current point is
replaced in the
image by the median of the values in its neighborhood. Then a ratio of an
initial power
spectrum to the filtered power spectrum is determined for each point in the
spectrum. As a
result, the intensity of the noise is higher than the other variations in the
spectrum. The
marking spots can be identified using a threshold level that peaks should not
exceed. In some
embodiments, the threshold level can be based on the material used, the
dimensions of the
particles, and the like. The exact locations of spectral peak corresponding to
the noise can be
estimated by fitting a second order two dimensional polynomial (e.g., or other
appropriate
fitting scheme) around the maximum value of the peak of the noise. The values
around the
marking spots can be replaced with a value determined from the values of power
spectrum in
its neighborhood (e.g., determined by the mean, median or mode). In some
embodiments, the
term "neighborhood" refers to one or more points adjacent a given point. Thus,
the power
spectrum can be smoothed to remove noise such as that from marking spots.
CA 03183166 2022- 12- 16
WO 2022/006287
PCT/US2021/039916
[0106] In some embodiments, the power spectrum can be computed and smoothed
with the
Welch method (although other methods could be used), which decreases the
effect of
measurement noise by calculating the spectrum as an average over several,
possibly
overlapping samples. In some embodiments, each Fourier transform can be
windowed with a
Welch window before the computation of the Welch spectrum, where windowing
decreases
the spectral side lobes caused by the finite-sample Fourier transform.
[0107] In some embodiments, once the power spectrum is smoothed, a one
dimensional
probability distribution can be estimated by transforming the smoothed two
dimensional
power spectrum to a polar coordinate system to form a polar coordinate system
smoothed
power spectrum. In a polar coordinate system, the elements (x, y) are
represented as pairs of
angle e and distance k from the origin. The transformation can be performed
using the
following formula: k=(x^2+y^2)^1/2 and (1)=arctan(y/x).
[0108] In some embodiments, the amount of variance can be held constant for
the
transformation of the power spectrum to a polar coordinate system. However,
the polar
coordinates are unevenly spaced compared to the Cartesian coordinate system
and the
intensity values of the power spectrum from Cartesian coordinate system cannot
been used
directly. Thus, the intensity values in polar coordinate system are
interpolated from the
original power spectrum. Finally, the dust and lint particle frequency
distribution is computed
by summing the variances from the power spectrum between the angles of about -
45 and +45
degrees together.
[0109] Referring to Figure 26, in an embodiment, the imaging system 200 may be
in
communication with the computer device 10. In particular, the camera system
210 and the
lighting system 220 may be communication with the computer device 10.
[0110] In some embodiments, one or more aspects of the method can be
implemented using
software and/or hardware as described herein.
[0111[ With reference to Figure 26, shown is a schematic block diagram of a
computing
device 10 according to various embodiments of the present disclosure The
computing device
includes at least one processor circuit, for example, having a processor 13
and a memory
16, both of which are coupled to a local interface 19. To this end, the
computing device 10
may comprise, for example, at least one server computer or like device. The
local interface 19
may comprise, for example, a data bus with an accompanying address/control bus
or other
bus structure as can be appreciated.
[0112] Stored in the memory 16 are both data and several components that are
executable by
the processor 13. In particular, stored in the memory 16 and executable by the
processor 13
26
CA 03183166 2022- 12- 16
WO 2022/006287
PCT/US2021/039916
are a method application 15 and/or other applications. Also stored in the
memory 16 may be a
data store 12 and other data. In addition, an operating system may be stored
in the memory 16
and executable by the processor 13.
[0113] It is understood that there may be other applications that are stored
in the memory 16
and are executable by the processor 13 as can be appreciated. Where any
component
discussed herein is implemented in the form of software, any one of a number
of
programming languages may be employed such as, for example, C, C++, C#,
Objective C,
Java, JavaScript, Perl, PHP, Visual Basic, Python, Ruby, Delphi, Flash,
MATLAB, or other
programming languages.
[0114] A number of software components can be stored in the memory 16 and are
executable
by the processor 13. In this respect, the term "executable" means a program
file that is in a
form that can ultimately be run by the processor 13. Examples of executable
programs may
be, for example, a compiled program that can be translated into machine code
in a format that
can be loaded into a random access portion of the memory 16 and run by the
processor 13,
source code that may be expressed in proper format such as object code that is
capable of
being loaded into a random access portion of the memory 16 and executed by the
processor
13, or source code that may be interpreted by another executable program to
generate
instructions in a random access portion of the memory 16 to be executed by the
processor 13,
etc. An executable program may be stored in any portion or component of the
memory 16
including, for example, random access memory (RAM), read-only memory (ROM),
hard
drive, solid-state drive, USB flash drive, memory card, optical disc such as
compact disc
(CD) or digital versatile disc (DVD), floppy disk, magnetic tape, or other
memory
components.
[0115] The memory 16 is defined herein as including both volatile and
nonvolatile memory
and data storage components. Volatile components are those that do not retain
data values
upon loss of power. Nonvolatile components are those that retain data upon a
loss of power.
Thus, the memory 16 may comprise, for example, random access memory (RAM),
read-only
memory (ROM), hard disk drives, solid-state drives, USB flash drives, memory
cards
accessed via a memory card reader, floppy disks accessed via an associated
floppy disk drive,
optical discs accessed via an optical disc drive, magnetic tapes accessed via
an appropriate
tape drive, and/or other memory components, or a combination of any two or
more of these
memory components. In addition, the RAM may comprise, for example, static
random access
memory (SRAM), dynamic random access memory (DRAM), or magnetic random access
memory (MRAM) and other such devices. The ROM may comprise, for example, a
27
CA 03183166 2022- 12- 16
WO 2022/006287
PCT/US2021/039916
programmable read-only memory (PROM), an erasable programmable read-only
memory
(EPROM), an electrically erasable programmable read-only memory (EEPROM), or
other
like memory device.
[0116] Also, the processor 13 may represent multiple processors 13 and the
memory 16 may
represent multiple memories 16 that operate in parallel processing circuits,
respectively. In
such a case, the local interface 19 may be an appropriate network that
facilitates
communication between any two of the multiple processors 13, between any
processor 13
and any of the memories 16, or between any two of the memories 16, etc. The
local interface
19 may comprise additional systems designed to coordinate this communication,
including,
for example, performing load balancing. The processor 13 may be of electrical
or of some
other available construction.
[0117] Although the method application 15 and other various systems described
herein may
be embodied in software or code executed by general purpose hardware as
discussed above,
as an alternative the same may also be embodied in dedicated hardware or a
combination of
software/general purpose hardware and dedicated hardware. If embodied in
dedicated
hardware, each can be implemented as a circuit or state machine that employs
any one of or a
combination of a number of technologies. These technologies may include, but
are not
limited to, discrete logic circuits having logic gates for implementing
various logic functions
upon an application of one or more data signals, application specific
integrated circuits
having appropriate logic gates, or other components, etc. Such technologies
are generally
well known by those skilled in the art and, consequently, are not described in
detail herein.
[0118] Referring to Figure 27, in some embodiments, a method application 15
can be used
for measuring dust and lint. In general, the method application 15 corresponds
to any of the
methods of measuring dust and lint as described herein. In some embodiments, a
step 32 of
the method application 15 includes directing light at a surface of a non-
adhesive textile or
cloth substrate. The method application 15 may generate instruction
communicated to the
imaging system 200 regarding various aspects of the lighting step. For
example, the method
application 15 may provide instruction regarding intensity or timing of the
lighting, for each
of the lighting sources in the device. The method application 15 may also
include the step 34
of obtaining two or more successive images of the surface of the non-adhesive
textile or cloth
substrate. The method application 15 may generate instruction communicated to
the imaging
system 200 regarding various aspects of the imaging step. For example, the
method
application 15 may provide instruction to the imaging system 200 regarding the
timing of
capturing the images (e.g., in coordination with lighting instruction). The
method application
28
CA 03183166 2022- 12- 16
WO 2022/006287
PCT/US2021/039916
15 will also receive the two or more images captured by the imaging system
200. The method
application 15 further includes the step 36 of capturing and/or approximating
data from the
received images. For example, each image may include an array of pixels, each
providing
information about the image, e.g., a measurement of reflected light. The
method application
15 may capture that received information, and/or calculate additional data
based on the
received information. For example, the method application 15 may approximate a
surface
normal vector for a pixel based upon the reflected light data from two
successive images. The
method application 15 may assign each pixel one or more data points. The
method
application 15 further includes the step 38 of converting the data from step
36. For example,
the data from step 36 can be converted to gradient image data. The method
application 15
further includes the step 42 of analyzing the data generated in step 38, to
characterize the
surface of the non-adhesive textile or cloth substrate. For example, the
gradient image data
for the images can be analyzed to determine the amount and/or type of dust and
lint particles.
Each of these features is described herein in more detail, specifically, in
regard to the
discussion regarding measuring dust and lint particles.
[0119] Although the flowchart of Figure 27 shows a specific order of
execution, it is
understood that any number of counters, state variables, or messages might be
added to the
logical flow described herein, for purposes of enhanced utility, accounting,
performance
measurement, or providing troubleshooting aids, etc. It is understood that all
such variations
are within the scope of the present disclosure.
[0120] Also, any logic or application described herein, including the method
application 15
and/or application(s), that comprises software or code can be embodied in any
non-transitory
computer-readable medium for use by or in connection with an instruction
execution system
such as, for example, a processor 13 in a computer system or other system. In
this sense, the
logic may comprise, for example, statements including instructions and
declarations that can
be fetched from the computer-readable medium and executed by the instruction
execution
system. In the context of the present disclosure, a "computer-readable medium"
can be any
medium that can contain, store, or maintain the logic or application described
herein for use
by or in connection with the instruction execution system. The computer-
readable medium
can comprise any one of many physical media such as, for example, magnetic,
optical, or
semiconductor media. More specific examples of a suitable computer-readable
medium
would include, but are not limited to, magnetic tapes, magnetic floppy
diskettes, magnetic
hard drives, memory cards, solid-state drives, USB flash drives, or optical
discs. Also, the
computer-readable medium may be a random access memory (RAM) including, for
example,
29
CA 03183166 2022- 12- 16
WO 2022/006287
PCT/US2021/039916
static random access memory (SRAM) and dynamic random access memory (DRAM), or
magnetic random access memory (MRAM). In addition, the computer-readable
medium may
be a read-only memory (ROM), a programmable read-only memory (PROM), an
erasable
programmable read-only memory (EPROM), an electrically erasable programmable
read-
only memory (EEPROM), or other type of memory device.
[0121] In some embodiments, methods of measuring dust and lint may comprise in
part using
an imaging system as described herein. In some embodiments, measuring dust and
lint may
comprise in part illuminating the non-adhesive textile or cloth substrate,
from at least two
directions one direction at a time, with at least one light source, obtaining
for each light
source direction an original reflectance image for the substrate with an
imaging device,
estimating a surface normal for each image pixel of the original reflectance
image,
reconstructing a reconstructed reflectance image from the estimated surface
normals, and
comparing the reconstructed reflectance image and the corresponding original
reflectance
image and constructing a difference image, where the differences represent
shadow objects of
the dust and lint particles.
[0122] In some embodiments, the imaging system may comprise in part an imaging
device
such as a digital systems camera, arranged to a distance from the sample
holder, for obtaining
original reflectance images of the substrate surface, at least two light
sources, such as LED,
attached around the imaging device, or one light source, which is attached to
a supporting
arm, which is arranged to rotate around the imaging device, the at least two
light sources or
the one light source being arranged to illuminate the substrate from at least
two directions one
direction at a time, a data processing unit, which is arranged to receive
original reflectance
images obtained for each light source direction from the imaging device, to
estimate a surface
normal for each image pixel of the original reflectance image, to reconstruct
a reconstructed
reflectance image from the estimated surface normals, and to compare the
reconstructed
reflectance image and the corresponding original reflectance image and to
construct a
difference image, where the differences represent shadow objects of the dust
and lint
particles.
[0123] In some embodiments, a dust and lint particle may produce a shadow to a
certain
location of depending on the vertical and horizontal angle of illumination. In
some
embodiments the detection method utilizes a photometric stereo method in which
the
substrate is illuminated from different angles and the surface normals of each
image pixel are
estimated. Furthermore, the Lambert's law is applied inversely to reconstruct
the reflectance
image from the estimated surface normals. Finally, the difference between the
reconstructed
CA 03183166 2022- 12- 16
WO 2022/006287
PCT/US2021/039916
reflectance image and the original reflectance image is compared and the
shadows are
detected from the difference image. The method presented in this application
can be readily
implemented on-line.
[0124] In some embodiments, a plurality of reconstructed reflectance images
from the
estimated surface normals, each of the reconstructed reflectance images may be
compared,
separately, with the corresponding original reflectance image and difference
images are
constructed. After that an average value of the number of the shadow objects
in the difference
images are calculated. In reconstruction of the two difference images are
utilized the
horizontal angles of illumination (0 and 180 degrees). Use of two reflectance
images
improves the accuracy of the method by reducing the number of wrongly
calculated shadow
objects. When calculating the average value, the number of shadow objects in
the two
difference images are summed together and divided by two to get the average.
The averaging
also decreases the uncertainty because all shadow objects may not be real
shadow objects but
some other dark objects on the surface of sample.
[0125] In some embodiments, the imaging system may comprise in part an imaging
device, a
light source and a data processing unit. The imaging system may be, for
example, a process
device or a laboratory device which comprises a digital systems camera, a
number of LEDs
and a computer with a memory.
[0126] The imaging device may be any suitable high-resolution digital camera,
such as high
resolution CCD camera, for example digital system camera with 18 Mpix aps-c
sensor. For
on-line applications any suitable high-resolution, high-speed digital camera,
such as high
resolution CCD camera is preferred. The imaging device is arranged above the
substrate. The
geometric distortion and vignetting caused by the objective of the imaging
device is typically
so small that the calibration of the imaging device is not required.
[0127] The light source may be any suitable light source. A preferable light
source is LED
(light-emitting diode) because it is fast and economical light-source,
especially for industrial
on-line applications. For example, in on-line applications a number of light
sources, which
are LED flash lights, may be arranged around the imaging device, i.e. camera.
The number of
light sources may be at least four, preferably six, more preferably 12. The
light sources flash
one at the time and one original reflectance image is captured from the target
sample during
each flash with the imaging device. This means that the number of images is
the same than
the number of light sources.
[0128] In some embodiments, the light source is a white LED. The white light
includes
photon particles of all possible wavelengths. The sensor of the imaging device
comprises
31
CA 03183166 2022- 12- 16
WO 2022/006287
PCT/US2021/039916
green, blue and red pixels which are sensitive for each color, respectively.
This means that
green pixels of the sensor collect photons which wavelength correspond to
green color, blue
pixels of the sensor collect photons which wavelength corresponds to blue
color and red
pixels of the sensor collect photons which wavelength corresponds to red
color. In most of
the color digital imaging devices, such as color digital cameras, the color
pixels are arranged
to Bayer matrix shape. The sensor of the imaging device comprises group of 2X2
Bayer
matrixes. Use of white light thus enables utilization of all color pixels of
the imaging device
and of the Bayer matrix. In some embodiment it is also possible to use colored
light source,
e.g., a blue LED.
[0129] An example of a suitable imaging device is Canon 550D camera with
Sigma's macro
105 mm objective. In that case, the size of the image sensor is 5184X3456
pixels and each
color pixels from the 2X2 Bayer matrix (red, green, green and blue) is applied
in the method
because the color of LED is white. The pixel values are represented with 14
bits. The size of
the imaging area is 21X14 mm corresponding 4.1 p.mX4.1 pimpixels.
[0130] The origin of the imaging arrangement is set at the center point of the
image on the
surface of the substrate. The distance between the light source and the
origin, as well as the
distance between the imaging device and the origin of the imaging arrangement
are
preferably kept constant. The distance may be freely chosen depending on the
application and
process requirements.
[0131] An example of the arrangement is shown in Figure 28. The distance
between the light
source 1 and the origin 2 of the imaging arrangement may be, for example, 18.5
cm and the
distance between the CCD sensor 3 of the imaging device 4 and the origin 2 may
be 12 cm.
The vertical angle a between the light source 1 and the surface normal is 30
degrees. The
horizontal angle between the light source 1 and x-axis is marked with 0 in
Figure 28.
[0132] Another example of the arrangement is shown in Figure 29. The light
source 1 is
attached to a supporting arm 5, which rotates around the target sample 6. Thus
the substrate 6
located on a sample holder 7 can be illuminated from various angles. For
example, the
substrate 6 may be illuminated from 12 different horizontal angles indicating
that the
horizontal angle between the light source locations is 30 degrees (0=0, 30,
60, 90, . . . , 330).
The reflectance images are captured from each location. Figure 29 shows a
schematic
drawing from the measurement device and measurement procedure according to
some
embodiments.
[0133] In some embodiments, a first linear polarizer is arranged in front of
the imaging
device and a second linear polarizer is arranged in front of the light source,
the first and the
32
CA 03183166 2022- 12- 16
WO 2022/006287
PCT/US2021/039916
second linear polarizer being at 90 degrees angle in relation to each other,
and the orientation
between the polarizers is kept constant during the measurement. Generally, the
surfaces can
be divided roughly to specular and diffuse surfaces based on the reflection of
the substrate.
[0134] In some embodiments, the imaging system may comprise polarizers as
present in
Figure 30. The first linear polarizers is arranged in front of the imaging
device 4, and the
second linear polarizer 9 is arranged in front of the light source 1. The
polarizers 8, 9 are at
90 degrees angle in relation to each other. The polarizers 8, 9 block the
light which is
specularly reflected from the surface of the substrate 6. The arrows show the
polarization of
light.
[0135] In some embodiments, the beam pattern of the light source on the
substrate is
compensated by using a 2D second order polynomial fitted on the reflectance
image. The
shape of the beam pattern of the light source, such as LED, on the substrate
depends mainly
on the location and the beaming of the light source. The location of the light
source is known
in the arrangement according to the invention. However, the beaming includes
uncertainties
and therefore center beam of the light source, such as LED, is not necessarily
located in the
middle of the substrate. The intensity of the light reflected from the
substrate decreases in
quadratic sense when the distance from the center beam of the light source
increases. Thus
the beam pattern of the light source on the surface of substrate is
compensated by a 2D
second order polynomial fitted on the reflectance image. The 2D fitting
problem can be
defined in matrix form in the equation below:
(.1 x .8y y bodt
(1)
[0136] where x and y are the vectors containing the x and y coordinates of
each pixel in the
image. The vector i contains the intensity of the image pixels of the original
image. The
symbols from a to fare the coefficients of polynomial terms which are solved
in the least
squares sense. The polynomial is fitted to each Bayer matrix color layer
separately.
[0137] In some embodiments, the pixel intensity values are compensated by
computing the
distances between the each image pixel and the light source in order to obtain
a matrix of
pixel intensity compensation results, and multiplying the original reflectance
image pointwise
with the matrix of pixel intensity compensation results and dividing the
original reflectance
image pointwise with the 2D polynomial.
[0138] In some embodiments, the computation of surface normals with
photometric stereo is
based on the brightness variation of the target sample surface. The
photometric stereo theory
33
CA 03183166 2022- 12- 16
WO 2022/006287
PCT/US2021/039916
assumes that the light arriving to the target sample surface is collimated.
However, this is not
necessarily the case in some instances because normally the distance between
the light source
and the substrate is small and the physical size of the light source is small.
Therefore, the
orientation of the light beam arriving from the light source varies on the
target sample
surface. According to some embodiments pixel intensity values are compensated
by
computing the distances between the each original image pixel and the light
source in order
to obtain a matrix of compensation results. The z location of the light source
is divided with
the distance as expressed in the equation below:
7,:W.Or
iv.= __________________________________ ,,,,
.v
(2)
[0139] where zfight is the z location of the light. The xfight is the (x,y,z)-
vector containing the
coordinates of light source. The Xsample is the (x,y,1)-vector containing the
coordinates of the
substrate. The compensation result is called cosSigma which is the cosine of
the vectors.
After obtaining the matrix of compensation results, the original image is
multiplied pointwise
with the cosSigma-matrix, i.e., the matrix of compensation results, and
divided pointwise
with the 2D polynomial.
[0140] In photometric stereo two or more images are captured from a surface
illuminated
from different directions. Photometric stereo method estimates the surface
normals of a
Lambertian surface. The Lambertian (matt) surface is defined as one in which
the reflected
intensity is independent of the viewing direction. Lambert's law represents
the pixel intensity
i at the point (x,y) according to the following equation:
i:"DEb. t C13.1
(3)
[0141] where Rho is the surface albedo describing the reflectivity of a
surface, E is the
intensity of a light source, n is the unit normal of the surface and I is the
unit vector toward
the light source. In the measurement setup IT is:
1 ' coA(0)sirt(cal '
e = Mnfthinta)
(4)
34
CA 03183166 2022- 12- 16
WO 2022/006287
PCT/US2021/039916
[0142] where theta and alpha determine the orientation of the light source.
The I vector is
computed for each image pixel separately because the orientation of unit
vector towards the
light source depends on the location of pixel. The RhoEn can be solved from
the equation (3)
because the imaging device detects and measures the pixel intensities (i) and
the location of
light source is known (I). However, the albedo depends on spatial location so
the unit normal
of the surface is not solved. Three light source directions are enough to
determine the unit
normal and the albedo from the equation (1), but the uncertainty of the
estimate may be
decreased by increasing the number of light source directions. In some
embodiments, the
substrate is illuminated from at least 2, at least 4, at least 6, preferably
at least 8, more
preferably at least 10, even more preferably at least 12 directions. Thus the
number of light
source directions is typically at least 4, at least 6, preferably at least 8,
more preferably at
least 10, and even more preferably at least 12 directions. Based on the
foregoing, Lambert's
law can be represented in matrix form as follows:
4vw1"Pretspoz.e.O.k*1
(5)
[0143] where m is the number of light source directions, i is the intensity
vector of the pixels
for each light source direction, L is the matrix consisting of 1X3 unit
vectors toward each
light source, and n is the unit normal of the surface. The problem is over
determined for
single pixel with number of light source directions and scaled unit normal m
(scaled by the
albedo) and can be solved by minimizing the square of error with pseudoinverse
as:
pEn TLY.
(6)
[0144] The equation (6) is applied for each image pixel separately and this
results scaled unit
normal for each pixel.
[0145] The reflectance intensities of the target surface are reconstructed by
using scaled unit
normals and Lambert's law of the equation (5). The reflectance intensities are
subtracted from
the original reflectance intensities.
[0146] Shadow objects of the dust and lint particles are detected from the
difference image.
The shadow objects caused by the particles are seen as faint dark curves in
the difference
image. In some embodiments the shadow objects are detected in the difference
image by
using filtering and/or processing methods which enforce the shadow objects of
the particles.
For example, the detection of shadow objects is based on line detection over
the difference
image. The line detection method applied is called orientated means in which
the mean is
CA 03183166 2022- 12- 16
WO 2022/006287
PCT/US2021/039916
computed for each pixel location and orientation of line. Such
filtering/processing enforces
the curves and lines caused by the shadows and in a resulting image the
shadows can be seen
as dark curves.
[0147] The shadows caused by the particles can be seen as faint dark curves in
the difference
image. The detection of shadows is based on line detection in all orientations
orientated over
the image. The line detection method applied is called orientated means in
which the mean is
computed for each pixel location and orientation of line. Let I(x, y) be a
continuous function
representing the image intensities given in a two-dimensional domain. The mean
of object in
orientation theta is denoted as follows
tw;,
==::,.*..WW ykx04aWydx
(7)
[0148] where L is the length of the object and W is the width of the object.
The mean is
computed for several orientations of the object. The shadows are darker than
the rest of the
variation in paper and thus the minimum orientation value is selected for the
resulting image.
The minimum mean for several orientations can be denoted according to the
following
equation:
(8)
Where in (8) 0(x,y) is the resulting processed difference image presented.
[0149] In some embodiments the shadow objects can be detected from 0(x,y),
i.e. the
difference image, by thresholding. This comprises the steps of computing a
histogram which
shows the distribution of pixel values of the filtered/processed difference
image in which the
shadow objects are enforced, setting a threshold limit to a desired value and
obtaining a
thresholded difference image, removing circular objects from the thresholded
difference
image by using ellipse fitting algorithms, and accepting from the thresholded
difference
image shadow objects whose length is larger than an acceptance limit, and/or
objects having
eccentricity exceeding a predetermined value, and/or objects which major axis
deviates at the
most 30 degrees, 45 degrees or 90 degrees from the direction of the light
source. The
acceptance limit is, based on a desired length value. The threshold limit is
set to a desired
value, for example to 0.2%. From the threshold binary image only the objects
whose length is
36
CA 03183166 2022- 12- 16
WO 2022/006287
PCT/US2021/039916
larger than the threshold limit are accepted. Furthermore, the shape of the
accepted shadow
object should be elongated. Therefore the length of the minor and major axis
of ellipse fitted
to the each object are calculated. The ellipse fitting algorithms are based on
the 2D normal
distribution fitted to the coordinate points. The covariance matrix (sigma) of
the 2D normal
distribution can be written in terms of the standard deviations a and a and
correlation p
between the x and y coordinates of object as follows:
(9)
[0150] The eccentricity of the corresponding ellipse is given by:
,zzzn
..,=<=?.'t1
(10)
[0151] In some embodiments the objects whose major axis is at least 5 times
longer than
their minor axis, i.e. the ones which have eccentricity larger than 2 {square
root over (6)}/5
are accepted to final binary image.
[0152] In some embodiments, methods of measuring dust and lint may comprise in
part
illuminating the non-adhesive textile or cloth substrate from at least four
directions, with at
least one light source, obtaining an original reflectance image for the target
sample surface
with an illuminating device, estimating a surface normal for each image pixel
of the original
reflectance image, reconstructing a reconstructed reflectance image from the
estimated
surface normals, comparing the reconstructed reflectance image and the
original reflectance
image and constructing a difference image, where the differences represent
shadow objects of
the dust and lint particles.
[0153] In some embodiments, methods of measuring dust and lint may comprise in
part an
imaging system comprising an imaging device such as a digital systems camera,
arranged to a
distance from the substrate, for detecting original reflectance image data, at
least four light
sources, such as LED, attached around the imaging device, or one light source,
which is
attached to a supporting arm, which is arranged to rotate around the imagining
device, a data
processing unit, which is arranged to receive original reflectance image data
from the
imaging device, to estimate a surface normal for each image pixel of the
original reflectance
image, to reconstruct a reconstructed reflectance image from the estimated
surface normals,
and to compare the reconstructed reflectance image and the original
reflectance image and to
37
CA 03183166 2022- 12- 16
WO 2022/006287
PCT/US2021/039916
construct a difference image, where the differences represent shadow objects
of the dust and
lint particles.
[0154] The compositions and methods illustratively disclosed herein suitably
may be
practiced in the absence of any element which is not specifically disclosed
herein and/or any
element specifically disclosed herein.
EXAMPLES
Example 1: Exemplary Dust and Lint Test Method
[0155] In the present example, an exemplary method was used measure the amount
of dust
and lint produced by various different paper products. The exemplary method
used to
generate the data of the present example is outlined in Figure 1 and further
described infra.
[0156] The method of measuring dust and lint of the present example proceeded
as follows.
First, a black felt pad manufactured by 3M (8" x 6" x 1/5") was provided (see
Figure 1: 1).
The bottom of the felt pad had an adhesive, which was used for fixing/securing
the felt pad to
a larger surface, such as a table surface. A single black felt pad was used
for multiple test
runs and was cleaned with a toothbrush between each run when used multiple
times, as
discussed further below.
[0157] After providing and preparing the felt pad, baseline measurements were
taken using
KemViewTM Generation II sheet structure analyzer (see Figure 2). Baseline
measurements
were taken at by positioning the camera at the middle of the pad and then
taking
measurements at 10 cm, 5 cm, and 3 cm from the front of the pad (shown as
white marks in
Figure 1: 1). The baseline measurements were then averaged together to derive
an average
value which was later used for background subtraction during data analysis.
[0158] Exemplary paper products in the form of various commercial brands of
facial tissue
were tested using the present method. First, the facial tissue was folded in
half, providing
approximately 1350 cm2 of surface area, and a clamp was placed on the tissue
sample
approximately 1 cm from the edge of the sheet (see Figure 1: 2). Next, a 2"d
felt pad
manufactured by 3M x x 1/5-) was placed on top of the test sheet
in a perpendicular
orientation relative to the bottom black felt pad (see Figure 1: 3). The
smooth side of the 2"1
felt pad was in contact with the sample, rather than the felt side of the 2'
felt pad. The weight
of each black felt pad was 35 g.
38
CA 03183166 2022- 12- 16
WO 2022/006287
PCT/US2021/039916
[0159] After positioning the second black felt pad and while preventing the
top pad from
moving forward without force, the clamp and sheet were manually pulled forward
slowly (see
Figure 1: 4) for approximately 3 seconds, until the sample was removed off of
the pad. After
pulling the sample completely through to two pads, the top pad was removed
from the bottom
pad, and the KemViewTM device was placed on the bottom pad to take
measurements at 10
cm (position a), 5 cm (position b), and 3 cm (position c) from the front of
the pad (see Figure
1: 5).
[0160] When a multiple test runs were performed, the felt pad cleaned using
toothbrush to
brush and remove dust and lint particles. A new baseline measurement was then
recorded
prior to performing another test run.
[0161] The data collected from each test run on each sample along with the
background
measurements were then to measure dust and lint particle counts (it is noted
that the terms
"dust- and "lint- are used interchangeably). Measuring dust and lint particles
in part
proceeded through image acquisition and analysis, which proceeded in part as
follows. A
reflectance image of the surface was taken by an optical device equipped with
a machine
vision camera and microscopic macro-lens. During image acquisition, the
surface was
illuminated by 8 white LED lights comprised by the optical device. The color,
location, and
the orientation of the lights were optimized to make the dust and lint
particles most visible to
the camera during image acquisition. Use of white LED lights resulted in dust
particles of any
color being detected. During image acquisition the vertical angle between the
LED and the
surface was approximately 45 degrees, and the LEDs were evenly spaced around
the target
measurement area, i.e., 45 degree horizontal angle between the LEDs. Following
image
acquisition, image analysis software was used to analyze the collected
reflectance images.
Image analysis software was used in some instances to remove false objects,
such as
scratches on the surface, that might be misinterpreted as dust/lint particles.
For example, first,
the color reflectance image was transformed to a grayscale image. Afterward
the gray scale
image was binarized (converted to black and white image) by using a desired
threshold value.
This image included white objects in a black background. These objects were
then processed
with morphological operations to smoothen the objects and remove false
dust/lint particles,
such as, for example, a small dust particle inside of larger dust particle.
Finally, the size and
the shape, e.g., circularity, of the objects was estimated and the detected
objects were
classified to a desired class, such as fiber, fine, or starch, based on these
properties. Size and
shape analysis also in part used length/width measurements to help classify
the particles into
classes. It is noted that similar procedures can be used for baseline image
acquisition and
39
CA 03183166 2022- 12- 16
WO 2022/006287
PCT/US2021/039916
analysis. The aforementioned image acquisition and analysis was performed with
KenlViewTM Generation II SSA devices and software.
[0162] The results of test runs using various different facial tissue samples
are presented in
Figure 3. The dust/lint count was reported as separate fiber counts, fine
counts, and
starch/ash counts. Analysis of the amount of dust/lint particles proceeded
according to the
formula was as follows: Dust & Lint (D&L) = [ (D&L A ¨ Baseline A) + (D&L B ¨
Baseline
B) + (D&L C ¨ Baseline C) ] / 3 (A, B, and C represent each of the three
measurement points
during a test run or baseline measurement) (see Figure 3: "Diff." columns).
Referring now to
the results of Figure 3, it was observed that typically facial sheets with the
highest softness,
eucalyptus fiber ratio, lowest sheet moisture, and highest free fiber end and
crepe bar count
had the greatest tendency for developing dust/lint particles that become
dislodged from the
sheet as compared to samples generally recognized as being low softness. For
example,
compare Product 1 and Product 3, which had low to no measurable dust/lint
particles and
were generally recognized as being low softness products, to Product 2,
Product 4, Product 5,
and Product 6, which had high levels of dust/lint particles measured and were
generally
recognized as being high softness products.
[0163] The above procedure for measuring dust and lint was used to collect
data on
additional different facial tissue samples, and the data are presented in
Figure 4. The dust/lint
count was reported as separate fiber counts, fine counts, and starch/ash
counts, and, in some
cases, the amount of dust/lint particles observed was reported as the
difference between the
baseline measurement and the test measurement. The tissue samples used for
these test runs
were generally recognized as having a medium softness. The total dust/lint
count of
approximately 50-53 was, as expected, lower than the high softness brands of
Figure 3.
[0164] Further referring to Figure 4, Section #1 and 2b represent that, during
the test runs,
measurements were taken at 3 different measurement positions (a, b, c) and
these results were
averaged and compared to 2a, which consisted of measuring each position (a, b,
c) separately.
[0165] Referring now to Figure 5, this figure presents a baseline image of the
bottom black
felt pad prior to a test run, and an image of the bottom black felt pad
following a test run.
[0166] Following the above dust and lint measurement test procedure, a single
black felt
bottom pad was used to perform seven test runs of a facial tissue sample, with
the baseline of
the black felt bottom pad was measured between each run for comparison.
Between each test
run and subsequent baseline measurement, the black felt pad was cleaned using
a toothbrush
by brushing the pad twice horizontally and vertically. The data obtained from
each baseline
measurement is presented in Figure 6. The dust/lint count was reported as
separate fiber
CA 03183166 2022- 12- 16
WO 2022/006287
PCT/US2021/039916
counts, fine counts, and starch/ash counts, and the amount of dust/lint
particles observed was
reported as the difference between the baseline measurement and the test
measurement. The
data of Figure 6 demonstrate that cleaning the black felt pad with the
toothbrush effectively
removed dust/lint particles between a test run and baseline measurement.
[0167] As presented in Figure 3, Figure 4, and Figure 6, the type of each
dust/lint particle
measured was identified to allow for binning of each dust/lint particle type.
Such
identification was accomplished using the KemVievv'm Generation 11 SSA and SSA
software,
which allowed for color coding of each particle type. For example, see Figure
7, which
presents a color coded image of dust/lint particles: green represents fibers,
red represents
fines, and blue represents starch/ash. It is noted that, if desired, starch
and ash could be
further sub-segmented by spraying the surface with iodine causing starch
particle to turn dark
blue and can then be identified and measured.
Example 2: Exemplary Dust and Lint Test Method
[0168] In the present example, the dust and list test method of Example 1 was
used to
identify and categorize each type of dust and lint particle from bath tissue
samples.
[0169] Dusting and linting measurements were performed on a consumer brand
bath tissue
roll. 3 square sheets were used for each test run, and the test run method was
as generally
described above in Example 1. Both the structured side and the smooth side
were tested.
[0170] Referring now to Figure 8, this figure presents data demonstrating the
amounts of
different particle types observed during each test run measurement of the bath
sheet samples.
The results are reported as the difference between the test run measurement
and the baseline
measurement (see "Diff." column). Figure 9 present examples of a baseline
image, an image
of a test run using the smooth side of the bath tissue, and an image of a test
run using the
structured side of the bath tissue.
[0171] Further bath tissue dust/lint particle measurements were performed
using four
different consumer brand premium structured bath tissue grade samples, and the
results
obtained are presented in Figure 10. Referring now to Figure 10, as shown
therein, the test
method was able to categorize and to evaluate the both the types of dust/lint
particles and the
amounts of dust/lint particles produced by each sample. Referring now to
Figure 11, this
figure presents examples of a baseline image, an image of a test run using the
structured side
of a bath tissue sample (Product 1 structured side), and an image of a test
run using the
structured side of a second, different bath tissue sample (Product 2
structured side) which had
a lower dust/particle count.
41
CA 03183166 2022- 12- 16
WO 2022/006287
PCT/US2021/039916
Example 3: Exemplary Dust and Lint Test Method
[0172] In the present example, an exemplary method was used measure the amount
of dust
and lint produced by various different paper products. The exemplary method
used to
generate the data of the present example is outlined in Figure 12 and further
described infra.
[0173] The dust and lint test method of the present example used 2 black
furniture pads
manufactured by 3M (8" x 6" x 1/5"); 1 paperboard or corkboard; 2 staples or
push pins; 1
large binder clip (4"): 1 white marker: paper-based sample(s): and KemViewTM
Gen II sheet
structure analyzer ("SSA-) with KemViewTM SSA software for data analysis.
[0174] First, a black furniture pad was provided, and the pad was marked using
the white
marker at distances of 10 cm, 5 cm, and 3 cm from the bottom of the pad (see
Figure 12: 1).
An additional white mark was made at the top center of the pad. These marks
were used as
reference points for positioning the KemViewTM Generation II camera for data
collection.
Next, baseline measurements were taken at each of the three measurement
locations (10 cm,
cm, and 3 cm from the bottom of the pad) (see Figure 12: 2). After taking the
baseline
measurements, the tissue sample was placed on bottom black felt pad in such a
way that the
lower end of the pad was aligned with the perforation between the first and
second sheet of a
four sheet bath tissue sample (see Figure 12: 3). A second black pad was then
placed on top
of the tissue sample (see Figure 12: 4). The smooth side of the top pad was
positioned to face
down and to contact the sample. It is noted that each of the black felt pads
weighed
approximately 34 g. A binder clip was then placed at the end of the tissue
sample, and 2
staple push pins were placed on the board in such a way that the pins touched
the bottom of
the pads (see Figure 12: 4). Next, the board was held in place and the tissue
sample was
pulled using the binder clip at a constant speed and over an interval of
approximately 3
seconds. The top testing pad was removed and the KemViewTM camera placed on
the white
marks to take images for the dust and lint particle measurements.
[0175] Analysis of dust/lint particles proceed according to the formula was as
follows: Dust
& Lint (D&L) = [ (D&L A - Baseline A) + (D&L B - Baseline B) + (D&L C -
Baseline C) ]
/ 3 (A, B, and C represent each of the three measurement points during a test
run or baseline
measurement).
[0176] As in Example 1, the black felt pads used for any one test run could be
reused for
multiple other different test runs provided the bottom testing pad was
cleaned, such as
brushed with a toothbrush, to remove dust and lint particle buildup prior to
each fresh
baseline measurement.
42
CA 03183166 2022- 12- 16
WO 2022/006287
PCT/US2021/039916
[0177] The dust and lint test method of the present example was used to test
various different
consumer bath tissue samples, and the data that was collected is presented in
Figure 13A -
Figure 130. It is noted that each point in Figure 13A - Figure 130 represents
a different
consumer bath tissue product. Figure 14 presents data related to the GMT wet
tensile
strength to dry tensile strength (%) of the bath tissue samples tested.
Referring now to Figure
13A and Figure 13B, the data collected revealed a general trend of samples
having lower
tensile strength tended to produce more dusting and linting. The dust/lint
particle counts were
also compared to the TSA Hand Feel of samples (as measured by TP II algorithm)
(Figure
13C) and the free fiber ends folded (#/cm2) (Figure 130). Referring now to
Figure 13C and
Figure 130, the data collected revealed a general trend of samples having
higher softness
tended to produce more dusting and linting.
Example 4: Exemplaty Dust and Lint Test Method
[0178] In the present example, an exemplary method was used measure the amount
of dust
and lint particles produced by a bath tissue sample and compared to a
different exemplary
method of measuring dust and lint particles. The exemplary method used to
generate the data
of the present example is generally outlined in Figure 12 and Example 3, with
the following
modification. When the tissue sample was pulled between the black pads using
the binder
clip, the binder clip maintained contact with the bench during the entire
duration of the test
run. The method of the present example was compared to that described in
Example 3, in
which the binder clip did not necessarily maintain contact with the table
during the entire
duration of the test run. Test runs were performed using a bath tissue sample.
[0179] Referring now to Figure 15, the data collected from the test runs
demonstrated that
the procedure of Example 4, i.e., the binder clip maintained contact with the
table for the
duration of the test run, resulted in the narrower spread of results and
standard deviation
being reduced.
Example 5: Exemplaty Dust and Lint Test Method
[0180] In the present example, an exemplary method was used measure the amount
of dust
and lint particles produced by various different paper products. The exemplary
method used
to generate the data of the present example is outlined in Figure 16 - Figure
180 and further
discussed infra.
[0181] The dust and lint measurement method of the present example used 2
black furniture
pads manufactured by 3M x x 1/5-); a white marker; paperboard or
cork board; push
43
CA 03183166 2022- 12- 16
WO 2022/006287
PCT/US2021/039916
pins; large (4-) binder clip, a handheld vacuum cleaner or a soft tooth brush;
KemViewTM 2.0
Sheet Structure Analyzer and software; and paper sample(s) (33 cm x 10 cm).
[0182] The present dust and lint measurement method generally proceeded
according to the
following steps: 1. Sample identification and preparation; 2. KemViewTM 2.0
set up and
calibration; 3. Black pad marking; 4. Baseline measurement; 5. Test
preparation; 6. Dust and
lint measurement; 7. Black pad cleaning; and 8. Data analysis.
[0183] Regarding step 1 (sample identification and analysis), first the
product type to be
tested was specified, e.g, bath tissue, facial tissue, base sheet, converted
product, etc.; then
the product side to be tested was identified (e.g., Yankee vs. wire, outside
roll vs. inside roll,
embossed vs. smooth, etc.). The product direction to be tested was then
defined, e g , machine
direction vs. cross direction. Next, the samples were cut to be 33 cm long and
10 cm wide. In
the present example, the dust and lint measurement tests were performed along
the length of
the samples.
[0184] Regarding step 2 (KemViewTM 2.0 set up and calibration), the KemViewTM
camera
was connected to a computer running KemViewTM SSA analysis software, and the
camera
was initialized. Next, the KemViewTM camera was placed on a clean black pad,
and new
calibration images were taken and stored.
[0185] Regarding step 3 (black pad marking), with a white marker, one white
dot was made
at the top center of the long side of the black pad. Next, 3 white lines were
made on the
narrow side of the black pad (see Figure 16). Each line was 6 cm long, and
each line was
positioned at different distances from the bottom of the black pad (position
A: 10 cm;
position B: 5 cm; position C: 3 cm). Referring to Figure 16, the top dot and
side lines were
used as references when positioning the KemViewTM camera during the baseline
and dust/lint
particle measurements.
[0186] Regarding step 4 (baseline measurement), the KemViewTM camera was
placed at
position A of the black pad, and the white marks on the black pad were used to
center the
KemViewTM camera. The top white dot was aligned with the slot present on the
head of the
KemViewTM camera (Figure 17A) and, at the same time, position A was aligned
with the
lateral center of the camera (Figure 17B). Once the camera was in position, a
baseline
measurement was taken, and then the camera was subsequently moved to position
B and
position C for additional baseline measurements.
[0187] Regarding step 5 (test preparation), first, the piece of paper board or
cork board was
placed on a work bench (Figure 18A). Next, 2 push pins were inserted at the
edge of the
board such that the push pins held the black pad in place while the
measurements were being
44
CA 03183166 2022- 12- 16
WO 2022/006287
PCT/US2021/039916
performed. The marked black pad was then placed on the board making sure that
the side of
the black pad touched the push pins (Figure I8B). The sample was placed at the
center of the
black pad and between the 2 push pins with the side to be tested facing down.
The sample
was then adjusted so that the sample length to be tested was 30 cm (it is
noted that the test
length could be adjusted to any desired sample length) (Figure 18C). The
sample was
covered with another black pad with the smooth side facing down. The position
of the top
pad was such that it matched that of the bottom pad. A binder clip was placed
at the end of
the sample (see Figure 18D).
[0188] Regarding step 6 (dust and lint measurement), while one hand was
holding the board
against the work bench, the other hand pulled the sample across the pads by
sliding the binder
lip on the work bench under a constant speed and during an interval of
approximately 3
seconds. The binder clip was pulled in a straight line and kept on the
workbench during the
test run to ensure uniform contact between the sheet and the pads. The top pad
was removed
and the dust/lint particles on the bottom pad were observed and recorded. To
observe and
record the dust/lint particles, the KemViewTM camera was placed at position A,
and an image
taken. The camera was subsequently moved to positions B and C, and images were
taken at
each location. Data was then analyzed using KemViewTM SSA software.
[0189] Regarding step 7 (black pad cleaning), after each measurement a
handheld vacuum or
a toothbrush was used to clean the black felt pad. Both techniques were
implemented to
successfully clean the pad.
[0190] Regarding step 8 (data analysis), the KemViewTM SSA software reported
the total
dust/lint particle count (total number of particles), fiber count (particles
greater than 60 um);
fines count (15 um < particles <60 um); and starch/ash count (particles < 15
um). Analysis
of dust/lint particles proceeded according to the formula as follows: Dust &
Lint (D&L) =
[(D&L A ¨ Baseline A) + (D&L B ¨ Baseline B) + (D&L C ¨ Baseline C)] /3 (A, B,
and C
represent each of the three measurement points during a test run or baseline
measurement).
[0191] Samples of various different consumer bath tissues were tested using
the above
method. For these tests the outside of each sample roll was subject to
evaluation (for the base
sheet sample ¨ the Yankee side was tested). All samples were tested in the
machine direction.
The method of the present example was compared to data generated using the
method of
Example 3; schematics of each method are presented in Figure 19A ¨ Figure 19B
(Figure
19A represents the method of Example 3 method; Figure 19B represents the
method of the
present example). It was noted that based on the orientation of the pads, the
procedure of the
current example had a lower contact area as compared to the that of Example 3,
and therefore
CA 03183166 2022- 12- 16
WO 2022/006287
PCT/US2021/039916
a higher contact pressure. Additionally, the samples were tested using either
one top pad or
two top pads (as indicated in Figure 20 ¨ Figure 21). The data obtained from
these tests are
presented in Figure 20 ¨ Figure 21.
[0192] Referring now to Figure 20, the dust/lint particle measurements
obtained from using
either the method of Example 3, the method of the present example with one top
pad, or the
method of the present example with two top pads, when testing various
different consumer
brand bath tissue samples are presented. It was observed that the method of
the present
example generated approximately 25% more dust and lint on average.
Furthermore, it was
observed that the procedure of the present example executed with 2 top pads
generated
approximately 40% more dust and lint particles on average.
[0193] Referring now to Figure 21, the amount of each type of dust/lint
particles measured
during the test runs are presented. It was observed that the fibers and fines
had the biggest
contribution to total dust/lint particle count (fibers = 50%, fines = 48%,
starch/ash = 2%). It
was further noted that there was no significant difference in the trends for
the results obtained
with the different procedures.
Example 6: Exemplary Dust and Lint Test Method
[0194] In the present example, an exemplary method of measuring dust and lint
in-line, i.e_,
during a papermaking process, is described.
[0195] For in-line dust and lint measurements, a KemViewTM Gen II SSA and a
cloth
substrate in the form of a felt pad are mounted below a sheet run, and can be
positioned in an
off-line mode, in which baseline measurements and test run measurements can be
made (see
Figure 22), and a sampling position mode (see Figure 23), in which dust is
collected on the
felt pad for subsequent measurement in off-line mode.
[0196] Referring now to Figure 22, the dashed lines (1 and 2) represent
mechanical support
adjusters which may in some instances be further outfitted with an air blower
and/or brush to
clean the pad between runs. The solid line (4) of Figure 22 represents a felt
test pad in
measurement position. The black elliptical shape (3) represents the KemView'm
SSA camera
mounted below the sheet run, which can be used to take images for measurement
of dust and
lint. The mechanical support adjusters can be used to change the position of
the camera and
the pad.
[0197] Referring now to Figure 23, the dashed lines (1 and 2) represent
mechanical support
adjusters which may in some instances be further outfitted with an air blower
and/or brush to
clean the pad between runs. The solid line (4) of Figure 23 represents a felt
test pad in
46
CA 03183166 2022- 12- 16
WO 2022/006287
PCT/US2021/039916
collection position. The felt pad is positioned such that it contacts the
sheet for sampling. The
pressure applied by the pad and/or time the pad collects a sample can be
adjusted as needed
for a given sample. Analysis of the dust and lint can proceed as discussed
supra, i.e., by using
KemViewTM Gen II SSA software for image analysis and counting and/or particle
type
identification. The black elliptical shape (3) represents the KemViewTM SSA
camera mounted
below the sheet run.
[0198] Referring now to Figure 24, Figure 24 presents a schematic view of the
positioning
of the KemViewTM Gen II SSA and the felt pad within the components of a
papermaking
process, e.g., a tissue creping process. In Figure 24, the KemViewTM Gen II
SSA and the felt
pad are placed after the dryer and before the tumup reel as depicted by the
solid rectangle (1).
As above, dust and lint can be collected on the felt pad by the felt pad
contacting a sheet
surface, where the contacting can be at a desired process and for a desired
length of time. The
dust and lint particles can be measured using KemViewTM Gen II SSA software
for analysis,
and the types of particles identified. In some instances, after the first
measurement, the felt
pad can be removed and another new pad used in its place, or, in other
instances, a brush
and/or air blower can be placed in-line and used to remove dust and lint
particles from the felt
pad. As above, a new baseline measurement can be taken after this cleaning
step, and then a
new test measurement taken.
[0199] In the preceding procedures, various steps have been described. It
will, however, be
evident that various modifications and changes may be made thereto, and
additional
procedures may be implemented, without departing from the broader scope of the
exemplary
procedures as set forth in the claims that follow.
47
CA 03183166 2022- 12- 16