Note: Descriptions are shown in the official language in which they were submitted.
CA 03192512 2023-02-21
WO 2022/214201 PCT/EP2021/059352
DETERMINING STATES OF ELECTRICAL EQUIPMENT USING VARIATIONS IN DIAGNOSTIC
PARAMETER PREDICTION ERROR
BACKGROUND
[0001] The present disclosure relates to analysis of electrical equipment,
such as high
voltage transformers. In particular, the present disclosure relates to
determining states of
electrical equipment using diagnostic parameter prediction error.
[0002] Many diagnostic parameters for components of electrical equipment
exhibit
variations due to ambient and other site conditions that complicate or delay
detection of
underlying issues with the component difficult. For example, variations in
insulation
parameters of insulation bushings for high voltage transformers, such as
capacitance or power
factor, for example, may be indicative of bushing degradation or failure.
However, these
insulation parameters may be also highly susceptible to ambient conditions,
such as
temperature, humidity, overvoltage, or other changing environmental,
electrical and/or
thermal conditions in and around the electrical equipment. As a result,
conventional diagnostic
techniques based on such susceptible diagnostic parameters may not be able to
detect a
developing fault in advance or can be inaccurate in detecting a condition of a
component.
Therefore, such techniques may require that the transformer be taken offline
to accurately
detect the condition of the component.
SUMMARY
[0003] According to some embodiments, a method includes determining, by a
processor
circuit, a prediction error value for a plurality of predicted diagnostic
parameter values over a
predetermined time period for at least one component of an electrical
equipment, the
prediction error value suppressing ambient variations observed in behavior of
the at least one
1
CA 03192512 2023-02-21
WO 2022/214201 PCT/EP2021/059352
component. The method further includes comparing the determined prediction
error value to
an expected prediction error value. The method further includes selectively
generating, by the
processor circuit, an indication of a state of the at least one component
based on the
comparison.
[0004] According to some embodiments, the at least one component comprises an
insulation component of the electrical equipment. The plurality of predicted
diagnostic
parameter values comprise a plurality of predicted insulation diagnostic
parameter values.
[0005] According to some embodiments, the plurality of predicted insulation
diagnostic
parameter values comprises a plurality of at least one of predicted
capacitance values,
predicted capacitive current values, predicted dissipation factor values, and
predicted power
factor values of the at least one insulation component.
[0006] According to some embodiments, the electrical equipment comprises a
transformer, and the at least one component comprises a high voltage bushing
of the
transformer.
[0007] According to some embodiments, the suppressed variations observed in
the
behavior of the at least one component comprise variations due to ambient
conditions.
[0008] According to some embodiments, the variations due to ambient conditions
comprise variations due to at least one of environmental conditions, noise,
vibration, and
special cause variation.
[0009] According to some embodiments, determining the prediction error value
further
comprises at least one of: predicting, by the processor circuit, at least one
error value for the
plurality of predicted diagnostic parameter values; determining a variation in
the at least one
error value due to ambient conditions observed in behavior of the at least one
component; and
generating the prediction error value based on the at least one error value
and the determined
variation.
[0010] According to some embodiments, determining the prediction error value
further
comprises predicting the plurality of predicted diagnostic parameter values
for a plurality of
respective instants of time of the predetermined time period based on obtained
diagnostic
parameter values. Determining the prediction error value further comprises
determining a
2
CA 03192512 2023-02-21
WO 2022/214201 PCT/EP2021/059352
plurality of error values based on comparisons of the plurality of predicted
diagnostic
parameter values for the respective instants of time with a plurality of
actual diagnostic
parameter values obtained at the respective instants of time, wherein the
prediction error
value comprises an average error value for the plurality of error values.
[0011] According to some embodiments, the plurality of actual diagnostic
parameter
values is obtained from a parameter value data stream generated from a device
associated with
the at least one component.
[0012] According to some embodiments, the plurality of instants of time
comprises at
least 100 instants of time of the predetermined time period.
[0013] According to some embodiments, the plurality of predicted diagnostic
parameter
values is associated with an expected behavior of the at least one component.
The prediction
error value is indicative of a deviation of an observed behavior of the at
least one component
from the expected behavior of the at least one component.
[0014] According to some embodiments, the expected prediction error value is
determined based on a comparison of a plurality of previously predicted
diagnostic parameter
values and a corresponding plurality of previously obtained diagnostic
parameter values.
[0015] According to some embodiments, the plurality of predicted diagnostic
parameter
values is determined based on a plurality of determined relationships between
a predefined
number of diagnostic parameter values of a plurality of previously obtained
diagnostic
parameter values and at least one subsequent parameter value of the plurality
of previously
obtained diagnostic parameter values.
[0016] According to some embodiments, the plurality of previously obtained
diagnostic
parameter values is obtained from a different component from the at least one
component.
[0017] According to some embodiments, the plurality of predicted diagnostic
parameter
values is determined based on at least one of a machine learning model and a
statistical model.
[0018] According to some embodiments, the expected prediction error value is
determined based on at least one of a machine learning model and a statistical
model.
[0019] According to some embodiments, selectively generating the indication
further
comprises determining, by the processor circuit, whether the prediction error
value meets a
3
CA 03192512 2023-02-21
WO 2022/214201 PCT/EP2021/059352
predetermined prediction error threshold, the predetermined prediction error
threshold based
on the expected prediction error value. Selectively generating the indication
further comprises
generating a first alert indication in response to the prediction error value
meeting the
predetermined prediction error threshold.
[0020] According to some embodiments, selectively generating the indication
further
comprises generating a second alert indication in response to the prediction
error value failing
to meet the predetermined prediction error threshold.
[0021] According to some embodiments, an insulation diagnostic system includes
a
processor circuit and a memory comprising machine-readable instructions. When
executed by
the processor circuit, the instructions cause the processor circuit to
determine a plurality of
predicted diagnostic parameter values over a predetermined time period for at
least one
component of an electrical equipment. The instructions further cause the
processor circuit to
obtain a plurality of actual diagnostic parameter values over a predetermined
time period from
the at least one component. The instructions further cause the processor
circuit to determine a
prediction error value based on the plurality of predicted diagnostic
parameter values and the
plurality of actual parameter values, the prediction error value suppressing
ambient variations
observed in behavior of the at least one component. The instructions further
cause the
processor circuit to compare the determined prediction error value to an
expected prediction
error value. The instructions further cause the processor circuit to
selectively transmit an
indication of a state of the at least one component to the electrical
equipment based on the
comparison.
[0022] According to some embodiments, the at least one component comprises an
insulation component of the electrical equipment. The plurality of predicted
diagnostic
parameter values comprise a plurality of predicted insulation diagnostic
parameter values. The
plurality of actual diagnostic parameter values comprise a plurality of actual
insulation
diagnostic parameter values.
[0023] According to some embodiments, the plurality of predicted insulation
diagnostic
parameter values comprises a plurality of at least one of predicted
capacitance values,
predicted capacitive current values, predicted dissipation factor values, and
predicted power
4
CA 03192512 2023-02-21
WO 2022/214201 PCT/EP2021/059352
factor values of the at least one insulation component. The plurality of
actual insulation
diagnostic parameter values is indicative of a plurality of at least one of
actual capacitance
values, actual capacitive current values, actual dissipation factors, and
actual power factors of
the at least one insulation component.
[0024] According to some embodiments, the suppressed variations observed in
the
behavior of the at least one component comprise variations due to ambient
conditions.
BRIEF DESCRIPTION OF THE DRAWINGS
[0025] The accompanying drawings, which are included to provide a further
understanding of the disclosure and are incorporated in a constitute a part of
this application,
illustrate certain non-limiting embodiments of inventive concepts. In the
drawings:
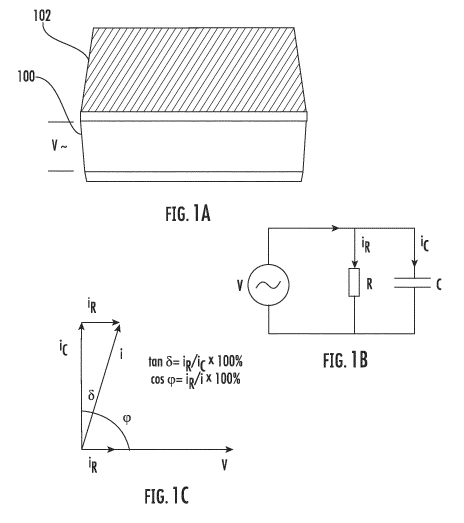
[0026] Figures 1A-1C illustrate techniques for obtaining diagnostic parameter
values for
an insulation component, according to some embodiments;
[0027] Figures 2A and 2B illustrates operations for determining a state of
electrical
equipment based on prediction error for predicted diagnostic parameter values
for the
electrical equipment, according to some embodiments;
[0028] Figure 3 illustrates operations for determining an expected prediction
error value
as part of the operations of Figure 2B, according to some embodiments;
[0029] Figure 4A is a graphical plot of historical power factor data for a
transformer
bushing, according to some embodiments;
[0030] Figure 4B illustrates conversion of a time series data stream for the
historical
power factor data of Figure 3 to a regression model flat table for use by a
machine learning
model, according to some embodiments;
[0031] Figure 5A is a graphical plot illustrating comparisons of predicted
power factors
with the actual power factors over a period of time for the transformer
bushing that is
functioning normally, according to some embodiments;
[0032] Figure 5B is a graphical plot illustrating power factor prediction
error for the
comparisons of Figure 5A over the period of time for the normally functioning
transformer
bushing, according to some embodiments;
CA 03192512 2023-02-21
WO 2022/214201 PCT/EP2021/059352
[0033] Figures 6A and 6B are graphical plots illustrating comparisons of
predicted and
actual capacitances for a transformer bushing over time and capacitance
prediction error over
time for the normally functioning transformer bushing, according to some
embodiments;
[0034] Figure 7 illustrates operations for determining a prediction error
value as part of
the operations of Figure 2B, according to some embodiments;
[0035] Figures 8A and 8B are graphical plots illustrating comparisons of
predicted and
actual capacitances for a transformer bushing over time and capacitance
prediction error over
time for a transformer bushing where the actual capacitance exhibits a sudden
increase,
according to some embodiments;
[0036] Figures 9A and 9B are graphical plots illustrating comparisons of
predicted and
actual capacitances for a transformer bushing over time and capacitance
prediction error over
time for a transformer bushing where the actual capacitance exhibits a linear
increase over
time, according to some embodiments;
[0037] Figures 10A and 10B are graphical plots illustrating comparisons of
predicted and
actual power factors for a transformer bushing over time and power factor
prediction error
over time for a transformer bushing where the actual power factor exhibits a
linear increase
over time, according to some embodiments;
[0038] Figure 11 illustrates operations for determining prediction error based
on
average predicted diagnostic parameter values and average obtained prediction
error values,
according to some embodiments;
[0039] Figures 12A and 12B illustrate calculation of average values from a
time series
data stream of diagnostic parameter values, according to some embodiments;
[0040] Figures 13A and 13B are graphical plots illustrating comparisons of
plurality of
average predicted and actual power factors for a transformer bushing over time
and average
power factor prediction error values over time for a normally functioning
transformer bushing,
according to some embodiments;
[0041] Figures 14A and 14B are graphical plots illustrating comparisons of
average
predicted power factors and average actual power factors for a transformer
bushing over time
and average power factor prediction error values over time for a transformer
bushing where
6
CA 03192512 2023-02-21
WO 2022/214201 PCT/EP2021/059352
the actual power factor exhibits an exponential increase over time, according
to some
embodiments; and
[0042] Figure 15 is a block diagram illustrating a transformer monitoring
system for
performing operations according to some embodiments.
DETAILED DESCRIPTION
[0043] Inventive concepts will now be described more fully hereinafter with
reference
to the accompanying drawings, in which examples of embodiments of inventive
concepts are
shown. Inventive concepts may, however, be embodied in many different forms
and should not
be construed as limited to the embodiments set forth herein. Rather, these
embodiments are
provided so that this disclosure will be thorough and complete, and will fully
convey the scope
of present inventive concepts to those skilled in the art. It should also be
noted that these
embodiments are not mutually exclusive. Components from one embodiment may be
tacitly
assumed to be present/used in another embodiment.
[0044] The following description presents various embodiments of the disclosed
subject
matter. These embodiments are presented as teaching examples and are not to be
construed
as limiting the scope of the disclosed subject matter. For example, certain
details of the
described embodiments may be modified, omitted, or expanded upon without
departing from
the scope of the described subject matter.
[0045] Embodiments include a method of determining a state of components of
electrical equipment by detecting changes in prediction error for diagnostic
parameter values
of the components. For example, a prediction error value may be determined for
a plurality of
predicted diagnostic parameter values over a predetermined time period for at
least one
component of an electrical equipment. The prediction error value may also
suppress ambient
variations observed in behavior of the at least one component, which may
result in more stable
and/or reliable determinations. As used herein, the term "ambient variations"
refers to
variations due to ambient conditions, such as environmental temperature,
noise, vibration,
7
CA 03192512 2023-02-21
WO 2022/214201 PCT/EP2021/059352
humidity, space/surface charge effects, component temperature, fluid pressure
(e.g., a gas leak
through sealing components or a housing of a transformer), vibration,
electrical load, and/or
special cause variation, for example.
[0046] The determined prediction error value may be compared to an expected
prediction error value. Based on the comparison, an indication of a state of
the component
may be selectively generated.
[0047] For purposes of explanation, many of the examples described herein are
directed to determining a state of a bushing or other insulation component for
a high voltage
transformer, using the features disclosed herein. It should be understood,
however, that the
disclosure and claims are not so limited and have a wide range of
applicability beyond the
specific examples provided herein. As used herein, the term "diagnostic
parameter value" may
refer to any parameter for an electrical equipment.
[0048] Before describing the features of the disclosed embodiments, Figures 1A-
1C
illustrate some examples of diagnostic parameters for insulation components.
Figure 1A
illustrates an insulation 100 separating a pair of metallic plates 102. As
shown by circuit
diagram of Figure 1B, when a voltage V is applied across the insulation 100,
the total current i is
divided between a natural capacitive current ic component and a resistive loss
current iR
component. For a normally functioning, e.g., undamaged, insulation 100, ic
should be very high
relative to the loss current R. As a result, the ratio between the two
parameters can be a
reliable indicator of the actual condition or quality of the insulation 100.
As shown by the
vector diagram of Figure 1C, a number of parameters can be measured or derived
in this way.
For example, the angle 5 between the capacitive current ic and total current i
defines the
dissipation factor (tan 5), with tan 5 = iR / ic. The complementary angle cp
between the loss
current iR and the total current i defines the power factor (cos cp), with cos
cp = iR/i. For a high-
quality insulation 100 with a small 5, the dissipation factor and power factor
will be very small,
and will be numerically very close.
[0049] However, if the insulation 100 contains defects, such as shorted
plates,
punctured plates, voids, moisture, and/or particle contamination, for example,
the proportion
of loss current to capacitive current and total current is significantly
higher. As a result,
8
CA 03192512 2023-02-21
WO 2022/214201 PCT/EP2021/059352
capacitance, capacitive current, dissipation factor, and power factor are all
useful diagnostic
parameters for determining a state of the insulation 100.
[0050] Many conventional diagnostic techniques for insulation components, such
as a
transformer bushing for example, involve measuring capacitance, power factor,
and/or other
diagnostic parameters with the transformer disconnected and offline. While it
is possible to
measure these diagnostic parameters while the transformer is online, this
typically introduces a
number of variations, such as variations due to ambient conditions (e.g.,
environmental
conditions, temperature, noise, vibration, special cause variation, etc.),
into the measured
parameter values that make it difficult to obtain accurate readings, which in
turn makes it
difficult to detect problems in bushings or other insulation components while
the transformer is
online.
[0051] To address this problem, according to some embodiments, a plurality of
predicted diagnostic parameter values are obtained for a predetermined time
period, and a
corresponding plurality of actual diagnostic parameter values are obtained for
the same time
period. The predicted diagnostic parameter values are compared with the actual
diagnostic
parameter values to obtain a prediction error value for the predicted
diagnostic parameter
values. This prediction error value is then compared to an expected prediction
error value to
accurately determine a state of the insulation component without the need to
take the
transformer or other electrical equipment offline.
[0052] The predicted diagnostic parameter values, prediction error value, and
expected
prediction error value can be obtained in a number of ways. For example, in
some
embodiments, the expected prediction error value can be obtained by training a
machine
learning model to predict diagnostic parameter values based on historical
data. For example,
the training may be based on determining a plurality of relationships between
a predefined
number of diagnostic parameter values of a plurality of previously obtained
diagnostic
parameter values and at least one subsequent parameter value of the plurality
of previously
obtained diagnostic parameter values. The previously obtained diagnostic
parameter values
may be obtained from the same component, or from a different component, as
desired.
9
CA 03192512 2023-02-21
WO 2022/214201 PCT/EP2021/059352
[0053] The trained machine learning model may then predict a plurality of
diagnostic
parameter values, e.g., based on the plurality of determined relationships,
for an insulation
component that is known to be functioning normally, and compare those
predicted values to a
corresponding plurality of actual diagnostic parameter values for the normally
functioning
insulation component. The resulting prediction error value can then be used as
an expected
prediction error value for future measurements of insulation components in the
field.
[0054] The machine learning model can similarly obtain predicted diagnostic
parameter
values over a period of time for an insulation component in the field, e.g., a
high voltage
bushing for a transformer that is connected and online. The predicted
diagnostic parameter
values are compared to corresponding actual diagnostic parameter values to
obtain a
prediction error value, which is in turn compared to the expected prediction
error value to
determine the actual state of the insulation component. For normally
functioning components,
the prediction error value should be very close to the expected prediction
error value, but for
damaged or malfunctioning components, the prediction error can increase by
orders of
magnitude compared to the expected prediction error value, allowing for very
fast and reliable
detection of problems without taking the electrical equipment offline.
[0055] These and other embodiments can suppress variations observed in
behavior of
the component in several ways. For example, the machine learning model may
account for
variations in the data as part of its training process, and may suppress these
variations when
predicting the predicted diagnostic parameter values. Alternatively, or in
addition, a moving
average of multiple data points can be used to suppress these variations. For
example, a
prediction error value may be obtained by comparing an average predicted
diagnostic
parameter value for a plurality of predicted diagnostic parameter values
(e.g., 100 diagnostic
parameter values) to a corresponding average actual diagnostic parameter
value. In another
example, a plurality of error values (e.g., 100 error values) may be obtained
for the respective
plurality of predicted diagnostic parameter values, and a mean prediction
error value can then
be calculated for the plurality of error values.
[0056] Reference is now made to Figure 2A, which illustrates operations 200
for
determining a state of electrical equipment based on prediction error for
predicted diagnostic
CA 03192512 2023-02-21
WO 2022/214201 PCT/EP2021/059352
parameter values for the electrical equipment, according to some embodiments.
In this
example, the operations 200 include determining, by a processor circuit, a
prediction error
value for a plurality of predicted diagnostic parameter values over a
predetermined time period
for at least one component of an electrical equipment, the prediction error
value suppressing
ambient variations observed in behavior of the at least one component (Block
208). The
operations 200 further include comparing the determined prediction error value
to an expected
prediction error value (Block 210). The operations 200 further include
selectively generating,
by the processor circuit, an indication of a state of the at least one
component based on the
comparison (Block 212). It should also be understood that any or all of these
operations 200
can be used with other disclosed embodiments herein, such as the operations
200'of Figure 2B
described in greater detail below, for example. In addition, the any or all of
these operations
200 can be used with other operations disclosed herein, including the
additional operations for
determining a prediction error value described in Figure 7 below, for example.
[0057] Referring now to Figure 2B, a more detailed example of operations 200'
for
determining a state of electrical equipment based on prediction error for
predicted diagnostic
parameter values for the electrical equipment is illustrated, according to
some embodiments.
In discussing the individual operations 200' of Figure 2B, reference will also
be made to Figures
3-12B, which illustrate additional operations and examples of these and other
features.
[0058] The operations 200' of Figure 2B may include determining an expected
prediction error value for a component of an electrical equipment (Block
2021). Determining
the expected prediction error value can be accomplished in several ways. For
example, in some
embodiments, a machine learning model may be trained to predict diagnostic
parameter values
for a normally functioning component, which can be compared to actual
diagnostic parameter
values to determine an expected, e.g., "baseline", prediction error value.
[0059] In this regard, Figure 3 illustrates additional operations for
determining an
expected prediction error value as part of the operations 200' of Figure 2B.
The additional
operations may include obtaining time series data of historical diagnostic
parameter values
(Block 302), and converting the time series data to a flat file (Block 304).
11
CA 03192512 2023-02-21
WO 2022/214201 PCT/EP2021/059352
[0060] For example, Figure 4A is a graphical plot 400 of historical power
factor data 402
for a high voltage transformer bushing. As shown by Figure 4A, a time series
data stream 404
of the historical power factor data 402 is converted to a flat file 406, e.g.,
a regression model
flat table in this example, with a plurality of rows 408 and column 410, with
each row 408
corresponding to a sequence (e.g., a "moving window") of consecutive
diagnostic parameter
values within the historical power factor data 402.
[0061] Referring back to Figure 3, the additional operations may further
include training
a machine learning model to predict diagnostic parameter values based on the
historical data
(Block 306). For example, the flat file 406 of Figure 4B can be used by the
machine learning
model to iteratively apply multivariate regression algorithms to each of the
rows 408 of flat file
406, with the final column 412 as a target output for inputs based on the
preceding columns, to
determine and refine the algorithm over time. It should be understood,
however, that the
choice of the number of variables (i.e., predictors) will depend on each
individual problem. The
number of variables in each row 408 can be determined and optimized based on
additional
testing, e.g., for sensitivity, model accuracy, hardware and software
constraints, and other
parameters.
[0062] One advantage of this data transformation technique of Figure 4B is the
conversion of a single variable dataset (e.g., tan 5 against time) into a
multivariate problem,
which facilitates the use of many machine learning models suitable for
regression or
classification applications. The power of such machine learning models is in
the fact that they
can "learn" from large datasets containing a large number of cases (or
examples) and also a
large number of features (or predictors, or independent variables).
[0063] One advantage of using these and other prediction techniques with
diagnostic
parameter data is that these techniques can provide very high accurate
prediction of future
diagnostic parameter values based on relatively small single variable datasets
of historical
diagnostic parameter values over time, without the need for any other external
parameters
such as temperature, holidays, events, etc. Moreover, the contributions of
many of the
variations introduced by external ambient conditions may be suppressed by
application of
12
CA 03192512 2023-02-21
WO 2022/214201 PCT/EP2021/059352
these and other prediction techniques, thereby providing a more accurate
indication of the
actual state of the electrical equipment.
[0064] In some embodiments, many different machine learning models (e.g.,
linear and
nonlinear algorithms) are trained using the flattened data, and the results
are compared to
determine the machine learning model with the highest accuracy. Many different
criteria may
be used to determine accuracy, such as root mean square error (RMSE), Mean
Absolute Error
(MAE), etc. Examples of suitable linear machine learning models may include
general linear
regression, logistic regression (e.g., for classification), linear
discriminant analysis, etc.
Examples of suitable non-linear machine learning models may include
classification and
regression trees, naive-Bayesian, K-nearest neighbor, support vector machines,
etc. Examples
of suitable ensemble machine learning models may include random forest, tree-
bagging,
extreme gradient boosting machine, artificial neural networks, etc.
[0065] The predicted diagnostic parameter values can be predicted using
machine
learning models, statistical models, or any other suitable technique. For
example, supervised or
unsupervised machine learning model, such as a neural networks, may be used to
recognize
underlying relationships in a set of data to more accurately predict future
values. In another
example, a statistical model such as Auto-Regressive Integrated Moving Average
("ARIMA"), can
account for and learn from past values in a time series, which in turn leads
to more accurate
predictions of future values. It should be understood, however, that any
number of prediction
techniques may be used, and disclosed embodiments are not limited to the above
examples. In
many embodiments, an increase in accuracy of the prediction of the diagnostic
parameter
values may result in a more reliable expected prediction error value, which in
turn may increase
the diagnostic value of an unexpected increase in prediction error. However,
it should be
understood that any technique that allows for prediction of diagnostic
prediction values of
electrical equipment may be used with embodiments described herein.
[0066] Referring back to Figure 3, the predicted diagnostic values are next
compared to
the corresponding actual diagnostic parameter values for the historical data
(Block 308) to
obtain a plurality of error values for the electrical equipment. In this
example, the predicted
diagnostic values correspond to specific instants of time during the
predetermined time period,
13
CA 03192512 2023-02-21
WO 2022/214201 PCT/EP2021/059352
and the corresponding actual diagnostic parameter values correspond to the
same respective
instants of time. In this example, an average error value is determined for
the plurality of error
values (Block 310), which can be used as the expected prediction error value
for subsequent
measurements and comparisons.
[0067] In this manner, the machine learning model or other suitable prediction
technique can be used to determine expected prediction error values for a
number of
diagnostic parameters. Examples of determining an expected prediction error
value for
historical power factor data (Figures 5A-5B) and historical capacitance data
(Figures 6A-6B) will
now be described below.
[0068] Referring now to Figure 5A, a graphical plot 500 illustrates a
plurality of
predicted power factors 502 and actual power factors 504 over a period of time
for a
transformer bushing that is functioning normally. As discussed above, the
predicted power
factors 502 can be predicted using a supervised or unsupervised machine
learning model such
as a neural network, a statistical model such as Auto-Regressive Integrated
Moving Average
("ARIMA"), or other suitable technique for predicting power factors or other
diagnostic
parameter values. The actual power factors 504 are measured or derived from
measurements
of the transformer bushing for the corresponding time period.
[0069] As shown by Figure 5B, the comparison of the predicted power factors
502 to
the actual power factors 504 produces a graphical plot 506 of a plurality of
error values 508 for
the normally functioning transformer bushing. The mean prediction error 510
for the plurality
of error values 508 in this example is 0.98%, which can be used as an expected
prediction error
value 512 for comparison against future power factor prediction error
determinations for
transformer bushings in active use. In some embodiments, a different value may
be used as the
expected prediction error value, such as a 95th percentile value 514 (i.e., a
maximum value of
the error values 508 that excludes the largest 5% of error values 508), 99th
percentile value
516, etc.
[0070] These techniques can be used to determine an expected prediction error
value
for other diagnostic parameters as well, such as capacitive current,
dissipation factor, and/or
power factor, etc. In this regard, Figure 6A is a graphical plot 600
illustrating comparisons of
14
CA 03192512 2023-02-21
WO 2022/214201 PCT/EP2021/059352
predicted capacitances 602 and actual capacitances 604 for a transformer
bushing over a
period of time. Figure 6B is a graphical plot 606 of a plurality of error
values 608 produced by
the comparison of the predicted capacitances 602 to the actual capacitances
604 of for the
normally functioning transformer bushing. The mean prediction error 610 for
the plurality of
error values 608 in this example is 0.0043%, which can be used as an expected
prediction error
value 612 for comparison against future capacitance prediction error
determinations for
transformer bushings in active use. As noted above, different values may also
be used, such as
a 95th percentile value 614, 99th percentile value 616, etc., as desired.
[0071] Referring back to Figure 2B, the operations 200' may further include
predicting a
plurality of predicted diagnostic parameter values over a predetermined time
period (Block
2041), for example, with the trained machine learning model described above.
The operations
200' may further include obtaining a plurality of actual diagnostic parameter
values for the
predetermined time period (Block 2061), which can be measured or derived from
measurements of the transformer bushing for the corresponding time period, for
example.
[0072] The operations 200' may further include determining a prediction error
value for
the plurality of predicted diagnostic parameter values (Block 2081), for
example, by comparing
the predicted diagnostic parameter values to the actual diagnostic parameter
values. In this
regard, Figure 7 illustrates additional operations for determining a
prediction error value as part
of the operations of Figure 2B, according to some embodiments.
[0073] The additional operations of Figure 7 may further include predicting a
plurality of
diagnostic parameter values using the machine learning model (Block 702), or
other suitable
prediction technique. A corresponding plurality of actual diagnostic parameter
values is also
obtained (Block 704). In this regard, Figure 8A is a graphical plot 800
illustrating predicted
capacitances 802 and actual capacitances 804 over time for a transformer
bushing in the field.
In this example, the predicted diagnostic values correspond to specific
instants of time during
the predetermined time period, and the corresponding actual diagnostic
parameter values
correspond to the same respective instants of time. In this example, the
trained machine
learning model used for determining the predicted capacitances 602 for the
normally
functioning transformer bushing of Figure 6A is also used to predict the
predicted capacitances
CA 03192512 2023-02-21
WO 2022/214201 PCT/EP2021/059352
802 of the transformer bushing in the field of Figure 8A. For this example, a
relatively small, but
sudden increase 818 in the actual capacitances 804 (e.g., 1pF) occurs at time
T.
[0074] The additional operations of Figure 7 may further include comparing the
predicted diagnostic parameter values to the obtained actual diagnostic
parameter values to
determine a plurality of error values. In this regard, Figure 8B is a
graphical plot 806 of a
plurality of error values 808 produced by comparison of the predicted
capacitances 802 to the
actual capacitances 804 shown in Figure 8A for the transformer bushing in the
field. Due to the
sudden increase 818 in the actual capacitances 804 shown in Figure 8A, the
error values 808
also show a large, sustained increase 820 at time T.
[0075] The additional operations of Figure 7 may further include determining
an
average error value for the plurality of error values (Block 708). For
example, as shown in
Figure 8B, the mean prediction error 810 for the plurality of error values 808
in this example is
0.0435%, as a result of that sharp increase 820 in the error values 808. In
this manner, the
mean prediction error 810 is indicative of a deviation of an observed
behavior, i.e., the sudden
increase 818 in the actual capacitances 804, from an expected behavior, i.e.,
the predicted
capacitances 802. As noted above, different values may also be used, such as a
95th percentile
value 814, 99th percentile value 816, etc., as desired.
[0076] Referring back to Figure 2B, the operations 200' may further include
comparing
the determined prediction error value to the expected prediction error value
(Block 2101). For
example, the mean prediction error 810 (i.e., average error value) of Figure
8B can be
compared to the expected prediction error value 612 that was determined in
Figure 6B for the
normally functioning transformer bushing. In this example, the mean prediction
error 810 of
0.0435% is approximately ten times the expected prediction error value 612 of
0.0043%,
despite the relatively small size of the capacitance increase 818 in absolute
terms. This
represents a clear and easily detected indication of anomalous behavior (i.e.,
a sudden increase
in capacitance) by the transformer bushing in the field. In this and other
examples, a significant
deviation in the actual diagnostic parameter values may result in a
corresponding increase in
the prediction error that can be detected and monitored.
16
CA 03192512 2023-02-21
WO 2022/214201 PCT/EP2021/059352
[0077] In this regard, referring back to Figure 2B, the operations 200' may
further
include selectively generating an indication of a state of the at least one
component based on
the comparison (Block 2121). In some embodiments for example, a prediction
error threshold
can be determined based on the expected prediction error value, and an alert
indication can be
selectively generated in response to determining that the prediction error
value meets the
predetermined prediction error threshold. Alternatively, or in addition, an
indication can also
be selectively generated in response to response to the prediction error value
failing to meet
the predetermined prediction error threshold.
[0078] In some examples, the prediction error threshold can be a specific
value or a
range of values. The indication(s) may also include an indication of a
specific value or range of
values, a classification type, e.g., "good or bad", "yes or no", levels 1,2,3,
etc., or any other
appropriate indication, as desired.
[0079] Embodiments disclosed herein are capable of detecting and indicating
other
types of anomalous behavior as well. For example, Figure 9A is a graphical
plot 900 illustrating
comparisons of predicted capacitances 902 and actual capacitances 904 for a
transformer
bushing where the actual capacitance exhibits a linear increase 918 over time.
As shown by
Figure 9B, this relatively small linear increase 918 in capacitance (e.g.,
3pF) results in a
measurable increase 920 in corresponding error values 908 as well, which
results in a mean
prediction error 910 of 0.0408%, more than nine times the expected prediction
error value 612
of 0.0043% (shown in Figure 6B). As noted above, different values may also be
used, such as a
95th percentile value 914, 99th percentile value 916, etc., as desired.
[0080] In another example, Figure 10A is a graphical plot 1000 illustrating
comparisons
of predicted power factors 1002 and actual power factors 1004 over time for a
transformer
bushing in the field, where the actual power factors 1004 exhibits a linear
increase 1018 over
time. Here again, this linear increase 1018 in capacitance results in a
measurable increase 1020
in corresponding error values 1008 as well, as shown by Figure 10B, which
results in a mean
prediction error 1010 of 2.36%, much higher than the expected prediction error
value 512 of
0.98% (shown in Figure 5B). As noted above, different values may also be used,
such as a 95th
percentile value 1014, 99th percentile value 1016, etc., as desired.
17
CA 03192512 2023-02-21
WO 2022/214201 PCT/EP2021/059352
[0081] As discussed above, variations in the observed behavior of the
transformer
bushing (or other component) can detected and/or suppressed in a number of
ways. For
example, as discussed above with respect to the machine learning model
examples disclosed
herein, the prediction technique itself may suppress many of the variations
introduced by
external ambient conditions. For example, the prediction technique may be
trained or
configured to distinguish between variations due to ambient conditions and
normal ageing of a
component, i.e., "healthy" variations, and variations due to underlying issues
with the
component, such as damage, excess wear, or other undesirable variations.
Alternatively, or in
addition, variations can also be suppressed by obtaining average values for
sets of diagnostic
parameter values over time.
[0082] Referring now to Figure 11, operations 1100 for determining prediction
error
based on average predicted diagnostic parameter values and average obtained
prediction error
values, according to some embodiments. These operations 1100 may be used as
part of the
operations 200' of Figure 2B, for example, such as determining the expected
prediction error
value (Block 2021), and/or determining the prediction error value for the
plurality of predicted
diagnostic parameter values (Block 2081), etc.
[0083] The operations 1100 of Figure 11 may include determining a plurality of
average
obtained diagnostic parameter values based on a plurality of obtained
diagnostic parameter
values (Block 1102). For example, Figures 12A and 12B illustrate calculation
of a plurality of
average values (i.e., a moving average) from a time series data stream 1204 of
a diagnostic
parameter value, according to some embodiments. In Figure 12A, power factor
values 1202 are
obtained from a time series data stream 1204, which may exhibit variations
over time due to
ambient conditions, such as environmental factors, temperature, etc. The power
factor values
1202 are converted to a plurality of average power factor values 1206, which
further reduces
the effect of ambient variations on the measured values. In this example, each
set of twenty
obtained power factor values 1202 is averaged to produce a single average
power factor value
1206.
[0084] In some examples, a sufficiently large set of obtained diagnostic
parameter
values can produce a usable set of average diagnostic parameter values (e.g.,
100 values
18
CA 03192512 2023-02-21
WO 2022/214201
PCT/EP2021/059352
associated with 100 instants of time, for example) using the technique of
Figure 12A.
Alternatively, or in addition, it may be desirable to determine an average
value for each
obtained diagnostic parameter value, to obtain a larger set of data points for
use by the
machine learning model, statistical model, or other prediction technique. In
this regard, Figure
12B illustrates conversion of the power factor values 1202 obtained from a
time series data
stream 1204 into a plurality of average power factor values 12061, with each
average power
factor value based on the obtained power factor value and the previous
nineteen obtained
power factor values in the sequence. In this manner, each average power factor
value 1206'
may still suppress variations in the obtained power factor values 1202, but
with a much larger
number of average power factor values 1206' for use by the prediction
technique, thereby
increasing the overall accuracy of the prediction technique.
[0085] The operations 1100 of Figure 11 may further include predicting a
plurality of
average predicted diagnostic parameter values based on the plurality of
obtained diagnostic
parameter values (Block 1104). For example, a plurality of predicted
diagnostic parameter
values may be determined using the machine learning model or other prediction
techniques
described above. A plurality of average predicted diagnostic parameter values
may then be
determined based on the plurality of predicted diagnostic parameter value,
using the same or
similar processes of Figures 12A and/or 12B, for example.
[0086] The operations 1100 of Figure 11 may further include comparing the
average
predicted diagnostic parameter values to the average historical diagnostic
parameter values to
obtain a plurality of average error values (Block 1106), and determining an
average prediction
error value for the plurality of average error values (Block 1108), similar to
the techniques
described above with respect to Figures 3 and 7 et al.
[0087] A further application of the operations 1100 of Figure 11 is
illustrated by the
example of Figures 13A-14B. Figure 13A is a graphical plot 1300 illustrating
comparisons of a
plurality of average predicted power factors 1302 and a plurality of average
actual power
factors 1304 over time for a normally functioning transformer bushing. In this
embodiment,
each average predicted power factor data point 1318 represents an average of
100 predicted
power factor samples (see Block 1104 of Figure 11), and each average actual
power factor data
19
CA 03192512 2023-02-21
WO 2022/214201 PCT/EP2021/059352
point 1320 represents an average of 100 corresponding actual power factor
samples (see Block
1102 of Figure 11). As shown by the graphical plot 1306 of Figure 13B, average
error values
1308 are obtained from comparisons of the plurality of average predicted power
factors 1302
with the plurality of average actual power factors 1304 (see Block 1106 of
Figure 11). For
example, as with the examples above, a mean prediction error 1310 in Figure
13B is calculated
for the plurality of average error values 1308 (see Block 1108 of Figure 11).
In this example, the
mean prediction error 1310 is 0.03%, which can be used as an expected
prediction error value
1312 for comparison against future prediction error determinations for
transformer bushings in
active use (see, e.g., Figure 3). As noted above, different values may also be
used, such as a
95th percentile value 1314, 99th percentile value 1316, etc., as desired. In
this example, by
averaging groups of predicted and actual power factor samples prior to
determining the
average error values 1308, variations in the observed behavior of the
transformer bushing are
further suppressed, and the expected prediction error in this example is
reduced from 0.98%
(see Figure 5B, which does not employ the moving average technique of this
example) to 0.03%
in this example. This reduction in the expected prediction error value 1312,
i.e., baseline value,
increases the likelihood of detecting increases in prediction error when
monitoring equipment
in the field, thereby increasing the likelihood of detecting anomalous
behavior in the
equipment.
[0088] Similar moving average techniques can be used for predicting diagnostic
parameter values and determining prediction error values for equipment in the
field (see, e.g.,
Figure 7). In this regard, Figure 14A is a graphical plot 1400 illustrating
comparisons of a
plurality of average predicted power factors 1402 and a plurality of average
actual power
factors 1404 over time for a transformer bushing in the field. In this
example, the trained
machine learning model used for determining the average predicted power
factors 1302 for the
normally functioning transformer bushing of Figure 13A is also used to predict
the plurality of
average predicted power factors 1402 of the transformer bushing in the field
of Figure 14A. For
this example, the plurality of average actual power factors 1404 exhibits a
linear increase 1414
over time. As shown by the graphical plot 1406 Figure 14B, this linear
increase 1414 in the
average actual power factors 1404 results in a measurable increase 1416 in
corresponding error
CA 03192512 2023-02-21
WO 2022/214201 PCT/EP2021/059352
values 1408 as well, which results in a mean prediction error value 1410 of
0.9%, approximately
thirty times the expected prediction error value 1312 of 0.03% (shown in
Figure 14B). As noted
above, different values may also be used, such as a 95th percentile value
1414, 99th percentile
value 1416, etc., as desired.
[0089] As discussed above, while many of the above embodiments relate to
determining a state of insulation components (e.g., high voltage bushings),
based on diagnostic
parameters relating to capacitance, power factor, etc., it should be
understood that the
embodiments disclosed herein have a wide range of applications. For example,
many of the
same ambient conditions that affect capacitance-based diagnostic parameters
may also affect
diagnostic parameters for detecting and measuring other aspects of transformer
and other
electrical equipment, such as partial discharge (PD), oil temperature, and/or
Dissolved Gas
Analysis (DGA), for example. Other types of electrical equipment that can
benefit from
embodiments disclosed herein may include circuit breakers to monitor condition
of the
contacts (i.e., physical wear), gas leaks, operating mechanisms (e.g., travel
time), etc.
[0090] For example, diagnostic parameters related to breaker travel time
monitoring
may include force experienced by the circuit breaker contact, which may be
affected by a
number of ambient conditions, such as arcing, insulation gas properties (e.g.,
gas
electronegativity, gas mixture), load current, instant of switching,
temperature around
contacts, space charges in sulfur hexafluoride or other cooling gasses,
instantaneous potential
difference between contacts, load current, type of loads (e.g., impedance),
etc. With sufficient
volumes of historical data for these different diagnostic parameters, these
and other prediction
techniques can be trained or configured to detect component states and
deviations from
expected states irrespective of the extent or effect of ambient conditions on
the measured
data.
[0091] Referring now to Figure 15, a block diagram of a transformer monitoring
system
1500 is illustrated. The transformer monitoring system 1500 in this example is
configured to
perform operations according to some embodiments, such as the operations of
Figures 2, 3, 7,
and/or 11, et al. A transformer monitoring device 30 of the transformer
monitoring system
1500 can monitor one or multiple transformers 10A, 10B. In some embodiments,
the
21
CA 03192512 2023-02-21
WO 2022/214201 PCT/EP2021/059352
transformer monitoring device 30 is integrated within a transformer 10A
provided as a device
and can be enabled to monitoring only the transformer 10A, while in other
embodiments, the
transformer monitoring device 30 can be integrated with the transformer 10A to
monitor the
transformer 10A and optionally also monitor or receive data from a neighboring
one or more
electrical equipment (e.g. transformer 10B or another power or current
transformer or circuit
breaker) or connected transmission/distribution line. In yet another
embodiment, the
transformer monitoring device 30 is separate from the transformers 10A, 10B
being monitored.
[0092] The transformer monitoring device 30 includes a processor circuit 34, a
communication interface 32 coupled to the processor circuit, and a memory 36
coupled to the
processor circuit 34. The memory 36 includes machine-readable computer program
instructions that, when executed by the processor circuit 34, cause the
processor circuit 34 to
perform some of the operations depicted and described herein, such as
operations of Figures 2,
3, 7, and/or 11, for example.
[0093] As shown, the transformer monitoring system 1500 includes a
communication
interface 32 (also referred to as a network interface) configured to provide
communications
with other devices, e.g., with sensors 20 in the transformers 10A, 10B via a
wired or wireless
communication channel 14. The transformer monitoring device 30 may receive
signals from
the sensors 20 indicative of diagnostic parameters of the transformers 10A,
10B, e.g., voltage,
current, oil temperature, ambient temperature, etc., associated with the
transformers 10A,
10B.
[0094] In this example, the transformer monitoring device 30 is depicted as a
separate
monitoring device that communicates with the transformers 10A, 10B circuit via
communication
channels 14, e.g., in a server-client model, cloud-based platform, a
substation automation system
used in a substation, a distribution management system used for power system
management, or
other network arrangements. One advantage of a client-server configuration is
that monitoring
and prediction of diagnostic parameters can be obtained for a plurality of
individual equipment,
such as transformers 10A, 10B. For example, diagnosis of a problem with one
electrical
equipment in a power system may include redistributing loads across different
electrical
equipment, based on the determined states of the different electrical
equipment. However, it
22
CA 03192512 2023-02-21
WO 2022/214201 PCT/EP2021/059352
should also be understood that, in other embodiments, the transformer
monitoring device 30
may be part of the transformer 10A, 10B or other electrical equipment as
desired.
[0095] In another embodiment of the server-client model, the transformer
monitoring
system can have a device (e.g., client) associated with the transformer being
monitored, wherein
the device comprises a machine learning model, statistical model, or other
prediction tool, and a
central system (e.g., server) is configured to monitor multiple electrical
equipment/transformers.
The server may also include an instance of the machine learning model or other
prediction tool
comprised in the device associated with the transformer. The machine learning
model or other
prediction tool in the server may be continuously trained, tuned, adapted,
etc. with data
received from the transformer or/and the multiple electrical equipment, with
the server
providing information/data for tuning/adapting the prediction tool in the
server. The server may
also be capable of performing simulation or advanced processing to
forecast/simulate conditions
in the transformer (e.g. failure or degradation of a transformer bushing based
on capacitance
and/or power factor data made available by the device or sensors connected to
the transformer)
and to provide information relating to such determination to the device (e.g.,
client) connected
to the transformer to change at least one parameter (e.g. cooling, output,
online status)
associated with the transformer (or other electrical equipment) by the device.
According to
various embodiments, the transformer monitoring device 30 may include
electronic, computing
and communication hardware and software for measuring and predicting
diagnostic parameter
values and performing at least one activity associated with the transformer.
[0096] The transformer monitoring device 30 also includes a processor circuit
34 (also
referred to as a processor) and a memory circuit 36 (also referred to as
memory) coupled to the
processor circuit 34. According to other embodiments, processor circuit 34 may
be defined to
include memory so that a separate memory circuit is not required.
[0097] As discussed herein, operations of transformer monitoring device 30 and
other
aspects of the transformer monitoring system 1500 may be performed by
processor circuit 34
and/or communication interface 32. For example, the processor circuit 34 may
control the
communication interface 32 to transmit communications through the
communication interface
32 to one or more other devices and/or to receive communications through
network interface
23
CA 03192512 2023-02-21
WO 2022/214201 PCT/EP2021/059352
from one or more other devices. Moreover, modules may be stored in memory 36,
and these
modules may provide instructions so that when instructions of a module are
executed by
processor circuit 34, processor circuit 34 performs respective operations
(e.g., operations
discussed herein with respect to example embodiments). For example, modules
may be further
configured to obtain diagnostic parameter values, predict diagnostic parameter
values,
determine prediction error values, and determine states and/or conditions of
components of the
electrical equipment.
[0098] The transformer 10, which may for example be a high voltage
transformer,
includes a sensor 20 that measures various quantities associated with the
transformer 10A, 1013
such as voltage, current, operating load, ambient temperature, moisture and/or
oxygen
content for various components of the transformer 10, and transmits the
measurements via
communication channel 14 to the transformer monitoring device 30. For example,
the sensor
30 may be configured in this example to obtain measurements associated with a
bushing 22 or
other insulation component of the transformer 10. The transformer 10 may also
include sub-
systems, such as an active part 24 coupled to a power line 28 (e.g., an
overhead power
transmission line), cooling system 26 (e.g., for a transformer or reactor),
etc., which may in turn
be operated by or in response to instructions from the processor circuit 34
for example.
[0099] In this and other examples, embodiments are described in a context of
transformers for simplicity of illustration, but it should be understood that
many other types of
electrical equipment and components thereof may benefit from the embodiments
described
herein, such as reactors, transmission lines, instrument transformers,
generators etc., and all
such electrical equipment should also be contemplated as being within the
scope of the present
disclosure.
[0100] These measured quantities can be used by the transformer monitoring
device 30
to detect and/or determine the presence of faults in various components or
subsystems of the
transformer 10A, 1013, and/or a general fault condition of the transformer 10.
The
communication channel 14 may include a wired or wireless link, and in some
embodiments may
include a wireless local area network (WLAN) or cellular communication
network, such as a 4G
or 5G communication network.
24
CA 03192512 2023-02-21
WO 2022/214201 PCT/EP2021/059352
[0101] The transformer monitoring system 1500 may receive on-line or off-line
measurements of voltage, current, operating load, temperature, moisture,
oxygen content, etc.
from the transformer 10A, 10B and process the measurements to perform the
operations
described herein. The transformer monitoring system 1500 may be implemented in
a server, in
a server cluster, a cloud-based remote server system, and/or a standalone
device. Sensor data
may be obtained by the transformer monitoring system 1500 from one transformer
and/or
from multiple transformers.
[0102] A transformer monitoring system 1500 as described herein may be
implemented
in many different ways. For example, a transformer monitoring system 1500
according to some
embodiments may receive online/offline data, and the received data used by a
machine
learning or other prediction technique described in various embodiments. The
device may be
connectable to one or more transformers 10 to receive diagnostic parameter
values and/or
other types of measurement data.
[0103] In the above description of various embodiments of present inventive
concepts,
it is to be understood that the terminology used herein is for the purpose of
describing
particular embodiments only and is not intended to be limiting of present
inventive concepts.
Unless otherwise defined, all terms (including technical and scientific terms)
used herein have
the same meaning as commonly understood by one of ordinary skill in the art to
which present
inventive concepts belong. It will be further understood that terms, such as
those defined in
commonly used dictionaries, should be interpreted as having a meaning that is
consistent with
their meaning in the context of this specification and the relevant art.
[0104] When an element is referred to as being "connected", "coupled",
"responsive",
or variants thereof to another element, it can be directly connected, coupled,
or responsive to
the other element or intervening elements may be present. In contrast, when an
element is
referred to as being "directly connected", "directly coupled", "directly
responsive", or variants
thereof to another element, there are no intervening elements present. Like
numbers refer to
like elements throughout. Furthermore, "coupled", "connected", "responsive",
or variants
thereof as used herein may include wirelessly coupled, connected, or
responsive. As used
herein, the singular forms "a", "an" and "the" are intended to include the
plural forms as well,
CA 03192512 2023-02-21
WO 2022/214201 PCT/EP2021/059352
unless the context clearly indicates otherwise. Well-known functions or
constructions may not
be described in detail for brevity and/or clarity. The term "and/or" includes
any and all
combinations of one or more of the associated listed items. The phrase "at
least one of A and
B" means "A or B" or "A and B".
[0105] It will be understood that although the terms first, second, third,
etc. may be
used herein to describe various elements/operations, these elements/operations
should not be
limited by these terms. These terms are only used to distinguish one
element/operation from
another element/operation. Thus, a first element/operation in some embodiments
could be
termed a second element/operation in other embodiments without departing from
the
teachings of present inventive concepts. The same reference numerals or the
same reference
designators denote the same or similar elements throughout the specification.
[0106] As used herein, the terms "comprise", "comprising", "comprises",
"include",
"including", "includes", "have", "has", "having", or variants thereof are open-
ended, and include
one or more stated features, integers, elements, steps, components, or
functions but does not
preclude the presence or addition of one or more other features, integers,
elements, steps,
components, functions, or groups thereof.
[0107] Example embodiments are described herein with reference to block
diagrams
and/or flowchart illustrations of computer-implemented methods, apparatus
(systems and/or
devices) and/or computer program products. It is understood that a block of
the block
diagrams and/or flowchart illustrations, and combinations of blocks in the
block diagrams
and/or flowchart illustrations, can be implemented by computer program
instructions that are
performed by one or more computer circuits. These computer program
instructions may be
provided to a processor circuit of a general purpose computer circuit, special
purpose computer
circuit, and/or other programmable data processing circuit to produce a
machine, such that the
instructions, which execute via the processor of the computer and/or other
programmable data
processing apparatus, transform and control transistors, values stored in
memory locations,
and other hardware components within such circuitry to implement the
functions/acts
specified in the block diagrams and/or flowchart block or blocks, and thereby
create means
26
CA 03192512 2023-02-21
WO 2022/214201 PCT/EP2021/059352
(functionality) and/or structure for implementing the functions/acts specified
in the block
diagrams and/or flowchart block(s).
[0108] These computer program instructions may also be stored in a tangible
computer-
readable medium that can direct a computer or other programmable data
processing apparatus to
function in a particular manner, such that the instructions stored in the
computer-readable medium
produce an article of manufacture including instructions which implement the
functions/acts
specified in the block diagrams and/or flowchart block or blocks. Accordingly,
embodiments of
present inventive concepts may be embodied in hardware and/or in software
(including firmware,
resident software, micro-code, etc.) that runs on a processor such as a
digital signal processor,
which may collectively be referred to as "circuitry," "a module" or variants
thereof.
[0109] It should also be noted that in some alternate implementations, the
functions/acts noted in the blocks may occur out of the order noted in the
flowcharts. For
example, two blocks shown in succession may in fact be executed substantially
concurrently or
the blocks may sometimes be executed in the reverse order, depending upon the
functionality/acts involved. Moreover, the functionality of a given block of
the flowcharts
and/or block diagrams may be separated into multiple blocks and/or the
functionality of two or
more blocks of the flowcharts and/or block diagrams may be at least partially
integrated.
Finally, other blocks may be added/inserted between the blocks that are
illustrated, and/or
blocks/operations may be omitted without departing from the scope of inventive
concepts.
Moreover, although some of the diagrams include arrows on communication paths
to show a
primary direction of communication, it is to be understood that communication
may occur in
the opposite direction to the depicted arrows.
[0110] Many variations and modifications can be made to the embodiments
without
substantially departing from the principles of the present inventive concepts.
All such
variations and modifications are intended to be included herein within the
scope of present
inventive concepts. Accordingly, the above disclosed subject matter is to be
considered
illustrative, and not restrictive, and the examples of embodiments are
intended to cover all
such modifications, enhancements, and other embodiments, which fall within the
spirit and
scope of present inventive concepts. Thus, to the maximum extent allowed by
law, the scope
27
CA 03192512 2023-02-21
WO 2022/214201 PCT/EP2021/059352
of present inventive concepts is to be determined by the broadest permissible
interpretation of
the present disclosure including the examples of embodiments and their
equivalents, and shall
not be restricted or limited by the foregoing detailed description.
28