Note: Descriptions are shown in the official language in which they were submitted.
WO 2022/119861
PCT/US2021/061287
METHODS FOR GENOMIC IDENTIFICATION OF PHENOTYPE RISK
CROSS-REFERENCE
100011 This application claims the benefit of U.S. Patent
Application No. 63/119,685, filed
December 1, 2020, U.S. Patent Application No. 63/120,439, filed December 2,
2020, and U.S.
Patent Application No. 63/122,081, filed December 7, 2020, the contents of
each of which is
entirely incorporated by reference herein.
BACKGROUND
100021 In vitro fertilization (IVF) may refer to a series of
procedures used to help with
fertility, prevent genetic problems, and assist with the conception of a
child. Current embryonic
genetic analysis may involve sequencing of a small amount of available genetic
material in order
to determine both euploidy (proper number of chromosomes) and the risk of a
small number of
identifiable genetic diseases. However, only a small number of cells may be
available for study
without harming the embryo. This small amount of genetic material may result
in a large amount
of noise during analysis. While the material may be chemically amplified to
produce more
DNA, current amplification processes may inject errors into the amplified
product, which
similarly impacts the accuracy of the final result.
SUMMARY
100031 The present disclosure provides methods for determining the genomic
sequence of an
embryo by simplifying comparison between genomes. The present disclosure
provides methods
for the aggregation and distillation of complex collections of genomic
properties into a smaller
set of phenotypical biases that may be used to select a genome from the
collection of genomes
for further operations. The present disclosure provides methods for the
identification of genomic
phenotype risk scores associated with an organism that possesses an expected
genome. The
present disclosure also provides methods leveraging replicon variation among a
cohort to
identify associations and risks for phenotypes, based on the genomics of an
organism.
100041 In some embodiments, the present disclosure provides a method for
determining a
genomic sequence of an embryo, comprising (a) isolating deoxyribonucleic acid
(DNA)
molecules from cells obtained or derived from a biopsy sample or culture
sample of the embryo;
(b) preparing a sequencing library from the DNA molecules or derivatives
thereof; (c)
sequencing the sequencing library to produce embryo-derived sequence reads;
and (d) computer
processing the embryo-derived sequence reads to determine the genomic sequence
of the
embryo using sequence information derived from one or more parents of the
embryo. In some
-1-
CA 03200803 2023- 5- 31
WO 2022/119861
PCT/US2021/061287
embodiments, the embryo is produced at least in part by in vitro fertilization
of a sperm cell
from a paternal subject and an egg cell from a maternal subject.
[0005] In some embodiments, the method further comprises sequencing second DNA
molecules
obtained or derived from the paternal subject or the maternal subject to
produce parental-derived
sequence reads, wherein the parental-derived sequence reads comprise paternal-
derived
sequence reads from the paternal subject or maternal-derived sequence reads
from the maternal
subject, respectively, and wherein (d) further comprises computer processing
the embryo-
derived sequence reads and the parental-derived sequence reads to determine
the genomic
sequence of the embryo.
[0006] In some embodiments, the parental-derived sequence reads comprise
paternal-derived
sequence reads from the paternal subject and maternal-derived sequence reads
from the maternal
subject. In some embodiments, the method further comprises performing contig
assembly of
individual sequence reads of the embryo-derived sequence reads and the
parental-derived
sequence reads to determine the genomic sequence of the embryo. In some
embodiments, a
portion of the genomic sequence of the embryo located between two breakpoints
is determined
based at least in part on a corresponding genomic sequence obtained from
either the paternal-
derived sequence reads or the maternal-derived sequence reads. In some
embodiments, a
plurality of portions of the genomic sequence of the embryo located between 3,
4, 5, 6, 7, 8, 9,
10, or more than 10 breakpoints are determined based at least in part on a
corresponding
genomic sequence obtained from either the paternal-derived sequence reads or
the maternal-
derived sequence reads. In some embodiments, a plurality of portions of the
genomic sequence
of the embryo located between 3, 4, 5, 6, 7, 8, 9, 10, or more than 10
breakpoints are determined
based at least in part on a corresponding genomic sequence obtained from the
paternal-derived
sequence reads and the maternal-derived sequence reads.
100071 In some embodiments, the embryo is a human embryo. In some embodiments,
the
embryo is a blastocyst. In some embodiments, the blastocyst is cultured for 1
day, 2 days, 3
days, 4 days, 5 days, 6 days, 7 days, 8 days, 9 days, or 10 days.
[0008] In some embodiments, the biopsy sample comprises trophectoderm cells of
the
blastocyst. In some embodiments, the culture sample comprises cells or cell-
free DNA from
culture media.
[0009] In some embodiments, the method further comprises computer processing
at least a
portion of the genomic sequence of the embryo to determine a presence or an
absence of an
aneuploidy or a genetic variation of the embryo. In some embodiments, the
aneuploidy
comprises trisomy 13, trisomy 18, trisomy 21, or a sex chromosome aneuploidy.
In some
embodiments, the genetic variation comprises a monogenic variant associated
with a variant
-2-
CA 03200803 2023- 5- 31
WO 2022/119861
PCT/US2021/061287
phenotype. In some embodiments, the variant phenotype comprises being affected
by a disease
or disorder or having an elevated risk of being affected by a disease or
disorder.
100101 In some embodiments, the method further comprises determining a number
of alleles of
the embryo comprising the monogenic variant. In some embodiments, the method
further
comprises determining whether the embryo is affected or at elevated risk of
being affected by
the variant phenotype, unaffected or at reduced risk of being affected by the
variant phenotype,
or a caiiiei of the valiant phenotype, based at least in part on the
determined number of alleles of
the embryo comprising the monogenic variant. In some embodiments, the method
further
comprises computer processing the genomic sequence of the embryo to determine
a risk
distribution of each of a set of phenotypes.
100111 In some embodiments, computer processing the genomic sequence of the
embryo
comprises using a trained machine learning algorithm. In some embodiments, the
trained
machine learning algorithm comprises a neural network, a support vector
machine, a random
forest, a generalized linear model, or a logistic regression.
100121 In some embodiments, the risk distribution for a phenotype of the set
of phenotypes is
determined based at least in part on a combination of at least one of paternal
haplo-blocks
inherited by the embryo, maternal haplo-blocks inherited by the embryo, an
observable paternal
phenotype, and an observable maternal phenotype. In some embodiments, the risk
distribution
for a phenotype of the set of phenotypes is determined based at least in part
on a combination of
the paternal haplo-blocks inherited by the embryo, the maternal haplo-blocks
inherited by the
embryo, the observable paternal phenotype, and the observable maternal
phenotype.
100131 In some embodiments, the method further comprises computer processing
the risk
distributions of the set of phenotypes into a quantitative figure of merit
indicative of an expected
health of an offspring that develops from the embryo. In some embodiments,
each of the risk
distributions of the set of phenotypes contributes a positive expected value,
a negative expected
value, or a zero expected value toward the quantitative figure of merit. In
some embodiments, at
least one of the risk distributions of the set of phenotypes contributes a
positive expected value
toward the quantitative figure of merit. In some embodiments, the quantitative
figure of merit
comprises an expected number of quality adjusted life years of the offspring.
100141 In some embodiments, the method further comprises determining a
quantitative figure of
merit for each of a plurality of embryos. In some embodiments, the
quantitative figures of merit
for the plurality of embryos are determined using a user-selected set of
weights for each of at
least one of the set of phenotypes.
100151 In some embodiments, the method further comprises ordering or ranking
individual
embryos of the plurality of embryos based at least in part on the quantitative
figures of merit for
-3-
CA 03200803 2023- 5- 31
WO 2022/119861
PCT/US2021/061287
the individual embryos. In some embodiments, the method further comprises
selecting an
embryo from among the plurality of embryos based at least in part on the
quantitative figures of
merit for the individual embryos. In some embodiments, the selected embryo is
implanted into a
female subject, or wherein the selected embryo is vitrified, incubated,
cultivated, stored,
investigated, manipulated, treated or discarded. In some embodiments, the
method further
comprises implanting the selected embryo into the female subject.
100161 In some embodiments, the sequencing library in (b) is prepared without
use of nucleic
acid amplification. In some embodiments, the genomic sequence of the embryo is
determined at
an accuracy of at least about 99%, about 99.9%, about 99.99%, about 99.999%,
about
99.9999%, about 99.99999%, or about 99.999999%. In some embodiments, the
genomic
sequence of the embryo is at least 90%, at least 95%, at least 99%, or at
least 99.9% of a whole
genomic sequence of the embryo. In some embodiments, the genomic sequence of
the embryo is
a whole genomic sequence or a substantially whole genomic sequence of the
embryo.
[0017] In some embodiments, the present disclosure provides a computer-
implemented method
for determining a genomic sequence of an embryo, comprising: (a) receiving, by
a computer,
embryo-derived sequence reads of an embryo, wherein the embryo-derived
sequence reads are
generated by sequencing deoxyribonucleic acid (DNA) molecules that are
isolated or derived
from cells obtained or derived from a biopsy sample or a culture sample of the
embryo; (b)
receiving, by the computer, sequence information derived from one or more
parents of the
embryo; and (c) computer processing the embryo-derived sequence reads to
determine the
genomic sequence of the embryo using the sequence information derived from the
one or more
parents of the embryo. In some embodiments, the embryo is produced at least in
part by in vitro
fertilization of a sperm cell from a paternal subject and an egg cell from a
maternal subject.
[0018] In some embodiments, the method further comprises receiving parental-
derived sequence
reads comprising paternal-derived sequence reads from the paternal subject or
maternal-derived
sequence reads from the maternal subject, respectively, and wherein (c)
further comprises
computer processing the embryo-derived sequence reads and the parental-derived
sequence
reads to determine the genomic sequence of the embryo. In some embodiments,
the parental-
derived sequence reads comprise paternal-derived sequence reads from the
paternal subject and
maternal-derived sequence reads from the maternal subject.
[0019] In some embodiments, the method further comprises performing contig
assembly of
individual sequence reads of the embryo-derived sequence reads and the
parental-derived
sequence reads to determine the genomic sequence of the embryo. In some
embodiments, a
portion of the genomic sequence of the embryo located between two breakpoints
is determined
based at least in part on a corresponding genomic sequence obtained from
either the paternal-
-4-
CA 03200803 2023- 5- 31
WO 2022/119861
PCT/US2021/061287
derived sequence reads or the maternal-derived sequence reads. In some
embodiments, a
plurality of portions of the genomic sequence of the embryo located between 3,
4, 5, 6, 7, 8, 9,
10, or more than 10 breakpoints are determined based at least in part on a
corresponding
genomic sequence obtained from either the paternal-derived sequence reads or
the maternal-
derived sequence reads. In some embodiments, a plurality of portions of the
genomic sequence
of the embryo located between 3, 4, 5, 6, 7, 8, 9, 10, or more than 10
breakpoints are determined
based at least in part on a corresponding genomic sequence obtained from the
paternal-derived
sequence reads and the maternal-derived sequence reads.
[0020] In some embodiments, the embryo is a human embryo. In some embodiments,
the
embryo is a blastocyst. In some embodiments, the blastocyst is cultured for 1
day, 2 days, 3
days, 4 days, 5 days, 6 days, 7 days, 8 days, 9 days, or 10 days. In some
embodiments, the
biopsy sample comprises trophectoderm cells of the blastocyst. In some
embodiments, the
culture sample comprises cells or cell-free DNA from culture media.
[0021] In some embodiments, the method further comprises computer processing
at least a
portion of the genomic sequence of the embryo to determine a presence or an
absence of an
ancuploidy or a genetic variation of the embryo. In some embodiments, the
ancuploidy
comprises trisomy 13, trisomy 18, trisomy 21, or a sex chromosome aneuploidy.
In some
embodiments, the genetic variation comprises a monogenic variant associated
with a variant
phenotype. In some embodiments, the variant phenotype comprises being affected
by a disease
or disorder or having an elevated risk of being affected by a disease or
disorder.
[0022] In some embodiments, the method further comprises determining a number
of alleles of
the embryo comprising the monogenic variant. In some embodiments, the method
further
comprises determining whether the embryo is affected or at elevated risk of
being affected by
the variant phenotype, unaffected or at reduced risk of being affected by the
variant phenotype,
or a carrier of the variant phenotype, based at least in part on the
determined number of alleles of
the embryo comprising the monogenic variant.
[0023] In some embodiments, the method further comprises computer processing
the genomic
sequence of the embryo to determine a risk distribution of each of a set of
phenotypes. In some
embodiments, computer processing the genomic sequence of the embryo comprises
using a
trained machine learning algorithm. In some embodiments, the trained machine
learning
algorithm comprises a neural network, a support vector machine, a random
forest, a generalized
linear model, or a logistic regression.
100241 In some embodiments, the risk distribution for a phenotype of the set
of phenotypes is
determined based at least in part on a combination of at least one of paternal
haplo-blocks
inherited by the embryo, maternal haplo-blocks inherited by the embryo, an
observable paternal
-5-
CA 03200803 2023- 5- 31
WO 2022/119861
PCT/US2021/061287
phenotype, and an observable maternal phenotype. In some embodiments, the risk
distribution
for a phenotype of the set of phenotypes is determined based at least in part
on a combination of
the paternal haplo-blocks inherited by the embryo, the maternal haplo-blocks
inherited by the
embryo, the observable paternal phenotype, and the observable maternal
phenotype. In some
embodiments, the method further comprises computer processing the risk
distributions of the set
of phenotypes into a quantitative figure of merit indicative of an expected
health of an offspring
that develops from the embryo. In some embodiments, each of the risk
distributions of the set of
phenotypes contributes a positive expected value, a negative expected value,
or a zero expected
value toward the quantitative figure of merit. In some embodiments, at least
one of the risk
distributions of the set of phenotypes contributes a positive expected value
toward the
quantitative figure of merit.
100251 In some embodiments, the quantitative figure of merit comprises an
expected number of
quality adjusted life years of the offspring. In some embodiments, the method
further comprises
determining a quantitative figure of merit for each of a plurality of embryos.
In some
embodiments, the quantitative figures of merit for the plurality of embryos
are determined using
a user-selected set of weights for each of at least one of the set of
phenotypes.
100261 In some embodiments, the method further comprises ordering or ranking
individual
embryos of the plurality of embryos based at least in part on the quantitative
figures of merit for
the individual embryos. In some embodiments, the method further comprises
selecting an
embryo from among the plurality of embryos based at least in part on the
quantitative figures of
merit for the individual embryos.
100271 In some embodiments, the selected embryo is implanted into a female
subject, or
wherein the selected embryo is vitrified, incubated, cultivated, stored,
investigated, manipulated,
treated or discarded. In some embodiments, the method further comprises
implanting the
selected embryo into the female subject.
100281 In some embodiments, the embryo-derived sequence reads are generated
without use of
nucleic acid amplification. In some embodiments, the genomic sequence of the
embryo is
determined at an accuracy of at least about 99%, about 99.9%, about 99.99%,
about 99.999%,
about 99.9999%, about 99.99999%, or about 99.999999%. In some embodiments, the
genomic
sequence of the embryo is at least 90%, at least 95%, at least 99%, or at
least 99.9% of a whole
genomic sequence of the embryo. In some embodiments, the genomic sequence of
the embryo is
a whole genomic sequence or a substantially whole genomic sequence of the
embryo.
100291 In some embodiments, the present disclosure provides a method for
providing a selection
of an embryo from a set of sibling embryos, comprising: (a) obtaining a first
sequence data set
generated upon sequencing one or more nucleic acid molecules obtained from the
embryo,
-6-
CA 03200803 2023- 5- 31
WO 2022/119861
PCT/US2021/061287
which first sequence data set is not a whole genome of said embryo; (b)
computer processing the
first sequence data set with sequence information obtained from one or more
parents of the
sibling embryos to yield a second sequence data set, which second sequence
data set spans a
greater genomic window than the first sequence data set; and (c) computer
processing the
second sequence data set or derivative thereof to provide the selection of
said embryo from the
set of sibling embryos. In some embodiments, the set of sibling embryos is
produced at least in
part by in vitro fertilization of a set of sperm cells from a paternal subject
and a set of egg cells
from a maternal subject.
[0030] In some embodiments, the method further comprises receiving parental-
derived sequence
reads comprising paternal-derived sequence reads from the paternal subject or
maternal-derived
sequence reads from the maternal subject, respectively, and wherein (c)
further comprises
computer processing the parental-derived sequence reads to provide the
selection of said embryo
from the set of sibling embryos. In some embodiments, the parental-derived
sequence reads
comprise paternal-derived sequence reads from the paternal subject and
maternal-derived
sequence reads from the maternal subject.
[0031] In some embodiments, the method further comprises determining a genomic
sequence of
the embryo, and providing the selection of said embryo from the set of sibling
embryos based at
least in part on the determined genomic sequence of the embryo. In some
embodiments, the
method further comprises performing contig assembly of individual sequence
reads of the
embryo-derived sequence reads and the parental-derived sequence reads to
determine the
genomic sequence of the embryo.
[0032] In some embodiments, a portion of the genomic sequence of the embryo
located between
two breakpoints is determined based at least in part on a corresponding
genomic sequence
obtained from either the paternal-derived sequence reads or the maternal-
derived sequence
reads. In some embodiments, a plurality of portions of the genomic sequence of
the embryo
located between 3, 4, 5, 6, 7, 8, 9, 10, or more than 10 breakpoints are
determined based at least
in part on a corresponding genomic sequence obtained from either the paternal-
derived sequence
reads or the maternal-derived sequence reads. In some embodiments, a plurality
of portions of
the genomic sequence of the embryo located between 3, 4, 5, 6, 7, 8, 9, 10, or
more than 10
breakpoints are determined based at least in part on a corresponding genomic
sequence obtained
from the paternal-derived sequence reads and the maternal-derived sequence
reads.
[0033] In some embodiments, the embryo is a human embryo. In some embodiments,
the
embryo is a blastocyst. In some embodiments, the blastocyst is cultured for 1
day, 2 days, 3
days, 4 days, 5 days, 6 days, 7 days, 8 days, 9 days, or 10 days. In some
embodiments, the
-7-
CA 03200803 2023- 5- 31
WO 2022/119861
PCT/US2021/061287
biopsy sample comprises trophectoderm cells of the blastocyst. In some
embodiments, the
culture sample comprises cells or cell-free DNA from culture media.
[0034] In some embodiments, the method further comprises computer processing
at least a
portion of the genomic sequence of the embryo to determine a presence or an
absence of an
aneuploidy or a genetic variation of the embryo. In some embodiments, the
aneuploidy
comprises trisomy 13, trisomy 18, trisomy 21, or a sex chromosome aneuploidy.
In some
embodiments, the genetic variation comprises a monogenic valiant associated
with a valiant
phenotype. In some embodiments, the variant phenotype comprises being affected
by a disease
or disorder or having an elevated risk of being affected by a disease or
disorder.
[0035] In some embodiments, the method further comprises determining a number
of alleles of
the embryo comprising the monogenic variant. In some embodiments, the method
further
comprises determining whether the embryo is affected or at elevated risk of
being affected by
the variant phenotype, unaffected or at reduced risk of being affected by the
variant phenotype,
or a carrier of the variant phenotype, based at least in part on the
determined number of alleles of
the embryo comprising the monogenic variant.
[0036] In some embodiments, the method further comprises computer processing
the genomic
sequence of the embryo to determine a risk distribution of each of a set of
phenotypes. In some
embodiments, computer processing the genomic sequence of the embryo comprises
using a
trained machine learning algorithm. In some embodiments, the trained machine
learning
algorithm comprises a neural network, a support vector machine, a random
forest, a generalized
linear model, or a logistic regression.
[0037] In some embodiments, the risk distribution for a phenotype of the set
of phenotypes is
determined based at least in part on a combination of at least one of paternal
haplo-blocks
inherited by the embryo, maternal haplo-blocks inherited by the embryo, an
observable paternal
phenotype, and an observable maternal phenotype. In some embodiments, the risk
distribution
for a phenotype of the set of phenotypes is determined based at least in part
on a combination of
the paternal haplo-blocks inherited by the embryo, the maternal haplo-blocks
inherited by the
embryo, the observable paternal phenotype, and the observable maternal
phenotype. In some
embodiments, the method further comprises computer processing the risk
distributions of the set
of phenotypes into a quantitative figure of merit indicative of an expected
health of an offspring
that develops from the embryo.
[0038] In some embodiments, each of the risk distributions of the set of
phenotypes contributes
a positive expected value, a negative expected value, or a zero expected value
toward the
quantitative figure of merit. In some embodiments, at least one of the risk
distributions of the set
of phenotypes contributes a positive expected value toward the quantitative
figure of merit. In
-8-
CA 03200803 2023- 5- 31
WO 2022/119861
PCT/US2021/061287
some embodiments, the quantitative figure of merit comprises an expected
number of quality
adjusted life years of the offspring.
[0039] In some embodiments, the method further comprises further comprising
determining a
quantitative figure of merit for each of a plurality of embryos. In some
embodiments, the
quantitative figures of merit for the plurality of embryos are determined
using a user-selected set
of weights for each of at least one of the set of phenotypes.
[0040] In some embodiments, the method further comprises ordering or ranking
individual
embryos of the plurality of embryos based at least in part on the quantitative
figures of merit for
the individual embryos. In some embodiments, the method further comprises
selecting an
embryo from among the plurality of embryos based at least in part on the
quantitative figures of
merit for the individual embryos. In some embodiments, the selected embryo is
implanted into a
female subject, or wherein the selected embryo is vitrified, incubated,
cultivated, stored,
investigated, manipulated, treated or discarded. In some embodiments, the
method further
comprises implanting the selected embryo into the female subject.
[0041] In some embodiments, the sequencing library in (b) is prepared without
use of nucleic
acid amplification. In some embodiments, the second sequence data set is
determined at an
accuracy of at least about 99%, about 99.9%, about 99.99%, about 99.999%,
about 99.9999%,
about 99.99999%, or about 99.999999%. In some embodiments, the second sequence
data set is
at least 90%, at least 95%, at least 99%, or at least 99.9% of a whole genomic
sequence of the
embryo.
[0042] In some embodiments, the present disclosure provides for a non-
transitory computer-
readable medium comprising machine-executable code that, upon execution by one
or more
computer processors, implements a method for determining a genomic sequence of
an embryo,
the method comprising: (a) receiving embryo-derived sequence reads of an
embryo, wherein the
embryo-derived sequence reads are generated by sequencing deoxyribonucleic
acid (DNA)
molecules that are isolated or derived from cells obtained or derived from a
biopsy sample or a
culture sample of the embryo; (b) receiving sequence information derived from
one or more
parents of the embryo; and (c) processing the embryo-derived sequence reads to
determine the
genomic sequence of the embryo using the sequence information derived from the
one or more
parents of the embryo.
[0043] In some embodiments, the present disclosure provides a method for a non-
transitory
computer-readable medium comprising machine-executable code that, upon
execution by one or
more computer processors, implements a method for providing a selection of an
embryo from a
set of sibling embryos, the method comprising: (a) obtaining a first sequence
data set generated
upon sequencing one or more nucleic acid molecules obtained from the embryo,
which first
-9-
CA 03200803 2023- 5- 31
WO 2022/119861
PCT/US2021/061287
sequence data set is not a whole genome of said embryo; (b) processing the
first sequence data
set with sequence information obtained from one or more parents of the sibling
embryos to yield
a second sequence data set, which second sequence data set spans a greater
genomic window
than the first sequence data set; and (c) processing the second sequence data
set or derivative
thereof to provide the selection of said embryo from the set of sibling
embryos.
100441 In some embodiments, the present disclosure provides a method for
providing a selection
of an embryo from a set of sibling embryos, comprising analyzing embryos from
the set of
embryos to (i) calculate a quality adjusted life expectancy of the embryos,
and (ii) provide the
selection of the embryo from the set of embryos, which embryo has a highest
quality adjusted
life expectancy among other embryos of the set of embryos as determined at an
accuracy greater
than about 80%. In some embodiments, embryos are selected based at least in
part on a
combination of at least one of paternal haplo-blocks inherited by the embryo,
maternal haplo-
blocks inherited by the embryo, an observable paternal phenotype, and an
observable maternal
phenotype. In some embodiments, embryos are selected based at least in part on
a combination
of the paternal haplo-blocks inherited by the embryo, the maternal haplo-
blocks inherited by the
embryo, the observable paternal phenotype, and the observable maternal
phenotype.
INCORPORATION BY REFERENCE
100451 All publications, patents, and patent applications mentioned
in this specification are
herein incorporated by reference to the same extent as if each individual
publication, patent, or
patent application was specifically and individually indicated to be
incorporated by reference.
To the extent publications and patents or patent applications incorporated by
reference
contradict the disclosure contained in the specification, the specification is
intended to supersede
and/or take precedence over any such contradictory material.
BRIEF DESCRIPTION OF THE DRAWINGS
[0046] The novel features of the invention are set forth with
particularity in the appended
claims. A better understanding of the features and advantages of the present
invention will be
obtained by reference to the following detailed description that sets forth
illustrative
embodiments, in which the principles of the invention are utilized, and the
accompanying
drawings (also "Figure" and "FIG." herein), of which.
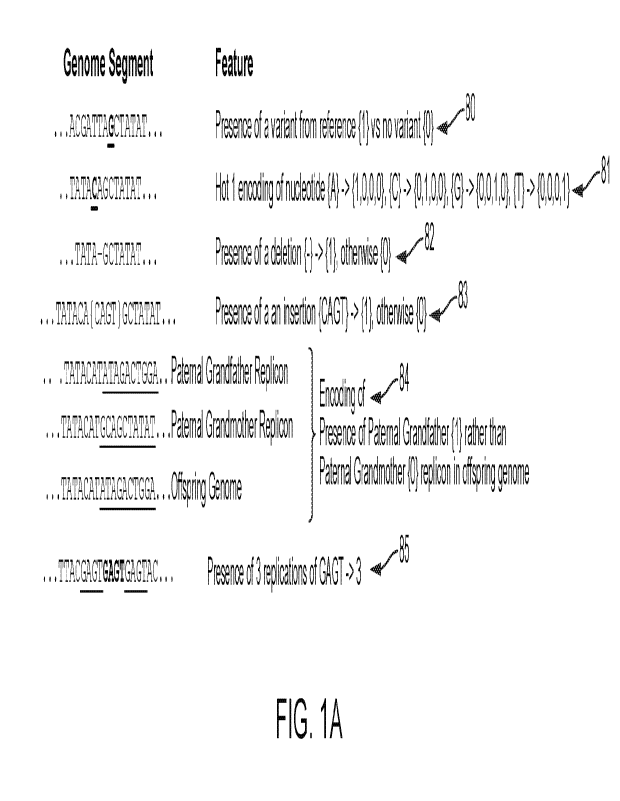
100471 FIG. lA illustrates sample mappings from genomes represented
as reference
sequence segments, to genomic properties.
100481 FIG. 1B illustrates genome segmentation by replicon.
-10-
CA 03200803 2023- 5- 31
WO 2022/119861
PCT/US2021/061287
[0049] FIG. 2 provides a flowchart illustrating one example of a
method by which a model
and associated values may be generated.
[0050] FIG. 3 provides a flowchart illustrating one example of a
method by which models
may be applied to generate simplified descriptions of genomes
[0051] FIG. 4A represents the statistical relationship between
organism genomes and
phenotype risk scores.
[0052] FIG. 4B represents the statistical relationship between
organism genomes that
underlies methods and systems of the present disclosure.
[0053] FIG. 4C describes a method used to identify phenotype risk
scores from organism
genomes.
[0054] FIG. 5 provides a flowchart illustrating one example of a
method by which models
may be developed that may be used in methods and systems of the present
disclosure.
[0055] FIG. 6 provides a flowchart illustrating one example of a
method by which models
may be applied using methods and systems of the present disclosure to generate
improved
phenotypic risk scores.
[0056] FIG. 7 illustrates a method for generating and applying
small variant analysis.
[0057] FIG. 8 shows an example of the application of replicons to
develop association
studies and risk estimates.
[0058] FIG. 9 shows a computer system that is programmed or
otherwise configured to
implement methods provided herein
[0059] FIG. 10 illustrates a method for identifying embryonic
genomic sequences,
determining risk distributions from the genomic sequences and other
information, and
aggregating risk distributions into a report for use in IVF.
[0060] In these drawings, dashed lines represent elements that may
be present in some
described embodiments but absent in others. Diagonal hashing represents a
latent (unobserved)
set of variables in a statistical model while a clear background represents an
observed set of
variables. A dotted outline represents a process which may be repeated in the
course of
developing an output.
DETAILED DESCRIPTION
[0061] Nearly every organism has a genetic code that is shared by
all of the cells in its body.
This code may be identified using various approaches with single-molecule
precision While this
code may be a primary determinant of species separation and heritable features
within a species,
the mapping from genome to identifiable phenotypic features may be poorly
understood
[0062] Genomes of individuals within an animal species may be
similar, allowing for the
creation of a reference genome for each species that allows the
characterization of an individual
-11-
CA 03200803 2023- 5- 31
WO 2022/119861
PCT/US2021/061287
in terms of deviations from that reference. For example, hg 8, hg 9, and
GRCh38, are three
progressively refined versions of the human genomic reference. Each such
reference may define
a coordinate system, which allows for the identification of genomic properties
associated with
positions in that coordinate system.
100631 Observable traits in an organism, called phenotypes, can be
transmitted from parents
to offspring. A central mechanism for inheritance of such traits may be the
collection of
genomic material that is transferred from parents to offspring during
procreation. In mammalian
genomes, organisms generally contain two copies of each chromosome, one
derived from each
parent. For procreation, one copy of each chromosome is provided from each
parent to the child.
However, the specific chromosome provided may be a mixture of the genetic
material of both
chromosomes possessed by that parent, via a process called crossover,
sometimes referred to as
recombination. As a result, each embryo may inherit a single chromosome from
each parent, but
the chromosome inherited from a parent is potentially a mosaic composed of the
genetic
material inherited from that parent's own parents (the embryo's grandparents)
(FIG. 1A-B).
100641 Humans are a biallelic species with normal cells having 22
pairs of autosomal
chromosomes and one pair of sex chromosomes. FIG. 1B, 83 shows labeling of
each
chromosome identifier in a central circle roughly corresponding to a
centromere. Each
chromosome is comprised of a pair of chromatid arms, and may be homologous in
the cases of
the autosome and the female XX chromosomes. One copy of each chromatid element
may be
inherited from each parent, and matching elements from each parent may fuse to
make a
chromosome comprised of one chromatid from each parent. However, the specific
chromatid
inherited from a parent is a mosaic of their own chromosome pair (FIG. 1B). In
FIG. 1B, 80 the
paternal element is a single chromatid, composed of a mosaic of the two
paternal chromatids
(FIG. 1B, 81). In some cases, a chromatid element is passed directly from a
whole parental
chromatid (e.g. FIG. 1B, 84 or the Y sex chromosome). Crossover allows for
these mosaic
patterns, and typically between 0 and 10 such crossovers may occur in each
chromatid arm,
meaning that a single chromatid inherited from a single parent, is actually a
mosaic composed of
the chromatid pair inherited by that parent from their own parents. Each
contiguous chromatid
section inherited from a single parent is referred to herein as a replicon.
This crossover serves as
a major source of diversity within a species and occurs in a wide variety of
animal and plant
species. In humans, there may be between 15 and 150 such crossovers per
offspring. This
mosaic, combined with the selection of one chromatid from each parent, seems
to provide the
primary source of genomic variation in traits among offspring from a single
pair of parents.
100651 The combinations of chromosomes, from parents, mosaics from
grandparents, and
variation inherited from neither parent (e.g., a de-novo mutation) gives rise
to genetic diversity
-12-
CA 03200803 2023- 5- 31
WO 2022/119861
PCT/US2021/061287
among full siblings. However, the restriction on variation as primarily
sourcing from the parents
limited genomic material provides similarity shared by related family members.
100661 The genomic sequence of an embryo composed of fewer than a
hundred cells may be
estimated by combining a small amount of embryonic genetic material with a
larger amount of
parental material. However, the way in which the particular combinations of
parental genomic
material manifest as phenotypes may not be clear for many phenotypes. Some
genomic
variations may cause specific variant phenotypes or diseases in humans such as
Huntington's
disease, Huntington's chorea, and Marfan Syndrome (autosomal dominant diseases
which
requires only one copy of the pathogenic allele); cystic fibrosis and Tay-
Sachs disease
(autosomal recessive diseases which require two copies of the pathogenic
allele); or Down
Syndrome and Edwards Syndrome (diseases caused by aneuploidy, having missing
or extra
chromosomes). Some aneuploidies may be trisomies, wherein there are three
copies of a gene
(e.g. trisomy 13, trisomy 18, trisomy 21, or a sex chromosome trisomy). Some
aneuploidies may
be monosomies, wherein there is one copy of a gene (e.g., a sex chromosome
monosomy). Some
genomic variations may cause monogenic phenotypes, i.e., phenotypes determined
by the alleles
of one gene. Alternatively, some genomic variations may cause polygcnic
phenotypes, i.e.,
phenotypes determined by the alleles of multiple genes.
100671 While phenotypes include the manifestation of or
predisposition for diseases, they
also include non-pathological traits such as weight, height, facial shape, and
skin tone. Some
genomic analysis techniques (e.g., polygenic risk score (PRS), genome-wide
association studies
(GWAS), etc.) may associate individual genomic properties or patterns of
genomic properties
with observable phenotypes and are also used as methods for associating
genomic features with
a propensity towards individual phenotypes.
[0068] When direct causal relations between genes and phenotypes
are not known,
association studies may be performed to relate associated patterns of genomic
properties to
phenotypes. For example, to obtain a PRS, a linear map can be created by
taking known variants
of a human reference genome (e.g., hg19), converting them to binary values,
placing statistical
weight on the presence of each particular variant, and determining a numerical
score for each
phenotypic variation or set of phenotypic variations. Creating such a linear
map simplifies
genetic analysis by associating the set of phenotypic variations with a
numerical score, where
that score represents the risk of obtaining the phenotype, given the set of
variations. The scoring
may be calibrated in such a way that the score has a value between 0.0 and 1.0
(e.g. by applying
a Logistic link function in a generalized linear model), and which serves as
an estimate of the
risk of observing a phenotype conditioned on observing the set of variations
-13-
CA 03200803 2023- 5- 31
WO 2022/119861
PCT/US2021/061287
100691 Phenotype prediction and association studies may focus
primarily on single
nucleotide variations and small structural arrangements in GWAS and PRS
studies, rather than
replicon inheritance. While some elements of lineage aware PRS / GWAS analyses
have been
documented, they may be focused on reducing spurious correlations within
populations rather
than the essential mechanism of replicon recombination. Such recombination
provides powerful
genomic variation that drives phenotype variation, particularly with related
families. Over the
number of all human replicons, estimates of large-scale replicon segments
range from thousands
to tens of thousands, far lower than the tens of millions of small variations
which occur. The
combination of greater generational variation coupled with lower numbers of
potentially
confounding cofactors promises statistical models of far greater predictive
power and predictive
utility.
100701 Using PRS and GWAS, many scores and association maps may be
separately created
for various phenotypes of interest. When a single genome is analyzed, many PRS
analyses may
be generated, each representing a risk associated with a particular phenotype
and/or condition.
However, each PRS may represent a different assessment, and provide a
different level of
confidence. Furthermore, the phenotypes themselves may have varying levels of
relevance
depending of the circumstances for using a PRS. Non-limiting examples of
situations wherein
decisions are made between different sets of PRS analyses include when a
prospective breeder is
seeking to create more healthy livestock; when a genomic edit is being
considered, and a most
favorable outcome phenotype is desired; or when a prospective human parent is
selecting from
among embryos generated during IVF.
100711 While genomic features may represent a propensity or bias in
the development of a
phenotype (e.g., the presence of a phenotype or the magnitude of a
phenotypes), development
and environmental interaction also affect phenotype emergence.
100721 Both PRS and GWAS techniques aggregate across environmental
conditions and
ignore specific details of subjects' environment which can manifest
biologically via epigenetics.
PRS and GWAS techniques may be applied to a variety of demographics and
species, yet they
are poor individual predictors for complex traits such as human adult height
or weight. Presence
or absence of a disease may be endemic to a genomic condition (e.g.
Huntington's Disease, with
high penetrance), or alternatively may be triggered by an environmental
condition, also
influenced by innate genomic susceptibility, as in the case of lactose-based
gastronomic distress.
100731 As related offspring are often exposed to similar
environmental conditions as the
parents, the presence of a close familial phenotype (e.g. a parental
phenotype) may be
informative on a broad range of environmental and developmental factors.
Parental phenotype
may, therefore, may serve as, e.g., a proxy, to estimate actual risk of a
descendent phenotype.
-14-
CA 03200803 2023- 5- 31
WO 2022/119861
PCT/US2021/061287
100741 Assisted reproductive technologies allow for the
identification of an embryonic
genome prior to the implantation, development, and rearing of an organism to
maturity.
Alternatively, embryonic genomes can be identified for purposes of
vitrification, i.e., the process
whereby embryos or eggs are frozen and stored for later use. Alternatively,
the embryonic
genomes can be identified for purposes of incubation, cultivation, storage,
investigation,
manipulation, treatment, or disposal. The ability to interpret an embryonic
genome may allow
selection based on expected traits such as disease resistance. A clearer
understanding of the
relationship between the sequenced genome and phenotypic traits may be of
tremendous value
in a diverse range of fields including the ability to cultivate desirable
traits in livestock without
the cost and delay of having to raise livestock to maturity; the assessment of
candidate
embryonic genomes; the assessment of disease-risk phenotypes in humans; the
prediction of
where make edits in human cells in order to treat or correct genetic diseases;
or the assessment
of human characteristics during assisted reproduction to avoid diseases in
offspring and favor
healthy traits.
100751 A central method in understanding the mapping between traits
and genotypes
involves identifying specific phenotypic variation associated with specific
gcnomic variation.
However, species genomes have limited variation. For example, less than 10% of
the human
genome (estimates may range from 2-8%) is expected to be under selective
pressure associated
with genomic function. Novel genomic variation is introduced slowly into a
species, with only
20-100 variants (in a genome of approximately 3 billion positions) introduced
in each human
generation that are not attributable to either parent. Many variations in
biologically active
regions are never observed because they introduce lethal changes, and embryos
inheriting them
never mature to the point where the novel variations are measured. Considering
50 variants per
generation, with only 10% in functional areas, that leaves only 5 functional
variants introduced
per generation, assuming a random distribution of variation. However,
variation is not observed
uniformly across the genome, and the number of impactful variants per
generation in functional
areas may be substantially lower. Over a course of millions of years, and many
thousands of
generations, such random mutation introduces variation that can be associated
with survivable
phenotypic properties. The absence of variation that might give rise to lethal
changes becomes
more apparent with time and diversity in population and has been a popular
topic of
contemporary literature. In humans, single nucleotide polymorphism databases
(e.g., db SNP)
provide approximately 40.6 million sites in the autosomal genome that are
subject to "common"
variation, and which represent about 1.4% of all genomic positions. Common
variation is
variation that is expected to occur in more than 1% of the population. When
also considering
rare variants, this number can grow by a factor of more than 10, up to and
including more than
-15-
CA 03200803 2023- 5- 31
WO 2022/119861
PCT/US2021/061287
20% of all genomic positions. With approximately 2.8 billion autosomal genomic
positions
identified in human reference genomes (e.g., hg19), this leads to a
bewildering and statistically
challenging problem of predictively mapping patterns of variations to observed
phenotypes.
However, there is a second source of variation and constraint that can operate
in multi-allelic
species such as humans. This form of variation is called is meiotic
recombination. Meiotic
recombination occurs at reproduction, and is highly constrained along the
genome, while at the
same time being more common than random mutation in each reproductive
generation.
100761 In an assisted-fertility vetting, it may be desirable to
understand the predisposition
towards phenotypes so embryos can be ranked according to risks of desired and
undesired
phenotypes, such as predisposition towards disease (or resistance to
diseases). Such genomic
analysis of phenotypes has a variety of uses. In a medical or scientific
context, the ability to
prioritize genetically altered cells for treatment, investigation, or
scientific inquiry may yield
tremendous increases in safety and efficiency. In a livestock setting this
might be used to more
efficiently breed healthier and larger cattle or faster racehorses. In a human
assisted reproduction
(particularly In-Vitro Fertilization or IVF) it might be used to help reduce
indications of diseases
or select predisposition towards relevant traits for family balancing.
100771 At present, human-assisted reproduction genomic tests for
embryos generated during
assisted reproduction in humans may favor tests for embryonic viability,
rather than eventual
adult health. However, genomic medicine has developed a range of models, each
accepting a
collection of genomic properties and identifying a risk of a specific
phenotype or small
collection of phenotypes. Many such tests are statically significant but have
low individual
predictive power. If these tests are collectively applied to the genome
inferred from an embryo, a
collection of risk scores may be generated. However, this collection of scores
(potentially
hundreds, thousands, or more) leaves a prospective parent with a large array
of biases and traits
to consider, without a method of aggregating these scores into a small number
of classes that a
parent might select away from, such as predisposition towards worse mental
health or a
predisposition towards lowered physical health.
100781 In some embodiments, reduction of collections of phenotypic
risk scores to simpler
traits can be considered as a reduction from a large collections of scores to
a small collection of
properties. For example, the Meyer-Briggs type indicator (MBTI) test
summarizes personalities
according to a set of four types, each type having a score from a low value
such as 0
(representing one pole of a trait such as introversion) to a high vale
representing the opposing
pole of the trait (such as extraversion).
100791 In some embodiments, reduction of collections allows mapping
of PRS to a single
score which can be an estimate of some desired figure of merit, such as
expected lifespan or
-16-
CA 03200803 2023- 5- 31
WO 2022/119861
PCT/US2021/061287
medical quality of life, allowing the ordered ranking of each genome according
to that score. In
the case that PRS represent risks of disease an aggregate being assessed for
IVF, the figure of
merit may represent overall expected resistance or susceptibility to disease,
and the best score
may be taken as most likely to be healthy and selected for implantation.
100801 In some embodiments, a more definitive measure may aggregate
all of the various
risks score into a single measure (or figure of merit) as an estimate of
embryonic quality that can
rank available embryos for implantation. While this embodiment focuses on
human assisted
reproduction, this technology can also be used to improve efficiency in
breeding stock or sport
animals by selecting and developing the most promising embryos. Furthermore,
this technology
can be used in the development of desirable characteristics in cell lines by
assessing genomes
resulting from genomic edits, assessing likely edit sites, or selecting cell
culture that are most
likely to have desirable profiles of phenotype qualities including immune
response, antigen
compatibility, or native disease resistance.
100811 What is needed to improve the individual predictive power of
phenotypic risk scores
(e.g., polygenic risk scores), is a way of integrating both the genomic
propensity for a phenotype
along with the environmental factors that may impact the manifestation of that
phenotype.
100821 The present disclosure provides a method and system for
simplifying the comparison
between genomes, which may comprise a defined collection of genomic properties
with each
collection representing a single genome, a number of risk score models for
phenotypes. In some
embodiments, each risk score model maps the collection of genomic properties
to a weight
distribution model representing a projected phenotype distribution, and a
dimension reduction
model for mapping said collection of phenotype distributions to a simpler
collection of trait
distributions. In the case that the simpler collection of trait distributions
is univariate, a centrality
parameter may be generated for the distribution and associated with the
corresponding genome.
By assessing each of a collection of genomes according to this measure,
comparisons among
genomes may be simplified to comparisons of simpler traits. In the case that
each trait
distribution may be reduced single centrality parameter (as a figure of merit)
the genomes may
be ranked in order of decreasing merit with the most meritorious selected for
further use. In
some embodiments, each genome may belong to an embryo, genomic properties are
variations
from a reference, and risk scores represent standard PRS for diseases
associated with each
collection of variants. In this case, the figure of merit may be considered a
medical quality of life
model and a single value for expected quality of life derived for each genome
by summing the
individual expected contribution to quality of life from each disease across
the polygenic risk of
that disease.
-17-
CA 03200803 2023- 5- 31
WO 2022/119861
PCT/US2021/061287
100831 The present disclosure also provides methods and systems
that address inclusion of
environmental information such as parental phenotypes along with embryonic
genotype in the
risk assessment for eventual development of a phenotype. In some embodiments,
methods and
systems of the present disclosure may be applied to embryo analysis for
assisted reproduction in
humans via IVF. In particular, environmental exposures of related organisms
may be
incorporated along with the genome of an organism to improve the adaptability
of phenotype
risk scores over those generated solely from an organism's genome. In some
embodiments, this
allows for improved identification of phenotypic risks for genomes associated
with embryos by
incorporating phenotype information of parents. In some embodiments, the
genotype risk scores
may be used for human assisted reproduction, by improving the predictive power
of phenotype
risk scores, allowing prospective parents more information in the selection of
which embryos to
implant.
100841 The present disclosure provides methods for incorporating
environmental
information into the process of assessing the likelihood of phenotypes
manifesting from an
organismal genome. Environmental information is incorporated along with
genomic properties
of a related set of genomes and a target genome into a statistical model, said
model accepting a
target genome, related genomes, and a collection of related environmental
values to produce a
collection of risk scores representing a distribution over identified target
phenotypes. In some
embodiments, a joint distribution is produced allowing the calculation of a
weight distribution
for each target phenotype in each environmental condition. In other
embodiments, phenotypes of
related genomes serve as an informative proxy for external environmental
factors that have not
been explicitly identified. In some embodiments, this analysis might be
applied to assisted
reproductive technologies to combine parental phenotype information with
embryonic genome
properties to estimate risk of phenotype development as the embryo develops.
100851 The methods and systems of the present disclosure may
incorporate small variations
into replicon-based variational analysis. In some embodiments, this allows for
improved
identification of phenotypic risks for genomes associated with cell-lines and
embryos, which
may further be used to develop medical tests and treatments based on selection
and genome
editing methods. In some embodiments, the identified phenotype risk scores may
be used for
human assisted reproduction, by allowing prospective parents more information
in the selection
of which embryos to implant. The present disclosure provides a method and
system for
employing the biology of crossover during reproduction to infer phenotypes
from primary
genomic sequence. By considering the primary source of short-term genomic
variation to be
crossover and recombination during reproduction, crossover segments called
replicons are
identified and employed to characterize organismal phenotypes. A replicon-
based phenotype
-18-
CA 03200803 2023- 5- 31
WO 2022/119861
PCT/US2021/061287
risk score is developed and extended to include small-structural variants that
may be relevant to
phenotypes when considered conditionally upon replicons. In some embodiments,
a joint
distribution is produced allowing the calculation of a weight distribution for
each target
phenotype conditioned on identification of replicons, or replicons combined
with as small
variants. Descriptions of processes for identifying replicon clusters,
sometimes associated with
haplotypes, and in developing models from a repli con segmentation of a genome
are provided.
Also provided are methods for developing such models from training sets
including joint
replicons and small variations. In some embodiments, phenotypes are derived
from collections
of distribution weights over phenotypes.
100861 As used in the specification and claims, the singular form
"a-, "an-, and "the"
include plural references unless the context clearly dictates otherwise. For
example, the term "a
nucleic acid" includes a plurality of nucleic acids, including mixtures
thereof.
100871 As used herein, the term "subject," generally refers to an
entity or a medium that has
testable or detectable genetic information. A subject can be a person,
individual, or patient. A
subject can be a vertebrate, such as, for example, a mammal. Non-limiting
examples of
mammals include humans, simians, farm animals, sport animals, rodents, and
pets. As used
herein, the term -embryo" generally refers to an unborn or unhatched offspring
in the process of
development. An embryo can refer to the product of fertilization or other
approach of sexual
reproduction as well as the products of asexual reproduction. In some
embodiments, an embryo
can be produced by fertilization of an egg with a sperm. In some embodiments,
the embryo is
produced by somatic cell nuclear transfer, parthenogenesis, androgenesis, or
other asexual
techniques. An embryo can refer to a zygote, a two-cell stage embryo, a four-
cell stage embryo,
an eight-cell stage embryo, a morula, or a blastocyst or blastula. An embryo
can be produced in
vivo or in vitro.
100881 As used herein, the term "sequence read" refers to a DNA
fragment for use in genetic
or genomic sequencing. In some cases, sequence reads can be used to create
sequencing
libraries, which can be designed to interact with various sequencing
platforms. In some cases,
contigs, series of overlapping DNA fragments or reads, can be used to create
sequencing
libraries.
100891 As used herein, the term "haplotype" refers to a set of DNA
variations or
polymorphisms that tend to be inherited together. A haplotype can be a
combination of alleles.
Alternatively, a haplotype can be a set of single nucleotide polymorphisms
(SNPs) found on the
same chromosome. A haplotype block, or haplo-block, is a region in which there
is historically
less genetic recombination. Haplo-blocks may have only a small number of
distinct haplotypes.
Genomic Samples
-19-
CA 03200803 2023- 5- 31
WO 2022/119861
PCT/US2021/061287
100901 Embryonic, parental, and other genomes can be obtained
through collection of
genetic material. In some embodiments, the genetic material is obtained from
blood, serum,
plasma, sweat, hair, tears, urine, or tissue. Techniques for obtaining samples
from a subject
include, for example, obtaining samples by a mouth swab or a mouth wash,
drawing blood, and
obtaining a biopsy. In some cases, the genetic material is obtained from a
biopsy, e.g., an
embryo biopsy from the trophectoderm of a blastocyst. Isolating components of
fluid or tissue
samples (e.g., cells or RNA or DNA) may be accomplished using a variety of
techniques. After
the sample is obtained, it may be further processed to enrich for or purify
genomic material.
100911 If a sample (e.g., biopsy sample or culture sample) is
treated to extract
polynucleotides, such as from cells in a sample, a variety of extraction
methods are
available. For example, nucleic acids can be purified by organic extraction
with phenol,
phenol/chloroform/isoamyl alcohol, or similar formulations, including TRIzol
and TriReagent.
Other non-limiting examples of extraction techniques include: (1) organic
extraction followed
by ethanol precipitation, e.g., using a phenol/chloroform organic reagent
(Ausubel et al., 1993,
which is entirely incorporated herein by reference), with or without the use
of an automated
nucleic acid extractor, e.g., the Model 341 DNA Extractor available from
Applied Biosystcms
(Foster City, Calif); (2) stationary phase adsorption methods (U.S. Pat. No.
5,234,809; Walsh et
al., 1991, each of which is entirely incorporated herein by reference); and
(3) salt-induced
nucleic acid precipitation methods (Miller et al., (1988) which is entirely
incorporated herein by
reference), such precipitation methods being typically referred to as "salting-
out"
methods. Another example of nucleic acid isolation and/or purification
includes the use of
magnetic particles to which nucleic acids can specifically or non-specifically
bind, followed by
isolation of the beads using a magnet, and washing and eluting the nucleic
acids from the beads
(see e.g. U.S. Pat. No. 5,705,628, which is entirely incorporated herein by
reference). In some
embodiments, the above isolation methods may be preceded by an enzyme
digestion step to help
eliminate unwanted protein from the sample, e.g., digestion with proteinase K,
or other like
proteases. See, e.g., U.S. Pat. No. 7,001,724, which is entirely incorporated
herein by reference.
If desired, RNase inhibitors may be added to the lysis buffer. For certain
cell or sample types, it
may be desirable to add a protein denaturation/digestion step to the protocol.
Purification
methods may be directed to isolate DNA, RNA, or both. When both DNA and RNA
are isolated
together during or subsequent to an extraction procedure, further steps may be
employed to
purify one or both separately from the other. Sub-fractions of extracted
nucleic acids can also be
generated, for example, purification by size, sequence, or other physical or
chemical
characteristic. In addition to an initial nucleic acid isolation step,
purification of nucleic acids
can be performed after any step in the disclosed methods, such as to remove
excess or unwanted
-20-
CA 03200803 2023- 5- 31
WO 2022/119861
PCT/US2021/061287
reagents, reactants, or products. A variety of methods for determining the
amount and/or purity
of nucleic acids in a sample are available, such as by absorbance (e.g.
absorbance of light at 260
nm, 280 nm, and a ratio of these) and detection of a label (e.g. fluorescent
dyes and intercalating
agents, such as SYBR green, SYBR blue, DAPI, propidium iodine, Hoechst stain,
SYBR gold,
ethidium bromide).
Genomic Properties
100921 Genomic properties, also referred to as genomic features,
are characteristics of a
genomic sequence, that may be aligned to a reference coordinate system for a
particular species
(e.g. hg19 for humans). The identification of genomic properties is often
associated with a-priori
scientific belief that such properties may be informative about organism
phenotypes. Properties
may be specifically identifiable as present or absent or may be represented as
a weight or a
probability of being present in the presence of uncertainty.
100931 Mapping these properties to numeric values allows for
inclusion in models that
require numeric values as inputs. Without limitation, some such mappings
include nucleotide
(ACGT) at each genomic position, potentially encoded as hot-one features (FIG
1A, 81);
presence or type of variant from reference genome (e.g. hg19) at individual or
conserved
genomic positions (FIG 1A, 80); presence of a deletion (FIG 1A, 82); presence
of an insertion
(FIG Al, 83); a replicon inheritance source (FIG 1A, 84); an identified copy
number variation
(encoded by binary presence 10,11) or a copy number count (FIG 1A, 85).
Replications may
include much longer sequences of replicated DNA.
Quantification of Phenotypes
100941 A phenotype can be a discrete phenotype. A discrete or
discontinuous phenotype is a
phenotype that is controlled by one or a small number of genes. A discrete
phenotype can be
controlled by at least about 1, 2, 3, 4, 5, 6, 7, 8, 9, or 10 genes. Discreet
phenotypes may have a
small number of alleles and can have at least about 1, 2, 3, 4, 5, 6, 7, 8, 9,
or 10 alleles. A non-
limiting example of a discrete phenotype is the shape of pea seeds: smooth or
wrinkled. Another
non-limiting example of a discrete phenotype is the presence or absence of
Type I diabetes.
100951 A phenotype can be a continuous phenotype. A continuous
phenotype is a phenotype
that varies along a continuum in a population. Non-limiting examples of
continuous phenotypes
include height, blood pressure, reaction time, and learning ability.
100961 Consider a phenotype of interest (ph). The phenotype may be
discrete such as a
binary variable representing, for example, the presence or absence of Type I
diabetes at age 3, so
that (ph F {OM) where ph = 0 represents the absence of the phenotype and ph =
1 represents
the presence of the phenotype.
-21 -
CA 03200803 2023- 5- 31
WO 2022/119861
PCT/US2021/061287
[0097] Also consider a distribution of weights (W) across possible
values of the phenotype
(W 1ph->11R) These weights may be non-negative and normalized to 1, making
them like
probabilities Vph W (ph) 0 and E ph W (ph) = 1. However, weight need not be so
normalized
as per the weights in conditional random fields. In conditional random fields,
weights are
aggregated a normalized according to a "partition function" (Z) to form
probabilities.
Mappin2 Phenotype Risk Scores to a Fi2ure of Merit
100981 rf he process described herein can reduce complex genomic
properties of each embryo
in a collection, which may number in the millions, to a single figure of merit
that may be used to
rank each member of the collection. Methods and systems of the present
disclosure may be
applicable to the ranking of embryos generated during assisted fertility, by
ranking each of
embryo's associated genomic properties, so the most highly ranked embryo(s)
can be prioritized
for implantation.
100991 Considering a collection of numbered phenotypes Ph (FIG. 2-
3, 51) where a
particular phenotype enumerated with index i referred to as pi such that pi E
Ph, and further a
set of genomic properties G (FIG. 3, H) which can be derived from a Specified
Genome (FIG.
3, 10) along with a collection of risk models at least one for each phenotype
pi (FIG. 2-3, 55)
which maps the genome into a real number (Wi I ¨> 1R). An example of weighting
is a
Polygenic Risk Score (PRS) model (one type of Phenotype Risk Model generating
one type of
Phenotype Risk Score) that maps a collection of genomic variants to a
probability of phenotype
presence. For each genome G, Wi can be used to map that genome to a collection
of weights
(FIG. 3, 12), one for each phenotype (FIG. 2, 57 and FIG. 3, 13). A PRS
applies a linkage
function that to maps the sum of the weights to statistical measure, such as
probability of
observation of the phenotype or odds ratio.
101001 An example linkage function to one dimension Dilpi ¨> IR
might be reduction in life
expectation due to a phenotype, such as a disease. The single measure of
impact of genome on
expected longevity Va(G) can be assessed as:
Va(G) =
W1(P11G) Di(Pi) /1Wi(P JIG)
iEPhenotypes
101011 In the case that the weighting Wi is a probability, Ei
W1(p11G) = 1 and the value of
the genome may be assessed [Fig 3, 16] as
Võ(G) =
W(PIG)D(pt)
iEPhenotypes
101021 In the case that separate per-phenotype measures for quality
of life (medical and
social measures are available) (FIG. 3, 60) quality of life can be accessed
via a similar formula
-22-
CA 03200803 2023- 5- 31
WO 2022/119861
PCT/US2021/061287
yielding V(G). Either of these figures of merit (FIG. 2-3, 58) may be used to
rank a variety of
genomes Yj E G, or a composite 1'(g) may be developed. A natural measure for
as Mgt) =
Va(gi) * V(g) measuring expected change in quality of life multiplied by life
expectancy as a
number of years experiencing the expected quality change (FIG. 3, 16). For
example, this
method may consider impacts that may be positive or negative, for example
wherein a first trait
such as disease resistance may increase quality adjusted life years, and a
second trait such as
disease susceptibility, may decrease it. Positive and negative traits may be
incorporated by using
the sign of a weight (not possible when weights are probabilities) or,
alternatively, by adjusting
the sign of the impact measurement, D to reflect positive or negative
contributions.
Embryos/cells/treatments/genomic modifications each with an expected genome g
can be
ranked according to the single value V(g) E IR for investigation with the
highest ranking
investigated first. This method replaces a profusion of diverse phenotype
risks, with a single
more comprehensible measure of quality.
101031 An alternative measure of quality might be considered
proclivity to produce
offspring, which in turn produce further offspring. The various phenotype
weights that might be
inferred from genomic information are intrinsically aggregated by the process
of natural
selection and assessed together via the historical impact on procreative
fitness, which is in turn
estimated by various models of mutation, recombination, and heritability; and
inferred using
observed allele frequencies across a species population, or across related
diverged species (e.g.
primates or eutherian mammals). For a particular reference genome for a
species, such as hg19
(human) or GRCm39 (mouse), the selective pressure at each genomic position in
the reference
may be inferred across populations of individuals within each species (FIG. 2-
3, 50). Methods
such as phastCons and phyloP provide such a score at each genomic position for
various
collections of related organisms. A procreative phenotype score can by
generated by aggregating
the conservations scores at each genomic position associated with the
phenotype (FIG. 3, 12).
101041 For example, a polygenic risk score (PRS) is developed which
creates a generalized
linear mapping between variation at identified genomic position and the risk
of observing a
related phenotype; this score can be modified by multiplying every nonzero
linear coefficient of
the PRS, by a selective pressure measurement associated with the positions
(FIG. 3, 12). This
creates a weighted measurement of risk biased towards those positions with
higher tendencies to
be conserved. In some embodiments, every genomic position may be assigned a 0
or a 1 by
assigning all genomic positions with phyloP conservation scores in the top
fifth percentile (top
5% of all scores) the value 1, and the rest 0; then a PRS may be generated
from only those
positions assigned a 1. For human assessment, eutherian (placental) mammal
phyloP scores
mapped to hg19 might be used.
-23-
CA 03200803 2023- 5- 31
WO 2022/119861
PCT/US2021/061287
[0105] Four figures of merit are offered as examples of how
collections of risk scores might
be simplified by identifying expected impact of risk profile on that figure of
merit. These figures
of merit include the propensity to change expected lifespan (e.g., measuring
years of life lost
(YLL); ghdx.healthdata.org/ghd-results-tool) [Years of Life Lost (YLL): Global
Burden of
Disease Collaborative Network. Global Burden of Disease Study 2019 (GBD 2019)
Burden by
Risk 1990-2019. Seattle, United States of America: Institute for Health
Metrics and Evaluation
(MIME), 2020], the propensity to impact expected quality of life (QOL)
[Quality Of Life (QOL).
Ware, J.E., Gandek, B., Guyer, R. et al. Standardizing disease-specific
quality of life measures
across multiple chronic conditions: development and initial evaluation of the
QOL Disease
Impact Scale (QDISg). Health Qual Life Outcomes 14, 84 (2016).
doLorg/10.1186/s12955-016-
0483-x]; the propensity to change total quality of life, represented in some
embodiments as the
product of lifespan change and quality of life change (e.g., measuring
disability adjusted life
years (DALY)) [DALY: Disability Adjusted Life Years: Global Burden of Disease
Collaborative Network. Global Burden of Disease Study 2019 (GBD 2019) Burden
by Risk
1990-2019. Seattle, United States of America: Institute for Health Metrics and
Evaluation
(IFEVIE), 2020 and Murray CJ, Acharya AK. Understanding DALYs (disability-
adjusted life
years). J Health Econ. 1997 Dec;16(6):703-30]; and the propensity to impact
reproduction
(measured by selective pressure e.g., using phyloP or PhastCons [phyloP and
phastCons:
Pollard KS, Hubisz MJ, Rosenbloom KR, Si epel A. Detection of nonneutral
substitution rates on
mammalian phylogenies. Genome Res. 2010 Jan;20(1):110-21]).
Mappin2 Phenotype Risk Scores to Lower Complexity Trait Profiles
[0106] However, other simplifications can be provided that do not
require reduction of
genomes to a single score. There are numerous quantitative descriptions of
complex
psychological properties that are reduced to a small number of traits or
types. This is useful
when a simplified characterization of psychology is desired but sensitivity to
differing situations
is also a priority. Some of these are derived from defined characteristics
(e.g., MTBI), while
others may be derived from dimension reduction techniques applied to
populations of scores,
with reduced-dimensions (or clusters) being qualitatively characterized after
quantitative
discovery. For example, MTBI producers a characterization of personality in
terms of four
binary aspects, one of which is an opposed scale of introversion vs
extroversion. Neither is given
a linear contribution to a figure of merit, but rather may be differentially
appropriate in different
situations. For example, a worker in an isolated environment may be more
successful if they
have a personality that biases towards introversion (e.g., a researcher, or a
scout), while one in
an a more socially integrated environment (e.g., sales or marketing) may be
more successful if
their personality biases toward extroversion. Similarly, genomic
predispositions for collections
-24-
CA 03200803 2023- 5- 31
WO 2022/119861
PCT/US2021/061287
of phenotype biases in offspring or treatments may drive a preference that is
conditionally
dependent.
[0107] One example of a conditionally dependent preference is sex
selection, sometimes
called "family balancing" in IVF. Parents seeking a sex balance among
offspring may prefer a
female, if they have a male child, or a male child if they already have a
female. Neither sex is
unilaterally preferred, but sex may be a preference dependent on the context.
By analogy,
parents may prefer a child biased towards extroversion if they anticipate a
strongly social
environment, and a child biased towards introversion it they anticipate a more
isolated one.
Similarly, a genomic edit resulting in a collection of phenotypes that include
inhibited insulin
production, but resistance to leukemia, might provide an appropriate target
for a bone marrow
treatment when the implantation target is not responsible for insulin
production, but might be
unacceptable if the target tissue is responsible for insulin production.
[0108] A collection of Phenotype Risk Profiles (a distribution of
phenotype risk scores) may
be simplified by various techniques such as Principal Components Analysis,
potentially
followed by clustering techniques such as K-means or Hierarchical
Agglomerative clustering,
resulting in a smaller number of "types" [ Fig 2 & 3, 60]. A similar technique
involving the
reduction of thousands of personality -terms" to sixteen and later 5 factors
was used to develop
the Big Five Personality trait model (Roccas, S.; Sagiv, L.; Schwartz, S. H.;
Knafo, A. (2002).
The Big Five Personality Factors and Personal Values. Personality and Social
Psychology
Bulletin, 28(6), 789-801. doi:10.1177/0146167202289008). Similarly, genomic
predispositions
embodied by phenotypic risk scores may be simplified to a smaller number of
factors for
suitability as a basis for treating disease, animal husbandry or selection of
IVF generated
embryos in assisted human reproduction.
[0109] Consider a collection of samples derived from a suitable
population enumerated as
n E {1 ... N} with each sample being represented by a corresponding set of
genomic properties
gn (where gn, represents a collection of genomic properties for sample n) the
collection of all
such gn is referred to here as G (IG I = N). In addition. there a collection
of phenotype models
enumerates as i E [1 n with each phenotype being represented as pi. (where pi
represents a
weight describing the risk of phenotype i E I).
[0110] Using polygenic risk scores (PRS), maps can be created using
gn ¨> pi, creating a
weighting representing the risk of any phenotype for a sample given its
collection of genomic
properties:
W(g) G jpk
-25-
CA 03200803 2023- 5- 31
WO 2022/119861
PCT/US2021/061287
[0111] Where the weighting Wi may be a single value representing a
probability of a binary
phenotype pi (when k =1) or, alternatively, a distribution of probabilities
across a continuous
phenotype (e.g., height) such as those described by a Gaussian curve having a
mean and a
variance (k = 2), or potentially a more complex distribution of weights
requiring k parameters
to define (FIG. 2, 54 and FIG. 3, 12). It is envisioned that weights are real
values that may be
positive or negative and a special case of weights are probabilities that are
all greater than or
equal to 0.0 and have a disjoint sum of 1Ø
[0112] In some embodiments, a univariate (k=1) estimate composed of
a probability of a
positive binary value, or a single central parameter (e.g. the mean for a
Gaussian curve), may be
considered.
[0113] Thus, for a collection of N genome samples G, Wi defines a
mapping from N
samples to N collections of weights, each weight representing a propensity
towards a phenotype
i for sample n. This produces an N x I matrix values.
[0114] The complexity of this matrix may be reduced via any of a
number of techniques,
including PCA or Factor Analysis.
101151 In PCA (Principal Component Analysis), the covariance matrix
may represent an
I x I matrix or covariances among phenotypes, estimates by aggregating across
in the samples
N. Using this covariance, the eigenvalues and vectors of the covariance matrix
are calculated,
and dimensional reductions (to dimension J where 0 <J <I) are achieved by
projecting any
specific collection of inferred phenotypes i to the first J eigenvectors (e g
, the eigenvectors
corresponding the eigenvalues of greatest magnitude), resulting in a
collection of values of
dimension J <I. The dimensions may be individually interrogated to
characterize familiar
properties of each dimension. This model may then be applied to genomic
properties a novel
sample to generate a representation of that novel sample which may in turn
simplify comparison
and preference ranking among other samples.
[0116] This reduced dimensionality representation may be presented
as a representation or
subset of a collection of genomic phenotype risks over I (FIG. 3, 13).
Additionally, the
representation (model) may be further simplified by identifying areas of high
density (common
collections of phenotypes) via clustering such as "k-means" clustering
(simplifying when the
number of clusters <J), and weights associated with each cluster (FIG. 3, 15)
being presented to
an evaluator for comparison among a variety of samples, or calibration of a
single sample
against a previous body of samples (FIG. 2, 60).
[0117] Many possible dimension reduction techniques are possible
(FIG. 3, 14). The central
idea is to simplify the analysis of a sample by mapping a collection of
genomic properties (one
collection per sample) to collection of phenotype weights (FIG. 3, 12) when
reducing the
-26-
CA 03200803 2023- 5- 31
WO 2022/119861
PCT/US2021/061287
complexity of the collection of phenotypes via dimension reduction (FIG. 3,
14), then
presenting the reduced-complexity representation (FIG. 3, 15) (possible
univariate, (FIG. 3,
16)) to evaluations to ease the comparison and possible selection of preferred
samples.
101181 Dimension reduction techniques include but are not limited
to factor analysis,
principal component analysis, independent component analysis, and t-
Distributed Stochastic
Neighbor Embedding (t-SNE, Van der Maaten, Laurens, and Geoffrey Hinton.
"Visualizing data
using t-SNE." Journal of machine learning research 9.11 (2008). Any of these
dimension
reduction techniques can be followed by clustering to further simplify the
underlying
distributions, clustering techniques include but are not limited to gaussian
mixtures,
agglomerative clustering, spectral clustering, and k-means.
101191 In cases where dimensional reduction is not directly
amenable to explicit treatment of
distributions (Risk Score distributions), the distribution can be treated
empirically. This
empirical treatment involves sampling risk phenotype values according to their
weighting, and
then providing applying dimensional reduction on the collection of samples
that represents the
distribution. For example, when phenotype weights are probabilities; empirical
analysis
customarily generates a sample frequency proportionately to the phenotype
probability.
Polygenic Risk Scores
101201 Polygenic risk scores map genomic properties, relating these
properties to disease
risk. Diseases that can be mapped in this way include by are not limited to
asthma, glaucoma,
cancer, CV disease, CA disease, stroke, celiac disease, type l diabetes,
arthritis, gout,
Alzheimer's disease, autism, depression, and schizophrenia (Lambert, S.A.,
Gil, L., Jupp, S. et
al. The Polygenic Score Catalog as an open database for reproducibility and
systematic
evaluation. Nat Genet 53, 420-425 (2021).
Quality of Life Measures as a Figure of Merit
101211 Quality of life measures attempt to convert assessable
properties, such as the
presence of disease, into mathematical features. The mathematical
representation of Quality Of
Life (QOL) facilitates analysis and comparison among phenotype alternatives.
QOL measures
may be limited to medical conditions. Alternatively, QOL measures can be
broadened to include
other factors (e.g., mental health). QOL models may be represented in economic
units, such as
impact on lifetime income, or more abstract measures of life quality. Some
examples include
models associated with AQoL-8D that attempts to assess QOL over 8 domains
(www.aqol.com.au/, which is incorporated by reference herein in its entirety).
There is also a
disease specific subset particularly relevant to genomic phenotype analysis
(www.aqol.com.au/index.php/aqol-current, which is incorporated by reference
herein in its
entirety) including items related to the presence and severity of arthritis,
asthma, cancer,
-27-
CA 03200803 2023- 5- 31
WO 2022/119861
PCT/US2021/061287
diabetes, and heart disease. The EQ-5D (including 5D-3L, 5D-Y) ¨ provided by
the European
EuroQol Research Foundation (eurogol.org/, which is incorporated by reference
herein in its
entirety); SF-36, which maps phenotypic traits directly to quality-adjusted
life-years and is a
subset the SF-12 available from the RAND corporation (Jenkinson C, Layte R,
Jenkinson D,
Lawrence K, Petersen S, Paice C, Stradling J A shorter form health survey: can
the SF-12
replicate results from the SF-36 in longitudinal studies? Journal of Public
Health Medicine.
1997, 19 (2). 179-186), which is incorporated by reference herein in its
entirety), and HRQOL-
14 from the Unites States CDC (www.cdc.gov/hrqol/hrqo114 measure.htm, which is
incorporated by reference herein in its entirety) are additional exemplary
models associated with
QOL measurements.
101221 Another approach to QOL is to assess subjective wellbeing
(e.g. happiness), using
instruments that attempt to map happiness to mathematical values including but
not limited to
the Oxford Happiness Inventory (Argyle and Hill), the Panas Scale (Watson,
Clark, Tellegen)
and PNAS-Gen (Watson, D., Clark, L. A., Tellegen, A. (1988), each of which is
incorporated by
reference herein in its entirety). Development and validation of brief
measures of positive and
negative affect: The PANAS scales. Journal of Personality and Social
Psychology, (54), 1063-
1070, which is incorporated by reference herein in its entirety.). OECD
Guidelines on
Measuring Subjective Well-being. (www.oecd.org/statistics/oecd-guidelines-on-
measuring-
subjective-well-being-9789264191655-en.htm, which is incorporated by reference
herein in its
entirety). Summarizing health-related quality of life (HRQOL): development and
testing of a
one-factor model. Shaoman Yin, Rashid Njai, Lawrence Barker, Paul Z. Siegel,
and Youlian
Liao, which is incorporated by reference herein in its entirety.
101231 While many questions in a QOL survey can map directly to disease
phenotypes that have
existing PRS models, others can require development of new PRS, inference of
expected
answers, or resultant measures with some PRS models. Causal models include
various structural
equation models and observational models that are restricted to causal
criteria such as Front
Door and Back Door criteria (Pearl, Judea; Causality: Models, Reasoning and
Inference; second
edition, 2009; isbn 052189560X; Cambridge University Pres; USA).
Description of Process
101241 The prediction process accepts a trained phenotype potential
risk model (FIG. 5-6,
44) a corresponding collection (FIG. 6, 50) of related genomes (FIG. 6, 31)
and phenotypes
(FIG. 6, 30) and a target genome (FIG. 6, 51). The result is a target
phenotype risk distribution
(FIG. 6, 55) for a phenotype of interest that may not yet be manifest in the
target organism. In
some embodiments of the model a target potential phenotype risk distribution
(FIG. 6, 56) may
be produced which describes the target phenotype risk distribution for each
combination of
-28-
CA 03200803 2023- 5- 31
WO 2022/119861
PCT/US2021/061287
related phenotypes (FIG. 6, 30). In some embodiments, the calculation of
phenotype risk may
proceed directly without the explicit calculation of a potential phenotype
risk distribution,
though this potential distribution is still implicitly defined by the model.
An explicit potential
phenotype risk distribution may be of particular value in considering
differing environments in
which a target may exist or be developed. For example, an engineered cell type
with a particular
genome may grow in a desired fashion in an oxygen rich environment but fail to
grow in an
oxygen poor one. Similarly, a particular embiyo may have extraordinary
propensity to flourish
to a healthy weight in a relatively low-calorie environment (a first
phenotype) but be at
substantially elevated risk for adult onset Type 2 Diabetes in a high-calorie
environment (a
second phenotype). A risk distribution can contribute a positive expected
value, a negative
expected value, or a zero expected value.
[0125] An embodiment of the present disclosure can include, but is
not limited to, a
logistical model, separate models for each combination of related phenotypes,
neural network /
deep learning models, single tree models such as CART, random forest models,
support vector
machines, generalized linear models, or logistic regressions.
[0126] In addition, the logistical model method of incorporating
related phenotypes is not
restricted to inference of child phenotypes from two parents. Larger
collections of phenotypes
may provide for extended demographic cohorts including families, tribes, or
regional
populations. In cases where the observation of a trait may be depend on
relatives' phenotypes
but NOT some relatives' genotypes, the genomic properties for each genome in a
related set
(FIG. 6, 50) may vary for each individual, for example, masking out all
genomic traits for
uncles or cousins, while allowing some genomic properties for parents or the
target. This may be
particularly useful when the phenotype risk distributions of the target are
conditionally
independent of related genomes, when conditioned on a target genome.
Furthermore, this
method may also extend to predicting useful traits in livestock animals (such
as weight in
bovines) or assessing expected phenotypes for genetically edited (e.g. via
CRISPR-Cas9)
variants of a source cell type used in the development of medical treatments
and remediations.
Additionally, the phenotype element of the model (FIG. 6, 30), along with the
use of parental or
related biological properties (biological phenotypes) are a proxy for
environmental conditions
that may not be defined.
Developing Models
[0127] Each model map represents a transformation from a collection
of inputs to an output.
In various embodiments, such models may have parameters which are determined
through the
use of a training set, then applied to novel data outside the training set. In
various embodiments,
parameters are adjusted so that the training data when applied to
parameterized model, most
-29-
CA 03200803 2023- 5- 31
WO 2022/119861
PCT/US2021/061287
closely approximates that desired output, subject to complexity constraints.
In some
embodiments, the output may be a figure of merit, or a reduced representation
that is more
concise than the collection of phenotype risk Scores for each genome.
101281 In FIG 2, a collection of training genomes (FIG. 2, 52) is
used to derive a
corresponding distribution for each collection genomic properties (FIG. 2,
53), providing one
distribution for each property in the collection for each genomic property.
Thus, each genome is
represented by a collection of associated genomic properties. Properties are
selected so they can
serve as inputs to each phenotype risk model (FIG. 2, 54). Risk models can be
collected from an
outside source or can be generated during development and provided as output
(FIG. 2, 55),
corresponding to input in FIG. 3, 55. The set of distributions of genomic
properties for each
training genome is applied to each phenotype risk model (FIG. 2, 56) to
generate a phenotype
score distribution for each phenotype associated with each genome, generating
a collection of
phenotype risk scores (FIG. 2, 57) for each genome, one per phenotype. This
may require
aggregating weights or probabilities of a particular phenotype state (e.g.
severities of diabetes)
across distributions of genomic properties and PRM to generate distributions
of risk for each
phenotype. A dimension reduction model is then generated (FIG. 2, 59) by any
of a number of
reduction techniques to create a reduced PRS map (FIG. 2, 60). An intermediate
step may then
require calculating a reduced complexity distribution of weights (FIG. 2, 61)
by applying the
DRM (FIG. 2, 59) to each of phenotype risk scores (FIG. 2, 56) for each
training genome to
generate a simpler predictive representation from those scores. The DRM is a
model whose
parameters are chosen so as to minimize complexity, and if selected, improve
the expected
prediction of the FOM for the organism associated with the corresponding
genome.
101291 In developing PRS and GWAS, a body of genome-phenotype pairs
are combined to
calibrate statistical models (subject to complexity constraints) by adjusting
model parameters to
minimize predictive error. Once stopping criteria are met, the parameters are
fixed, and the
model is available to make predictions about the likely eventual phenotype
risk conditioned on a
genome.
101301 Broadly, the goal of the phenotype risk model is to use an
existing set of phenotypes
and genotypes for target and related organisms, to build a statistical model
that allows for the
prediction or target phenotype risk from related phenotypes and target
genotypes alone (FIG.
4B) The statistical model is characterized by a set of parameters, which may
begin as random
values and are refined via training so as to minimize a combination of
predictive error over the
training set, and model complexity. This model is then applied to a novel
target genome (along
with related phenotypes an genotypes) to estimate the risk of that an organism
that possesses the
target genome will eventually develop the target phenotype.
-30-
CA 03200803 2023- 5- 31
WO 2022/119861
PCT/US2021/061287
101311 In some embodiments, model development begins with a
collection of training data
(FIG. 5, 35), each training data element contains: a target genome (FIG. 5,
33), a collection of
target phenotypes (FIG. 5, 34) associated with the organism possessing that
target genome, a
collection (FIG. 5, 32) of related genomes (FIG. 5, 31) and phenotypes (FIG.
5, 30) with one
complete set of phenotypes for each related genome. Each genome in the
collection of training
data is mapped into a corresponding set of numeric Genomic Properties (FIG. 5,
40) An initial
phenotype risk model, perhaps as simple as a generalized lineal model (GLM,
one example
being Logistic Regression) is then applied to the collection of training
genomes and target
genomes (genomes represented by their corresponding genomic properties) to
assess the
genomic potential phenotype risk of the target (FIG. 5, 41). This potential
phenotype risk is a
distribution representing the genomic potential risk of the target, without
consideration of the
target's actual developmental environment (FIG. 4B, 25). It is considered as
an additional
possibility that this risk itself may be influenced by the environment, for
example, via
environment-induced epigenomic changes that might, in turn, influence
predisposition towards
primary sequences in offspring. Epigenetic mechanisms that may signal such an
influence
include PMDR9 binding and DNA methylation. Some model embodiments may ignore
this
effect, while others may take it into account, the impact of inclusion is
represented as a dashed
line in FIG. 5, 41a, representing an envisioned but optional component. In
constructing a model,
the phenotype potential risks are then combined with environmental factors to
produce a risk
distribution for the collection of target phenotypes (FIG. 5, 42). There can
be at least about 1, 2,
3, 4, 5, 6, 7, 8, 9, 10, 15, 20, 30, 40, 50, 60, 70, 80, 90, 100, 150, 200,
300, 400, 500, 600, 700,
800, 900, 1000 or more target phenotype values. There can be at most about
1000, 900, 800,
700, 600, 500, 400, 300, 200, 150, 100, 90, 80, 70, 60, 50, 40, 30, 20, 15,
10, 9, 8, 7, 6, 5, 4, 3, 2,
or 1 target phenotype values. This risk distribution is compared to the actual
collection of target
phenotypes (FIG. 5, 34) and the parameters of the model adjusted to reduce
discrepancy
between the prediction and the target phenotype, subject to complexity
constraints. Many
techniques can perform this reduction, (e.g., gradient descent, regularized
gradient descent,
binary and gridded search, or evolutionary search). The discrepancy reduction
process is then
repeated (FIG. 5, 43) iterating across the collection of training elements
(FIG. 5, 35) until a
stopping point is reached. Some examples of stopping points include but are
not limited to a
minimal reduction in discrepancy between prediction and target phenotypes
across the training
set or the attainment of a particular absolute discrepancy (error) level. When
the stopping criteria
are met and training ceases, the current parameters form the core of the
potential phenotype risk
model.
-31 -
CA 03200803 2023- 5- 31
WO 2022/119861
PCT/US2021/061287
101321 In some embodiments, the set of phenotypes may be much
larger than the target
phenotype. These represent features other than a trait that may impact that
trait, for example
binary presence of parental obesity at a particular age (t0,11) may be
informative as to risk of
Type 2 Diabetes being manifest by developing target organism by adulthood (for
example,
another binary variable 10,11).
101331 In some embodiments, a variety of environmental factors may
be included in the
prediction of phenotypes. Such environmental factors may include, but are not
limited to,
environmental or developmental features that may (directly, or indirectly)
influence the
manifestation of an organismal property (traditional phenotype) from a genomic
risk or
predisposition. Such environmental features might include an exposure to toxic
chemicals like
asbestos, availability of medical care, socioeconomic status (possibly as
described by presence
of poverty), or exposure to familial famine/starvation during adolescence. All
of these factors
may be predictive of the risk profile for a traditional target phenotype such
as lung cancer,
diabetes, adult height, weight at a specific age, or hypertension.
101341 One non-limiting example of the use of a method of the
disclosure is in assessing
embryos generated by two known parents for human assisted reproduction. In
this case the
training data might consist of trios of one offspring (as the target) and two
parents. The genomes
of the parents as well as their phenotypes are known or inferred (e.g., UK
Biobank, Sudlow C,
Gallacher J, Allen N, Beral V, Burton P, Danesh J, et al. (2015) UK Biobank:
An Open Access
Resource for Identifying the Causes of a Wide Range of Complex Diseases of
Middle and Old
Age. PLoS Med 12(3): e1001779.see also www.ukbiobank.ac.uk), as is the target
genome and
target phenotype.
101351 The phenotype potential risk model accepts genotype
properties from the target and
its relatives and can produce a distribution over related phenotypes and
target phenotypes.
Combining this distribution with related phenotypes produces a distribution
over target
phenotypes. In some embodiments, this process is combined into a single
calculation and no
separate phenotype potential risk analysis may be produced.
Incorporating Underlying Statistical Relationships
101361 One observation is that at short time scales, survivable
organismal variety derives
primarily from offspring genomic variation induced by crossover during
reproduction, rather
than de-novo mutation (variation not shared with either parent). The methods
described herein
seek to utilize this variation as the primary predictor of phenotype, with de-
novo mutation
playing a secondary role. In some embodiments, this is applied toward
estimating single-
generation phenotype inheritance of an embryonic genome from parental genomes
in the course
-32-
CA 03200803 2023- 5- 31
WO 2022/119861
PCT/US2021/061287
of assisted reproduction. A further specification of this application may be
in embryonic
selection and ranking for human IVF.
101371 De-novo mutation (not inherited from either parent) may also
play an appreciable
role in embryonic phenotype. However, methods and systems of the present
disclosure may not
analyze de-novo mutation when conditioned on replicons. The methods and
systems of the
present disclosure may allow that a mutation in one replicon may have an
important phenotypic
role, for example disrupting a transcription factoi binding motif leading to
variation in
phenotypically relevant gene transcription, while the same mutation in a
different replicon (with
no transcription factor binding site) at the same genomic coordinates may have
little
phenotypical impact. This may be especially important when the phenotype
represents
predisposition to a human disease.
101381 Some genomic methods for inferring phenotype risk scores
such as polygenic risk
scoring, may derive from a genome-driven relationship, first extracting a
collection of genomic
properties from each particular genome, and them estimating the risk of
observing a phenotype
in an organism with the corresponding genome, directly from that collection of
genomic
properties (FIG. 4A). In such a model, the relatively identical genomes may
yield a relatively
identical collection of genomic properties (as in the case of monozygotic
twins). Similarly,
identical collections of genomic properties associated with separate organisms
may yield
identical phenotype risk distribution estimates, regardless of the environment
in which the
organisms develop. The proposed work expands this model by incorporating
specific
consideration of the environment (FIG. 4B). In the proposed framework, genomes
and genomic
properties may be calculated in a similar fashion, however, the genomic
properties are used to
identify a potential phenotype risk distribution, which represents
contributions to a latent and
potentially unobservable predisposition towards risk. Conceptually, this
potential represents an
unknown genomic system or process that may respond differently to differing
environments,
producing different organismal phenotypes. This process is represented as a
model that accepts
inputs pertaining to the environment and produces a risk distribution. In some
embodiments, the
potential risk distribution might be considered a multivariate probability
distribution that
includes risk distributions and environmental properties as variables, and
that can be used to
generate a specific risk distribution when conditioned on known values for
those environmental
variables. FIG 4A-B may be considered in one instance as probabilistic
graphical models,
though that is not indented as a limitation.
101391 In some embodiments, a collection (G) of N genomes (N = IG
I) may be enumerated
as g E G. A set of genomic properties is selected to represent each genome as
a collection of
numbers. For a specific collection of properties (GP) the collection of
property values associated
-33 -
CA 03200803 2023- 5- 31
WO 2022/119861
PCT/US2021/061287
with a particular genome gh can be identified as GP (gõ) = gpn or by mapping
gn ¨> gpn. A
training set used to build a model represents a known combination of genotypes
G along with an
associated collection of phenotypes (PH) where the organism n is associated
with genome
and a specific collection of phenotypes ph,. A model accepts gpn and produces
an estimated
distribution over one or more ph,. Such models are composed of parameters
which are adjusted
to minimize a combination of complexity and error in the estimated
distribution. One specific
embodiment of a model is the family of generalized linear models, for example,
logistic
regression. For a considering a single binary phenotype (ph, E {0,1}), such a
model for
predicting probabilities (P) may be represented as
P(phn = 1) = Link (1 M = gpn)
nEIGPI
P(phn = 0) = 1 ¨ P(phn = 1)
101401 Where one commonly used link function is the logistic
function:
Link(x) = _______________________________________________
1+ e-k(x-x0)
which simplifies to the following equation for trivial parameters, L=1, k=1,
xo = 0
1
Link(x) = _____________________________________________
1+ e-x
101411 Where the link function is a logistic map, mapping takes all
real values onto the
range (0,1). Many more sophisticated techniques for creating such a map gpn ¨>
Distribution(ph) are include but are not limited to neutral networks, deep
learning systems,
random forests and CART maps. One technique for refining the parameters in
these models
involves initializing parameters with central values from the distributions in
a training set, and
then adjusting parameters in a way that reduces the net predictive error,
potentially constrained
by complexity limitations. This technique is referred to as gradient descent,
and may be iterated
until a minimum predictive error is found, or another iteration stopping
criteria is met.
101421 A generalized linear model serves as one useful embodiment
for considering a
genomic assessment process in FIG. 4C. In this process, a single genome gn is
analyzed, by
first mapping it to a collection of numeric genomic properties gpn. A model
trained as described
above is then used to calculate phenotype risk weights. Some embodiments of
this may be
considered as:
gpn ¨> Distrib(phn)
-34-
CA 03200803 2023- 5- 31
WO 2022/119861
PCT/US2021/061287
where output Distrib(phn) is represented in FIG. 4C, 13. In the simple case
that that there is
one binary phenotype this distribution can be determined in the final step, as
the probability
di stributi on
gpõ P(plin = 1)
with
P(phn = 1) = Link (1 M = gpn)
nEIGPI
where M is a model in the form of a matrix, with matrix elements serving as
model parameters,
that is derived from training on a previously identified training set.
Replicon Determination
101431 In some embodiments, replicons may be identified by
identifying all crossover points
in a known population and segmenting the genome according to the union of all
such crossover
points. For a given coordinate segment, defined as the contiguous region
between adjacent
crossovers, all uniquely observed nucleotide sequences can be listed. If small
variants generate
an unacceptably large number of uniquely observed nucleotide sequences, they
may be clustered
into a smaller number of clusters, each cluster associated with a unique
replicon ID. This allows
for minor variations on a single sequence to be treated as corresponding to
the same replicon. In
some embodiments, this clustering may be performed so as to maximize
complexity-limited
predictive power over phenotypes, especially during PRS training. In some
embodiments,
approaches may consider linkage disequilibrium, or alternatively down-weight
variations at sites
that are not under longer-term selective pressure, or variations at locations
known a-priori to be
less likely to participate in genomic function.
101441 In some embodiments, replicons may be associated with
demographic haplotypes.
These haplotypes serve as a curated source of replicon clusters as defined
above and are
considered significant in the definition of demographic characteristics.
101451 In some embodiments, replicons may be clustered using
clustering parameters
generated the context of model training so as to yield the clusters most
likely to be informative
about phenotypes. This can be accomplished by gradient methods on cluster
variation
parameters so as to maximize the complexity-limited probability of the
observed training set.
Methods for Analysis
[0146] In some embodiments, a PRS method is performed. A PRS might
proceed by
gathering a collection of genomes and corresponding phenotypes. Genomic
properties that
define variants are quantified. The genomic properties are used to map
features of each genome
to a collection of numeric properties for further analysis. One such mapping
is the identification
-35-
CA 03200803 2023- 5- 31
WO 2022/119861
PCT/US2021/061287
of specific variants. In some embodiments, for phenotypes y, N individuals, M
genotypes, Z is
N x M matrix of standardized (columns are scaled to 0 mean and unit variance),
f3 is a vector of
effect sizes (one per genotype), e is a vector of environmental effects
(noise). Further, in a
Bayesian setting a non-informative Jefferies prior on the residual variance a2
can be set or an
empirical estimator 6 can be derived via methods such as gradient descent to
maximize
likelihood.
[0147] Standardization is performed column-wise, if there is only a
single numerical
phenotype representation then there is only a single mean and standard
deviation
It(Y))
Ystd = a(Y)
[0148] Where .(y) is the column-wise mean value for y and a(y) is
the column-wise
standard deviation.
y = ZI3 + , N (o, o-2 I)
and an estimator for then effect size fi can be calculated as
ZTYsta
leaving a phenotype likelihood as e ¨ ) or as a loglikelihood
log (e ¨ (43)i))
[0149] More sophisticated generalized linear models can be used,
introducing a link function
representing y = Link (Z + Ei) + E2. One link function can be the logistic
function
Linku,,k}(x) ¨ 1+e(x) where p. and k become model parameters that may be fit
by various
approaches including via maximum likelihood, MAP or expectation.
[0150] In some embodiments, a numeric phenotype matrix y based on
the presence {1} or
absence {0} of the target phenotype can be constructed, then adjust to
standard form. If there is a
single phenotype the matrix may have a single column and one row for each
genome:
ZTy
y = + E , E N(o,o-21), fi =--
101511 Once a model has been identified (e.g. link function and all
model parameters),
parameters are calibrated using a training set via a number of methods, as
described elsewhere
herein, to generate a trained model. This trained model serves as a map
allowing a calculation
from any collection of consistent genomic parameters to a phenotype risk
weight. This risk
weight may be converted to a probabilistic representation of phenotype value.
In an alternative
-36-
CA 03200803 2023- 5- 31
WO 2022/119861
PCT/US2021/061287
embodiment, an adaptive model may be used, for example, allowing the number of
parameters
to increase as the informative power of the training data increases.
101521 Numerous methods can be used for training and applying
numerical genomic
properties to numerical phenotype risk distributions, some of which provide
complexity
limitations to improve model generalizability. These include, but are not
limited to, generalized
linear models, CART trees, random forests, gradient boosted trees/forests,
neutral networks, and
deep learning systems. Selecting the collect set of genomic features may be
important, so that a
trained model is likely to generate an accurate map.
101531 The present disclosure provides methods and systems that may
focus on the idea that
replicons are important genomic features in identifying phenotypic variation,
especially at short
durations such as the offspring of a single set of parents.
Basic Replicon Analysis
101541 In some embodiments, a replicon definition is obtained and
applied to each genome
in of a collection of training set elements, each element consisting of a
genome and a
corresponding set of phenotypes. The replicon definition allows for the
mapping of identified
replicons to distributions of numerical values. The collection of
distributions over replicon
clusters is used to calculate phenotypic risk weights by application of single
replicon values to a
model or via aggregating weights for replicon distributions across individual
replicon (element)
to form an expectation, for example:
(ErEReplicon(W (r, element) = Score (r))
E [Score , element] =
ErERepticon W (r, element)
E [Score] = E [S core, element]
etementEoenome
101551 This risk score is then compared to the corresponding
phenotype in the training set
and the difference used to generate a gradient descent training of PRS model
parameters. Once
this model is trained and fixed, a novel genome may similarly be enumerated
into a distribution
across replicons. This distribution over replicons can then be applied to the
PRS component of
the model to calculate a distribution over phenotype risk weights. This
distribution over PRW
may be further collapsed into more simplified expectations for comparison with
other risk
scores, or collections of risk scores.
101561 Additionally, small genomic variation may be combined with
replicon variation to
further refine phenotype risk scores. A conceptual framework for this method
is that variations
at specific genomic positions may carry significant phenotypic risk impact for
one replicon,
perhaps altering an important nucleotide in a transcription factor binding
site, while that same
-37-
CA 03200803 2023- 5- 31
WO 2022/119861
PCT/US2021/061287
variation in another replicon (perhaps one without that site, where the site
was shifted, or its
function moves to another genomic location) may have limited phenotypic risk
impact.
Advanced Replicon Analysis
101571 In understanding an embodiment that combines replicon
definition with variant
definition, a machine learning property called regularization may be
considered Regularization
places a penalty on model complexity that may be included as part of a model's
error term
during training. Thus, during the training of a model, the error gradient
favors model parameters
that are both accurate and simple (parameters of low magnitude may be a proxy
for simplicity).
This is desirable as models of lower complexity with similar training errors,
may generalize
better to non-test-set examples than models of higher complexity when trained
on the same
training sets (i.e., Ockham's razor). As the amount and diversity of training
data grows, the
amount of allowed complexity acceptable by the model can grow commensurately,
justified by
the additional data. In a regularized model, a single replicon covariate that
is very informative
about polygenic risk may be favored over a collection of individual variations
that together are
similarly informative (or in some cases, are more informative). As the amount
of training data
grows, improvements in polygcnic risk prediction from individual variants,
above those for
coarser replicons, may drive an increase in model complexity / parameters that
in turn assigns
non-zero weight to individual variations. Some embodiments of this joint model
is described
below.
101581 Consider the model referenced in this document:
y = Z13 + E , E N(o, o-21).
101591 The target phenotypes and number of individuals remains the
same, as phenotypes y,
and N individuals. However, the M enumerated variations (genotypes) are
replaced with an
aggregate of at least one of the enumerated replicons and an appropriately
sized collection of
enumerated variants. The total number of variables M is now the sum of the
number of
enumerated replicons (Mr) and enumerated variants (Mr) such that M = Mr + M
and similarly
1161 = M, with 13 coefficients corresponding to each of these enumerations.
However, to favor
more parsimonious (and generalizable) attribution of model complexity to more
predictive
coefficients, a regularization term may be added. While there are many
embodiments of
regularization this example considers a L1 style complexity as it is: often
amenable to efficient
convex optimization (unlike L n regularization where 0 <n < 1), and tends to
drive model
parameters to a magnitude of 0 when they are less informative, making them
more robust to
noise (unlike L2 regularization). (The Lr norm may be an aggregate of the form
L(/3) =
Etut D el n. Here ', is the L1 magnitude of all coefficients
1,31 = L Ith1).
-38-
CA 03200803 2023- 5- 31
WO 2022/119861
PCT/US2021/061287
[0160] Identifying values for the model a, 6/ now takes the form of
adjusting the model
training structure to
2
Err fl,a(y) = (y ¨ .9)2 = (31 + aIPI + c))
= argminii,õ(Errii,õ(y))
[0161] Where a is called a hyperparameter; the value of a
hyperparameter may be
determined empirically during model training over a set of training data
represented by
phenotypes y and combined replicon and variation values Z.
[0162] Once values for $ are obtained, prediction on novel genomes
proceeds similarly as
before with
y=Zfi+E
where the replicon and variant definitions are the same as those used during
training, and the
enumeration of replicons Zõp and variants 4,, in predicting PRS for a genome
(Z =
[Zrep,Zvar]). The prediction can be applied to a single genome (thus N=1, and
the collection has
just one element), or it can be applied to multiple genomes. The variant and
replicon
enumeration remains separate (fts = [/rep, fivar]), so the equation may be
more easily understood
as
Y = Zrepfirep Zvar fivar E
Calculation of this equation predicts a distribution of phenotype risk weights
across phenotype
quantification, y.
[0163] These methods may also be used to map replicon and variant
definitions (Z) to
phenotype distribution predictions (y). Some of these methods include
generalized linear
models, taking a form of a link function applied to a linear model, in one
form y =
Link(Z + el) + 62 where the link function may identify the logistic function,
exponential,
polynomial, identity, etc. Decision tree models such as CART, classification
and regression
trees, are useful for modeling intelligible, but non-linear, relationships,
and random forest
methods represent some of the most powerful contemporary non-linear
estimators, but often
suffer from difficulty in intelligibility. Deep Learning / Neural Network
methods learn powerful
predictive functions, but like random forest methods, can also suffer from
difficulty in
intelligibility. Another possible method includes using stratified analysis
where variants are only
analyzed within the context of a specific replicon or distribution of
replicons, analogous to a
conditional random field.
-39-
CA 03200803 2023- 5- 31
WO 2022/119861
PCT/US2021/061287
101641 In some embodiments, a feature of blended replicon/variant
analysis is
regularization, which biases the model to explain phenotypes in a parsimonious
way, employing
the implicit broad correlations inherent in replicon structure to model
phenotypes when possible
and using smaller variations to explain differences between replicons, when
they are warranted
Trained al2orithms
101651 Once the model is fully built, the algorithm can be used to
rank genomes according
to figures of merit. For example, the trained algolithin may be used to
determine quantitative
measures of expected embryonic future health, during the course of IVF
implementation
decisions. The trained algorithm may be configured to identify future
embryonic health with an
accuracy of at least about 50%, at least about 55%, at least about 60%, at
least about 65%, at
least about 70%, at least about 75%, at least about 80%, at least about 85%,
at least about 90%,
at least about 95%, at least about 96%, at least about 97%, at least about
98%, at least about
99%, or more than 99% for at least about 1, at least about 2, at least about
3, at least about 4, at
least about 5, at least about 6, at least about 7, at least about 8, at least
about 9, at least about 10,
at least about 11, at least about 12, at least about 13, at least about 14, at
least about 15, at least
about 20, at least about 21, at least about 22, at least about 23, at least
about 24, at least about
25, at least about 26, at least about 27, at least about 28, at least about
29, at least about 30, at
least about 35, at least about 40, at least about 45, at least about 50, at
least about 60, at least
about 70, at least about 80, at least about 90, at least about 100, at least
about 150, at least about
200, at least about 250, at least about 300, at least about 350, at least
about 400, at least about
450, at least about 500, at least about 600, at least about 700, at least
about 800, at least about
900, at least about 1000, or more than about 1,000 independent samples.
101661 The trained algorithm may comprise a supervised machine
learning algorithm. The
trained algorithm may comprise a classification and regression tree (CART)
algorithm. The
supervised machine learning algorithm may comprise, for example, a Random
Forest, a support
vector machine (SVIVI), a neural network, or a deep learning algorithm. The
trained algorithm
may comprise an unsupervised machine learning algorithm.
101671 The trained algorithm may be configured to accept a
plurality of input variables and
to produce one or more output values based on the plurality of input
variables. The plurality of
input variables may comprise genomic or phenotypic data. For example, an input
variable may
comprise whether or not a biological parent has Type II diabetes.
101681 The trained algorithm may comprise a classifier, such that
each of the one or more
output values identifies probabilities of discrete classifications, or
otherwise indicates one of a
fixed number of possible values (e.g., a linear classifier, a logistic
regression classifier, etc.)
indicating a classification of the biological sample by the classifier. The
trained algorithm may
-40-
CA 03200803 2023- 5- 31
WO 2022/119861
PCT/US2021/061287
comprise a binary classifier, such that each of the one or more output values
comprises one of
two values (e.g., {0, 1}, {positive, negative}, or {high-risk, low-risk})
indicating a classification
of the biological sample by the classifier. The trained algorithm may be
another type of
classifier, such that each of the one or more output values comprises one of
more than two
values (e.g., 10, 1, 21, {positive, negative, or indeterminate}, or {high-
risk, intermediate-risk, or
low-risk}) indicating a classification of the biological sample by the
classifier. The output values
may comprise descriptive labels, numerical values, or a combination theieof.
Some of the output
values may comprise descriptive labels. Such descriptive labels may provide an
identification or
indication of the disease or disorder state of the subject, and may comprise,
for example,
positive, negative, high-risk, intermediate-risk, low-risk, or indeterminate.
Some descriptive
labels may be mapped to numerical values, for example, by mapping "positive"
to 1 and
"negative" to 0. Biological samples may be derived from whole cells,
fractional cells, or cell-
free media derived from, for example, embryo incubation media, blood
distillate, or amniotic
fluid.
101691 Some of the output values may comprise numerical values,
such as binary, integer, or
continuous values. Such binary output values may comprise, for example, {0, 1
},{positive,
negative}, or {high-risk, low-risk}. Such integer output values may comprise,
for example, {0,
1, 2}. Such continuous output values may comprise, for example, a probability
value of at least 0
and no more than 1. Such continuous output values may comprise, for example,
an un-
normalized probability value of at least 0. Such continuous output values may
indicate a
prognosis of the pregnancy-related state of the subject. Some numerical values
may be mapped
to descriptive labels, for example, by mapping 1 to "positive" and 0 to
"negative."
101701 The trained algorithm may be trained with at least about 5,
at least about 10, at least
about 15, at least about 20, at least about 25, at least about 30, at least
about 35, at least about
40, at least about 45, at least about 50, at least about 100, at least about
150, at least about 200,
at least about 250, at least about 300, at least about 350, at least about
400, at least about 450, at
least about 500, at least about 600, at least about 700, at least about 800,
at least about 900, at
least about 1,000, at least about 2,000, at least about 3,000, at least about
4,000, at least about
5,000, at least about 6,000, at least about 7,000, at least about 8,000, at
least about 9,000, at least
about 10,000, at least about 50,000, at least about 100,000, at least about
500,000, at least about
1,000,000, at least about 10,000,000, at least about 100,000,000, or at least
about 1,000,000,000
independent training samples.
101711 While the trained algorithm is initially trained, a subset
of the inputs may be
identified as most influential or most important to be included for making
high-quality
classifications. Alternatively, after the trained algorithm is initially
trained, a subset of the inputs
-41 -
CA 03200803 2023- 5- 31
WO 2022/119861
PCT/US2021/061287
may be identified as most influential or most important to be included for
making high-quality
classifications. For example, a subset of the studied genotypes/phenotypes may
be identified as
most influential or most important to be included for making high-quality
classifications or
identifications of embryonic ranking. For example, if training with a
plurality comprising
several dozen or hundreds of input variables in the trained algorithm results
in an accuracy of
classification of more than 99%, then training the trained algorithm instead
with only a selected
subset of no more than about 5, no more than about 10, no more than about 15,
no more than
about 20, no more than about 25, no more than about 30, no more than about 35,
no more than
about 40, no more than about 45, no more than about 50, or no more than about
100 such most
influential or most important input variables among the plurality can yield
decreased but still
acceptable accuracy of classification (e.g., at least about 50%, at least
about 55%, at least about
60%, at least about 65%, at least about 70%, at least about 75%, at least
about 80%, at least
about 81%, at least about 82%, at least about 83%, at least about 84%, at
least about 85%, at
least about 86%, at least about 87%, at least about 88%, at least about 89%,
at least about 90%,
at least about 91%, at least about 92%, at least about 93%, at least about
94%, at least about
95%, at least about 96%, at least about 97%, at least about 98%, or at least
about 99%). The
subset may be selected by rank-ordering the entire plurality of input
variables and selecting a
predetermined number (e.g., no more than about 5, no more than about 10, no
more than about
15, no more than about 20, no more than about 25, no more than about 30, no
more than about
35, no more than about 40, no more than about 45, no more than about 50, or no
more than
about 100) of input variables with the best classification metrics.
101721 Computer systems
101731 The present disclosure provides computer systems that can be
programmed to
implement methods of the disclosure. FIG. 9 shows an exemplary computer system
901 that is
programmed or otherwise configured, but not limited to, for example, (i) train
and test a trained
algorithm, (ii) use the trained algorithm to process data to determine the
future health of an
embryo, (iii) determine a quantitative measure indicative of the future health
of an embryo,
and/or (iv) electronically output a report that is indicative of the future
health of an embryo.
101741 In some embodiments, the systems and methods of the present
disclosure utilize
algorithms capable of training. In other embodiments, however, the system and
methods of the
present disclosure may use a pre-trained algorithm.
101751 The computer system 901 can regulate various aspects of
analysis, calculation, and
generation of the present disclosure, such as, for example, (i) training and
testing a trained
algorithm, (ii) using the trained algorithm to process data to determine the
future health of an
embryo, (iii) determining a quantitative measure indicative of the future
health of an embryo,
-42-
CA 03200803 2023- 5- 31
WO 2022/119861
PCT/US2021/061287
and (iv) electronically outputting a report that is indicative of the future
health of an embryo.
The computer system 901 can be an electronic device of a user or a computer
system that is
remotely located with respect to the electronic device. The electronic device
can be a mobile
electronic device.
[0176] The computer system 901 includes a central processing unit
(CPU, also "processor"
and "computer processor" herein) 905, which can be a single core or multi core
processor, or a
plurality of processors for parallel processing. The computer system 901 also
includes memory
or memory location 910 (e.g., random-access memory, read-only memory, flash
memory),
electronic storage unit 915 (e.g., hard disk), communication interface 920
(e.g., network adapter)
for communicating with one or more other systems, and peripheral devices 925,
such as cache,
other memory, data storage and/or electronic display adapters. The memory 910,
storage unit
915, interface 920 and peripheral devices 925 are in communication with the
CPU 905 through a
communication bus (solid lines), such as a motherboard. The storage unit 915
can be a data
storage unit (or data repository) for storing data. The computer system 901
can be operatively
coupled to a computer network ("network") 930 with the aid of the
communication interface
920. The network 930 can be the Internet, an internet and/or extranet, or an
intranct and/or
extranet that is in communication with the Internet.
[0177] The network 930 in some cases is a telecommunication and/or
data network. The
network 930 can include one or more computer servers, which can enable
distributed computing,
such as cloud computing. For example, one or more computer servers may enable
cloud
computing over the network 930 ("the cloud") to perform various aspects of
analysis,
calculation, and generation of the present disclosure, such as, for example,
(i) training and
testing a trained algorithm, (ii) using the trained algorithm to process data
to determine the
future health of an embryo, (iii) determining a quantitative measure
indicative of the future
health of an embryo, and (iv) electronically outputting a report that is
indicative of the future
health of an embryo. Such cloud computing may be provided by cloud computing
platforms
such as, for example, Amazon Web Services (AWS), Microsoft Azure, Google Cloud
Platform,
and IBM cloud. The network 930, in some cases with the aid of the computer
system 901, can
implement a peer-to-peer network, which may enable devices coupled to the
computer system
901 to behave as a client or a server.
[0178] The CPU 905 may comprise one or more computer processors
and/or one or more
graphics processing units (GPUs). The CPU 905 can execute a sequence of
machine-readable
instructions, which can be embodied in a program or software. The instructions
may be stored
in a memory location, such as the memory 910. The instructions can be directed
to the CPU
905, which can subsequently program or otherwise configure the CPU 905 to
implement
-43-
CA 03200803 2023- 5- 31
WO 2022/119861
PCT/US2021/061287
methods of the present disclosure. Examples of operations performed by the CPU
905 can
include fetch, decode, execute, and writeback.
[0179] The CPU 905 can be part of a circuit, such as an integrated
circuit. One or more
other components of the system 901 can be included in the circuit. In some
cases, the circuit is
an application specific integrated circuit (ASIC). Without limitation, in some
cases the circuit is
derived from a specialized graphics processing unit or accelerator commonly
used for machine
learning applications.
[0180] The storage unit 915 can store files, such as drivers,
libraries and saved programs.
The storage unit 915 can store user data, e.g., user preferences and user
programs. The
computer system 901 in some cases can include one or more additional data
storage units that
are external to the computer system 901, such as located on a remote server
that is in
communication with the computer system 901 through an intranet or the
Internet.
[0181] The computer system 901 can communicate with one or more
remote computer
systems through the network 930. For instance, the computer system 901 can
communicate with
a remote computer system of a user. Examples of remote computer systems
include personal
computers (e.g., portable PC), slate or tablet PC's (e.g., Apple iPad,
Samsung Galaxy Tab),
telephones, Smart phones (e.g., Apple iPhone, Android-enabled device,
Blackberry ), or
personal digital assistants. The user can access the computer system 901 via
the network 930.
[0182] Methods as described herein can be implemented by way of
machine (e.g., computer
processor) executable code stored on an electronic storage location of the
computer system 901,
such as, for example, on the memory 910 or electronic storage unit 915. The
machine
executable or machine-readable code can be provided in the form of software.
During use, the
code can be executed by the processor 905. In some cases, the code can be
retrieved from the
storage unit 915 and stored on the memory 910 for ready access by the
processor 905. In some
situations, the electronic storage unit 915 can be precluded, and machine-
executable instructions
are stored on memory 910.
[0183] The code can be pre-compiled and configured for use with a
machine having a
processer adapted to execute the code or can be compiled during runtime. The
code can be
supplied in a programming language that can be selected to enable the code to
execute in a pre-
compiled or as-compiled fashion.
[0184] Aspects of the systems and methods provided herein, such as
the computer system
901, can be embodied in programming. Various aspects of the technology may be
thought of as
"products" or "articles of manufacture" typically in the form of machine (or
processor)
executable code and/or associated data that is carried on or embodied in a
type of machine
readable medium. Machine-executable code can be stored on an electronic
storage unit, such as
-44-
CA 03200803 2023- 5- 31
WO 2022/119861
PCT/US2021/061287
memory (e.g., read-only memory, random-access memory, flash memory) or a hard
disk.
"Storage" type media can include any or all of the tangible memory of the
computers, processors
or the like, or associated modules thereof, such as various semiconductor
memories, tape drives,
disk drives and the like, which may provide non-transitory storage at any time
for the software
programming. All or portions of the software may at times be communicated
through the
Internet or various other telecommunication networks. Such communications, for
example, may
enable loading of the software from one computer or processor into another,
for example, from a
management server or host computer into the computer platform of an
application server. Thus,
another type of media that may bear the software elements includes optical,
quantum
mechanical, electrical and electromagnetic waves, such as used across physical
interfaces
between local devices, through wired and optical landline networks and over
various air-links.
The physical elements that carry such waves, such as wired or wireless links,
optical links or the
like, also may be considered as media bearing the software. As used herein,
unless restricted to
non-transitory, tangible "storage" media, terms such as computer or machine
"readable medium"
refer to any medium that participates in providing instructions to a processor
for execution.
[0185] Hence, a machine readable medium, such as computer-
executable code, may take
many forms, including but not limited to, a tangible storage medium, a carrier
wave medium or
physical transmission medium. Non-volatile storage media include, for example,
optical or
magnetic disks, such as any of the storage devices in any computer(s) or the
like, such as may be
used to implement the databases, etc. shown in the drawings. Volatile storage
media include
dynamic memory, such as main memory of such a computer platform. Tangible
transmission
media include coaxial cables; copper wire and fiber optics, including the
wires that comprise a
bus within a computer system. Carrier-wave transmission media may take the
form of electric
or electromagnetic signals, or acoustic or light waves such as those generated
during radio
frequency (RF) and infrared (IR) data communications. Common forms of computer-
readable
media therefore include for example: a floppy disk, a flexible disk, hard
disk, magnetic tape, any
other magnetic medium, a CD-ROM, DVD or DVD-ROM, any other optical medium,
punch
cards paper tape, any other physical storage medium with patterns of holes, a
RAM, a ROM, a
PROM and EPROM, a FLASH-EPROM, any other memory chip or cartridge, a carrier
wave
transporting data or instructions, cables or links transporting such a carrier
wave, or any other
medium from which a computer may read programming code and/or data. Many of
these forms
of computer readable media may be involved in carrying one or more sequences
of one or more
instructions to a processor for execution.
[0186] The computer system 901 can include or be in communication
with an electronic
display 935 that comprises a user interface (UI) 940 for providing, for
example, (i) a visual
-45-
CA 03200803 2023- 5- 31
WO 2022/119861
PCT/US2021/061287
display indicative of training and testing of a trained algorithm, (ii) a
visual display of data
indicating the future health of an embryo, (iii) a quantitative measure of the
data indicating the
future health of an embryo, or (iv) an electronic report of the future health
of an embryo.
Examples of UIs include, without limitation, a graphical user interface (GUI),
a web-based user
interface, or a printer/printed report.
101871 Methods of the present disclosure can be implemented by way
of one or more
algorithms. An algorithm can be implemented by way of software upon execution
by the central
processing unit 905.
Examples
101881 Example 1: Phenotype Potential Risk Model for Type I
Diabetes
101891 In this example, a target genome (FIG. 6, 51), consisting of
an embryonic genome is
input into the algorithm along with the genotype (FIG. 6, 31) and phenotype
data (FIG. 6, 30)
of each related parent (FIG. 6, 50). The genome and phenotype data consist of
a binary variable
E {0,1} representing the presence { 1} or absence { } of the Type-1 diabetes
phenotype in each
parent. Genomic properties (FIG. 6, 52) are calculated for each genome and
consist of the
presence {1} or absence {0} of a noted variant corresponding to each of seven
genomic
locations that affect Type-1 diabetes. This collection of 3x7=21 genomic
properties (7 from each
parent and 7 from the Target) are applied to the logistic model (FIG. 6, 44),
described
previously. This model accepts 23 parameters including the 21 genomic
properties mentioned
above and 2 related phenotype parameters, one from each related parent (FIG.
6, 30). Applying
the 21 genomic parameters produces a distribution over the phenotype of
probability of presence
of target Type-1 Diabetes for each of the 4 combinations of related phenotypes
({0,1} x {0,1})
(FIG. 6, 53) as a potential phenotype risk. Next, the related parental
phenotypes (FIG. 6, 30) are
applied to the potential phenotype risk to resolve the two related phenotype
parameters (FIG. 6,
54). A single phenotype risk distribution is produced (FIG. 6, 55),
representing the probability
of Type 1 diabetes for the studied embryo.
101901 This process is repeated for many other health and other
factors to create a risk
profile. This profile, which is combined with the profiles resulting from
analysis performed on a
group of embryos, allows for the generation of a results panel which assists
the decisions about
which embryo(s) to implant during IVF.
101911 Example 2: Full Genome Risk Model for Type I Diabetes
101921 In this example, the genomes are represented as full genome
sequencing against
human reference genome hg19 (GRCh37), and phenotype is a binary variable E
f0,1}
representing the presence of Type 1 diabetes in each organism. The training
data is drawn from a
collection of triplets each containing two parents and a biological child. The
genomic properties
-46-
CA 03200803 2023- 5- 31
WO 2022/119861
PCT/US2021/061287
are defined as 7 specified variants per genome, and the calculation of genomic
properties
represents the identification of the presence {1} or absence {0} of each of
the 7 properties in
each genome. While numerous methods of identifying phenotype potential risks
may be used, a
simple illustration involves augmenting the logistic regression method to
include variables for
the parental phenotype, producing a model logistic regression where parental
phenotypes (4
parental phenotypes {0,1} x {0,1}) are individually alterable to produce
differing phenotype risk
profiles. This produces a potential phenotype risk that covers all of the 4
possible parental
phenotypes. The actual parental phenotypes for each training example, are
applied to the
potential phenotype risk to generate a phenotype risk as a distribution over
the possible
phenotypes.
[0193] The distribution which is indicative of a probability of the
phenotype occurring is
compared with the actual target phenotype. The accuracy of the model in
predicting actual target
phenotypes is calculated and aggregated across all training samples and the
model parameters
adjusted by gradient descent until the stopping point is reached. The
parameters for this logistic
model then define the phenotype potential risk model.
[0194] This model is applied to additional embryos and allows for
the generation of a results
panel, which assists the decisions about which embryo(s) to implant during
IVF.
[0195] Example 3: Analysis of Embryonic Genome
[0196] In this example, the entire genome of an embryo generated
during IVF is analyzed
using a three-step process prior to implantation (FIG. 10).
[0197] In the first step (FIG. 10, Step 1), embryonic genomic
sequences are identified. This
process begins by modeling the molecular processes by which each parent
produces sperm and
egg cells. Each normal adult cell contains two copies of each chromosome, one
from the father
(transmitted by sperm) and one from the mother (transmitted by the egg).
However, the single
copy of a chromosome provide by a parent is a mixture of the both of parental
chromosomes,
due to recombination.
[0198] Each chromosome contains approximately 50-300 million
nucleotide pairs that can
be arranged in a linear sequence. When a haploid (with only one chromosome
copy) is
produced, between zero and ten breaks (e.g., four breaks) are typically made.
These breaks are
sometimes referred to as "breakpoints", or chiasmata in the biology
literature, with each break
swapping a contiguous segment of the source chromosome for a homologous
segment from its
homologous chromatid partner. The result is a single chromosome from a parent
that is
composed of a mosaic, or chimera, of their two homologous chromosomes.
[0199] As segments exchanged during crossover are typically rather
large, often 10's of
millions to 100's of millions of bases, a small amount of embryonic DNA can
identify large
-47-
CA 03200803 2023- 5- 31
WO 2022/119861
PCT/US2021/061287
stretches of parental DNA. As virtually all child DNA comes from one of the
parents, such
parental DNA sequencing can be used to fill-in missing sections from the
smaller amount of
embryonic DNA.
[0200] After the complete embryonic genome is assembled, the
algorithms of the present
disclosure, as described elsewhere, combine parental genome, environmental,
and embryonic
genome factors to identify risk probabilities inherited by the embryo across a
wide spectrum of
traits (FIG. 10, Step 2).
[0201] Once the risk probabilities of phenotypes are determined,
the third step aggregates
the distributions into a single score for each embryo. An example of such a
score might be an
expected change in quality adjusted life years for each embryo, aggregated
across phenotypes,
with each the probability of each phenotype contributing a component based on
that phenotype's
probability and the QALY impact of the phenotype. QALY impact of phenotypes
may be
derived using epidemiological impact data (FIG. 10, Step 3). A report is
generated displaying
the ranking of embryos ranked according to the score (FIG. 10, PG Report). In
the above
example the score represents the, expected health of a person who develops
from the
corresponding DNA in quality adjusted life-years (QALY). This single score
gives a clear and
interpretable measure of the expected health of a person maturing from this
embryo. Additional
risk weighting and phenotype impact details may also be presented in the
report providing
greater detail helpful for selecting one embryo from among the collection for
implantation.
[0202] The embryo is ranked against other similarly-analyzed
embryos. This aids parents
undergoing IVF in making decisions between embryos with, for example, an
embryo which
exhibits a 10-fold increase in risk of Type I diabetes coupled with a normal
(1-fold) risk of lung
cancer versus an embryo which exhibits a normal (1-fold) risk of Type I
diabetes coupled with a
10-fold increase in risk of lung cancer, and allows parents to choose embryos
with the highest
QALY score. This clarifies the parental selection process during IVF.
[0203] Example 4: Comparison and Ranking of Two Embryos for
Selection during IVF
[0204] In this example, disease risk distributions are combined
with phenotype impact to
identify a quantitative figure of merit (QALY). Disease risk traits provide a
negative impact on
the figure of merit while protective factors provide a positive impact on the
QALY score. Two
embryos, corresponding to two genomes, are compared and ranked resulting in
the embryo with
the higher figure of merit being selected for implantation during IVF.
[0205] Software tools and Reference Data. Software tools which may
be used are, e.g.,
Ubuntu Linux V20, bash shell; Samtools; bcftools; GLIMPSE imputation. Human
reference
genome hg19/GRCh37 is selected. The reference genome defines the shared
coordinate system.
Using a variety of human genomes, a genomic diversity reference panel is
obtained. The
-48-
CA 03200803 2023- 5- 31
WO 2022/119861
PCT/US2021/061287
genomic diversity reference panel is used to calculate the density of
recombination events at
breakpoints, which defines replicons (FIG. 8 and FIG. 11). Alternatively, a
known genome
reference panel, such as the one found at ftp. 1000gencimes.ebi.ac.u.k/vol
Ifft.p, can also be used.
The reference genome contains phased information for a large number of
individual genomes
spanning a substantial fraction of human diversity. The reference panel is
referred to as:
Reference .vcf
102061 Step 1: Obtain Parental and Embryonic samples. To obtain
parental and
embryonic samples, a sperm provider (father) and egg provider (mother) visit a
reproductive
medicine clinic. A sperm sample is produced by the father and oocytes are
retrieved from the
mother for example, using the process described in Choe J, Archer JS, Shanks
AL. In Vitro
Fertilization. [Updated 2021 Sep 9]. In: StatPearls [Internet]. Treasure
Island (FL): StatPearls
Publishing; 2021 Jan. The sperm and eggs are processed to generate embryos
which are
subsequently processed for preimplantation genetic testing (PGT). Embryonic
DNA samples are
processed by isolating DNA molecules from the embryonic cells, preparing a DNA
sequencing
library, sequencing the library to produce embryonic reads, and computer
processing the
embryo-derived sequence reads. Samples are also taken from the father and
mother for similar
processing to obtain computer processed parental-derived sequence reads.
102071 Step 2: Obtain aligned and called parental DNA information.
Once the parental-
derived sequence reads are amassed, complete parental variation information
sequences are
obtained (FIG. 10). Full parental genomic information allows for the
identification of each
nucleotide at every position in the reference genome coordinate system; the
reference genome is
used to identify genomic coordinates. This data can be provided in a text-
based file format (e.g.,
VCF). The reference genome identifying genomic coordinates may be identified
by examining
the #tfreference record which might indicate a reference format such as
"Htreference=file : ///seq/references/hg19 . fa. gz", indicating the hg19
reference genome coordinate system. Parental genomes are referred to in the
files:
Mother. .vcf
Father. .vcf
102081 Step 3: Obtained aligned embryonic DNA. The embryonic-
derived sequence reads
are then aligned for each of N embryos. This data can be developed in the
course of
preimplantation genetic testing for aneuploidy (PGT-A) using whole genome
sequencing (WGS)
(FIG. 10, Step 1). Aligned data identifies the alignment reference (HG19) as
well as the
coordinates of each mapped read (a sequence of nucleic acids, generally 30-300
bases in length)
in a sequence alignment and mapping (SAM) file, or its compressed, binary
counterpart, a BAM
file.
-49-
CA 03200803 2023- 5- 31
WO 2022/119861
PCT/US2021/061287
102091 A dataset for embryonic DNA may contain 0.01 to 1.00-fold
coverage of the genome
consisting of 30 million to 3 billion individual nucleotides. This compares to
the parental DNA
information which may be distilled from 30 to 60-fold coverage (90 billion to
160 billion
nucleotides).
Embryo 001 .bam, Embryo 002 .bam, EmbryoN.bam
102101 However, HG002.hs37d5.2x250.bam contains much more data than
can typically be
safely retrieved from a human embryo. To simulate characteristics of an
embryonic sample it
may be subsamples to simulate typical embryonic coverage such as 300 million
nucleotides.
This may be performed via the command:
samtools view -subsample
102111 BAM files may be viewed using the samtools view command, in
particular the
alignment genomic reference be confirmed from the @PG header record displayed
when
providing the samtools option -H:
$ samtools view -H Embryo 001 .bam
102121 which will include a @PG record showing the history commands
that generated the
.bam file, including the aligner and the reference genome, for example:
@PG ID: novoalign PN:novoalign
VN: V3 . 02 .07
CL:novoalign
-d /
cluster/ifs/projects/Gen.omes/GIAB/refseqs/hs37d5.
ndx
-f ../../fastq 2x250/D1 S1 L001 R1 001 . fastq.gz
../../fastq 2x250/D1 S1 L001 R2 001 . fastq.gz
-F STDFQ --Q2Off -t 700 -o SAM -c 1
102131 Here the text "hs37d5" indicates that the reference genome
is hs37, which for
this example may be interpreted as GRCh37 or equivalent to reference hg19 .
102141 Step 4: Impute Embryonic genome. The embryonic genome is
generated from a
combination of the information derived from the maternal and paternal DNA
(FIG. 1B). This is
done by augmenting the reference panel to contain the parental genomes:
$ bcftools merge -o Reference-aug . vcf \
Reference.vcf Mother.vcf Father.vcf
102151 The paternal and maternal derived sequence reads can then be
used to determine the
genomic sequence of the embryo. Variant calling, the process by which small
nucleotide
polymorphisms and other minor genomic changes are identified, is performed on
the embryonic
genome. As the embryonic genome has less genomic information than either the
parental or
-50-
CA 03200803 2023- 5- 31
WO 2022/119861
PCT/US2021/061287
reference genomes due to the limitations in sample gathering, error estimates
at each genomic
position in Embryo 001.vcf will be high. No embryonic read data may be
available for
many genomic positions.
$ bcftools mpileup -f hg19.fasta.gz -I -E -a
'FORMAT/DP' \
-T sites.vcf Embryo 001.bam -Ou \
bcftools call -Aim -C alleles -T sites.tsv \
-Oz -o Embryo 001.thin.vcf
102161 To identify irregularities, the density of reads for each
chromosome is used to
identify aneuploidy, i.e., missing or excess chromosomes, and other genetic
variations. The -r
(region) flag with the samtools command:
samtools coverage Embryo 001.bam
provides an estimate of read depth on each chromosome chromosomes with
significantly fewer
or more than normal number of are indications of aneuploidy and is used to
test for the presence
or an absence of an aneuploidy or a genetic variation of the embryo.
102171 The next step is to perform imputation on the low-quality
embryonic calls,
conditioned on the parental data in the augmented reference panel. Source
code, such as
GLIMPSE, may be altered to ensure that the parents are included in each random
sample,
forcing the software to draw unknown genomic material from the parents, but
crossover
probabilities from the reference panel. Alternatively, it may be desirous to
remove some of the
non-parental genomes to focus inference on parental information.
Alternatively, the code can be
modified to force the inclusion of parental data at every random sampling of
the reference:
$ GLIMPSE phase --input Embryo 001.thin.vcf \
--reference Reference.vcf --output
Embryo 001.full.vcf
This step specifically identifies breakpoints and breakpoint densities along
the reference genome
from the linkage disequilibrium in the reference panel. This step also
comprises computer
processing the embryo-derived sequence reads and the parental-derived sequence
reads to
determine the genomic sequence of the embryo.
102181 Step 5: Computational analysis of embryonic genome to find
phenotype risk
profiles. Once the embryonic genome has been inferred, it is analyzed for key
traits (FIG. 10,
Step 2). Traits are inferred from the embryonic genome via genomic properties.
The primary
genomic property used in this example is the presence or absence of an
alternate (non-reference)
allele at each position in the inferred embryonic genome in accordance with
(FIG. 1A, 80) an
-51 -
CA 03200803 2023- 5- 31
WO 2022/119861
PCT/US2021/061287
(FIG. 1A, 81). The collection of these genomic properties allows phenotype
risk models to
Calculate Phenotype Risks (FIG. 5, 41).
102191 The embryonic genome is scanned for monogenic phenotypes,
phenotypes
determined by a single gene (e.g., sickle cell anemia, cystic fibrosis,
Huntington disease, or
Duchenne muscular dystrophy), by comparing the inferred genotype at each
position to a list of
known monogenic predictions. This identifies the probability of inherited
monogenic traits from
each parent, even when the trait is a disease. As the embryonic genome is
fully phased, this also
provides the number of alternate alleles when an alternate allele is present.
Alternatively or
additionally, the genome can be scanned for phenotype associated variants
found in the SNPedia
database to determine risk factors for variant phenotypes.
102201 Once the embryonic sequence is identified (Embryo 001 . full
.vcf), the
variants in this sequence may be used to identify phenotype trait risk
factors, employing the PGS
(Poly Genic Score) catalog (wi,vw.pgscataJog.org). Each trait is defined by an
experimental
factor ontology (EFO) ID.
102211 An example model for EFO 0001360 corresponds to Type II
diabetes mellitus:
Citation = Vassy JL et al. Diabetes (2014).
doi:10.2337/db13-1663
rsID chr name effect allele effect weight
locus name
rs12970134 18 A 0.0334 MC4R
rs13233731 7 G 0.0043 KLF14
rs13389219 2 C 0.0374 GRB14
rs1801282 3 C 0.0453 PPARG
rs2261181 12 I 0.0414 HMGA2
rs2943640 2 C 0.0414 IRS1
rs459193 5 G 0.0414 ANKRD55
rs780094 2 C 0.0334 GCKR
rs8182584 19 I 0.0212 PEPD
rs9936385 16 C 0.0531 FTO
102221 The variants (effect allele) possessed by the embryo are
cumulated and
produce a net log-odds ratio for the trait. The log-odds ratio is combined
with the population risk
for the trait (identified in the GHDx database to generate an absolute risk
for this trait. This
mapping may be performed by custom software or by a by services such as
www.impute.rne or
selfdecode.com to provide risk estimates for each trait versus EFO code, based
on the embryonic
genome. Computer processing employs PGRS models trained with machine learning
algorithms,
particularly generalized linear models and logistic regression. Risk
distributions are produced by
applying the PRS models to embryonic genomes inferred from both parental
genomic haplo-
blocks.
-52-
CA 03200803 2023- 5- 31
WO 2022/119861
PCT/US2021/061287
102231 Step 6. Combine phenotype risk profiles into a single figure
of merit. The next
step combines the numerous risk profiles generated for each embryonic genome
during the
previous step, into a single score suitable. Providing a single score (a PG
report) for each
embryonic genome allows the embryos to be ordered according to the score for
preferred usage,
including gestation or storage (FIG. 10, Step 3).
102241 Several databases contain trait impacts in terms of
epidemiological statistics, such as
prevalence (people living with trait), incidents (new observations per yew),
DALY (disability
adjusted life years lost) and YLL (years of life lost). These measure the
burden or impact of
having a trait, PRS measures the genomic risk for having a trait. By combining
these values, we
can estimate the expected impact of having a trait. PRS Trait risks are
identified as probability of
the reporting of an EFO trait.
102251 The GHDx epidemiology global health database reports traits
as Causes identified
via ICD codes Jason L. Vassy et al, as "Polygenic Type 2 Diabetes Prediction
at the Limit of
Common Variant Detection". The first step is to create a mapping between these
terms
identifying the GHDx ICD code or codes corresponding to each EFO trait. For
example, "Type
2 Diabetes Mcllitcs" is GHDx cause B.8.1.2 and corresponds to ICD10 code Ell,
which in turn
maps to EFO 0001360, which has several PGRS models associated with it. This
mapping can be
found at github.com/EBISPOT/EFO-UKB-mappings.
102261 DALYs are estimated on a population-wide scale and represent
a deviation from a
population-wide estimate of quality of life. However, populations are
generally composed of
three groups of people, people with a trait, people who will never have that
trait and people who
do not presently have the trait but will someday. While DALY measures the
burden of disease
on people who have it, it is also possible to estimate the value (anti-burden)
of being resistant to
a disease by considering the lifetime likelihood of getting a disease and the
value of a reduction
in the likelihood. Properly calibrated, PRS provide us both the probability of
having a trait, and
the probability of never having the trait. This allows for traits that are
protective as well as traits
that are dangerous.
102271 If the total population is N and the people who will get a
disease is Np and the per-
capita DALY cost of having a disease is DALYp the total burden of having the
disease is
Np x DALY. However, the total quality of life is measured as a population
average across both
sick and well, estimating the perennially well Nff as Nr, = N ¨ Np we have Np
x DALYp +
N- x DALY- = DALY = 0 therefore N x DALY ¨ ¨N- x DALY- and DALY- ¨ N xDALY
P P
N-NP
Intuitively, if a few people get sick, there is a small advantage of being
resistant to the illness.
-53-
CA 03200803 2023- 5- 31
WO 2022/119861
PCT/US2021/061287
However, when a disease is widespread (e.g., Metabolic syndrome in the USA in
2020) the
advantage of a protective factor is substantial.
[0228] Consider two diseases in a population. The first is diabetes
with 5.3% of people
getting it with an impact 6.96 DALY (quality adjusted life years lost). The
impact being
N xDALY (Nx5.3%)x6.96
protected from it may be DALY75, =
_____________________________________________ = 0.389; one may gain
N¨N N¨Nx5.30/0
0.398 quality adjusted life years if they knew they were protected from it.
Now consider a
second disease, cancer, with 1.1% of the population getting it, and an impact
of 5.37 DALY.
N xDALY
(Nx1.1o/o)x5.37
The impact being protected from it may be DALYA = _________ Ply ¨Np
P = = 0.0597;
N-Nxi.1%
one may gain 0.597 quality adjusted life years if they knew they were
protected from it.
[0229] The net impact of all an embryo's genomic traits are
tallied, and a PG report score is
provided for each embryo. For example, the odds ratio produced by a PRS to an
embryonic
genome can produce the absolute probability of having a disease. When combined
with disease
frequency (Prevalence or Incidence, as appropriate) this can generate a change
in expected
probability of a trait t conditioned on genome G as P(G), and the probability
of not having the
trait is PE(G) = 1 ¨ Pt(G) the expected impact of genomic on DALY is.
Pt(G) x DALYt + Pc(G) x DALYE
102301 For a given collection of traits T, with t E T the expected
net impact is estimated as:
Score(G) =
(Pt(G) x DALYt + Pt(G) x DALY)
tET
[0231] Consider the same two diseases identified in step 6.2. Now
assume there are two
embryonic genomes:
G1 with risk scores that offer a 9% chance of diabetes, but a 32% chance of
cancer
G2 with risk scores that offer a 22% chance of diabetes, but a 4% chance of
cancer
These genomes can be scored using the formula:
Score(G1) =
[9% x 6.96 + (1 ¨ 9%) x ¨0.389] + [32% x 5.37 + (1 ¨ 32%) x ¨0.0597]
[0.6264 + ¨0.354] + [1.7184 + ¨0.0406] = 1.950 DALY
Score(G2) =
122% x 6.96 + (1 ¨ 22%) x ¨0.389] + 14% x 5.37 + (1 ¨ 4%) x ¨0.0597] =
[1.5312 + ¨0.303] + [0.2148 + ¨0.05731] = 1.385 DALY
[0232] Step 7. Rank embryos for further intervention based on
score. Embryos can be
ranked for further intervention based on score. For the two genomes described
above:
-54-
CA 03200803 2023- 5- 31
WO 2022/119861
PCT/US2021/061287
Score(G1) = 1.950 DALY=-1.950 QALY, Score(G2) = 1.385 DALY = -
1.385 QALY
102331 Ranking these genomes according to QALY, Score(G2) >
Score(G1) so it can be
expected that the embryo corresponding to Genome 2 will have a healthier,
longer life by nearly
(-1.385 - -1.950) = 0.565QALY or 12*0.565= 6.8 QAL months.
102341 This information is presents in the form of a PG report
(FIG. 10), which is presented
to an IVF patient. The patient, struggling to select between embryos, can
chose the one with the
higher QALY score, in this case, embryo 2, and have it implanted for
procreation.
-55-
CA 03200803 2023- 5- 31