Note: Descriptions are shown in the official language in which they were submitted.
WO 2022/170127
PCT/US2022/015358
1
RISK-AWARE AND STRATEGY-ADAPTIVE CONSUMPTION PLANNING FOR
PROCESS AND MANUFACTURING PLANTS
TECHNICAL FIELD
100011 This disclosure is generally directed to consumption planning systems.
More
specifically, this disclosure is directed to risk-aware and strategy-adaptive
consumption planning
for process and manufacturing plants.
BACKGROUND
100021 Consumption planning generally refers to the process of determining a
schedule for
acquiring materials to be used by a manufacturing or processing plant to
produce one or more
products. For example, consumption planning may involve determining how
various raw materials
should be acquired in order to ensure that desired quantities of various
products can be produced
within a given time period. Consumption planning for a plant typically
involves identifying an
acquisition schedule (such as one or more raw materials to be obtained,
quantities of the raw
materials to be obtained, and timing of the raw materials to be obtained) for
the plant over a
forward-looking time horizon.
SUMMARY
100031 This disclosure relates to risk-aware and strategy-adaptive consumption
planning for
process and manufacturing plants.
100041 In a first embodiment, a method includes obtaining information defining
multiple
customer orders for one or more products over time. The method also includes
using machine
learning to identify one or more of the customer orders that are likely to
change based on
classification of the customer orders. The method further includes using
machine learning to
estimate one or more lengths of time that the one or more customer orders are
likely to change
based on regression of the customer orders. In addition, the method includes
generating a
consumption plan for a facility based on the one or more estimated lengths of
time that the one or
more customer orders are likely to change.
100051 In a second embodiment, an apparatus includes at least one processing
device
configured to obtain information defining multiple customer orders for one or
more products over
time. The at least one processing device is also configured to use machine
learning to identify one
or more of the customer orders that are likely to change based on
classification of the customer
orders. The at least one processing device is further configured to use
machine learning to estimate
CA 03207222 2023- 8- 1
WO 2022/170127
PCT/US2022/015358
2
one or more lengths of time that the one or more customer orders are likely to
change based on
regression of the customer orders. In addition, the at least one processing
device is configured to
generate a consumption plan for a facility based on the one or more estimated
lengths of time that
the one or more customer orders are likely to change.
100061 In a third embodiment, a non-transitory computer readable medium stores
computer
readable program code that when executed causes one or more processors to
obtain information
defining multiple customer orders for one or more products over time. The
medium also stores
computer readable program code that when executed causes the one or more
processors to use
machine learning to identify one or more of the customer orders that are
likely to change based on
classification of the customer orders. The medium further stores computer
readable program code
that when executed causes the one or more processors to use machine learning
to estimate one or
more lengths of time that the one or more customer orders are likely to change
based on regression
of the customer orders. In addition, the medium stores computer readable
program code that when
executed causes the one or more processors to generate a consumption plan for
a facility based on
the one or more estimated lengths of time that the one or more customer orders
are likely to change.
[0007] Other technical features may be readily apparent to one skilled in the
art from the
following figures, descriptions, and claims.
BRIEF DESCRIPTION OF THE DRAWINGS
[0008] For a more complete understanding of this disclosure, reference is now
made to the
following description, taken in conjunction with the accompanying drawings, in
which:
[0009] FIGURE 1 illustrates an example system supporting risk-aware and
strategy-adaptive
consumption planning for process and manufacturing plants according to this
disclosure;
[0010] FIGURE 2 illustrates an example device supporting risk-aware and
strategy-adaptive
consumption planning for process and manufacturing plants according to this
disclosure;
100111 FIGURE 3 illustrates an example order with multiple order lines for use
during
consumption planning for process and manufacturing plants according to this
disclosure;
[0012] FIGURE 4 illustrates an example order change history for use during
consumption
planning for process and manufacturing plants according to this disclosure;
[0013] FIGURE 5 illustrates an example architecture supporting risk-aware and
strategy-
adaptive consumption planning for process and manufacturing plants according
to this disclosure;
[0014] FIGURE 6 illustrates an example entity relationship diagram that may
support the use
of machine learning during risk-aware and strategy-adaptive consumption
planning for process
CA 03207222 2023- 8- 1
WO 2022/170127
PCT/US2022/015358
3
and manufacturing plants according to this disclosure,
[0015] FIGURE 7 illustrates an example order change history related to a
completed order
line for use during consumption planning for process and manufacturing plants
according to this
disclosure;
100161 FIGURE 8 illustrates example timelines associated with performing
consumption
planning relative to changing orders from a customer according to this
disclosure;
[0017] FIGURE 9 illustrates example purchase sequences that may be associated
with a
customer and considered during consumption planning according to this
disclosure;
[0018] FIGURE 10 illustrates an example order change history related to a
completed order
line updated with prediction targets for use during consumption planning for
process and
manufacturing plants according to this disclosure;
[0019] FIGURE 11 illustrates an example customized regression loss function
that may be
used by a machine learning model during risk-aware and strategy-adaptive
consumption planning
for process and manufacturing plants according to this disclosure,
[0020] FIGURE 12 illustrates an example decrementing of a demand forecast
based on order
lines during risk-aware and strategy-adaptive consumption planning for process
and manufacturing
plants according to this disclosure,
[0021] FIGURE 13 illustrates an example demand forecast allocation over a
planning horizon
during risk-aware and strategy-adaptive consumption planning for process and
manufacturing
plants according to this disclosure;
100221 FIGURES 14 and 15 illustrate example results of risk-aware and strategy-
adaptive
consumption planning for process and manufacturing plants according to this
disclosure; and
[0023] FIGURE 16 illustrates an example method for risk-aware and strategy-
adaptive
consumption planning for process and manufacturing plants according to this
disclosure.
DETAILED DESCRIPTION
[0024] FIGURES 1 through 16, described below, and the various embodiments used
to
describe the principles of the present disclosure are by way of illustration
only and should not be
construed in any way to limit the scope of this disclosure Those skilled in
the art will understand
that the principles of the present disclosure may be implemented in any type
of suitably arranged
device or system.
[0025] As noted above, consumption planning generally refers to the process of
determining
a schedule for acquiring materials to be used by a manufacturing or processing
plant to produce
CA 03207222 2023- 8- 1
WO 2022/170127
PCT/US2022/015358
4
one or more products. For example, consumption planning may involve
determining how various
raw materials should be acquired in order to ensure that desired quantities of
various products can
be produced within a given time period. Consumption planning for a plant
typically involves
identifying an acquisition schedule (such as one or more raw materials to be
obtained, quantities
of the raw materials to be obtained, and timing of the raw materials to be
obtained) for the plant
over a forward-looking time horizon.
100261 Consumption planning has traditionally been performed manually and is
labor-
intensive. Often times, approaches for consumption planning involve trial-and-
error to adjust and
fully tune an acquisition schedule. This is because these approaches commonly
suffer from biases
introduced by human intuition, which may not be fully reflective of reality.
As a result, these
approaches often fail to comprehensively consider risk, and it is difficult to
adjust and adapt these
approaches to moving risk targets and strategies.
100271 This disclosure provides an apparatus, method, and computer readable
medium
supporting a process for consumption planning that more accurately quantifies
demand uncertainty
associated with customer orders and provides risk-aware and strategy-adaptive
modifications to
upcoming customer orders. The described approaches generate a consumption plan
for a plant for
a time horizon into the future. The described approaches uniquely combine
customer orders and
demand forecasts for the future and propose risk-aware and strategy-adaptive
modifications to the
upcoming customer orders. This is accomplished by leveraging certainty
thresholds and
asymmetric loss functions that encode the level of suitable risk by the plant.
The described
approaches generally involve three operations. A data-driven prediction of
which upcoming
customer orders are more likely to be subject to change is made, leveraging
one or more certainty
thresholds. If an order is deemed to be more likely to be subject to change,
an order fulfillment
date is predicted by following a data-driven optimization approach that relies
on a piecewise
asymmetric loss function. The loss function is defined to encode an adopted
strategy for fulfilling
customer orders by the plant. The customer orders (which include one or more
modified customer
orders and any non-modified customer orders) are combined with a remainder
demand forecast,
which is distributed over the planning horizon following a historical
consumption distribution.
100281 In this way, the described approaches for consumption planning can be
performed
much more quickly and with much less manual effort by plant operators or other
personnel.
Moreover, the described approaches enable more realistic consumption planning
by intuitively
encoding a level of desired risk by a plant and its planning strategies.
Further, the described
approaches for consumption planning can reduce or avoid biases introduced by
human intuition,
CA 03207222 2023- 8- 1
WO 2022/170127
PCT/US2022/015358
thereby reducing or avoiding problems associated with those biases. In
addition, the described
approaches can comprehensively consider risk and can adjust and adapt to
moving risk targets and
strategies.
100291 Note that the approaches described below for consumption planning may
be used in
5 any number of applications. Example use cases for the described
approaches may include use with
chemical manufacturing or processing facilities, food processing facilities,
paper or pulp
manufacturing or processing facilities, and oil and gas processing facilities.
In general, the
approaches described below may be used in any suitable manner to support
consumption planning.
100301 FIGURE 1 illustrates an example system 100 supporting risk-aware and
strategy-
adaptive consumption planning for process and manufacturing plants according
to this disclosure.
For example, the system 100 shown here can be used to support the consumption
planning process
described below. As shown in FIGURE 1, the system 100 includes user devices
102a-102d, one
or more networks 104, one or more application servers 106, and one or more
database servers 108
associated with one or more databases 110. Each user device 102a-102d
communicates over the
network 104, such as via a wired or wireless connection. Each user device 102a-
102d represents
any suitable device or system used by at least one user to provide or receive
information, such as
a desktop computer, a laptop computer, a smartphone, and a tablet computer.
However, any other
or additional types of user devices may be used in the system 100.
100311 The network 104 facilitates communication between various components of
the
system 100. For example, the network 104 may communicate Internet Protocol
(IP) packets, frame
relay frames, Asynchronous Transfer Mode (ATM) cells, or other suitable
information between
network addresses. The network 104 may include one or more local area networks
(LANs),
metropolitan area networks (MANs), wide area networks (WANs), all or a portion
of a global
network such as the Internet, or any other communication system or systems at
one or more
locations. In some cases, the network 104 may represent an internal or private
network used by an
owner or operator of a process manufacturing plant.
100321 The application server 106 is coupled to the network 104 and is coupled
to or otherwise
communicates with the database server 108. The application server 106 supports
the consumption
planning process described below. For example, the application server 106 may
execute one or
more applications 112 that use data from the database 110 to perform
consumption planning. Note
that the database server 108 may also be used within the application server
106 to store
information, in which case the application server 106 may store the
information itself used to
perform consumption planning.
CA 03207222 2023- 8- 1
WO 2022/170127
PCT/US2022/015358
6
100331 The database server 108 operates to store and facilitate retrieval of
various information
used, generated, or collected by the application server 106 and the user
devices 102a-102d in the
database 110. For example, the database server 108 may store various
information related to
customer product orders and other information used during consumption
planning.
100341 In this example, at least some of the information used by the
application server 106
and/or stored in the database 110 may be received over at least one additional
network 114 from
one or more customer systems 116a-116n. For example, the network 114 may
represent a public
data network (such as the Internet) or other network that allows the one or
more customer systems
116a-116n to provide information to and receive information from the owner or
operator of a
process manufacturing plant. As a particular example, the one or more customer
systems 116a-
116n may be used by customers to provide order information to the owner or
operator of the
process manufacturing plant, where that information can be used by the
application server 106 to
perform consumption planning.
100351 A determined consumption plan produced by the application server 106
may be used
in any suitable manner. For example, the determined consumption plan may be
presented to one
or more users, such as via one or more of the user devices 102a-102d. The one
or more users may
review the determined consumption plan, make changes to the determined
consumption plan, or
perform other actions using the determined consumption plan. The determined
consumption plan
may also be used by the application server 106 or other device to
automatically order raw materials,
schedule operations to be performed using the raw materials, or control
operations being performed
using the raw materials. In general, one or more consumption plans may be used
in any suitable
manner with or without user interaction.
100361 Although FIGURE 1 illustrates one example of a system 100 supporting
risk-aware
and strategy-adaptive consumption planning for process and manufacturing
plants, various
changes may be made to FIGURE 1. For example, the system 100 may include any
number of user
devices 102a-102d, networks 104, 114, application servers 106, database
servers 108, databases
110, and customer systems 116a-116n. Also, these components may be located in
any suitable
locations and might be distributed over a large area. In addition, while
FIGURE 1 illustrates one
example operational environment in which consumption planning may be used,
this functionality
may be used in any other suitable system.
100371 FIGURE 2 illustrates an example device 200 supporting risk-aware and
strategy-
adaptive consumption planning for process and manufacturing plants according
to this disclosure.
One or more instances of the device 200 may, for example, be used to at least
partially implement
CA 03207222 2023- 8- 1
WO 2022/170127
PCT/US2022/015358
7
the functionality of the application server 106 of FIGURE 1. However, the
functionality of the
application server 106 may be implemented in any other suitable manner. In
some embodiments,
the device 200 shown in FIGURE 2 may form at least part of a user device 102a-
102d, application
server 106, database server 108, or customer system 116a-116n in FIGURE 1.
However, each of
these components may be implemented in any other suitable manner.
100381 As shown in FIGURE 2, the device 200 denotes a computing device or
system that
includes at least one processing device 202, at least one storage device 204,
at least one
communications unit 206, and at least one input/output (I/0) unit 208. The
processing device 202
may execute instructions that can be loaded into a memory 210 The processing
device 202
includes any suitable number(s) and type(s) of processors or other processing
devices in any
suitable arrangement. Example types of processing devices 202 include one or
more
microprocessors, microcontrollers, digital signal processors (D SP s),
application specific integrated
circuits (ASICs), field programmable gate arrays (FPGAs), or discrete
circuitry.
100391 The memory 210 and a persistent storage 212 are examples of storage
devices 204,
which represent any structure(s) capable of storing and facilitating retrieval
of information (such
as data, program code, and/or other suitable information on a temporary or
permanent basis). The
memory 210 may represent a random access memory or any other suitable volatile
or non-volatile
storage device(s). The persistent storage 212 may contain one or more
components or devices
supporting longer-term storage of data, such as a read only memory, hard
drive, Flash memory, or
optical disc.
100401 The communications unit 206 supports communications with other systems
or devices.
For example, the communications unit 206 can include a network interface card
or a wireless
transceiver facilitating communications over a wired or wireless network, such
as the network 104
or 114. The communications unit 206 may support communications through any
suitable physical
or wireless communication link(s).
100411 The I/O unit 208 allows for input and output of data. For example, the
I/O unit 208
may provide a connection for user input through a keyboard, mouse, keypad,
touchscreen, or other
suitable input device. The I/O unit 208 may also send output to a display,
printer, or other suitable
output device. Note, however, that the I/O unit 208 may be omitted if the
device 200 does not
require local I/O, such as when the device 200 represents a server or other
device that can be
accessed remotely.
100421 Although FIGURE 2 illustrates one example of a device 200 supporting
risk-aware
and strategy-adaptive consumption planning for process and manufacturing
plants, various
CA 03207222 2023- 8- 1
WO 2022/170127
PCT/US2022/015358
8
changes may be made to FIGURE 2. For example, computing and communication
devices and
systems come in a wide variety of configurations, and FIGURE 2 does not limit
this disclosure to
any particular computing or communication device or system.
100431 The following now describes example approaches for performing risk-
aware and
strategy-adaptive consumption planning for process and manufacturing plants.
Note that the
specific details provided below are for illustration only and can vary as
needed or desired. For
instance, specific equations and curves are provided below for features such
as a loss function and
consumption plan metrics, and these equations and curves may be modified as
needed or desired.
For ease of explanation, it is assumed that the approaches described below are
performed using the
application server 106 of FIGURE 1, which may be implemented using one or more
instances of
the device 200 of FIGURE 2. However, the approaches described below may be
implemented
using any suitable device(s) in any suitable system(s).
100441 Consider a manufacturing, processing, or other facility that is
responsible for satisfying
customer demand for multiple products. Each of multiple customers may submit
one or more
orders, and each order can contain one or multiple order lines associated with
one or multiple
products. FIGURE 3 illustrates an example order 300 with multiple order lines
for use during
consumption planning for process and manufacturing plants according to this
disclosure. As can
be seen in FIGURE 3, each order line represents a request for an item and
contains information
associated with that item. In this example, each order line includes an
identification of the customer
ordering an item (product), the item to be purchased or otherwise obtained by
the customer, a
quantity of the item requested, and a requested date by which the customer
would like to obtain
the item being ordered. Other information in each order line can include a
customer location where
the item is to be delivered, a current status of the order line, and the date
that the order was
created/updated. In some cases, different order lines of an order 300 can
specify different items,
different quantities, and/or different requested dates.
100451 By aggregating orders across order lines for each product and date, a
forward-looking
demand can be estimated for the products. This anticipated demand can be
referred to as "planned
consumption" or a "consumption plan." Ideally, the order lines would provide a
perfect view of
what future demand for the products will be. However, in reality, this is
rarely the case. There are
various sources of uncertainty that can prevent order lines from being taken
at face value when
determining planned consumption. For instance, example sources of uncertainty
may include (i)
additional customer orders that may be submitted within a scheduling horizon
and (ii) open order
lines that are subject to change by the customers within the scheduling
horizon.
CA 03207222 2023- 8- 1
WO 2022/170127
PCT/US2022/015358
9
100461 Regarding the first source of uncertainty above, the potential for
additional customer
orders to be submitted within a scheduling horizon can emphasize the
importance of obtaining a
consumption plan that anticipates future demand, even if the future demand has
not yet been
realized in the form of an open order line. To address this, a demand forecast
is typically utilized.
Note that various approaches for generating a demand forecast are known in the
art, and other
approaches are sure to be developed in the future. Any suitable technique for
generating a demand
forecast may be used here, and it is assumed below that a demand forecast has
been generated and
is available for use during consumption planning. It is also assumed below
that a demand forecast
is available for each product and that the demand forecast is reported at a
coarser frequency than
what consumption planning involves. For example, planned consumption may be
needed at a daily
interval, while demand forecasts may be generated or otherwise made available
on a monthly basis.
How the demand forecast can be utilized is described in more detail below.
100471 The second source of uncertainty above refers to the uncertainty
associated with
existing open order lines. Specifically, customers may make modifications to
their open orders.
One common example of this involves a customer changing an order's requested
date, meaning a
customer may be free to bring forward or push back the requested date by which
the customer
would like to receive an order. In some cases, the sequence of changes to a
particular customer
order and corresponding order lines may be tracked using an order change
history.
100481 FIGURE 4 illustrates an example order change history 400 for use during
consumption
planning for process and manufacturing plants according to this disclosure. As
shown in FIGURE
4, the order change history 400 identifies one or more changes that have been
made to the order
300 shown in FIGURE 3. In this specific example, the order change history 400
indicates that the
first order line "1.1" in the order 300 has been changed twice, where each
change involves altering
the requested date. The order change history 400 also indicates that the third
order line "1.3" in the
order 300 has been changed once, again by altering the requested date. As can
be seen here,
uncertainty in consumption planning can arise because customers may change
when specific
quantities of items are requested.
100491 Ideally, a generated consumption plan can address various sources of
uncertainty,
including those sources of uncertainty described above. Among other things,
the ways in which
these sources of uncertainty are quantified can reflect the priorities of a
particular plant or business.
For example, a risk-averse business may want to plan for orders earlier than
anticipated, such as
to account for the possibility of a customer changing a requested date to be
earlier than previously
requested. A less risk-averse business may want to plan for orders closer to
their original requested
CA 03207222 2023- 8- 1
WO 2022/170127
PCT/US2022/015358
dates. Thus, a generated consumption plan may capture the following elements.
The consumption
plan may provide a forward-looking anticipated demand, such as for purposes of
production
scheduling and supply chain management. The consumption plan may handle
uncertainties
associated with incomplete information and potential changes to existing
information. The
5 consumption plan may ensure that anticipated demand appropriately
captures the business or
plant's aversion to risk (whatever that might be). The following discussion
provides an overview
of a consumption planning approach to produce such a consumption plan, which
is followed by
more detailed discussions of aspects of the consumption planning approach.
[0050] Although FIGURE 3 illustrates one example of an order 300 with multiple
order lines
10 for use during consumption planning for process and manufacturing plants
and FIGURE 4
illustrates one example of an order change history 400 for use during
consumption planning for
process and manufacturing plants, various changes may be made to FIGURES 3 and
4. For
example, the information contained in the order 300 of FIGURE 3 can easily
vary based on factors
such as the items being obtained, the quantities of the items, the dates
requested, and the locations
of delivery. Similarly, the information contained in the order change history
400 of FIGURE 4 can
easily vary based on factors such as the original order and how order lines in
the original order
change over time.
[0051] FIGURE 5 illustrates an example architecture 500 supporting risk-aware
and strategy-
adaptive consumption planning for process and manufacturing plants according
to this disclosure.
For ease of explanation, the architecture 500 shown in FIGURE 5 is described
as involving the use
of the application server 106 of FIGURE 1, which may be implemented using one
or more
instances of the device 200 of FIGURE 2. However, the architecture 500 may be
implemented
using any suitable device(s) in any suitable system(s).
[0052] As shown in FIGURE 5, the architecture 500 generally includes a change
order
classification function 502, a time change prediction function 504, and a
demand forecast
allocation function 506. The change order classification function 502
generally operates to identify
open orders or order lines that are likely to change over a planning horizon.
In some embodiments,
the determination of whether an order or order line is likely to change can be
cast as a classification
problem. Also, in some embodiments, the change order classification function
502 can be
implemented using a trained machine learning model that uses the
classification problem when
determining whether each order or order line is likely to change over the
planning horizon.
Additional details of example embodiments of the change order classification
function 502 are
provided below.
CA 03207222 2023- 8- 1
WO 2022/170127
PCT/US2022/015358
11
100531 The time change prediction function 504 generally operates to predict
the number of
days or other length of time that an open order or order line is likely to
change by (for each open
order or order line identified as likely to change by the change order
classification function 502).
In some embodiments, the determination of the length of time that an order or
order line is likely
to change by can be cast as a regression problem. Also, in some embodiments,
the time change
prediction function 504 can be implemented using a trained machine learning
model that uses the
regression problem when determining the length of time that an order or order
line is likely to
change over the planning horizon. Additional details of example embodiments of
the time change
prediction function 504 are provided below.
[0054] The demand forecast allocation function 506 generally operates to
allocate an
aggregate demand forecast over the planning horizon. The aggregate demand
forecast here can be
based on both (i) a demand forecast that anticipates future demand (even
future demand that has
not yet been realized in the form of open order lines) and (ii) existing
customer orders or order
lines (including those orders or order lines that are identified as being
likely to change). In some
embodiments, the demand forecast allocation function 506 can allocate the
aggregate demand
forecast based on a historical demand distribution, which represents a
previous or historical
distribution of demand. Additional details of example embodiments of the
demand forecast
allocation function 506 are provided below.
100551 As noted above, in some embodiments, the change order classification
function 502
and the time change prediction function 504 may involve casting consumption
planning tasks as
machine learning problems. FIGURE 6 illustrates an example entity relationship
diagram 600 that
may support the use of machine learning during risk-aware and strategy-
adaptive consumption
planning for process and manufacturing plants according to this disclosure. As
shown in FIGURE
6, a customer 602 and a location 604 are associated with an order 606, and a
product or item 608
associated with the order 606 represents an order line 610 of the order 606
Any changes to the
order line 610 can be reflected or identified in an order line history 612.
Note that each directed
relationship represented using an arrow in FIGURE 6 may represent a one-to-
many relationship.
In order words, the customer 602 and the location 604 may be associated with
one or multiple
orders 606, and each order 606 and each item 608 may be associated with one or
multiple order
lines 610.
[0056] In some embodiments, the functions 502-506 described above implement a
consumption planning process that operates to make predictions against each
order line 610, since
the order lines 610 contain information about the items 608, quantities of the
items 608, and timings
CA 03207222 2023- 8- 1
WO 2022/170127
PCT/US2022/015358
12
for delivery of the items 608 needed to produce a consumption plan. Related
information, such as
orders 606, items 608, and/or historical changes recorded in the order line
history 612, may also
be valuable when making predictions. The process shown in FIGURE 5 can be
applied
independently to each product or item 608 for which a consumption plan is
needed or desired. The
following discussion assumes that the architecture 500 operates using the
entity relationship
diagram 600 to perform consumption planning. Note, however, that other
approaches (such as
those using other entity relationship diagrams) may be used without departing
from the scope of
this disclosure.
100571 Although FIGURE 5 illustrates one example of an architecture 500
supporting risk-
aware and strategy-adaptive consumption planning for process and manufacturing
plants, various
changes may be made to FIGURE 5. For example, various functions shown in
FIGURE 5 may be
combined, further subdivided, replicated, omitted, or rearranged and
additional functions may be
added according to particular needs. Although FIGURE 6 illustrates one example
of an entity
relationship diagram 600 that may support the use of machine learning during
risk-aware and
strategy-adaptive consumption planning for process and manufacturing plants,
various changes
may be made to FIGURE 6. For example, any other suitable arrangement of order-
related
information may be used by the architecture 500 or other architecture that
supports risk-aware and
strategy-adaptive consumption planning.
100581 With respect to the change order classification function 502, the
change order
classification function 502 generally operates to identify which open orders
606 or order lines 610
are likely to change. The following describes how this operation can be cast
into a classification
problem and describes the types of features that are useful to accomplish this
operation. In some
embodiments, using the entity relationship diagram 600 of FIGURE 6, the change
order
classification function 502 may operate to generate predictions as to which
order lines 610 are
likely to change within a given time horizon. Each order line 610 may
represent a particular item
608 in a particular order 606, and each order line 610 may include specific
details about the item
608, the quantity of the item 608, and the requested date for the item 608. If
one or more
modifications have been made to a particular order line 610, the historical
changes may be recorded
as part of the order line history 612.
100591 FIGURE 7 illustrates an example order change history 700 related to a
completed order
line for use during consumption planning for process and manufacturing plants
according to this
disclosure. The order change history 700 may, for example, represent
information stored in the
order line history 612 for a particular order line 610. The particular order
change history 700 shown
CA 03207222 2023- 8- 1
WO 2022/170127
PCT/US2022/015358
13
in FIGURE 7 relates to changes made to the order line "1.1" shown in FIGURES 3
and 4. As can
be seen in FIGURE 7, the order change history 700 for the order line -1.1-
indicates that there
have now been three updates to the order line since the order line was first
created/updated. The
first two updates show changes being made to the order line's requested date
and match the changes
shown in FIGURE 4, and the final update shows that the order line was
fulfilled and closed
(meaning the product was provided to the customer).
100601 Because order lines 610 may be changed by customers, the results of a
consumption
planning process can vary depending on when the consumption planning process
occurs relative
to the changes to order lines 610. FIGURE 8 illustrates example timelines 800,
802, 804 associated
with performing consumption planning relative to changing orders from a
customer according to
this disclosure. As shown in FIGURE 8, the timeline 800 is associated with
performance of
consumption planning at some point in time after the order line "1.1" of
FIGURE 7 is initially
created/updated and before the changes are made to the order line The timeline
802 is associated
with performance of consumption planning at some point in time after the first
update to the order
line -1.1" of FIGURE 7 is made and before the second change to the order line
is made. The
timeline 804 is associated with performance of consumption planning at some
point in time after
the second update to the order line "1.1" of FIGURE 7 is made. In FIGURE 8,
creations/updates
to order lines are represented as triangles on the dates that the order lines
are created/updated.
100611 As can be seen in FIGURE 8, it would be useful to be able to accurately
predict if each
order line 610 is likely to change within a time horizon when performing
consumption planning.
This would provide the application server 106 with the ability to estimate
whether each order line
610 is likely to change, which would then allow the application server 106 to
estimate demand
more accurately over the time horizon and thereby produce a more accurate
consumption plan.
Here, estimating whether each order line 610 is likely to change is performed
using the change
order classification function 502. Any order line 610 determined as being
likely to change may
then be analyzed (using the time change prediction function 504) to predict an
estimated amount
of time by which the order line 610 is likely to change.
100621 As noted above, the change order classification function 502 may cast
the estimation
of whether each order line 610 is likely to change as a classification
problem. In some cases, the
classification problem can be used to make predictions based on the latest
version of each order
line 610 prior to the consumption planning time. As a result, updates to order
lines 610 that occur
after the planning time may not be visible and are therefore not considered as
part of the
consumption planning process. Also, as the planning time moves forward in
time, the version of
CA 03207222 2023- 8- 1
WO 2022/170127
PCT/US2022/015358
14
each order line 610 and its corresponding label may change. In some
embodiments, an order line
610 can have a positive label if there are one or more modifications made
between the planning
time and the order line's closed time, and the label for the order line 610
may be negative if no
more updates will be made to the order line 610 between the planning time and
the order line's
closed time.
100631 It is therefore possible to train a machine learning model to perform
the change order
classification function 502 by providing the machine learning model with
training data based on
various scenarios, including those scenarios shown in FIGURE 8. That is,
training data having the
form of the timeline 800 may be used, where this training data would indicate
that changes were
made after an initial order line 610 was created/updated. Training data having
the form of the
timeline 802 may also be used, where this training data would indicate that
one or more changes
were made after an initial order line 610 was created/updated and updated
once. Training data
having the form of the timeline 804 may further be used, where this training
data would indicate
that one or more changes were made after an initial order line 610 was
created/updated and updated
twice. Thus, all of these scenarios involving changes to order lines 610 may
be used as training
data for the machine learning model, and the machine learning model can be
trained to estimate
the likelihood of an order line 610 changing. Note that, when using each of
these scenarios as
training data for purposes of model training, care can be taken during feature
engineering to avoid
information leakage. Example features that may be used here as part of the
training process are
provided below. Once trained, the trained machine learning model may be placed
into operation
and used to identify which orders 606 or order lines 610 are likely to change
within a given
planning horizon. In some cases, the trained machine learning model may
generate predictions
using only the most-recent versions of the order lines 610.
100641 In some embodiments, three broad categories of features may be used to
train a
machine learning model that implements the change order classification
function 502. These broad
categories of features may include (i) order-specific features that are
specific to each order 606 or
order line 610, (ii) time-varying features that represent aggregations formed
over time windows,
and (iii) static features that remain fixed over time and can be broadly
applied to multiple order
606 or order lines 610.
100651 In some cases, order-specific features may be determined by considering
information
specific to an order 606 or order line 610. Examples of order-specific
features may include (i) a
number of days or other length of time from the planning time until the
requested date for the order
line 610, (ii) the number of days or other length of time prior to the
requested date that the customer
CA 03207222 2023- 8- 1
WO 2022/170127
PCT/US2022/015358
first submitted the order line 610, and (iii) whether other order lines 610 in
the same order 606
have changed.
100661 In some cases, time-varying features may be determined as aggregations
against
customers over time, and these aggregations may be determined over fixed time
windows ending
5 on the consumption planning date. Examples of time-varying features may
include (i) an
identification of how a specific customer changes orders 606 for an item 608
in an order line 610
over a specified number of days, (ii) an identification of how all orders 606
for the item 608 in the
order line 610 change over a specified number of days, (iii) an identification
of how the specific
customer changes all orders 606 placed within a specified number of days, and
(iv) an identification
10 of how the specific customer changes orders 606 for items 608 similar to
the item 608 in the order
line 610 over a specified number of days. An example of time-varying features
can be illustrated
by considering FIGURE 4, where two changes were made to order line "1.1" on
September 7,
2020 and September 20, 2020 and where one change was made to order line "1.3"
on September
20, 2020. If the consumption planning date is October 1, 2020, all three
changes represent changes
15 that occurred within the previous 30 days from October 1, 2020. As a
result, a time-varying feature
that represents the total number of order line changes by a specific customer
over the previous 30
days may have a value of three for this customer.
[0067] In some cases, static features may represent features that are updated
very infrequently
and that can be broadly applied to multiple order lines 610. Examples of
static features may include
(i) an indication of how important an item 608 is for a customer, (ii) an
indication of how important
the customer is for the item 608, and (iii) an indication of how similar two
items 608 are based on
the purchasing behavior of the customer. The indication of how important the
item 608 is for the
customer may be expressed in one or more ways, such as a percent total volume
the customer has
purchased that is attributed to the specific item 608, an ascending rank by
total quantity for the
item 608 ordered by the customer, an average of all items 608 for the
customer, and/or a standard
deviation of the average for all items 608 of the customer. The indication of
how important the
customer is for the item 608 may be expressed in one or more ways, such as a
percent total volume
of the item 608 that has been purchased by the specific customer, an ascending
rank by total
quantity for customers that ordered the item 608, an average for all customers
of the item 608,
and/or a standard deviation of the average for all customers of the item 608.
The indication of how
similar two items 608 are based on the purchasing behavior of the customer may
be expressed in
one or more ways, such as when represented as an embedding.
[0068] Note that the first two types of static features here may represent
ratios defining the
CA 03207222 2023- 8- 1
WO 2022/170127
PCT/US2022/015358
16
importance of a particular item to a customer and vice versa, while the third
type of static feature
here may represent embeddings that capture the purchasing behaviors of
customers. In some cases,
the embedding can be determined in the following manner. Define a "purchase
sequence" of a
customer as a list of items 608 purchased by the customer in quick succession.
The purchasing
history of the customer, represented as all unique order lines 610 submitted
by the customer, may
contain one or more purchase sequences (depending on the definition of "quick"
succession). For
instance, items 608 being purchased in a sequence of order lines 610 submitted
within fourteen
days of each other may be treated as a purchase sequence. FIGURE 9 illustrates
example purchase
sequences 900, 902 that may be associated with a customer and considered
during consumption
planning according to this disclosure. As can be seen in FIGURE 9, each
purchase sequence 900
and 902 represents submissions of multiple order lines 610 that occur within a
specified time period
(such as fourteen days or other number of days). A purchase sequence may be
viewed as a sentence,
and a set of all purchase sequences across customers and time may be viewed as
a corpus of text
from which word embeddings can be learned. Thus, in these cases, a word may
represent an item's
name, and relationships between embeddings can capture whether items are
typically purchased
alongside one another. These embeddings may be generated in any suitable
manner, such as by
utilizing approaches like the Word2vec technique. Following this, an embedding
for a customer
can be represented as an average of all embeddings associated with items 608
contained in all order
lines 610 that the customer has placed. If a customer or item does not exist,
an embedding for that
customer or item may be set to some initial value until sufficient data is
collected to relearn the
embeddings, such as when the average value of all embeddings is used. In
particular embodiments,
the embeddings for customers and items may be the most significant static
features, and amongst
the top ten global features, for a classifier (although this is not required)
100691 Although FIGURE 7 illustrates one example of an order change history
700 related to
a completed order line for use during consumption planning for process and
manufacturing plants,
various changes may be made to FIGURE 7. For example, the information
contained in the order
change history 700 can easily vary based on factors such as the original
order, how the order line
in the original order changed over time, and when the order line was closed.
Although FIGURE 8
illustrates one example of timelines 800-804 associated with performing
consumption planning
relative to changing orders from a customer, various changes may be made to
FIGURE 8. For
example, timelines may involve any other suitable number of order line changes
relative to
consumption planning times. Although FIGURE 9 illustrates examples of purchase
sequences that
may be associated with a customer and considered during consumption planning,
various changes
CA 03207222 2023- 8- 1
WO 2022/170127
PCT/US2022/015358
17
may be made to FIGURE 9. For example, a customer may be associated with any
number of
purchase sequences (including zero purchase sequences), and each purchase
sequence may involve
any suitable number of order lines 610.
100701 With respect to the time change prediction function 504, the time
change prediction
function 504 generally operates to predict the number of days or other length
of time that an open
order 606 or order line 610 is likely to change by (at least for each open
order 606 or order line
610 identified as being likely to change by the change order classification
function 502). The
following describes how this operation can be cast into a regression problem
using a similar
approach as the classification problem described above. In some cases, the
features used for the
regression can be identical to the features used by the change order
classification function 502 for
classification as described above. A prediction target, which represents the
number of days or other
length of time from a requested date that an order line 610 is predicted to
change by, may be
determined in a similar fashion against the most-recent version of the order
line 610.
100711 FIGURE 10 illustrates an example order change history 1000 related to a
completed
order line updated with prediction targets for use during consumption planning
for process and
manufacturing plants according to this disclosure. As can be seen in FIGURE
10, the order change
history 1000 represents the order change history 700 shown in FIGURE 7, but
the order change
history 1000 also includes prediction targets that identify the length of time
associated with
requested changes to an order line 610. The numbers of days shown in FIGURE 10
represent
regression targets for which a machine learning model can be trained to
estimate. Note that the
"days change" value here is computed with respect to the requested date of the
final closed version
of the order line 610. As a result, the regression target is non-zero while
updates remain, and the
regression target is zero for the last update.
100721 Note that it is unlikely that a trained machine learning model
implementing a regressor
can make perfect predictions. Moreover, penalties associated with having
inaccurate predictions
may not be symmetrical. For instance, a business or plant may only incur minor
inventory holding
costs for preparing an order earlier than needed, but the business or plant
may incur severe
serviceability penalties for completing the same order too late. To address
this, the machine
learning model used by the time change prediction function 504 can be trained
with a customized
regression loss function that reflects the business or plant's averseness to
risk. In some cases, the
customized regression loss function may be more severe for positive residuals,
meaning higher
penalties can be associated with late preparation of an order compared to
early preparation of an
order.
CA 03207222 2023- 8- 1
WO 2022/170127
PCT/US2022/015358
18
100731 FIGURE 11 illustrates an example customized regression loss function
1100 that may
be used by a machine learning model during risk-aware and strategy-adaptive
consumption
planning for process and manufacturing plants according to this disclosure. As
can be seen in
FIGURE 11, the customized regression loss function 1100 defines a loss in
terms of a cost that
varies with the number of days. A first portion 1102 of the customized
regression loss function
1100 is defined immediately before a requested date for an order, which is
represented by a value
of zero along the horizontal axis. According to the first portion 1102 of the
customized regression
loss function 1100, the cost is linear and is relatively low, which indicates
that a low holding cost
or other small penalty may be incurred if an item 608 is produced shortly
before the requested date
(defined as "early"). A second portion 1104 of the customized regression loss
function 1100 is
defined before the first portion 1102, which means that the second portion
1104 relates to even
earlier production of the item 608 (defined as "too early"). According to the
second portion 1104
of the customized regression loss function 1100, the penalty for excessively
early production is
defined using a second-order polynomial that increases as the number of days
becomes larger in
absolute value terms. This indicates that larger costs may be incurred if the
item 608 is produced
at earlier dates relative to the requested date. A third portion 1106 of the
customized regression
loss function 1100 is defined after the requested date, which means that the
third portion 1106
relates to positive residuals or late production of the item 608. According to
the third portion 1106
of the customized regression loss function 1100, the cost is exponential,
which indicates that a
much higher serviceability penalty or other penalty may be imposed if the item
608 is produced
after the requested date.
100741 This type of customized regression loss function 1100 or other
asymmetrical loss
function can be used to capture a business or plant's averseness to risk for
the regression. For
example, the larger penalties for "late" conditions can encourage the
regression model to push back
orders to later dates infrequently, while the penalties for "too early"
conditions can encourage the
regression model to not predict that orders will be pushed unreasonably early
(unless there is very
strong reason to believe that this may occur). By leveraging a custom loss
function that directly
encodes a business or plant's risk averseness, the regression model is both
risk-aware and adaptive
to different business strategies.
100751 Although FIGURE 10 illustrates one example of an order change history
1000 related
to a completed order line updated with prediction targets for use during
consumption planning for
process and manufacturing plants, various changes may be made to FIGURE 10.
For example, the
information contained in the order change history 1000 can easily vary based
on factors such as
CA 03207222 2023- 8- 1
WO 2022/170127
PCT/US2022/015358
19
the original order, how the order line in the original order changed over
time, and when the order
line was closed. Although FIGURE 11 illustrates one example of a customized
regression loss
function 1100 that may be used by a machine learning model during risk-aware
and strategy-
adaptive consumption planning for process and manufacturing plants, various
changes may be
made to FIGURE 11. For example, a loss function may include any number of
portions, and each
portion may be defined in any suitable manner.
100761 With respect to the demand forecast allocation function 506, the demand
forecast
allocation function 506 generally operates to produce a consumption plan,
which can be done by
allocating a coarsely-reported demand forecast over a planning horizon. In
some cases, this can be
accomplished by (i) decrementing a previously-determined demand forecast by
existing order lines
610 and (ii) allocating the remaining demand forecasting budget based on
historical demand
distribution.
100771 Since a demand forecast for an item 608 represents anticipated
cumulative demand for
that item 608 over a period of time, order lines 610 that are placed for the
item 608 represent a
portion of the demand forecast. As a result, the demand forecast for an item
608 can be
decremented by the quantity or quantities captured by placed customer orders
606 in order to
estimate the expected additional future demand for the item 608. FIGURE 12
illustrates an example
decrementing of a demand forecast based on order lines during risk-aware and
strategy-adaptive
consumption planning for process and manufacturing plants according to this
disclosure. As shown
in FIGURE 12, a graph 1200 plots quantities of an ordered item 608 against
anticipated required
dates. The heights of various triangles 1202, 1204, 1206 represent the
quantities of demand signals
on particular dates. In this example, original demand forecasts for an item
608 are represented by
triangles 1202 and may be generated or otherwise provided for different months
or other time
periods. Triangles 1204 represent customer order lines 610 that have been
placed for the item 608,
and the locations of the triangles 1204 are based on the requested dates. The
quantities represented
by the triangles 1202 are decremented by the quantities represented by the
triangles 1204 for their
respective months to yield decremented demand forecasts, each of which is
represented by a
triangle 1206. Each decremented demand forecast represents an estimated demand
for the item 608
that is not accounted for by existing order lines 610 for the item 608. In the
event that a planning
horizon includes only part of a period of time for which the demand forecast
is generated (such as
one week for a monthly demand forecast), a proportional portion of the demand
forecast can be
considered for the purposes of consumption planning.
100781 At this point, a demand forecast has been decremented to represent the
quantity of
CA 03207222 2023- 8- 1
WO 2022/170127
PCT/US2022/015358
additional anticipated demand beyond what has already been expressed in terms
of order lines 610.
However, this demand forecast is still reported coarsely over time, so the
allocation of the
remaining demand forecasting budget can be performed in order to prepare a
consumption plan
that allocates the remaining budget more granularly over the planning horizon.
In some cases, this
5 can be accomplished using the following procedure. First, the average
historical distribution of
consumption for an aggregation window can be determined, such as when a
monthly forecast uses
historical distributions prepared for each month. Second, contributions of
modified order lines 610
to the historical consumption budget are assigned. This can be done to
identify regions of the
historical demand forecast that are captured by the existing order lines 610.
Third, the demand
10 forecast can be allocated to regions of the historical demand forecast
that are not occupied by
customer orders. This can be done proportionally, such as based on the
difference between the
historical distribution and the current quantity attributed to the order lines
610.
100791 FIGURE 13 illustrates an example demand forecast allocation over a
planning horizon
during risk-aware and strategy-adaptive consumption planning for process and
manufacturing
15 plants according to this disclosure. More specifically, FIGURE 13
illustrates an example demand
forecast allocation for a 60-day planning horizon starting on January 7, 2019.
Different plots 1300-
1304 in different layers of FIGURE 13 represent different steps in the
allocation process, and the
bottom plot 1304 represents a final consumption plan.
100801 As shown in the top plot 1300 of FIGURE 13, existing customer orders
represented by
20 triangles 1306 are overlaid with the decremented demand forecasts
determined as discussed above
and represented by triangles 1308. Note that the demand forecast for January
2019 is lower than
that of February 2019, which is due to the fact that more orders have been
placed in January (so
the demand forecast for January has been decremented by a greater quantity
than in February). As
shown in the middle plot 1302 of FIGURE 13, the demand attributed to existing
order lines 610 is
modified based on the outputs of the classification and regression operations
described above,
meaning one or more of the existing order lines 610 may be moved based on
predictions generated
by the change order classification function 502 and the time change prediction
function 504. In
this particular example, a 60-day planning horizon is used, and a portion of
the demand forecast
for March 2019 is positioned at the end of the planning horizon on March 7,
2020. As a result, a
proportional portion of the March 2019 demand forecast can be moved into the
planning horizon.
As shown in the bottom plot 1304 of FIGURE 13, the decremented demand forecast
is distributed
according to a budgeted historical distribution, such as by using historical
demand to distribute the
decremented demand forecast. However, the demand forecast is not allocated to
periods of time
CA 03207222 2023- 8- 1
WO 2022/170127
PCT/US2022/015358
21
that are sufficiently captured by the existing order lines 610. This enables
the decremented demand
forecast to be satisfied while ensuring that the existing order lines 610 for
current open orders 606
can also be satisfied.
100811 Although FIGURE 12 illustrates one example of decrementing of a demand
forecast
based on order lines during risk-aware and strategy-adaptive consumption
planning for process
and manufacturing plants and FIGURE 13 illustrates one example of a demand
forecast allocation
over a planning horizon during risk-aware and strategy-adaptive consumption
planning for process
and manufacturing plants, various changes may be made to FIGURES 12 and 13.
For example, the
various demands shown in FIGURES 12 and 13 are for illustration only and can
vary widely based
on (among other things) the orders placed for items and the manufacturing
capacity for those items.
100821 Note that, in some cases, the overall process described above may be
used to generate
different consumption plans, such as different consumption plans that pull
forward or push back
requested dates for items 608 based on anticipated changes to order lines 610
and lengths of time
associated with those anticipated changes. This raises the possibility that
multiple consumption
plans may be generated and compared in order to select an appropriate
consumption plan for a
given business or plant. Initially, it may seem reasonable to evaluate the
performance of a
consumption plan using typical performance metrics for regression, such as
mean square error
(MSE) or mean absolute percentage error (MAPE). However, this may not be
appropriate in some
embodiments because a consumption plan can be produced while considering a
business or plant's
degree of averseness to risk. As a result, two consumption plans with the same
MSE value may be
valued very differently by a business or plant, depending on that business or
plant's preference on
whether orders should generally be brought forward or pushed back in time. One
possibility is to
use the custom loss function that was previously used to train the regressor
model as described
above. However, this may not be practical if consumption plans are generated
using models trained
with different loss functions Thus, in some cases, under-planning and over-
planning metrics may
be determined for each consumption plan and used to compare the consumption
plans, which may
be useful in cases where the consumption plans are produced by different risk-
aware models or in
other cases. In some embodiments, the under-planning and over-planning metrics
may be defined
as follows:
fmax (2(t)-y (0,0)8t
over-planning= (1)
fy(t)(5t
- fmin (31(t)-y (0,0)St
under-planning= (2)
f y (t)St
At a high level, these metrics can be used to compare the area between (i) a
curve for a consumption
CA 03207222 2023- 8- 1
WO 2022/170127
PCT/US2022/015358
22
plan and (ii) a curve for a ground truth against a total planned volume. The
numerators in Equations
(1) and (2) represent the area above (over-planning) or below (under-planning)
the curve, and the
denominators represent the total planned volume.
[0083] FIGURES 14 and 15 illustrate example results of risk-aware and strategy-
adaptive
consumption planning for process and manufacturing plants according to this
disclosure. In
particular, FIGURE 14 illustrates an example graph 1400 showing metrics for a
consumption plan
produced without order modification and without demand forecast distribution.
The graph 1400
represents a comparison of the baseline consumption plan against a ground
truth, where the
baseline consumption plan does not modify customer demand or distribute the
demand. Regions
1402 and 1404 of the graph 1400 are associated with portions of the
consumption plan in which
over-planning occurs, and regions 1406 and 1408 of the graph 1400 are
associated with portions
of the consumption plan in which under-planning occurs. As can be seen here,
under-planning is
particularly severe in the later portion of the planning horizon, where there
is likely less available
customer orders and the forecasted demand is not redistributed from the end of
the month. FIGURE
15 illustrates an example graph 1500 showing metrics for a consumption plan
produced with order
modification and with demand forecast distribution using the techniques
described above. The
particular machine learning model(s) used to produce this consumption plan may
have been
optimized to reduce under-planning, which is actually eliminated in this
example. This does not
come at the expense of increasing over-planning too dramatically.
[0084] In some embodiments, these two measures (over-planning and under-
planning) may
therefore be used to construct a single performance metric that can be used to
provide a single
source of truth when comparing the performances of different consumption
plans. The specific
way in which the over-planning and under-planning metrics can be combined or
otherwise used to
construct a single performance metric may vary depending on the specific use
case.
[0085] However one or more metrics are defined, the metrics may be used to
compare
different consumption plans generated using the approaches described above.
The following now
describes example ways in which different consumption plans can be generated.
The ability to
generate and compare different consumption plans allows for the performance of
scenario analysis,
where different consumption plans can be compared against one another and at
least one of the
consumption plans can be selected for storage, output, or use. In the
following discussion, different
consumption plans may be generated by modifying two broad types of parameters,
namely (i)
parameters that do not require model retraining and (ii) parameters that
require model retraining.
[0086] With respect to parameters that do not require model retraining, these
parameters can
CA 03207222 2023- 8- 1
WO 2022/170127
PCT/US2022/015358
23
be modified in order to generate different consumption plans without
retraining the machine
learning model(s) used to perform the functions 502-504. Among other things,
modifying these
parameters allows consumption plans to be produced more quickly (at least
compared to those that
require model retraining). Examples of these parameters may include (i) a
classification threshold
and (ii) a prediction mask. The classification threshold refers to the
threshold used by the change
order classification function 502 when predicting whether an order 606 or
order line 610 is likely
to change. The prediction mask refers to a mask used during prediction by the
time change
prediction function 504. A prediction mask may be used, for instance, to avoid
modifying orders
606 or order lines 610 within one or more particular time windows.
[0087] With respect to parameters that require model retraining, these
parameters can be
modified in order to generate different consumption plans after retraining the
machine learning
model (s) used to perform the functions 502-504. Among other things, modifying
these parameters
may be computationally expensive, but this can provide users with a greater
level of control during
scenario analysis. Examples of these parameters may include (i) a regression
strategy, (ii) a training
mask, and (iii) feature selection. The regression strategy refers to the
choice of the loss function
used for the regression performed by the time change prediction function 504.
Different regression
strategies may be used to represent different high-level strategies around
averseness to risk. In
some embodiments, several machine learning models with different strategies
may be pre-trained
for the purposes of faster feedback during scenario analysis, although this
need not be the case.
The training mask refers to a mask applied to data prior to model training.
The training mask may
be useful if there are one or more particular periods of time that the
classifier or regressor machine
learning model should not be trained against. The feature selection refers to
the set of features used
when training a machine learning model and when making predictions. Different
feature sets may
be considered and used, such as when features are added to or removed from a
feature set and a
model is retrained and used with that feature set.
[0088] Although FIGURES 14 and 15 illustrate examples of results of risk-aware
and
strategy-adaptive consumption planning for process and manufacturing plants,
various changes
may be made to FIGURES 14 and 15. For example, the values of the metrics shown
in FIGURES
14 and 15 can vary based on a number of factors, such as the specific
consumption plans being
generated and how one or more machine learning models are trained to perform
operations during
the consumption planning process.
[0089] FIGURE 16 illustrates an example method 1600 for risk-aware and
strategy-adaptive
consumption planning for process and manufacturing plants according to this
disclosure. For ease
CA 03207222 2023- 8- 1
WO 2022/170127
PCT/US2022/015358
24
of explanation, the method 1600 of FIGURE 16 is described as being performed
using the
application server 106 of FIGURE 1, which may be implemented using one or more
instances of
the device 200 of FIGURE 2. However, the method 1600 of FIGURE 16 may be
performed using
any suitable device(s) in any suitable system(s).
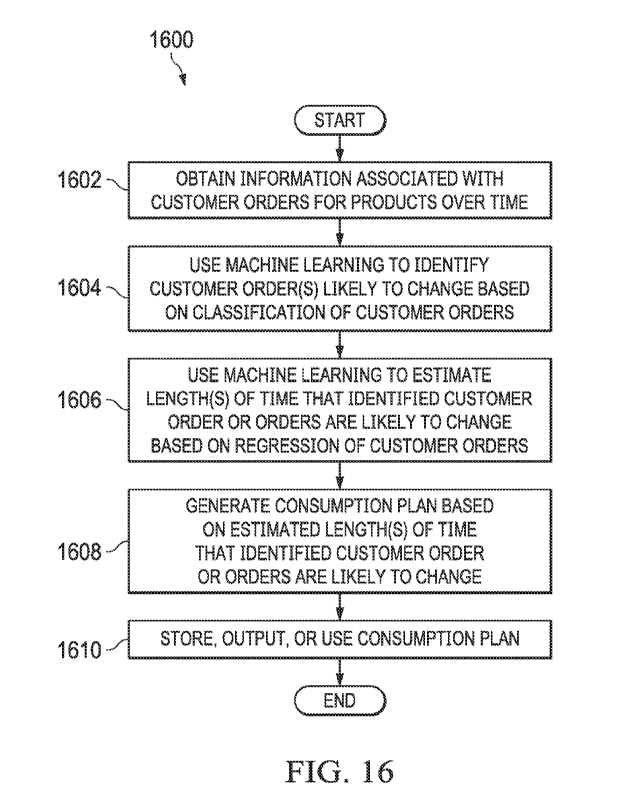
100901 As shown in FIGURE 16, information associated with customer orders is
obtained at
step 1602. This may include, for example, the processing device 202 of the
application server 106
obtaining information identifying multiple orders 606 for various products or
items 608 from
various customers over time. This information may be obtained from any
suitable source(s), such
as from the database 110 or from one or more user devices 102a-102d.
[0091] Machine learning is used to identify one or more of the customer orders
that are likely
to change based on classification of the customer orders at step 1604. This
may include, for
example, the processing device 202 of the application server 106 using a
trained machine learning
model to perform the change order classification function 502. Here, the
trained machine learning
model may use a classification problem to classify each order line 610 as
being likely to change or
not likely to change within a planning horizon. In some cases, the trained
machine learning model
may be based on various types of features, such as one or more order-specific
features, one or more
time-varying features, and one or more static features.
[0092] Machine learning is used to estimate one or more lengths of time that
one or more
customer orders are likely to change by based on regression of the customer
orders at step 1606.
This may include, for example, the processing device 202 of the application
server 106 using a
trained machine learning model to perform the time change prediction function
504. Here, the
trained machine learning model may use a regression problem to estimate the
length of time that
an order line 610 is likely to change, which can be performed for each order
line 610 identified
earlier as being likely to change within the planning horizon. In some cases,
the trained machine
learning model may be based on various types of features, such as one or more
order-specific
features, one or more time-varying features, and one or more static features.
Also, in some cases,
the regression may be based on a customized asymmetrical loss function that
captures a particular
business or plant's averseness to risk.
[0093] A consumption plan for a facility is generated based on the estimated
length(s) of time
that the one or more customer orders are likely to change at step 1608. This
may include, for
example, the processing device 202 of the application server 106 performing
the demand forecast
allocation function 506 to allocate demand within the planning horizon. As a
particular example,
this may include the processing device 202 of the application server 106
decrementing a demand
CA 03207222 2023- 8- 1
WO 2022/170127
PCT/US2022/015358
forecast for each item 608 within the planning horizon based on orders 606 or
order lines 610 for
that item 608 within the planning horizon and allocating the decremented
demand forecast within
the planning horizon. The decremented demand forecast can be allocated to
portions of the
planning horizon not already occupied by the orders 606 or order lines 610 for
the item 608 (as
5 adjusted in previous steps). In some cases, the allocation of the
decremented demand forecast can
be based on historical consumption distribution.
[0094] The consumption plan can be stored, output, or used in some manner at
step 1610. This
may include, for example, the processing device 202 of the application server
106 outputting the
consumption plan to one or more users (such as via a graphical user interface
of one or more user
10 devices 102a-102d) for approval, rejection, or modification. This may
also or alternatively include
the processing device 202 of the application server 106 using the consumption
plan to place orders
for materials, schedule operations to be performed using the materials, or
control operations being
performed using the materials. In general, the consumption plan may be used in
any suitable
manner, and all manners of use are within the scope of this disclosure. In
some cases, multiple
15 consumption plans may be generated and stored, output, or used, or one
or more metrics for the
multiple consumption plans may be determined and used to select at least one
consumption plan
for storage, output, or use.
[0095] Although FIGURE 16 illustrates one example of a method 1600 for risk-
aware and
strategy-adaptive consumption planning for process and manufacturing plants,
various changes
20 may be made to FIGURE 16. For example, while shown as a series of steps,
various steps in
FIGURE 16 may overlap, occur in parallel, occur in a different order, or occur
any number of times
(including possibly zero times).
[0096] The following describes example embodiments of this disclosure that
implement risk-
aware and strategy-adaptive consumption planning for process and manufacturing
plants.
25 However, other embodiments may be used in accordance with the teachings
of this disclosure.
[0097] In a first embodiment, a method includes obtaining information defining
multiple
customer orders for one or more products over time. The method also includes
using machine
learning to identify one or more of the customer orders that are likely to
change based on
classification of the customer orders. The method further includes using
machine learning to
estimate one or more lengths of time that the one or more customer orders are
likely to change
based on regression of the customer orders. In addition, the method includes
generating a
consumption plan for a facility based on the one or more estimated lengths of
time that the one or
more customer orders are likely to change.
CA 03207222 2023- 8- 1
WO 2022/170127
PCT/US2022/015358
26
[0098] In a second embodiment, an apparatus includes at least one processing
device
configured to obtain information defining multiple customer orders for one or
more products over
time. The at least one processing device is also configured to use machine
learning to identify one
or more of the customer orders that are likely to change based on
classification of the customer
orders. The at least one processing device is further configured to use
machine learning to estimate
one or more lengths of time that the one or more customer orders are likely to
change based on
regression of the customer orders. In addition, the at least one processing
device is configured to
generate a consumption plan for a facility based on the one or more estimated
lengths of time that
the one or more customer orders are likely to change.
[0099] In a third embodiment, a non-transitory computer readable medium stores
computer
readable program code that when executed causes one or more processors to
obtain information
defining multiple customer orders for one or more products over time. The
medium also stores
computer readable program code that when executed causes the one or more
processors to use
machine learning to identify one or more of the customer orders that are
likely to change based on
classification of the customer orders. The medium further stores computer
readable program code
that when executed causes the one or more processors to use machine learning
to estimate one or
more lengths of time that the one or more customer orders are likely to change
based on regression
of the customer orders. In addition, the medium stores computer readable
program code that when
executed causes the one or more processors to generate a consumption plan for
a facility based on
the one or more estimated lengths of time that the one or more customer orders
are likely to change.
101001 Any single one or any suitable combination of the following features
may be used with
the first, second, or third embodiment. The classification of the customer
orders and the regression
of the customer orders may both be based on (i) one or more order-specific
features of the customer
orders, (ii) one or more time-varying aggregations of the customer orders, and
(iii) one or more
static features each associated with multiple ones of the customer orders. The
one or more static
features may include indications of how similar different products are based
on purchasing
behaviors of one or more customers, where the purchasing behaviors may be
captured as
embeddings and where each embedding is generated using words that represent
products and
sentences that represent purchase sequences of products by the one or more
customers. The
regression of the customer orders may be based on a customized asymmetrical
loss function that
captures averseness to risk for the regression. The consumption plan may be
generated by
decrementing a demand forecast based on the customer orders and the one or
more estimated
lengths of time that the one or more customer orders are likely to change and
allocating the
CA 03207222 2023- 8- 1
WO 2022/170127
PCT/US2022/015358
27
decremented demand forecast over a planning horizon. The decremented demand
forecast may be
allocated over the planning horizon by allocating the decremented demand
forecast to periods of
time within the planning horizon that are not associated with the customer
orders. Multiple
consumption plans may be generated, and over-planning and under-planning
metrics may be used
to compare the multiple consumption plans.
101011 In some embodiments, various functions described in this patent
document are
implemented or supported by a computer program that is formed from computer
readable program
code and that is embodied in a computer readable medium. The phrase "computer
readable
program code" includes any type of computer code, including source code,
object code, and
executable code. The phrase "computer readable medium" includes any type of
medium capable
of being accessed by a computer, such as read only memory (ROM), random access
memory
(RAM), a hard disk drive (HDD), a compact disc (CD), a digital video disc
(DVD), or any other
type of memory. A "non-transitory" computer readable medium excludes wired,
wireless, optical,
or other communication links that transport transitory electrical or other
signals. A non-transitory
computer readable medium includes media where data can be permanently stored
and media where
data can be stored and later overwritten, such as a rewritable optical disc or
an erasable storage
device.
[0102] It may be advantageous to set forth definitions of certain words and
phrases used
throughout this patent document. The terms "application" and "program" refer
to one or more
computer programs, software components, sets of instructions, procedures,
functions, objects,
classes, instances, related data, or a portion thereof adapted for
implementation in a suitable
computer code (including source code, obj ect code, or executable code). The
term "communicate,"
as well as derivatives thereof, encompasses both direct and indirect
communication. The terms
"include" and "comprise," as well as derivatives thereof, mean inclusion
without limitation. The
term "or" is inclusive, meaning and/or. The phrase "associated with," as well
as derivatives thereof,
may mean to include, be included within, interconnect with, contain, be
contained within, connect
to or with, couple to or with, be communicable with, cooperate with,
interleave, juxtapose, be
proximate to, be bound to or with, have, have a property of, have a
relationship to or with, or the
like. The phrases "at least one of' and "one or more of," when used with a
list of items, means that
different combinations of one or more of the listed items may be used, and
only one item in the list
may be needed. For example, -at least one of: A, B, and C" includes any of the
following
combinations: A, B, C, A and B, A and C, B and C, and A and B and C.
101031 The description in the present disclosure should not be read as
implying that any
CA 03207222 2023- 8- 1
WO 2022/170127
PCT/US2022/015358
28
particular element, step, or function is an essential or critical element that
must be included in the
claim scope. The scope of patented subject matter is defined only by the
allowed claims. Moreover,
none of the claims invokes 35 U.S.C. 112(f) with respect to any of the
appended claims or claim
elements unless the exact words "means for" or "step for" are explicitly used
in the particular
claim, followed by a participle phrase identifying a function. Use of terms
such as (but not limited
to) "mechanism," "module," "device," "unit," "component," "element," "member,"
"apparatus,"
"machine," "system," "processor," or "controller" within a claim is understood
and intended to
refer to structures known to those skilled in the relevant art, as further
modified or enhanced by
the features of the claims themselves, and is not intended to invoke 35 U.S.C.
112(f).
[0104] While this disclosure has described certain embodiments and generally
associated
methods, alterations and permutations of these embodiments and methods will be
apparent to those
skilled in the art. Accordingly, the above description of example embodiments
does not define or
constrain this disclosure. Other changes, substitutions, and alterations are
also possible without
departing from the spirit and scope of this disclosure, as defined by the
following claims.
CA 03207222 2023- 8- 1