Note: Descriptions are shown in the official language in which they were submitted.
CA 03207613 2023-07-06
WO 2022/150051 PCT/US2021/013018
SYSTEM AND METHOD FOR NAVIGATING GEOLOGICAL VISUALIZATIONS
Cross Reference Paragraph
[0001] This application claims the benefit of U.S. Provisional Application No.
63/199,539,
entitled "SYSTEM AND METHOD FOR NAVIGATING GEOLOGICAL VISUALIZATIONS,"
filed January 07, 2021, the disclosure of which is hereby incorporated herein
by reference.
Background
[0002] Rock layers, rock types and rock ages are studied in different
locations to understand the
geology of the location. This branch of geology is referred to a stratigraphic
characterization, as it
seeks to determine attributes of the different layers or "strata" of the
subsurface domain. The strata
of different locations may undergo different processes, events, etc., and thus
may be unique in
some aspects between different regions; further, the strata of specific
regions may be given region-
specific names. Thus, depth-dependent data for the strata from one region may
not carry over to
similar depths or strata in other regions. As a result, it may be difficult to
compare similar depths
in different regions based on the local stratigraphic data.
[0003] Subdisciplines of stratigraphy include lithostratigraphy, which is
based on local
rock/formation names. Biostratigraphy is another subdiscipline and is based on
fossil assemblage
within the rocks for spatial and time positioning. Further, chronostratigraphy
permits the
correlation of strata in different regions based on a time standard. For
example, the strata of
different locations, which may be located at different depth intervals, have
different names, etc.,
may thus be positioned on a chronostratigraphic timeline, which may permit
comparisons of
generally contemporaneously formed strata and inferences based on data from
different locations.
[0004] The International Commission on Stratigraphy (ICS) maintains the
International
Chronostratigraphic Chart, which provides a reference timeline of the
different chronostratigraphic
ages of rocks. The ICS thus establishes a multidisciplinary standard and
global geologic time scale
that facilitates paleontological and geobiological comparisons region to
region by benchmarks
with stringent and rigorous strata criteria called Global Boundary Stratotype
Section and Points
(GSSPs) within the fossil record. The International Chronostratigraphic chart
permits the
geoscience community to use a globally agreed upon and recognized reference,
describing the age
and meta-type of stratigraphic layers, regardless of their presence in a
specific region.
1
CA 03207613 2023-07-06
WO 2022/150051 PCT/US2021/013018
Summary
[0005] Embodiments of the disclosure include a method for navigating a
geologic environment.
The method includes obtaining first geological data representing a first
location, correlating the
first geological data with a chronostratigraphic timeline, receiving a
selection of a second location,
correlating second geological data representing the second location with the
chronostratigraphic
timeline, determining one or more characteristics of a geology of the second
location based at least
in part on the first geological data from the first location using the
chronostratigraphic timeline,
and visualizing a stratigraphic navigator representing the chronostratigraphic
timeline and at least
some of the second geological data for the second location.
[0006] In an embodiment, the method includes receiving an input from a user
via interaction
with the stratigraphic navigator, and adjusting a display of the stratigraphic
navigator based on the
input from the user. Adjusting the display includes adjusting a granularity of
the second geological
data, the chronostratigraphic timeline, or both, or adjusting a portion of the
second geological data
that is visible by adjusting a selection of a portion of the
chronostratigraphic timeline, or both.
[0007] In an embodiment, visualizing the stratigraphic navigator includes
displaying the
stratigraphic navigator in context with a graphical geoscience interface that
displays geological
data representing one or more wells.
[0008] In an embodiment, the method includes receiving a selection of one or
more of the one
or more wells in the graphical geoscience interface, and highlighting one or
more portions of the
second geological data in the stratigraphical navigator based on the
selection.
[0009] In an embodiment, visualizing the stratigraphic navigator includes
displaying the
chronostratigraphic timeline as a chronostratigraphic column in the
stratigraphic navigator.
Elements of the chronostratigraphic column represent geological time
intervals. In an embodiment,
visualizing also includes displaying a stratigraphic column in the
stratigraphic navigator based on
the second geological data. The second geological data includes stratigraphic
data, and the
stratigraphic column includes elements representing one or more strata that
are local to the second
location. Visualizing may also include displaying a relationship between the
elements of the
stratigraphic column and the elements of the chronostratigraphic column.
[0010] In an embodiment, the method includes receiving a command to change a
granularity of
the stratigraphic column, and adjusting the granularity of the stratigraphic
data such that more or
fewer elements of the stratigraphic column are visible.
2
CA 03207613 2023-07-06
WO 2022/150051 PCT/US2021/013018
[0011] In an embodiment, the method includes receiving a command to change an
age interval
of the stratigraphic data that is being displayed in the stratigraphic column,
and adjusting the age
interval of the stratigraphic data that is being displayed.
[0012] In an embodiment, receiving a selection of one or more of the elements
of the
stratigraphic column, and highlighting one or more wells, one or more zones,
one or more depth
intervals of one or more wells, or both in a graphical geoscience interface
based on the selection
of the one or more elements. The one or more wells, one or more zones, or one
or more depth
intervals, or combination thereof extend through one or more strata
represented by the selected
one or more of the elements.
[0013] In an embodiment, the method includes receiving a selection of one or
more wells, one
or more zones, or one or more depth intervals of one or more wells in a
graphical geological
interval, and highlighting one or more strata of the stratigraphic data in the
stratigraphic navigator
based on the selection.
[0014] In an embodiment, the method includes receiving a selection of a well,
and adjusting a
height of at least some elements of the stratigraphic column such that a
height of at least some of
the elements represents a depth interval of the elements in a subterranean
domain proximal to the
well.
[0015] Embodiments of the disclosure also include a computing system including
one or more
processors, and a memory system including one or more non-transitory, computer-
readable media
storing instructions that, when executed by at least one of the one or more
processors, cause the
computing system to perform operations. The operations include obtaining first
geological data
representing a first location, correlating the first geological data with a
chronostratigraphic
timeline, receiving a selection of a second location, correlating second
geological data representing
the second location with the chronostratigraphic timeline, determining one or
more characteristics
of a geology of the second location based at least in part on the first
geological data from the first
location using the chronostratigraphic timeline, and visualizing a
stratigraphic navigator
representing the chronostratigraphic timeline and at least some of the second
geological data for
the second location.
[0016] Embodiments of the disclosure also include a non-transitory, computer-
readable media
storing instructions that, when executed by at least one processor of a
computing system, cause
the computing system to perform operations. The operations include obtaining
first geological data
3
CA 03207613 2023-07-06
WO 2022/150051 PCT/US2021/013018
representing a first location, correlating the first geological data with a
chronostratigraphic
timeline, receiving a selection of a second location, correlating second
geological data representing
the second location with the chronostratigraphic timeline, determining one or
more characteristics
of a geology of the second location based at least in part on the first
geological data from the first
location using the chronostratigraphic timeline, and visualizing a
stratigraphic navigator
representing the chronostratigraphic timeline and at least some of the second
geological data for
the second location.
[0017] Embodiments of the disclosure also include a computing system including
means for
obtaining first geological data representing a first location, means for
correlating the first
geological data with a chronostratigraphic timeline, means for receiving a
selection of a second
location, means for correlating second geological data representing the second
location with the
chronostratigraphic timeline, means for determining one or more
characteristics of a geology of
the second location based at least in part on the first geological data from
the first location using
the chronostratigraphic timeline, and means for visualizing a stratigraphic
navigator representing
the chronostratigraphic timeline and at least some of the second geological
data for the second
location.
[0018] Embodiments of the disclosure also include a computing system
configured to obtain
first geological data representing a first location, correlate the first
geological data with a
chronostratigraphic timeline, receive a selection of a second location,
correlate second geological
data representing the second location with the chronostratigraphic timeline,
determine one or more
characteristics of a geology of the second location based at least in part on
the first geological data
from the first location using the chronostratigraphic timeline, and visualize
a stratigraphic
navigator representing the chronostratigraphic timeline and at least some of
the second geological
data for the second location.
[0019] It will be appreciated that this summary is intended merely to
introduce some aspects of
the present methods, systems, and media, which are more fully described and/or
claimed below.
Accordingly, this summary is not intended to be limiting.
4
CA 03207613 2023-07-06
WO 2022/150051 PCT/US2021/013018
Brief Description of the Drawings
[0020] The accompanying drawings, which are incorporated in and constitute a
part of this
specification, illustrate embodiments of the present teachings and together
with the description,
serve to explain the principles of the present teachings. In the figures:
[0021] Figure 1 illustrates an example of a system that includes various
management
components to manage various aspects of a geologic environment, according to
an embodiment.
[0022] Figure 2 illustrates a flowchart of a method for navigating a
geological environment,
according to an embodiment.
[0023] Figure 3 illustrates a conceptual view of a stratigraphic navigator,
according to an
embodiment.
[0024] Figures 4A, 4B, 4C, 4D, and 4E illustrate additional views of the
stratigraphic navigator,
depicting various different aspects and operations thereof, according to an
embodiment.
[0025] Figure 5 illustrates a view of the stratigraphic navigator in a "single
well view" that
presents stratigraphic data directly in line with geological data (e.g., well
logs) collected, e.g., from
one or more wells, according to an embodiment.
[0026] Figure 6 illustrates a view of an operation of the stratigraphic
navigator, showing
selection of an element of the stratigraphic navigator resulting in a change
in the display of a
graphical geoscience interface, according to an embodiment.
[0027] Figures 7A and 7B illustrate a flowchart of a method for navigating a
geological
environment, according to an embodiment.
[0028] Figure 8 illustrates a flowchart of a method for constructing a
knowledge base for the
stratigraphical navigator, according to an embodiment.
[0029] Figures 9A and 9B illustrate flowcharts of methods for displaying the
stratigraphical
navigator, according to an embodiment.
[0030] Figures 10A and 10B illustrate flowcharts of methods for interacting
with a user via the
stratigraphic navigator, e.g., to facilitate navigation of the geological
environment, according to an
embodiment.
[0031] Figure 11 illustrates a flowchart of another method for navigating a
geological
environment, specifically, interacting with a user via the stratigraphic
navigator, according to an
embodiment.
CA 03207613 2023-07-06
WO 2022/150051 PCT/US2021/013018
[0032] Figures 12A, 12B, 12C, 12D, and 12E illustrate a flowchart of a method
for navigating a
geological environment, according to an embodiment.
[0033] Figure 13 illustrates a schematic view of a computing system, according
to an
embodiment.
Detailed Description
[0034] Reference will now be made in detail to embodiments, examples of which
are illustrated
in the accompanying drawings and figures. In the following detailed
description, numerous
specific details are set forth in order to provide a thorough understanding of
the invention.
However, it will be apparent to one of ordinary skill in the art that the
invention may be practiced
without these specific details. In other instances, well-known methods,
procedures, components,
circuits, and networks have not been described in detail so as not to
unnecessarily obscure aspects
of the embodiments.
[0035] It will also be understood that, although the terms first, second, etc.
may be used herein
to describe various elements, these elements should not be limited by these
terms. These terms are
only used to distinguish one element from another. For example, a first object
or step could be
termed a second object or step, and, similarly, a second object or step could
be termed a first object
or step, without departing from the scope of the present disclosure. The first
object or step, and the
second object or step, are both, objects or steps, respectively, but they are
not to be considered the
same object or step.
[0036] The terminology used in the description herein is for the purpose of
describing particular
embodiments and is not intended to be limiting. As used in this description
and the appended
claims, the singular forms "a," "an" and "the" are intended to include the
plural forms as well,
unless the context clearly indicates otherwise. It will also be understood
that the term "and/or" as
used herein refers to and encompasses any possible combinations of one or more
of the associated
listed items. It will be further understood that the terms "includes,"
"including," "comprises"
and/or "comprising," when used in this specification, specify the presence of
stated features,
integers, steps, operations, elements, and/or components, but do not preclude
the presence or
addition of one or more other features, integers, steps, operations, elements,
components, and/or
groups thereof Further, as used herein, the term "if' may be construed to mean
"when" or "upon"
or "in response to determining" or "in response to detecting," depending on
the context.
6
CA 03207613 2023-07-06
WO 2022/150051 PCT/US2021/013018
[0037] Attention is now directed to processing procedures, methods,
techniques, and workflows
that are in accordance with some embodiments. Some operations in the
processing procedures,
methods, techniques, and workflows disclosed herein may be combined and/or the
order of some
operations may be changed.
[0038] Figure 1 illustrates an example of a system 100 that includes various
management
components 110 to manage various aspects of a geologic environment 150 (e.g.,
an environment
that includes a sedimentary basin, a reservoir 151, one or more faults 153-1,
one or more geobodies
153-2, etc.). For example, the management components 110 may allow for direct
or indirect
management of sensing, drilling, injecting, extracting, etc., with respect to
the geologic
environment 150. In turn, further information about the geologic environment
150 may become
available as feedback 160 (e.g., optionally as input to one or more of the
management components
110).
[0039] In the example of Figure 1, the management components 110 include a
seismic data
component 112, an additional information component 114 (e.g., well/logging
data), a processing
component 116, a simulation component 120, an attribute component 130, an
analysis/visualization component 142 and a workflow component 144. In
operation, seismic data
and other information provided per the components 112 and 114 may be input to
the simulation
component 120.
[0040] In an example embodiment, the simulation component 120 may rely on
entities 122.
Entities 122 may include earth entities or geological objects such as wells,
surfaces, bodies,
reservoirs, etc. In the system 100, the entities 122 can include virtual
representations of actual
physical entities that are reconstructed for purposes of simulation. The
entities 122 may include
entities based on data acquired via sensing, observation, etc. (e.g., the
seismic data 112 and other
information 114). An entity may be characterized by one or more properties
(e.g., a geometrical
pillar grid entity of an earth model may be characterized by a porosity
property). Such properties
may represent one or more measurements (e.g., acquired data), calculations,
etc.
[0041] In an example embodiment, the simulation component 120 may operate in
conjunction
with a software framework such as an object-based framework. In such a
framework, entities may
include entities based on pre-defined classes to facilitate modeling and
simulation. A
commercially available example of an object-based framework is the MICROSOFT
.NET
framework (Redmond, Washington), which provides a set of extensible object
classes. In the
7
CA 03207613 2023-07-06
WO 2022/150051 PCT/US2021/013018
.NET framework, an object class encapsulates a module of reusable code and
associated data
structures. Object classes can be used to instantiate object instances for use
in by a program, script,
etc. For example, borehole classes may define objects for representing
boreholes based on well
data.
[0042] In the example of Figure 1, the simulation component 120 may process
information to
conform to one or more attributes specified by the attribute component 130,
which may include a
library of attributes. Such processing may occur prior to input to the
simulation component 120
(e.g., consider the processing component 116). As an example, the simulation
component 120 may
perform operations on input information based on one or more attributes
specified by the attribute
component 130. In an example embodiment, the simulation component 120 may
construct one or
more models of the geologic environment 150, which may be relied on to
simulate behavior of the
geologic environment 150 (e.g., responsive to one or more acts, whether
natural or artificial). In
the example of Figure 1, the analysis/visualization component 142 may allow
for interaction with
a model or model-based results (e.g., simulation results, etc.). As an
example, output from the
simulation component 120 may be input to one or more other workflows, as
indicated by a
workflow component 144.
[0043] As an example, the simulation component 120 may include one or more
features of a
simulator such as the ECLIPSE' reservoir simulator (Schlumberger Limited,
Houston Texas),
the INTERSECT' reservoir simulator (Schlumberger Limited, Houston Texas), etc.
As an
example, a simulation component, a simulator, etc. may include features to
implement one or more
meshless techniques (e.g., to solve one or more equations, etc.). As an
example, a reservoir or
reservoirs may be simulated with respect to one or more enhanced recovery
techniques (e.g.,
consider a thermal process such as SAGD, etc.).
[0044] In an example embodiment, the management components 110 may include
features of a
commercially available framework such as the PETREL seismic to simulation
software
framework (Schlumberger Limited, Houston, Texas). The PETREL framework
provides
components that allow for optimization of exploration and development
operations. The PETREL
framework includes seismic to simulation software components that can output
information for
use in increasing reservoir performance, for example, by improving asset team
productivity.
Through use of such a framework, various professionals (e.g., geophysicists,
geologists, and
reservoir engineers) can develop collaborative workflows and integrate
operations to streamline
8
CA 03207613 2023-07-06
WO 2022/150051 PCT/US2021/013018
processes. Such a framework may be considered an application and may be
considered a data-
driven application (e.g., where data is input for purposes of modeling,
simulating, etc.).
[0045] In an example embodiment, various aspects of the management components
110 may
include add-ons or plug-ins that operate according to specifications of a
framework environment.
For example, a commercially available framework environment marketed as the
OCEAN
framework environment (Schlumberger Limited, Houston, Texas) allows for
integration of add-
ons (or plug-ins) into a PETREL framework workflow. The OCEAN framework
environment
leverages .NET tools (Microsoft Corporation, Redmond, Washington) and offers
stable, user-
friendly interfaces for efficient development. In an example embodiment,
various components may
be implemented as add-ons (or plug-ins) that conform to and operate according
to specifications
of a framework environment (e.g., according to application programming
interface (API)
specifications, etc.).
[0046] Figure 1 also shows an example of a framework 170 that includes a model
simulation
layer 180 along with a framework services layer 190, a framework core layer
195 and a modules
layer 175. The framework 170 may include the commercially available OCEAN
framework
where the model simulation layer 180 is the commercially available PETREL
model-centric
software package that hosts OCEAN framework applications. In an example
embodiment, the
PETREL software may be considered a data-driven application. The PETREL
software can
include a framework for model building and visualization.
[0047] As an example, a framework may include features for implementing one or
more mesh
generation techniques. For example, a framework may include an input component
for receipt of
information from interpretation of seismic data, one or more attributes based
at least in part on
seismic data, log data, image data, etc. Such a framework may include a mesh
generation
component that processes input information, optionally in conjunction with
other information, to
generate a mesh.
[0048] In the example of Figure 1, the model simulation layer 180 may provide
domain objects
182, act as a data source 184, provide for rendering 186 and provide for
various user interfaces
188. Rendering 186 may provide a graphical environment in which applications
can display their
data while the user interfaces 188 may provide a common look and feel for
application user
interface components.
9
CA 03207613 2023-07-06
WO 2022/150051 PCT/US2021/013018
[0049] As an example, the domain objects 182 can include entity objects,
property objects and
optionally other objects. Entity objects may be used to geometrically
represent wells, surfaces,
bodies, reservoirs, etc., while property objects may be used to provide
property values as well as
data versions and display parameters. For example, an entity object may
represent a well where a
property object provides log information as well as version information and
display information
(e.g., to display the well as part of a model).
[0050] In the example of Figure 1, data may be stored in one or more data
sources (or data stores,
generally physical data storage devices), which may be at the same or
different physical sites and
accessible via one or more networks. The model simulation layer 180 may be
configured to model
projects. As such, a particular project may be stored where stored project
information may include
inputs, models, results and cases. Thus, upon completion of a modeling
session, a user may store
a project. At a later time, the project can be accessed and restored using the
model simulation
layer 180, which can recreate instances of the relevant domain objects.
[0051] In the example of Figure 1, the geologic environment 150 may include
layers (e.g.,
stratification) that include a reservoir 151 and one or more other features
such as the fault 153-1,
the geobody 153-2, etc. As an example, the geologic environment 150 may be
outfitted with any
of a variety of sensors, detectors, actuators, etc. For example, equipment 152
may include
communication circuitry to receive and to transmit information with respect to
one or more
networks 155. Such information may include information associated with
downhole equipment
154, which may be equipment to acquire information, to assist with resource
recovery, etc. Other
equipment 156 may be located remote from a well site and include sensing,
detecting, emitting or
other circuitry. Such equipment may include storage and communication
circuitry to store and to
communicate data, instructions, etc. As an example, one or more satellites may
be provided for
purposes of communications, data acquisition, etc. For example, Figure 1 shows
a satellite in
communication with the network 155 that may be configured for communications,
noting that the
satellite may additionally or instead include circuitry for imagery (e.g.,
spatial, spectral, temporal,
radiometric, etc.).
[0052] Figure 1 also shows the geologic environment 150 as optionally
including equipment 157
and 158 associated with a well that includes a substantially horizontal
portion that may intersect
with one or more fractures 159. For example, consider a well in a shale
formation that may include
natural fractures, artificial fractures (e.g., hydraulic fractures) or a
combination of natural and
CA 03207613 2023-07-06
WO 2022/150051 PCT/US2021/013018
artificial fractures. As an example, a well may be drilled for a reservoir
that is laterally extensive.
In such an example, lateral variations in properties, stresses, etc. may exist
where an assessment
of such variations may assist with planning, operations, etc. to develop a
laterally extensive
reservoir (e.g., via fracturing, injecting, extracting, etc.). As an example,
the equipment 157 and/or
158 may include components, a system, systems, etc. for fracturing, seismic
sensing, analysis of
seismic data, assessment of one or more fractures, etc.
[0053] As mentioned, the system 100 may be used to perform one or more
workflows. A
workflow may be a process that includes a number of worksteps. A workstep may
operate on data,
for example, to create new data, to update existing data, etc. As an example,
a may operate on one
or more inputs and create one or more results, for example, based on one or
more algorithms. As
an example, a system may include a workflow editor for creation, editing,
executing, etc. of a
workflow. In such an example, the workflow editor may provide for selection of
one or more pre-
defined worksteps, one or more customized worksteps, etc. As an example, a
workflow may be a
workflow implementable in the PETREL software, for example, that operates on
seismic data,
seismic attribute(s), etc. As an example, a workflow may be a process
implementable in the
OCEAN framework. As an example, a workflow may include one or more worksteps
that access
a module such as a plug-in (e.g., external executable code, etc.).
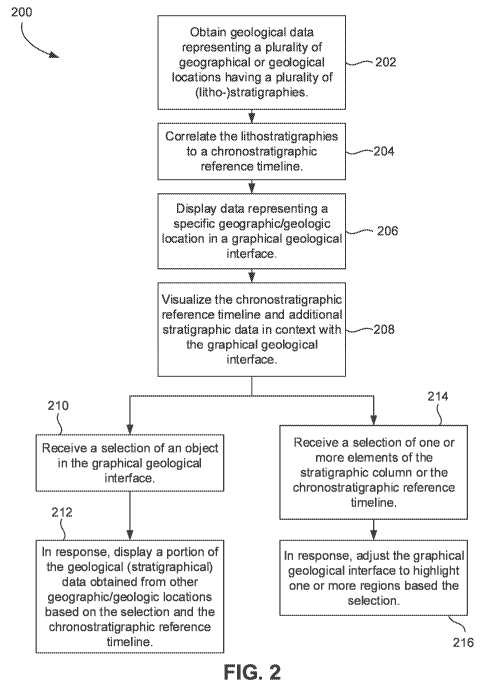
[0054] Figure 2 illustrates a flowchart of a method 200 for navigating a
geological environment
(e.g., digital visualization), according to an embodiment. Various aspects of
the method 200 may
be conducted in the order described herein or in any other order; further,
various aspects may also
be combined, conducted in parallel, or condensed, without departing from the
scope of the present
disclosure.
[0055] The method 200 may include obtaining geological (e.g., stratigraphic)
data representing
a plurality of locations (e.g., geological and/or geographical locations)
having a plurality of
stratigraphies (e.g., lithostratigraphies), as at 202. Although reference is
made herein to
lithostratigraphic data, columns, etc., it will be appreciated that
embodiments of the methods
presented herein may operate using other types of stratigraphic data,
consistent with the present
disclosure. The stratigraphic data may be depth-dependent or at least depth-
related. As discussed
above, the strata at different geological locations (e.g., points or regions
in different oilfields,
basins, regions of the world, etc.) may differ from one another, such that,
for example, the same
strata may exist at different depth intervals (or not at all) in different
locations, be referred to by
11
CA 03207613 2023-07-06
WO 2022/150051 PCT/US2021/013018
different names, etc. Various applications may be employed to harvest this
local data for storage
in back-end databases, and the method 200 may make use of this data by
obtaining it, e.g., from
such databases at 202. In other embodiments, the method 200 may include
collecting and storing
the data.
[0056] In some embodiments, the method 200 may also include correlating the
stratigraphic data
to a chronostratigraphic reference timeline, as at 204. For example, the
different strata may be
categorized and labeled with appropriate chronostratigraphic labels or
mnemonics based on age
and thus may be arranged according to the (generally static)
chronostratigraphic reference timeline.
Accordingly, the relative age of the different rock layers may be stored, so
as to allow comparisons
of contemporaneous rock layers across different geographical locations. In
some embodiments,
such correlation may be done a priori, and the method 200 may access the
correlated data.
[0057] The method 200 may include displaying data representing a specific
(e.g., geographic or
geologic) location in a graphical geoscience interface, as at 206. Using
geographic locations as an
example, various geological aspects of the geographic location may be
displayed in the interface,
for example, well logs, well tops, events, markers, etc. may be displayed. For
example, a user may
select a location, and, in response, the method 200 may display the data
representing the specific
location. The location selected may be one of the locations for which data was
collected at 202. In
some embodiments, a graphical geoscience application may be any application
that ingests
subsurface data and permits the user to visualize or manipulate the data. Such
geoscience
applications may also permit or otherwise facilitate processing of the data.
Examples of such
graphical geoscience interfaces may include mapping applications, data
discovery applications,
data conditioning applications, well interpretation applications, geological
knowledge base
applications, drilling applications, geothermal applications, or other
applications that offer
geoscience data visualization.
[0058] More particularly, mapping applications (e.g., PETREL , TECHLOG ,
AVOCET ,
PETROMOD , ECLIPSE , RAPID SCREENINGTm, EXPLOREPLAN , etc.) may generate a
map of interest, such as a depth map, thickness map (between two layers or an
addition of several
layers of interest), or property map for a given stratigraphic interval (e.g.,
average gamma ray,
water saturation, bulk density, VShale). Data discovery applications (e.g.,
DELFT Gaia) may
permit selection of a depth interval, which may act as a smart filter for the
back-end search result
and therefore for the related front-end display of the data, as will be
described in greater detail
12
CA 03207613 2023-07-06
WO 2022/150051 PCT/US2021/013018
below. Data conditioning applications may "clean" acquired logs (from tools),
so as to remove
environmental disturbances and various acquisition errors. Well interpretation
applications may
allow a user to access raw well logs and compute petrophysical or other sub-
surface domain-
oriented data. Geological knowledge base applications are those that collect
geological knowledge
about a given location, and provide users with a set of geological parameters
(rock type, physical
and chemical properties). This can include core information, for example.
Drilling applications are
applications that allow geoscientists or drilling engineers to view the
subsurface, plan, monitor and
pilot a drilling operation. Geothermal applications permit displaying
subsurface data for
geothermal solutions, such as drilling difficulty of litho-stratigraphies,
thermal conductivity, water
flow and piezometry, among others. Seismic interpretation applications are any
application that
permits working with seismic data.
[0059] The method 200 may also include visualizing the chronostratigraphic
reference timeline
and/or stratigraphic data known or identified gaps in data about the displayed
location in context
with the graphical geoscience interface, as at 208. This display may be
provided by a "stratigraphic
navigator". In some embodiments, the chronostratigraphic reference timeline
may be visually
depicted as one or more columns of elements, with individual elements
representing individual
time intervals (e.g., eons, epochs, etc.), according to an agreed-upon
convention. The stratigraphic
data may likewise be displayed as one or more columns, and relationships
between the
stratigraphic column and the chronostratigraphic column may be depicted.
[0060] For example, based on its position in the chronostratigraphic reference
timeline, the
stratigraphic data from a variety of different locations may be presented in
context with the
representation of the displayed location. This displayed location may or may
not have different
depth-based characteristics than the locations from which the stratigraphic
data is collected. In
some cases, the displayed location and other locations may not include the
same label or
mnemonic, despite referring to the same record of geological timeline. In some
cases, the displayed
location and other locations may refer to the same (litho-)stratigraphic
reference but use mnemonic
of two different hierarchical (granularity) levels. However, the
chronostratigraphic reference
timeline applies both to the subject location and the other locations, thus
permitting the
stratigraphic data from various locations to be used to assist in describing
the stratigraphic makeup
of the displayed location. Accordingly, data about one location may be
displayed at least partially
13
CA 03207613 2023-07-06
WO 2022/150051 PCT/US2021/013018
along with data collected from other locations, using the chronostratigraphic
reference timeline to
make connections between the stratigraphies of the different locations.
[0061] Further, the visualization provided at 208 may be adjustable, e.g., in
time and resolution
(or "granularity"). For example, the stratigraphic navigator may provide a
time selector that
permits scrolling through time in the chronostratigraphic reference timeline.
Based on the position
of the selector, stratigraphic data corresponding to the selected portion of
the chronostratigraphic
reference timeline may be depicted, e.g., in the stratigraphic column, while
other portions of the
stratigraphic column are not visible. Further, the granularity (e.g.,
resolution) of either or both of
the chronostratigraphic column and/or the stratigraphic column may be
adjustable so as to permit
viewing and/or selection of narrower or wider time or depth intervals.
[0062] The stratigraphic navigator may also interact with a graphical
geoscience interface, e.g.,
multiple different graphical geoscience interfaces of potentially different
types, as noted above.
For example, the method 200 may include receiving a selection of an object in
the graphical
geoscience interface, as at 210. Examples of objects may include one or more
wells, zones, well
tops or other well markers, well logs (or portions thereof), depth intervals,
strata, horizons, faults,
other geological features, or any other object that may be related to a
geology of a location. The
stratigraphic navigator may respond by "highlighting" (referring to anything
that is configured to
draw a user's attention to one element or group of elements over another,
e.g., using size, color,
font type and/or style (including bolding, underlining, etc.), obscuring or
omitting non-highlighted
material, etc.) one or more elements of the chronostratigraphic reference
timeline and/or one or
more elements of the stratigraphic column, as at 212. For example, a user may
select a specific
well, and the stratigraphic navigator may respond, according to an embodiment
of the method 200,
by highlighting elements of the stratigraphic data representing one or more
strata through which
the well extends. This stratigraphic data associated with the selected strata,
may thus be rapidly
apparent to the user, e.g., along with its relationship to its correlated
chronostratigraphic reference
timeline element(s).
[0063] The method 200 may also include receiving a selection of one or more
elements in the
stratigraphic navigator, as at 214. For example, one or more elements of the
stratigraphic column
and/or one or more elements of the chronostratigraphic reference timeline may
be selected. In
response, as at 216, the method 200 may adjust the graphical geoscience
interface to highlight one
or more regions in the view provided by the graphical geoscience interface. As
noted above, the
14
CA 03207613 2023-07-06
WO 2022/150051 PCT/US2021/013018
same stratigraphic navigator may persist in different geological interfaces
(e.g., different software
applications and/or platforms) and at different locations, thereby providing
quick access to
different stratigraphic information, e.g., events, etc. associated with a
particular strata, as correlated
by use of the chronostratigraphic reference timeline.
[0064] Figure 3 illustrates an example of a stratigraphic navigator 300
displayed in context with
a graphical geoscience interface 302, according to an embodiment. As shown,
the interface 302
may include a graphical representation of objects, in this case, wells 304.
The wells 304 are
arranged as they may be seen geographically in a map of an oilfield. Instead
of or in addition to
wells, the objects could be any other type of geological object, e.g., basins,
oilfields, etc., and the
view might be a vertical slice or three-dimensional model, or any other view
of data representing
a subsurface domain.
[0065] The stratigraphic navigator 300, in this embodiment, may include a
chronostratigraphic
column 306, a stratigraphic column 308, and a list of wells 310. The
chronostratigraphic column
306 may include elements (e.g., cells) 312 that represent the discrete time
periods of the
chronostratigraphic reference timeline. For example, the individual elements
312 may represent
eonothems/eons, erathem/era, systems/periods, series/epochs, or stages/ages.
The type of time
interval represented may be adjustable by adjusting the granularity of the
column 306, as will be
described in greater detail below. By way of introduction, however, the
granularity may be
adjusted by combining or dividing the elements 312, such that one parent
element 312 forms two
or more child elements 312, or two or more child elements 312 are combined
into one parent
element 312, e.g., with the time interval of the parent element 312
encompassing the more specific
time intervals of the child elements 312. In some cases, a child element 312
may have two or more
parent elements, a parent may have no children, or there may be overlapping
relationships between
parent and children, meaning the beginning of the age of a child element 312
may be in the age
interval of a parent element 312, while the end of the age of the child
element 312 is in the age
interval of a subsequent parent element 312, etc. Thus, the parent-child
relationship may not be
straightforward, but may still be represented in the navigator 300. This
division or combination of
elements 312 may be visualized in many different ways, e.g., by sweeping in a
new column 306
populated with larger or smaller elements in a lateral direction.
[0066] Further, the chronostratigraphic column 306 may also include a time
selector 314, which
may be a scroll bar in some embodiments. The time selector 314 may permit a
user to scroll (e.g.,
CA 03207613 2023-07-06
WO 2022/150051 PCT/US2021/013018
vertically) through time in the chronostratigraphic column 306. The
chronostratigraphic column
306 may also include a menu button 311, which may be selectable to expand the
chronostratigraphic column 306 (e.g., laterally) and provide additional
details about each of the
elements 312, such as by populating the elements 312 with the mnemonics of the
time durations
that they represent.
[0067] The stratigraphic column 308 may also include elements (e.g., cells)
316, which may
correspond to the local stratigraphy of the displayed geographical/geological
area in the interface
302. Accordingly, this column 308 may vary depending on the location displayed
in the interface
302, as provided by reference to the chronostratigraphic reference timeline in
the column 306. In
particular, the elements 316 may be arranged to illustrate a relationship with
the
chronostratigraphic elements 312. For example, the elements 316 that are
displayed may
correspond to those within the vertical extent of the time selector 314. That
is, the height and
position of the time selector 314 in the chronostratigraphic column 306 may
dictate which elements
316 are in view.
[0068] Further, the stratigraphic column 308 may include a granularity
selector 317. The
granulator selector 317 may be selectable by a user to change the interval
represented by individual
elements 316, e.g. by partitioning or combining elements 316 (which, again,
may be visualized in
various different ways). The granularity selector 317 may also be configured
to change the height
of the time selector 314, e.g., to reduce the time interval displayed in the
stratigraphic column 308.
In a simple example of changing granularity, a parent element 316 may be
divided into two or
more child elements 316, or a child element 316 may be combined with one or
more other child
elements 316 to form a parent element 316. Again, however, the relationship
may not be
straightforward, but may still be represented in the stratigraphic navigator
300, as described herein.
[0069] The stratigraphic column 308 may visualize lithostratigraphic
information. The
information structure of the lithostratigraphy may be more complex than the
chronostratigraphy,
as different elements 316 and different granularities may have more than one
parent and/or more
than one child. Some elements may overlap without a match to the various
chronostratigraphic
ages (in which case, the absolute age, e.g., in millions of years, may be
referenced).
[0070] The labels used in a stratigraphic column 308, unlike (in some
embodiments) the
chronostratigraphic column 306, may vary from one basin to another, and
potentially from user to
user. These names may be applied based on knowledge acquired by different
entities at different
16
CA 03207613 2023-07-06
WO 2022/150051 PCT/US2021/013018
times and organized by different people. Indeed, the names of the lithologies
may depend on the
geographical/local names of the Earth. Therefore, though the stratigraphic
column 308 may be
closely linked to the chronostratigraphic column 306, they may include
different data.
[0071] Additionally, a button 319 may be included in at least some of the
elements 316 in the
stratigraphic column 308. The button 319 may represent that geological data
for the strata
represented by the element 316 is available. The button 319 may be clicked on
or hovered over to
reveal the geological data associated therewith. For example, individual
stratigraphic elements 316
(e.g., representing cyclostratigraphic, lithostratigraphic, biostratigraphic
objects, etc.) may hold a
piece of information related to the stratigraphic layer associated therewith.
The data can be a
number of markers, a status, or any value related to the object of the
system/application using the
stratigraphic navigator 300. Such data depends on the nature of the
application and what is
meaningful to the user, and thus the data represented by the button 319 may be
dynamically
determined and different depending on the type of graphical geoscience
interface 302 that is
actively being employed/visualized.
[0072] Further, the list of wells 310 may include a display of names,
locations, or other well
attributes or well properties representing the wells 304 in the display on the
interface 302.
Individual wells 304 may host one or more types of metadata, such as
coordinates, unit systems,
trajectories, or any information describing the identity of each well so that
any domain expert,
depending, e.g., on the focus of the application, can visualize the wells on
the map. In some
embodiments, the metadata may be customizable. Filters may be applied to the
list 310. The list
310 may be linked and synchronized to the map, either represented on a larger
area of the screen
or in a smaller widget. Figure 4A illustrates an example of the stratigraphic
navigator 300 showing
such a map 400 in a widget. In such case, the primary view (where the map is
in Figure 3) may
display other information, such as well logs or the like.
[0073] Figure 4B illustrates the chronostratigraphic column 306 in greater
detail, according to
an embodiment. As mentioned above, the elements 312 may be adjusted to
correspond to different
types of time durations, e.g., in response to selection of the
chronostratigraphic granularity menu
button 311 (Figure 3). Further, the relationship between the different types
of time durations may
be visualized in the stratigraphic navigator 300. For example, the column 306
may initially display
the elements at the eonothem/eon level, as provided in sub-column 410. As
such, individual
elements 412 in sub-column 410 may represent one eonothem/eon. A granularity
selector 414
17
CA 03207613 2023-07-06
WO 2022/150051 PCT/US2021/013018
may be used to adjust the granularity of the column 308, e.g., by displaying
another sub-column
416. Individual elements 418 of the second sub-column 416 may represent
individual
erathems/era. This may be repeated, e.g., using the granularity selector 414
to produce sub-column
422, which may have elements 424 at a system/period level. Color-coding, lines
between sub-
columns, etc., may be employed to show the relationships between the elements
412, 418, 424.
[0074] Further, whether a given element 418 has sub-elements (e.g., elements
424) associated
therewith may be indicated by buttons 420. The buttons 420 may be responsive
to user interaction,
e.g., a mouse click or hover, so as to provide a quick view of the elements
424 associated therewith.
It will be appreciated that the illustration of Figure 4A may be conceptual,
with a single one of the
sub-columns 410, 416, 422 being displayed at one time.
[0075] Figures 4C, 4D, and 4E illustrate an example of an operation of the
selectors 314, 317 in
the stratigraphic navigator 300, according to an embodiment. By the provision
of two selectors
314, 317, two "axis" navigation is implemented in the stratigraphic navigator
300. For example,
scrolling up/down with the selector 314 permits navigation in one direction,
and selecting arrows
or otherwise navigating side-to-side using the selector 317 permits navigation
in another direction.
Conceptually, the stratigraphic navigator 300 can be considered to provide a
large image, while a
portion of this larger image is in display at any given time, and another
portion is not visible. The
portion that is visible can be adjusted through multi-axis navigation using
the selectors 314, 317.
[0076] For example, as shown in Figure 4C, the time selector 314 may be in a
first position,
proximal to a top (e.g., youngest) region of the chronostratigraphic column
306. The time selector
314 in this embodiment is not long enough to span the entirety of the
uppermost element 312 of
the column 306. The height of the elements 312 may be related to the relative
length of time, depth
intervals in the local geology, etc., associated with the individual elements
312. In other
embodiments, the elements 312 may be uniform in height, or the height may be
determined based
on other factors. Since the time selector 314 does not span the uppermost
element 312 in this view,
the elements 316 of the stratigraphic column 308 that are displayed are
associated with the
uppermost element 312. The heights thereof may again be related to physical
characteristics of the
local geology, time duration, or may be uniform or constructed based on other
factors.
[0077] As shown by comparison between Figures 4C and 4D, the granulator
selector 317 may
be used to increase the number of stratigraphic elements 316 that are visible,
e.g., by reducing the
heights thereof. This may be done by partitioning the stratigraphic elements
316 into
18
CA 03207613 2023-07-06
WO 2022/150051 PCT/US2021/013018
representations of shorter geological time or depth intervals, which may be
conceptualized as
scrolling to the right, bringing columns of greater granularity/higher depth
resolution into view. In
some embodiments, the increase in granularity may be accompanied by a
reduction in the overall
interval displayed by the column 306, e.g., to avoid text or other data
contained within the
individual elements 316 from becoming too small to read. For example, in
response to a selection
of the granularity selector 317, the newly-visible elements (e.g., child
elements or parent elements)
may slide into view in the appropriate direction.
[0078] As shown by a comparison between Figures 4C and 4E, the time selector
314 may be
shifted downward along the chronostratigraphic column 306. As a result, the
elements 316 of the
stratigraphic column 308 may change. In this example, the selector 314 spans
at least a portion of
three different elements 316, and thus the corresponding elements 316 are
displayed, potentially
with borders representing the demarcation between the chronostratigraphic
elements 312, as well
as in order and otherwise indicating an association (e.g., by color) with one
or more of the
chronostratigraphic elements 312.
[0079] Referring again to Figure 3, the wells 304 may have a relationship to
the
chronostratigraphic column elements 312 and the lithostratigraphic column
elements 316. The
height of the elements 316 in the column 308 may be uniform or may be
determined based on
characteristics not associated with physical depth/strata thickness. Thus, a
layer of the geology,
e.g., in the graphical geoscience interface 302, may be customizable,
permitting changing the
location/depth of its top and/or bottom, and thereby yielding varying
thicknesses of the layers,
potentially without varying the visual depiction of the individual elements
316. In other
embodiments, the height of the elements 316 may be adjustable or otherwise
representative of the
thickness of the associated layer(s) of the geology.
[0080] Figure 5 illustrates the stratigraphic navigator 300 in an alternative
view, e.g., displaying
additional information for a single well ("single well view") according to an
embodiment. In
multiple wells view, as discussed above with respect to Figure 3, providing
the stratigraphic
navigator 300 in the context of a map or another view that depicts potentially
many wells 304, the
height of an individual stratigraphic element 316 may be set as a function of
available display
space, rather than related to the physical parameters of the geological
layers. However, in a single
well view, as shown in Figure 5, the height of individual elements 316 may
adapt to reflect the
ratio of the selected thickness against the total length (or length visible in
a single view, e.g., if less
19
CA 03207613 2023-07-06
WO 2022/150051 PCT/US2021/013018
than the total) of the well. In some embodiments, the columns 306, 308 may be
depicted in the
single well view in context with depth-dependent data related to the local
geology. For example,
well logs 500 may be arranged next to the columns 306, 308, such that the
stratigraphic navigator
is "in context" with the well logs 500, and, further, depict geological data
related to the visualized
stratigraphic elements 316.
[0081] Going from the global (e.g., potentially large number of wells) view to
the single well
view may thus result in a transformation or adjustment of the height of the
individual elements
316. The black circles representing the wells 304 on the map view (Figure 3)
may display the
thickness value of each well for the selected interval, e.g., in response to
hovering over or clicking
the circle itself. In some embodiments, the thickness value may be displayed
in the map in
response to hovering or clicking on the circle. In other embodiments, such
thickness value may be
embedded within the details of the well 304, which may be displayed in a
separate window, e.g.,
after selection.
[0082] As noted above with respect to Figure 2, selection of elements 316 in
the stratigraphic
column 308 may result in adjustments to the graphical geoscience interface
302. An example of
this is shown in Figure 6. One of the elements 316 is selected ("the selected
element 600"), e.g.,
via user input (e.g., a mouse click). In response, the stratigraphic navigator
300 may highlight wells
304 on the map 400 that include (or, alternatively, those wells 304 that do
not include) the
stratigraphic layer represented by the selected element 600. Likewise, the
stratigraphic navigator
300 may highlight the wells 304 in the list 310 that include (or do not
include) the stratigraphic
layer represented by the selected element 600. The reverse relationship may
also or instead be
employed, such that selection of a well 304 in either the list 310 or the map
400 may result in
highlighting one or more elements 316 in the stratigraphic column 308 that are
included/not
include in the well 304. In other embodiments, the highlighting may also be
determined depending
on information that is available, e.g., that the element 316 contains data
related to the stratigraphy
of the well 304 selected.
[0083] Figures 7A and 7B illustrate a flowchart of a method 700 for navigating
a geologic
environment, according to an embodiment. The method 700 may proceed at least
in part using the
stratigraphic navigator 300. Thus, the method 700 may be described herein with
reference thereto
by way of example. Further, various aspects of the method 700 may be conducted
in the order
CA 03207613 2023-07-06
WO 2022/150051 PCT/US2021/013018
described herein or in any other order, various aspects may also be combined,
conducted in
parallel, or condensed, without departing from the scope of the present
disclosure.
[0084] The method 700 may begin by building a database of stratigraphical data
(e.g., columns
or charts) collected from different geographical regions or corresponding to
various sub-type of
stratigraphical data. The geology of the different regions may, for example,
have different
lithostratigraphies, such that a direct comparison of the same depth intervals
may not be
appropriate. Thus, the method 700 may include correlating lithostratigraphic
data collected from
one or more regions to a chronostratigraphic reference (e.g., timeline, as
discussed above), as at
702. This data may be stored in a persistent format for access at a later
time. The
chronostratigraphic reference may provide for a "translation" of the depth-
based data to a time-
based reference that can be carried forward to other regions for comparison
and form at least a
partial basis for inference of data at these other locations.
[0085] The method 700 may then proceed to displaying the data that is
collected in a format that
is configured to enhance the efficiency of a user's experience with a
graphical geoscience interface.
For example, the method 700 may include receiving, as at 704, a selection of
one or more regions
in such a graphical geoscience interface, e.g., one of the regions for which
data was correlated at
702. The one or more regions may thus have lithostratigraphic information
available in back-end
storage, e.g., in the database discussed above. The method 700 may thus
include determining (e.g.,
by reference to the database) such lithostratigraphic data using the data that
was previously
correlated, as at 706.
[0086] The method 700 may then include displaying a stratigraphic navigator,
as at 708, such as
the stratigraphic navigator 300 of Figure 3, including a list of wells 310 in
the region (or any other
relevant objects), a chronostratigraphic column 306 that represents the
chronostratigraphic data,
and a stratigraphic column 308 representing the stratigraphic data for the
region. As discussed
above, the chronostratigraphic reference timeline may be static, or updated
intermittently, and thus
may provide a mode for translating depth-based data to geological time-based
data, which may
permit stratigraphic comparisons between regions. In some embodiments, the
chronostratigraphic
column 306 may display the entirety of the chronostratigraphic reference
timeline, e.g., in
relatively high-level timescale so that a user can scroll through to a time
duration of interest (e.g.,
using the time selector 314). As described above, the stratigraphic column 308
may depict the
elements 316 corresponding to the selected portion of the chronostratigraphic
column 306.
21
CA 03207613 2023-07-06
WO 2022/150051 PCT/US2021/013018
[0087] The method 700 may then proceed to interacting with the user and the
graphical
geoscience interface in which the stratigraphic navigator 300 is presented,
permitting the user to
quickly reference and apply data to form inferences about a subsurface domain
of interest. The
method 700 may, for example, include receiving a command to display the
displayed elements 316
of the stratigraphic column 308 and/or the elements 312 of the
chronostratigraphic column 306 in
higher or lower resolution (e.g., via the granularity selector 317 and/or
414), as at 710. This is
shown in and discussed above, for example, with reference to Figures 4C-4E. In
response, as at
712, the method 700 may partition or combine the stratigraphic elements 316 of
the column 308
to depict the selected portion of the subsurface in greater or lesser detail,
depending on the user's
input.
[0088] Additionally, the method 700 may include receiving a selection of one
or more layers
(strata) in the stratigraphic column 308, as at 714. This may be accomplished
by using a mouse or
another input device to select one or more of the elements 316 of the
stratigraphic column 308. In
response, as at 716, geological data related to the selected layer (e.g.,
depth interval) may be
displayed, e.g., in a (seismic) cross-section, well log, or another geological
image or model.
Additionally or alternatively, elements of the graphical geoscience interface
may be identified,
e.g., as depicted in Figure 6. For example, wells that extend through the
selected layer may be
highlighted, or wells that do not extend through the selected layer may be
highlighted. In other
embodiments, the geological data may identify one or more different objects
contained in the layer
corresponding to the selected stratigraphic element 316.
[0089] In an embodiment, the method 700 may also include receiving a selection
of a single
well, e.g., in the list of wells 310 or in the graphical geoscience interface
302, as at 718. As
discussed above with reference to Figure 5, the method 700 may also include,
as at 720, adjusting
a height of the elements 316 of the stratigraphic column 308 to represent a
physical thickness of
the layer(s) associated with the elements 316, e.g., relative to a length of
the selected well. The
method 700 may also include displaying, as at 722, the height-adjusted
elements 316 of the
stratigraphic column 308 along with depth-dependent (e.g., geological) data
related to the well.
[0090] Figure 8 illustrates a flowchart of a method 800 for navigating a
geological environment,
e.g., through the implementation of the stratigraphic navigator 300 in context
with a graphical
geoscience interface, according to an embodiment. The method 800 may be
illustrative of at least
a part of the method 700, according to an embodiment. Further, various aspects
of the method 800
22
CA 03207613 2023-07-06
WO 2022/150051 PCT/US2021/013018
may be conducted in the order described herein or in any other order, various
aspects may also be
combined, conducted in parallel, or condensed, without departing from the
scope of the present
disclosure.
[0091] The method 800 may include receiving a selection of a well, as at 802.
As discussed
above, in at least one embodiment, the graphical geoscience interface may
provide a map view of
a region, along with circles or other items that represent well locations,
e.g., at the surface of the
Earth. The stratigraphic navigator 300 may also provide a list of wells in the
region. Accordingly,
the method 800 may receive a selection from the list of wells or of one or
more of the wells on the
map in the graphical geoscience interface, and then may identify a
geographical location of a well
head associated with the well selection, as at 804. The well head may be in
existence or planned
but not yet drilled, or in any other state of completion.
[0092] The method 800 may then access geological data related to the
geographical location of
the well head, as at 806. The method 800 may, for example, check for
stratigraphic data that has
been collected from the local region and check for a geographical validity
extension property. In
the format that is created to store the stratigraphic columns and chart in a
database, a specific
geographical validity extension property may be included to indicate a
validity of a specific
stratigraphic object within a corresponding geographical area (e.g., a
rectangle, a circle, a basin
shape), as defined by one or more anchor points. The position of the anchor
points may be defined
by a coordinate system (e.g., a Cartesian X, Y system or a more complex
system). The coordinates
may be transformed into geographical positioning. Therefore, such a
stratigraphic object may be
considered "valid" within the shape defined by these anchor points. Thus, when
interrogating a
system, by comparing geographical position of wells and stratigraphic object's
geographical
validity, the system may decide what is relevant for a particular use case.
[0093] The available stratigraphic data may then be displayed in context with
the geological
interface, as at 808. The available stratigraphic data may also be paired with
a point on a
chronostratigraphic reference timeline, which may permit conversion of local
depth-dependent
data to an age standard that may be applicable to multiple regions.
[0094] In addition, the method 800 may receive a selection of an element of
the stratigraphic
column, as at 810. For example, a user may type in a mnemonic representing a
particular stratum,
and the stratigraphic navigator 300 may employ a search technique to associate
the mnemonic with
23
CA 03207613 2023-07-06
WO 2022/150051 PCT/US2021/013018
a particular element 316 of the stratigraphic column 308. The selected
stratigraphic element may
then be paired with the point on the chronostratigraphic reference timeline at
810.
[0095] Figures 9A and 9B illustrate methods 900, 950, respectively, for
displaying the
stratigraphic navigator 300 in context with a graphical geoscience interface,
according to an
embodiment. Further, various aspects of the methods 900, 950 may be conducted
in the order
described herein or in any other order, various aspects may also be combined,
conducted in
parallel, or condensed, without departing from the scope of the present
disclosure.
[0096] Beginning with Figure 9A, the method 900 may include, for a particular
geographical
region that may be displayed in a graphical geoscience interface, retrieving
the stratigraphic
column 308 applicable thereto from back-end storage, as at 902. The method 900
may also include
displaying a chronostratigraphic reference timeline (e.g., the
chronostratigraphic column 306)
along with lithostratigraphic data (e.g., the stratigraphic column 308) in
association therewith, e.g.,
side-by-side, showing the relationship therebetween retrieved from storage, as
at 904. Further, the
columns 306, 308 may be displayed in context with the graphical geoscience
interface (e.g.
overlaying, next to, in a separate, concurrently-present display, etc.). The
method 900 may then
include highlighting one or more intervals (e.g., in the stratigraphic column
308) of
lithostratigraphic data that are missing or incomplete, as at 906.
[0097] In Figure 9B, the method 950 may include receiving a well selection in
the graphical
geoscience interface (e.g., a selection of a well from a list or on a map), as
at 952. The method 950
may include displaying a selection of intervals corresponding to one present
in the selected well,
as at 954. The method 950 may also include displaying the chronostratigraphic
timeline and a
selection of lithostratigraphic intervals (e.g., elements 316 of the
stratigraphic column 308)
corresponding to the geology of the selected well (e.g., through which the
well extends), as at 956.
[0098] Figures 10A and 10B illustrate flowcharts of methods 1000 and 1050,
respectively, for
navigating a geological environment, specifically, interacting with a user via
the stratigraphic
navigator 300, according to an embodiment. Various aspects of the method 1000,
1050 may be
conducted in the order described herein or in any other order, various aspects
may also be
combined, conducted in parallel, or condensed, without departing from the
scope of the present
disclosure.
[0099] In Figure 10A, the method 1000 includes displaying the
chronostratigraphic column 306,
along with a portion of the stratigraphic column 308, as at 1002. Another
portion of the
24
CA 03207613 2023-07-06
WO 2022/150051 PCT/US2021/013018
stratigraphic column 308 may be obscured from view, and higher or lower levels
of granularity for
either or both columns 306, 308 may likewise not be in view.
[0100] The method 1000 may include adjusting the granularity of the
chronostratigraphic
column 306, the stratigraphic column 308, or both, in response to user input,
e.g., via a granularity
selector 317, 414, as at 1004. This may permit a user to scroll through and
select or otherwise
extract information from elements 312, 316 of different levels of time or
depth specificity.
[0101] Additionally or alternatively, the method 1000 may include adjusting
visible elements of
the stratigraphic column in response to user input, as at 1006. Such user
input may be via the time
selector 314, which may permit adjusting the displayed chronostratigraphic
time-intervals that
encompass the stratigraphic elements 312 that are visible. Further, in
response to user selections
or other input, the method 1000 may include highlighting visible and/or
selected intervals in well
cross-sections, as at 1008.
[0102] Referring to Figure 10B, the method 1050 may include receiving a
selection of one or
more elements 316 of the stratigraphic column 308 and/or one or more elements
312 of the
chronostratigraphic column 306, as at 1052. The method 1050 may then highlight
a depth interval,
marker, event, or combination thereof in a graphical geoscience interface
based at least in part on
the selection, as at 1054. The method 1050 may instead or additionally include
highlighting one
or more wells in the graphical geoscience interface that have or do not have
data related to the
selected stratigraphic element(s) 316 and/or chronostratigraphic element(s)
312.
[0103] Figure 11 illustrates a flowchart of another method 1100 for navigating
a geological
environment, specifically, interacting with a user via the stratigraphic
navigator 300, according to
an embodiment. Various aspects of the method 1100 may be conducted in the
order described
herein or in any other order, various aspects may also be combined, conducted
in parallel, or
condensed, without departing from the scope of the present disclosure.
[0104] The method 1100 may include receiving a selection of a well from a
graphical geoscience
interface, as at 1102, and then adjusting and displaying the stratigraphic
data in a column 308, such
that relative heights of respective elements 316 of the column 308 represent a
depth interval of a
corresponding layer, stratum, or other element of the subsurface domain
through which the well
extends, as at 1104.
[0105] Figure 12 illustrates a flowchart of a method 1200 for navigating a
geologic environment,
according to an embodiment. The method 1200 may include obtaining first
geological data
CA 03207613 2023-07-06
WO 2022/150051 PCT/US2021/013018
representing a first location, as at 1202 (e.g., Figure 2, box 202; geological
data about multiple
locations obtained). The method 1200 may also include correlating the first
geological data with a
chronostratigraphic timeline, as at 1204 (e.g., Figure 2, box 204). The method
1200 may include
receiving a selection of a second location, as at 1206. The method 1200 may
include correlating
second geological data representing the second location with the
chronostratigraphic timeline, as
at 1208 (e.g., Figure 2, box 204; multiple locations may be correlated). The
method 1200 may
include determining one or more characteristics of a geology of the second
location based at least
in part on the first geological data from the first location using the
chronostratigraphic timeline, as
at 1210 (e.g., Figure 2, box 212).
[0106] The method 1200 may also include visualizing a stratigraphic navigator
representing the
chronostratigraphic timeline and at least some of the second geological data
for the second
location, as at 1212 (e.g., Figure 2, box 208). In an embodiment, visualizing
the stratigraphic
navigator may include displaying the stratigraphic navigator in context with a
graphical geoscience
interface that displays geological data representing one or more wells, as at
1214 (e.g., Figure 2,
box 208). In an embodiment, visualizing may include displaying the
chronostratigraphic timeline
as a chronostratigraphic column in the stratigraphic navigator, as at 1216
(e.g., Figure 2, box 208).
For example, elements of the chronostratigraphic column may represent
geological time intervals,
as at 1218 (e.g., Figure 7A, box 708). Further, visualizing may include
displaying a stratigraphic
column in the stratigraphic navigator based on the second geological data, as
at 1218 (e.g., Figure
7A, box 708). The second geological data may include stratigraphic data, as at
1220, and the
stratigraphic column includes elements that represent one or more strata that
are local to the second
location, as at 1222 (e.g., Figure 9A, box 904). Visualizing may also include
displaying a
relationship between the elements of the stratigraphic column and the elements
of the
chronostratigraphic column, as at 1224 (e.g., Figure 8, box 810).
[0107] In an embodiment, the method 1200 may also include receiving an input
from a user via
interaction with the stratigraphic navigator, as at 1226 (e.g., Figure 10A,
box 1002). In an
embodiment, the method 1200 may include adjusting a display of the
stratigraphic navigator based
on the input from the user, as at 1228 (e.g., Figure 10A, box 1004). Adjusting
the display may
include adjusting a granularity of the second geological data, the
chronostratigraphic timeline, or
both, as at 1230 (e.g., Figure 10A, box 1004). Adjusting the display may also
or instead include
26
CA 03207613 2023-07-06
WO 2022/150051 PCT/US2021/013018
adjusting a portion of the second geological data that is visible by adjusting
a selection of a portion
of the chronostratigraphic timeline, as at 1232 (e.g., Figure 10A, box 1006).
[0108] In an embodiment, the method 1200 may include receiving a selection of
one or more of
the one or more wells in the graphical geoscience interface, as at 1234 (e.g.,
Figure 9B, box 952).
The method 1200 may also include highlighting one or more portions of the
second geological
data in the stratigraphical navigator based on the selection, as at 1236
(e.g., Figure 9B, box 954).
[0109] In an embodiment, the method 1200 may also include receiving a command
to change a
granularity of the stratigraphic column, as at 1238 (e.g., Figure 10A, box
1002). The method 1200
may include adjusting the granularity of the stratigraphic data such that more
or fewer elements of
the stratigraphic column are visible, as at 1240 (e.g., Figure 10A, box 1004).
[0110] In an embodiment, the method 1200 may include receiving a command to
change an age
interval of the stratigraphic data that is being displayed in the
stratigraphic column, as at 1242. The
method 1200 may include adjusting the age interval of the stratigraphic data
that is being displayed,
as at 1244 (e.g., Figure 10A, box 1006).
[0111] In an embodiment, the method 1200 may include receiving a selection of
one or more of
the elements of the stratigraphic column, as at 1246 (e.g., Figure 10B, box
1052). The method
1200 may also include highlighting one or more wells, one or more zones, one
or more markers,
one or more markers of one or more wells, one or more depth intervals of one
or more wells, or a
combination thereof in a graphical geoscience interface based on the selection
of the one or more
elements, as at 1248 (e.g., Figure 10B, boxes 1054 and 1056). The one or more
wells, one or more
zones, or one or more depth intervals, one or more markers, one or more
markers of one or more
wells, or combination thereof extend through one or more strata represented by
the selected one or
more of the elements, as at 1250 (e.g., Figure 10B, box 1054).
[0112] In an embodiment, the method 1200 may include receiving a selection of
one or more
wells, one or more zones, or one or more depth intervals of one or more wells
in a graphical
geological interval, as at 1252 (e.g., Figure 7B, box 714). The method 1200
may include
highlighting one or more strata of the stratigraphic data in the stratigraphic
navigator based on the
selection, as at 1254 (e.g., Figure 7B, box 716).
[0113] In an embodiment, the method 1200 may include receiving a selection of
a well, as at
1256 (e.g., Figure 7B, box 718). The method 1200 may include adjusting a
height of at least some
elements of the stratigraphic column such that a height of at least some of
the elements represents
27
CA 03207613 2023-07-06
WO 2022/150051 PCT/US2021/013018
a depth interval of the elements in a subterranean domain proximal to the well
(e.g., Figure 7B,
box 720), as at 1258.
[0114] In some embodiments, the methods of the present disclosure may be
executed by a
computing system. Figure 13 illustrates an example of such a computing system
1300, in
accordance with some embodiments. The computing system 1300 may include a
computer or
computer system 1301A, which may be an individual computer system 1301A or an
arrangement
of distributed computer systems. The computer system 1301A includes one or
more analysis
modules 1302 that are configured to perform various tasks according to some
embodiments, such
as one or more methods disclosed herein. To perform these various tasks, the
analysis module
1302 executes independently, or in coordination with, one or more processors
1304, which is (or
are) connected to one or more storage media 1306. The processor(s) 1304 is (or
are) also connected
to a network interface 1307 to allow the computer system 1301A to communicate
over a data
network 1309 with one or more additional computer systems and/or computing
systems, such as
1301B, 1301C, and/or 1301D (note that computer systems 1301B, 1301C and/or
1301D may or
may not share the same architecture as computer system 1301A, and may be
located in different
physical locations, e.g., computer systems 1301A and 1301B may be located in a
processing
facility, while in communication with one or more computer systems such as
1301C and/or 1301D
that are located in one or more data centers, and/or located in varying
countries on different
continents).
[0115] A processor may include a microprocessor, microcontroller, processor
module or
subsystem, programmable integrated circuit, programmable gate array, or
another control or
computing device.
[0116] The storage media 1306 may be implemented as one or more computer-
readable or
machine-readable storage media. Note that while in the example embodiment of
Figure 13 storage
media 1306 is depicted as within computer system 1301A, in some embodiments,
storage media
1306 may be distributed within and/or across multiple internal and/or external
enclosures of
computing system 1301A and/or additional computing systems. Storage media 1306
may include
one or more different forms of memory including semiconductor memory devices
such as dynamic
or static random access memories (DRAMs or SRAMs), erasable and programmable
read-only
memories (EPROMs), electrically erasable and programmable read-only memories
(EEPROMs)
and flash memories, magnetic disks such as fixed, floppy and removable disks,
other magnetic
28
CA 03207613 2023-07-06
WO 2022/150051 PCT/US2021/013018
media including tape, optical media such as compact disks (CDs) or digital
video disks (DVDs),
BLURAY disks, or other types of optical storage, or other types of storage
devices. Note that the
instructions discussed above may be provided on one computer-readable or
machine-readable
storage medium, or may be provided on multiple computer-readable or machine-
readable storage
media distributed in a large system having possibly plural nodes. Such
computer-readable or
machine-readable storage medium or media is (are) considered to be part of an
article (or article
of manufacture). An article or article of manufacture may refer to any
manufactured single
component or multiple components. The storage medium or media may be located
either in the
machine running the machine-readable instructions, or located at a remote site
from which
machine-readable instructions may be downloaded over a network for execution.
[0117] In some embodiments, computing system 1300 contains one or more
stratigraphic
navigation module(s) 1308. In the example of computing system 1300, computer
system 1301A
includes the stratigraphic navigation module 1308. In some embodiments, a
single stratigraphic
navigation module may be used to perform some aspects of one or more
embodiments of the
methods disclosed herein. In other embodiments, a plurality of stratigraphic
navigation modules
may be used to perform some aspects of methods herein.
[0118] It should be appreciated that computing system 1300 is merely one
example of a
computing system, and that computing system 1300 may have more or fewer
components than
shown, may combine additional components not depicted in the example
embodiment of Figure
13, and/or computing system 1300 may have a different configuration or
arrangement of the
components depicted in Figure 13. The various components shown in Figure 13
may be
implemented in hardware, software, or a combination of both hardware and
software, including
one or more signal processing and/or application specific integrated circuits.
[0119] Further, the steps in the processing methods described herein may be
implemented by
running one or more functional modules in information processing apparatus
such as general
purpose processors or application specific chips, such as ASICs, FPGAs, PLDs,
or other
appropriate devices. These modules, combinations of these modules, and/or
their combination with
general hardware are included within the scope of the present disclosure.
[0120] Computational interpretations, models, and/or other interpretation aids
may be refined in
an iterative fashion; this concept is applicable to the methods discussed
herein. This may include
use of feedback loops executed on an algorithmic basis, such as at a computing
device (e.g.,
29
CA 03207613 2023-07-06
WO 2022/150051 PCT/US2021/013018
computing system 1300, Figure 13), and/or through manual control by a user who
may make
determinations regarding whether a given step, action, template, model, or set
of curves has
become sufficiently accurate for the evaluation of the subsurface three-
dimensional geologic
formation under consideration.
[0121] The foregoing description, for purpose of explanation, has been
described with reference
to specific embodiments. However, the illustrative discussions above are not
intended to be
exhaustive or limiting to the precise forms disclosed. Many modifications and
variations are
possible in view of the above teachings. Moreover, the order in which the
elements of the methods
described herein are illustrate and described may be re-arranged, and/or two
or more elements may
occur simultaneously. The embodiments were chosen and described in order to
best explain the
principles of the disclosure and its practical applications, to thereby enable
others skilled in the art
to best utilize the disclosed embodiments and various embodiments with various
modifications as
are suited to the particular use contemplated.