Note: Descriptions are shown in the official language in which they were submitted.
WO 2023/279213
PCT/CA2022/051078
METABOLOM IC PROFILES FOR PREDICTION OF FUNCTIONAL NEUROLOGICAL
OUTCOME OR DEATH FOLLOWING SEVERE TRAUMATIC BRAIN INJURY
CROSS REFERENCE TO RELATED APPLICATION
[0001] The present application claims benefit of and claims priority to
U.S. Provisional
Patent Application No. 63/220,248 filed July 9,2021, the entirety of which is
hereby
incorporated by reference.
FIELD
[0002] The present disclosure relates generally to metabolomic
profiles in serum predict
global functional neurological outcome and death at 3 and 12 months following
severe
traumatic brain injury.
BACKGROUND
[0003] Traumatic brain injury (TBI) is defined as a neurologic
injury resulting from an
external mechanical force and is one of the most common causes of long-term
neurological
disability and death 1. Worldwide, approximately 69 million people suffer
mild, moderate, and
severe TBI annually 2. There are 5.3 and 7.7 million individuals living with
TBI-related disability
in US and European Union countries, respectively 1. Severe TBI (sTBI) has a
mortality of 30-
50% and 30% of survivors have severe neurologic sequelae 3-7. Large
variability in the
mechanisms of TBI, patterns of brain injury and a large range of outcomes make
it difficult to
determine prognosis in the first few days following sTBI 8. Clinical factors
and neuroimaging
findings are not clinically reliable predictors for the prognosis of sTBI
outcome 9,1 . More
accurate blood biomarkers are urgently needed to help inform discussions with
surrogate
decision-makers about the level of care, while the patient is comatose, and to
help plan
rehabilitation and support services. Metabolonnics is widely used to provide
potential insights
into mechanisms of injury and may allow the development of very sensitive and
specific
biomarkers for the prognosis of TBI 11.
SUMMARY
[0004] There is provided herein a method of determining a
likelihood of an unfavourable
outcome in a subject having a severe traumatic brain injury (sTBI),
comprising: obtaining a
sample from a subject at day 1 and/or day 4 post sTBI, measuring an amount of
a plurality of
metabolites in the sample, and comparing levels of the plurality of
metabolites in the sample
with a control; wherein an outcome of the comparing step is an increase or
decrease in quantity
of said plurality of metabolites in the sample relative to the control, and
wherein unfavourable
outcome is determined as likely when: in the day 1 sample, at least two, or at
least 5, of the
- 1 -
CA 03225337 2024- 1-9
WO 2023/279213
PCT/CA2022/051078
following metabolites of the plurality of metabolites are changed relative to
the control: C3:1,
LYSOC17:0, LYSOC18:0, LYSOC16:0, C18:2, LYSOC18:1, C14, C18:1, C18, C16,
tyrosine,
homocysteine, C3, CO, C4, ornithine, LYSOC14:0, SM 16:1 OH, LYSOC20:3,
LYSOC28:1,
phenylalanine, glutamine, PC ae 36:0, histidine, SM 20:2, isoleucine,
citrulline, methionine-
sulfoxide, asymmetric dimethylarginine, C5OH, C10:2, acetyl-ornithine, 09,
methionine-
sulfoxide, spermine, serotonin, serine, trans-hydroxyproline, succinate,
gluconate, acetone,
lactate, glycerol, betaine, choline, alanine, and 3-hyroxyisovalerate; and/or
in the day 4 sample,
at least two, or at least 5, of the following metabolites of the plurality of
metabolites are
changed relative to the control: valine, N-acetylaspartate, tyrosine, lysine,
dimethylsulfone,
taurine, gluconate, hypoxanthine, beta-alanine, C3OH, glutamic acid,
LYSOC18:0, P036:0AA,
018:2, 03:1, 03, ornithine, CO, SM 16:1 OH, LYSOC14:0, LYSOC20:3,
homocysteine, 016:1,
glutamine, beta-hydroxybutyric acid, uric acid, serotonin, C9, PC ae 36:0,
methionine-sulfoxide,
serine, a-dimethylarginine, spermine, and trans-hydroxyproline; wherein the
unfavourable
outcome comprises a Glasgow Outcome Scale Extended (GOSE) score < 4 from 3
months to
12 months post sTBI. For example, the likelihood of unfavorable outcome may be
determined
for three months following the sTBI, or may be determined for twelve months
following the sTBI.
[0005] According to an embodiment described herein, the
likelihood of the unfavorable
outcome may be determined from a Day 1 sample, with an increase or decrease in
the at least
two, or the at least 5, metabolites as per Tables 35A, 35B, 37A, or 37B.
[0006] In another embodiment, the likelihood of the unfavorable outcome may
be
determined from a Day 4 sample, with an increase or decrease in the at least
two, or the at
least 5, metabolites as per Tables 36A, 36B, 38A, or 38B.
[0007] Further, there is described herein a method of
determining a likelihood of
mortality within three months in a subject having a severe traumatic brain
injury (sTBI),
comprising: obtaining a sample from a subject at day 1 and/or day 4 post sTBI,
measuring an
amount of a plurality of metabolites in the sample, and comparing levels of
the plurality of
metabolites in the sample with a control, wherein an outcome of the comparing
step is an
increase or decrease in quantity of said plurality of metabolites in the
sample relative to the
control, and wherein increased likelihood of mortality is determined when: in
the day 1 sample,
at least two, or at least 5, of the following metabolites of the plurality of
metabolites are
changed relative to the control: 03:1, PC aa 38:0, glucose, 016:2, leucine,
010:2, valine,
isoleucine, histidine, C160H, glutamine, betaine, 3-hydroxyisovalerate,
citrate, and lactate;
[0008] and/or in the day 4 sample, at least two, or at least 5, of the
following metabolites of the
plurality of metabolites are changed relative to the control: isobutyrate,
valine, lysine, 2-
- 2 -
CA 03225337 2024- 1-9
WO 2023/279213
PCT/CA2022/051078
aminobutyrate, hypoxanthine, taurine, gluconate, betaine, alpha-ketoglutaric
acid, C16:20H,
hippuric acid, indole acetic acid, PC aa 36:0, ornithine, PC aa 38:0, alpha-
aminoadipic acid,
tryptophan, leucine, C12:1, C6, glutamine, and LysoPC 26:0.
[0009] Optionally, the likelihood of mortality may be determined
from a Day 1 sample,
with increase or decrease in said at least 2, or said at least 5, of the
plurality of metabolites as
per Tables 43A, 43B, 45A, or 45B.
[0010] Further, the likelihood of mortality may be determined
from a Day 4 sample, with
an increase or decrease in the at least 2, or the at least 5, of the plurality
of metabolites as per
Tables 44A, 44B, 46A, 46B, or 46C.
[0011] An embodiment is described herein of a method of determining a
likelihood of an
outcome in a subject having a severe traumatic brain injury (sTBI) or
suspected of having an
sTBI, comprising: obtaining a sample from a subject at day 1 or day 4 post-
sTBI, measuring an
amount of a plurality of metabolites in the sample, and comparing levels of
the plurality of
metabolites in the sample with a control, wherein an outcome of the comparing
step is an
increase or decrease in quantity of said plurality of metabolites in the
sample, (i) wherein the
likelihood of unfavourable outcome at 3 months is determined: (al) in a day 1
sample assessed
by quantitative MS, wherein at least 2, at least 5, or at least 10 metabolites
of said plurality of
metabolites are increased or decreased relative to the control as indicated of
the 26
metabolites in Table 35Aor of the 13 metabolites in Table 35B; or (a2) in a
day 4 sample
assessed by MS/MS, wherein at least 2, at least 5, or at least 10 metabolites
of said plurality of
metabolites are increased or decreased relative to the control as indicated,
of the 15
metabolites in Table 36A, or of the 11 metabolites in Table 36B; or (bl) in a
day 1 sample
assessed by proton (1H) nuclear magnetic resonance spectroscopy (NM R),
wherein at least 2,
at least 5, or at least 10 metabolites of said plurality of metabolites are
increased or decreased
relative to the control as indicated, of the 12 metabolites in Table 39A, or
at least 5 of the 6
metabolites in Table 39B; or (b2) in a day 4 sample assessed by NM R, wherein
at least 2, or at
least 5 metabolites of said plurality of metabolites are increased or
decreased relative to the
control as indicated, of the 9 metabolites in Table 40A, or of the 6
metabolites in Table 40B; or
(ii) wherein the likelihood of unfavourable outcome at 12 months is
determined: (cl) in a day 1
sample, assessed by QUANTITATIVE MS, wherein at least 2, at least 5, or at
least 10
metabolites of said plurality of metabolites are increased or decreased
relative to the control as
indicated, of the 21 metabolites in Table 37A or of the 15 metabolites in
Table 37B; or (c2) in a
day 4 sample, assessed by quantitative MS, wherein at least 2, at least 5, or
at least 10
metabolites of said plurality of metabolites are increased or decreased
relative to the control as
- 3 -
CA 03225337 2024- 1-9
WO 2023/279213
PCT/CA2022/051078
indicated, of the 18 metabolites in Table 38A or of the 13 metabolites in
Table 38B; or (dl) in a
day 1 sample assessed by NMR, wherein at least 2, or at least 5 metabolites of
said plurality of
metabolites are increased or decreased relative to the control as indicated,
of the 8 metabolites
in Table 41A, or at least 4 of the 5 metabolites in Table 41B; or (d2) in a
day 4 sample
assessed by NMR, wherein at least 2, or at least 5 metabolites of said
plurality of metabolites
are increased or decreased relative to the control as indicated, of the 9
metabolites in Table
42A, or of the 5 metabolites in Table 42B; or (iii) wherein the likelihood of
mortality outcome is
determined: (el) in a day 1 sample, assessed by quantitative MS, wherein at
least 2, at least
5, or at least 10 metabolites of said plurality of metabolites are increased
or decreased relative
to the control as indicated, of the 19 metabolites in Table 43A or of the 11
metabolites in Table
43B; or (e2) in a day 4 sample, assessed by quantitative MS, wherein at least
2, at least 5, or at
least 10 metabolites of said plurality of metabolites are increased or
decreased relative to the
control as indicated, of the 22 metabolites in Table 44A, or of the 16
metabolites in Table 44B;
or (f1) in a day 1 sample, assessed by NMR, wherein at least 2, at least 5, or
at least 10
metabolites of said plurality of metabolites are increased or decreased
relative to the control as
indicated, of the 17 metabolites in Table 45A, or at least 4 of the 5
metabolites in Table 45B; or
(f2) in a day 4 sample, assessed by NMR, wherein at least 2, or at least 5
metabolites of said
plurality of metabolites are increased or decreased relative to the control as
indicated, of the 16
metabolites in Table 46A, of the 8 metabolites in Table 46B, or at least 2 or
4 of the 5
metabolites in Table 46C.
[0012] The likelihood of unfavorable outcome may be predicted
for three months
following the sTBI, or may be predicted for twelve months following the sTBI.
Further, the
method may be used for a prediction of likelihood of mortality by 3 months.
[0013] The method of any one of claims 1 to 12, wherein sample
is a serum sample, or
may be from blood, plasma, or tissue.
[0014] The control may be a value determined from individuals
with an orthopedic injury
(01) without head injury, or from a cohort of individuals with sTBI having a
favorable outcome,
or other suitable control.
[0015] The method can assess the amount of the plurality of
metabolites are assessed
by NMR, or by a quantitative MS platform, or any other suitable platform or
technology capable
of assessing such metabolites.
[0016] Samples obtained between days 1 and 5 post TBI are
preferred, but later
samples may be utilized. For example, the sample may be obtained at day 1
following the
- 4 -
CA 03225337 2024- 1-9
WO 2023/279213
PCT/CA2022/051078
sTBI, or may be obtained at day 4 following the sTBI. If multiple samples are
obtained, for
example at both days 1 and 4, these may both be utilized in the method
described herein.
[0017] According to an embodiment described herein, the
likelihood of unfavourable
outcome at 3 months may determined by assessing the increase or decrease in
the following
metabolites: (al) in a day 1 sample, assessed by quantitative MS wherein the
metabolites are
increased or decreased as indicated in Table 35A or Table 35B; (a2) in a day 4
sample,
assessed by quantitative MS wherein the metabolites are increased or decreased
as indicated
in Table 36A or Table 36B; (bl) in a day 1 sample, assessed by NMR wherein the
metabolites
are increased or decreased as indicated in Table 39A or Table 39B; or (b2) in
a day 4 sample,
assessed by NMR wherein the metabolites are increased or decreased as
indicated in Table
40A or Table 40B.
[0018] According to an embodiment described herein, the
likelihood of unfavourable
outcome at 12 months may be determined by assessing the increase or decrease
in the
following metabolites: (cl) in a day 1 sample, assessed by quantitative MS
wherein the
metabolites are increased or decreased as indicated in Table 37A or Table 37B;
(c2) in a day 4
sample, assessed by quantitative MS wherein the metabolites are increased or
decreased as
indicated in Table 38A or Table 38B; (dl) in a day 1 sample, assessed by NMR
wherein the
metabolites are increased or decreased as indicated in Table 41A or Table 41B;
or (d2) in a
day 4 sample, assessed by NMR wherein the metabolites are increased or
decreased as
indicated in Table 42A or Table 42B.
[0019] Further, according to an embodiment described herein, the
likelihood of mortality
outcome at 3 months may be determined by assessing the increase or decrease in
the
following metabolites: (el) in a day 1 sample, assessed by quantitative MS
wherein the
metabolites are increased or decreased as indicated in Table 43A or Table 43B;
(e2) in a day 4
sample, assessed by quantitative MS wherein the metabolites are increased or
decreased as
indicated in Table 44A or Table 44B; (fl) in a day 1 sample, assessed by NMR
wherein the
metabolites are increased or decreased as indicated in Table 45A or Table 45B;
or (f2) in a day
4 sample, assessed by NMR wherein the metabolites are increased or decreased
as indicated
in Table 46A, Table 46B, or Table 46C.
[0020] For example, the likelihood of mortality outcome at 3 months is
determined by
assessing the increase or decrease in metabolites: (el) in a day 1 sample,
assessed by
quantitative MS wherein the metabolites are increased or decreased as
indicated in Table 43B;
(e2) in a day 4 sample, assessed by quantitative MS wherein the metabolites
are increased or
decreased as indicated in Table 44B; (fl) in a day 1 sample, assessed by NMR
wherein the
- 5 -
CA 03225337 2024- 1-9
WO 2023/279213
PCT/CA2022/051078
metabolites are increased or decreased as indicated in Table 45B; or (f2) in a
day 4 sample,
assessed by NM R wherein the metabolites are increased or decreased as
indicated in Table
46C.
[0021] There is described herein a kit for predicting outcome of
a traumatic brain injury
in a subject comprising: reagents for detecting the metabolites listed in any
one of Tables 35A,
35B, 36A, 36B, 37A, 37B, 38A, 38B, 39A, 39B, 40A, 40B, 41A, 41B, 42A, 42B,
43A, 43B, 44A,
44B, 45A, 45B, 46A, 46B, and/or 46C, and instructions for conducting any one
of the methods
described herein.
[0022] In a further aspect, there is provided a method of
determining a likelihood of an
unfavourable outcome in a subject having a severe traumatic brain injury
(sTBI), comprising:
obtaining a sample from a subject at day 1 and/or day 4 post sTBI, and
measuring an amount
of a plurality of metabolites in the sample, comparing levels of the plurality
of metabolites in the
sample with a control, such as a control indicative of favourable outcome;
wherein an outcome
of the comparing step is an increase or decrease in quantity of said plurality
of metabolites in
the sample relative to the control, and wherein unfavourable outcome is
determined as likely
when: in the day 1 sample, two or more of the following metabolites are
increased relative to
the control: ornithine, alanine, dimethyl sulfone, carnitine, valine, leucine,
adipate, a-ketoglutaric
acid, homocysteine, and LysoPCs; and two or more of the following metabolites
are decreased
relative to the control: N-acetylaspartate (NAA), pyruvate, mannose,
hydroxyproline, serotonin,
dimethylarginine; and/or in the day 4 sample, two or more of the following
metabolites are
increased relative to the control: dimethyl sulfone, valine, tryptophan,
tyrosine, gluconate, urea,
uric acid, NAA, ornithine, kynurenine, and alanine; and two or more of the
following metabolites
are decreased relative to the control: serotonin, spermine, taurine, p-
hydroxybutyric acid, and
arginine; wherein the unfavourable outcome comprises a Glasgow Outcome Scale
Extended
(GOSE) score < 4 from 3 months to 12 months post sTBI. For example, the
likelihood of said
unfavorable outcome may be determined for a time frame that is three months or
twelve
months following the sTBI.
[0023] A method is described herein for determining a likelihood
of death within three
months in a subject having a severe traumatic brain injury (sTBI), comprising:
obtaining a
sample from a subject at day 1 and/or day 4 post sTBI, measuring an amount of
a plurality of
metabolites in the sample, and comparing levels of the plurality of
metabolites in the sample
with a control, such as a control indicative of survival at 3-months, wherein
an outcome of the
comparing step is an increase or decrease in quantity of said plurality of
metabolites in the
sample relative to the control, and wherein increased likelihood of mortality
is determined when:
- 6 -
CA 03225337 2024- 1-9
WO 2023/279213
PCT/CA2022/051078
in the day 1 sample, a plurality of the following metabolites are increased
relative to the control:
glucose, betaine, 0-phosphocholine, creatine, citrate, dimethyl sulfone
acylcarnitines, methyl
histidine, a-aminoadipic acid and arginine; and a plurality of the following
metabolites are
decreased relative to the control: glutamine, histidine, succinate,
isoleucine, leucine, and valine,
citrulline, homocysteine, and homovanillic acid; and/or in the day 4 sample, a
plurality of the
following metabolites are increased relative to the control: creatine,
isobutyrate,
dimethylsulfone, valine, asparagine, tyrosine indoleacetic acid, a-
ketoglutaric acid, hippuric
acid, acylcarnitines, citric acid, ornithine, threonine, and tryptophan; and a
plurality of the
following metabolites are decreased relative to the control: betaine,
gluconate, taurine,
hypoxanthine, urea, serine, and glutamate, glutamine, creatinine, and
hexanoylcamitine (C6).
[0024] In a further aspect there is provided a method of
determining a likelihood of an
outcome in a subject having a sTBI or suspected of having a sTBI, comprising:
obtaining a
sample from a subject, and measuring an amount of a plurality of metabolites
in the sample;
wherein an outcome is characterized by a change in the amount of the
predictive metabolites
as described herein, such as in Table 5, Table 8 or Table 17.
[0025] In one example, the sample is a serum sample.
[0026] In one example, the amount of said plurality of metabolites is
determined by Proton
nuclear magnetic resonance (1H-NMR) spectroscopy or by tandem mass
spectrometry
(MS/MS), which may be interchangeably referred to herein as quantitative mass
spectrometry,
such as targeted direct injection tandem mass spectrometry and reverse phase
liquid
chromatography tandem mass spectrometry (DI/LC-MS/MS).
[0027] In one example, obtaining of said sample occurs at about
one day or about four
days following the TBI.
[0028] In other examples, said likelihood of said unfavorable
outcome is evaluated at
about three months or about 12 months.
[0029] In one example, the subject is a human.
[0030] In one aspect there is provided a kit for carrying out
characterization of CRC
disease in a mammal which comprises two or more reference metabolites selected
from the
listing of predictive metabolites as provided herein such as in Table 5, Table
8 or Table 17,
wherein the reference metabolites are individually packed in the kit. A
reference metabolite for
each of the different metabolites listed in herein may be used. Optionally,
reference
metabolites in such a kit may be labelled, for example isotopically.
Derivatization reagents or
labeling reagents may be included in the kit.
- 7 -
CA 03225337 2024- 1-9
WO 2023/279213
PCT/CA2022/051078
BRIEF DESCRIPTION OF THE DRAWINGS
[0031] Embodiments of the present disclosure will now be
described, by way of
example only, with reference to the attached Figures.
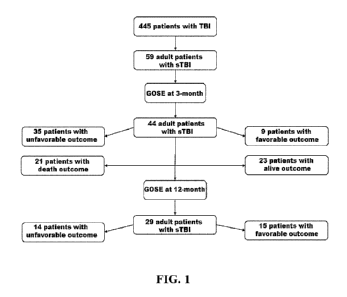
[0032] Figure 1 is a diagram of the patient flow chart showing
patient selection at
baseline, and patients with measured GOSE outcome at 3 and 12 months.
[0033] Figures 2A-2E show PLS-DA scatter plots: discrimination
models show high
predictive (02) separation of patients with unfavorable outcome (0) from
favorable outcome
(=) based on serum metabolomic profiling on day 4 and GOSE at 3 months, Figure
2A: DI-
MS/MS using 54 metabolites, Figure 2B: 1H-NMR using 26 metabolites. The high
predictability
is visualized by a good separation between the two cohorts and yielding a Q2>
0.5. The model
metrics for the day 4 DI-MS/MS model and GOSE at 3 months are R2Y=0.81,
02Y=0.61 and
p=5.4 x10⁻⁵ and for day 4 1H-NMR and GOSE at 3-month is R2Y=0.75, Q2Y=0.52 and
p=0.006.
The metabolic profile on day 4 serum samples analyzed using DI-MS/MS was more
predictive
(Q2= 0.61) than 1H-NMR (Q2=0.52). GOSE at 12-months, Figure 2C: DI-MS/MS using
only 31
metabolites, Figure 2D: 1H-NMR using only 18 metabolites. The metabolic
profile on day 4
serum samples analyzed using DI-MS/MS was more predictive (Q2= 0.63) than 1H-
NMR
(02=0.45). Mortality outcome at 3 months: non-survivor (0) vs survivor outcome
( =), Figure
2E: DI-MS/MS using 31 metabolites, 02=0.57. Figure 2F: 1H-NMR using 17
metabolites. Q2=
0.44. These Q2 values show a high predictability of metabolic profile on day 4
with DI-MS/MS
being better than 1H-NMR to predict mortality at 3-months.
[0034] Figure 3 is a chart illustrating typical patient age
distribution of sTBI (Shapiro-
VVilk W= .94312. p= 0.00000).
[0035] Figure 4A and Figure 4B show MS/MS data of prognosis of
GOS-E 12 months
for poor outcome versus good outcome based on sTBI Day 1 and Day 4
metabolites,
respectively.
[0036] Figure 5A and Figure 5B show NMR data of prognosis of GOS-
E 12 months for
poor outcome versus good outcome based on sTBI Day 1 and Day 4 metabolites,
respectively.
[0037] Figure 6A and Figure 6B show MS/MS data of prognosis of
mortality and
vegetative state for GOS-E 1&2 versus GOS-E 3-8 based on sTBI Day 1 and Day 4
metabolites, respectively.
[0038] Figure 7A and Figure 7B show NMR data of prognosis of
mortality and
vegetative state for GOS-E 1&2 versus GOS-E 3-8 based on sTBI Day 1 and Day 4
metabolites, respectively.
- 8 -
CA 03225337 2024- 1-9
WO 2023/279213
PCT/CA2022/051078
[0039] Figure 8A and Figure 8B provide predictor screening
analysis, showing the
importance of clinical variables in the prediction models for the prognosis of
GOSE outcome at
3 months and 12 months using DI/LC-MS/MS data. These figures present the
ranking of
metabolites and clinical variables in each prediction model.
DETAILED DESCRIPTION
[0040] Generally, the present disclosure provides a method of
determining a likelihood
of a favourable or unfavourable outcome in a subject having traumatic brain
injury (TBI) or
suspected of having TBI, specifically a severe traumatic brain injury (sTBI).
[0041] The term "subject" or "patient" or "individual", as used
herein, refers to a
eukaryote. A biological sample is typically obtained from a eukaryotic
organism including, but
not limited to, mammals. Mammalian subjects include, but are not limited to,
primates such as
a human; non-human primates including chimpanzees and the like; livestock,
including but not
limited to, cows sheep, pigs, and the like; companion animals, including but
not limited to, dogs,
cats, horses, rabbits, rodents including mice and rats, and the like.
[0042] In a specific example, the subject is a human.
[0043] The term "sample" or "biological sample" as used herein,
encompasses a variety
of cells, cell-containing bodily fluids, bodily fluids, and/or secretions as
well as tissues including,
but not limited to a cell(s), tissue, whole blood, blood-derived cells,
plasma, serum, sputum,
mucous, bodily discharge, and combinations thereof, and the like. Biological
samples may
include, but are not limited to, tissue and/or fluid isolated from a subject.
Biological samples
may also include sections of tissues such as biopsy and autopsy samples,
formalin-fixed
paraffin-embedded (FFPE) samples, frozen sections taken for histologic
purposes, blood and
blood fractions or products (e.g., serum, plasma, platelets, red blood cells,
white blood cells and
the like), sputum, stool, tears, mucus, hair, and skin. Biological samples
also include explants
and primary and/or transformed cell cultures derived from animal or patient
tissues.
[0044] In certain examples, biological samples may also be
blood, a blood fraction,
urine, effusions, ascitic fluid, saliva, cerebrospinal fluid, cervical
secretions, vaginal secretions,
endometrial secretions, gastrointestinal secretions, bronchial secretions,
sputum, cell line,
tissue sample, or secretions from the breast.
[0045] In a specific example, a biological sample is a blood samples, or a
blood
fraction.
[0046] In a specific example, the biological sample is a serum
sample.
[0047] A sample may be obtained from a subject.
- 9 -
CA 03225337 2024- 1-9
WO 2023/279213
PCT/CA2022/051078
[0048] As used herein, "obtaining a sample" or "obtaining a
biological sample" refers to
methods as will be well known to the skilled worker. A biological sample may
be obtained
directly or indirectly from the subject. The term "obtaining" a biological
sample may comprise
receiving a biological sample from an agent acting on behalf of the subject.
For example,
receiving a biological sample from a doctor, nurse, hospital, medical center,
etc., either directly
or indirectly, e.g. via a courier or postal service. In some cases the
biological sample is
obtained from archival repositories. In one example, the methods of the
invention are carried
out in vitro or ex vivo.
[0049] For example, a blood sample, such as a peripheral blood
sample, may be
collected using venipuncture.
[0050] A biological sample can be collected on more than one
occasion.
[0051] The term "determining the likelihood" and "prediction" as
used herein, refers to
providing a measure of relative risk for developing an outcome, such as a
favourable or
unfavourable outcome from TBI in a subject.
[0052] The term "providing a prognosis", as used herein, refers to
providing a prediction
of the probable course and outcome of TBI in a subject.
[0053] The term "diagnosis", as used herein, refers to detecting
a favourable or
unfavourable outcome in a subject having TBI or at risk of TBI. It will be
appreciated that
typically any method of diagnosis includes false positives and false
negatives. Accordingly, it is
typical that a method of diagnosis does not necessarily provide 100% accuracy.
[0054] The term "traumatic brain injury" (TBI, and sTBI), as
used herein, refers to a
brain injury resulting from direct or indirect shock load or loads applied to
the brain. The direct
or indirect shock load or lads may cause the brain to move rapidly and
unnaturally within a
patient's skull. TBI includes, but not be limited to, brain injuries caused
by: (a) objects
penetrating the skull, such as, bullets, arrows, and other physical objects
which pass through
the skull and enter the brain, (b) impact loads applied to the head or other
portions of the
patient's body, (c) surgically induced trauma, (d) explosions, such as might
exist in warfare,
through impacting of grenades, bombs, and other explosives, which cause
substantial tremors
in the earth in relatively-close proximity to where an individual is standing,
as well as similar
tremors created by nonexplosive means, such as vehicular accidents, collapse
of buildings and
earthquakes, for example.
[0055] A traumatic brain injury may be categorized as severe
traumatic brain injury
(herein "sTBI"), the severity of which is a relative term based on GOSE score
or other clinical
parameters.
- 10 -
CA 03225337 2024- 1-9
WO 2023/279213
PCT/CA2022/051078
[0056] The term "normal patient(s)", or "control patient(s)", as
used herein, refers to a
patient without TBI, preferably matched for age and sex.
[0057] TBI outcome in a subject may be assessed using the
Glasgow Coma Scale
(GCS), and/or the Glasgow Outcome Scale Extended (GOSE).
[0058] In specific examples described and used herein, the primary outcome
was
Glasgow Outcome Scale Extended (GOSE) measured at 3 and 12 months post injury.
GOSE
1-4 and GOSE 5-8 were considered as unfavorable and favorable outcomes,
respectively.
Another primary outcome was mortality at 3 months.
[0059] In some examples, the methods described herein may
involve measuring a
sample from a subject, such as a serum sample.
[0060] In some examples, the methods herein may involve
determining if a patient
having a TBI or suspected of having a TBI will have a favourable or
unfavourable outcome.
[0061] In some example, a subject is assessed at about one (1)
day and four (4) days
following a TBI, or suspect TBI.
[0062] In some examples, a serum metabolite signature (which may also be
referred to
as a biosignature) may be used for the prognosis of GOSE outcome at 3 and 12
months and
the mortality outcome at 3 months.
[0063] A metabolite signature (i.e., a population of cellular
metabolites) differentially
produced by TBI subject samples, such as serum, may provide a reliable
diagnostic marker for
determining a likelihood of a favourable outcome or unfavourable outcome.
[0064] The term "metabolite", "cellular metabolite" or the
plural form, "cellular
metabolites," as used herein refers to any molecule or mass feature in the
range of about 10
Da!tons to about 1500 Da!tons secreted by a cell and present in a tissue
sample or biological
fluid. A cellular metabolite may include but is not limited to the following
types of molecules:
acids, bases, lipids, sugars, glycosides, amines, organic acids, lipids, amino
acids, oximes,
esters, dipeptides, tripeptides, fatty acids, cholesterols, oxysterols,
glycerols, steroids, and/or
hormones.
[0065] In one example, the metabolite is
lysophosphatidylcholines (lysoPCs) and fatty
acids such as propionic acid, stearic acid, oleic acid, linoleic acid,
myristic acid as well as
branched-chain and aromatic amino acids.
[0066] The phrases "identifying one or a plurality of cellular
metabolites . . . differentially
produced" and "differentially produces" as used herein include but are not
limited to
comparisons of cells, or tissues, or fluids, from a subject with TBI with
cells or tissues from non-
TBI subject.
- 11 -
CA 03225337 2024- 1-9
WO 2023/279213
PCT/CA2022/051078
[0067] Detection or measurement of variations in metabolite
populations or mass
features between TBI and non-TBI control samples are included in this
definition.
[0068] In some examples, alterations in production of various
metabolites are measured
by determining a profile of changes in metabolite molecules in TBI versus
control samples.
[0069] The term "physical separation method" as used herein refers to any
method
known to those with skill in the art sufficient to detect a profile of changes
and differences in
metabolites produced in the tissue or fluid (e.g., serum, lateral cerebellum,
and post vermis
brain, cerebrospinal fluid, blood, or plasma) of TBI subject.
[0070] In some examples, physical separation methods permit
detection of cellular
metabolites including but not limited to sugars, organic acids, amino acids,
fatty acids,
hormones, vitamins, and peptides, as well as ionic fragments thereof and other
cellular
metabolites (for example, having a molecular weight less than 3000 Da!tons,
more particularly
between 10 and 1500 Da!tons, and even more particularly between 100 and 1000
Da!tons).
[0071] In some examples, proton nuclear magnetic resonance (1H-
NMR) spectroscopy
and/or tandem MS (MS/MS), such as targeted direct injection tandem mass
spectrometry (DI-
MS/MS) or DI/LC-MS/MS, were applied to identify and quantify metabolites in
the serum
samples.
[0072] Metabolites can be identified using their exact molecular
mass, as well as mass
spectrometry fragmentation patterns of the metabolites.
[0073] It will be understood that cellular metabolites as set forth herein
can be detected
using alternative spectrometry methods or other methods known in the art for
analyzing these
types of cellular compounds in this size range.
[0074] The term "diagnostic" means identifying the presence or
nature of a pathologic
condition. Diagnostic methods differ in their sensitivity and specificity. The
"sensitivity" of a
diagnostic assay is the percentage of diseased individuals who test positive
(percent of "true
positives").
[0075] The term "detect" refers to identifying the presence,
absence or amount of the
object to be detected.
[0076] The term "diagnosis" refers to determination of a
pathologic state.
[0077] Method of the invention are conveniently practiced by providing the
compounds
and/or compositions used in such method in the form of a kit. Such kit
preferably contains the
composition. Such a kit preferably contains instructions for the use thereof.
[0078] EXAMPLES
- 12 -
CA 03225337 2024- 1-9
WO 2023/279213
PCT/CA2022/051078
[0079] To gain a better understanding of the invention described
herein, the following
examples are set forth. It should be understood that these examples are for
illustrative
purposes only. Therefore, they should not limit the scope of this invention in
anyway.
[0080] Example 1
[0081] Serum-based metabolomics improve prognosis of outcome in sTBI
[0082] SUMMARY
[0083] This example was set up to address the question of
whether serum-based
metabolomics can improve the prognosis of outcome among adult patients with a
sever
traumatic brain injury (sTBI). It was found that in a prospective cohort study
that included 59
adult patients with sTBI, serum metabolomics profiling on days 1 and 4 post-
injury was
associated with the prognosis of GOSE outcome in a highly predictive (02>0.5)
and accurate
(AUC>0.99) manner as well as being highly predictive of mortality. These
findings indicate that
metabolomics profiling on serum can be used for the prognosis of GOSE outcome
in adult
patients with sTBI at 3 and 12 months post injury and can help predict
mortality at 3 months.
[0084] Importance. The prediction of outcomes and disease stratification
are key
problems for the management of sTBI. Currently clinical assessment and
neuroimaging are the
most reliable techniques for the prognosis of TBI, however, they are
insufficiently sensitive and
specific to adequately prognosticate outcome in sTBI.
[0085] Objectives. This Example is designed to determine whether
the alteration of
metabolites and metabolomics pattern in serum samples of sTBI in adult cohorts
are associated
with the prognosis of GOSE outcome.
[0086] Design. This study was carried out with the patients who
met the clinical criteria
for TBI, who were enrolled in the Canada TBI (CanTBI) platform.
[0087] Setting. This study was performed as a multicenter cohort
study.
[0088] Participants. All enrolled patients were admitted to critical care
units, and/or
emergency departments and/or assessed in concussion clinics at 3 participating
centers. In the
adult arm, subjects were included if they had severe TBI (GCS with CT
evidence of head
injury) and were years of age. Exclusion criteria consisted of any
neurodevelopmental
disorder pre-injury and/or an ongoing neurologic deficit from a previous head
injury.
[0089] Main Outcome(s) and Measure(s). The primary outcome was Glasgow
Outcome Scale Extended (GOSE) measured at 3 and 12 months post injury. GOSE 1-
4 and
GOSE 5-8 were considered as unfavorable and favorable outcomes, respectively.
Another
primary outcome was mortality at 3 months.
- 13 -
CA 03225337 2024- 1-9
WO 2023/279213
PCT/CA2022/051078
[0090] Results. Fifty-nine patients with sTBI were recruited and
outcomes were
measured at 3 and 12 months. Serum metabolic profiles were measured (including
lipids) on
days 1 and 4 post-injury and were found to be highly predictive (02>0.4) and
highly accurate
(AUC>0.99) to predict GOSE outcome at 3 and 12 months post-injury and
mortality at 3
months. The metabolic profiles on day 4 were more predictive (Q2>0.55) than
those measured
on day 1 post-injury. Increased lysophosphatidylcholines, acylcarnitines,
energy-related
metabolites (glucose, lactate), aromatic amino acids and glutamate were
associated with poor
outcome and mortality.
[0091] Conclusions and Relevance. It was demonstrated that
metabolomic profiles
are strongly associated with prognosis of GOSE outcome at 3 and 12 months and
mortality
following sTBI in adults. The current findings strongly suggest that serum
metabolomics can be
more helpful than clinical data in determining prognosis in adults with sTBI
in the early days
post-injury. These findings clearly indicate utility in sTBI clinical
management.
[0092] INTRODUCTION
[0093] In this Example, it was hypothesized that serum metabolites (or
"metabolomic
biosignatures") would be associated with favorable and unfavorable outcomes at
3 and 12
months and be associated with mortality in adults with sTBI. Our objectives
were to measure
metabolites in serum sampled at 1 and 4 days following severe TBI and
determine if these
metabolomic biomarkers significantly improve prognostic models using
demographics, clinical
factors, and CT findings to predict long-term outcomes. The study design of
this Example tests
whether the serum metabolites observed at day 1 and day 4 post-TBI allows
prediction of
outcome at 3 and/or 12 months post sTBI.
[0094] TB! Classification. Classification of TBI is based on severity,
mechanisms or structural
damage and pathophysiology. The following classifications are in place:
Severity is generally
indicated using Glasgow Coma Scale or "GCS" (ranging from 3-15): Mild (GCS 13-
15);
Moderate (GCS 9-13); Severe (GCS 3-8). Mechanism classification may be:
primary or
secondary injury. Structural classification may be: focal, diffuse or
multifocal.
[0095] The importance of TBI in society is evidenced by the consequences of
TBI, which are
sizeable in both patients individual lives and economic terms. TBI is a
leading cause of death
and disability in people younger than 35 years of age and is increasing in the
elderly. The
prevalence: of TBI may be about 50 million cases worldwide. sTBI survivors
usually exhibit
lifelong disabilities involving both motor and cognitive domains. Annual costs
of $76.5 billion in
direct medical services and loss of productivity (indirect costs) have been
estimated.
Management of TBI is challenging. Mild TBI can be difficult to diagnose, while
for severe TBI, it
- 14 -
CA 03225337 2024- 1-9
WO 2023/279213
PCT/CA2022/051078
is often difficult to predict outcome, so as to guide not only clinical
decisions but also personal
decisions for the individual and family involved.
[0096] MATERIALS AND METHODS
[0097] Patients' Characteristics and Primary Clinical
Information. In this
prospective and multicenter cohort study, the patients who met the clinical
criteria for TBI were
enrolled in the CanTBI platform after informed consent was obtained from the
patient or legal
surrogate. Serum samples were collected and handled according to the CanTBI
SOPs into 4
Canadian tissue banks. Samples were obtained at different days post-injury,
while samples
collected on days 1 and 4 post-injury from patients with sTBI were used in the
current study.
Extended Glasgow Outcome Scale (GOSE) was obtained using structured telephone
interviews
for the individual (or surrogate) at 3 and 12 months post-injury12. A
dichotomized GOSE
approach 13'14 was used to predict favorably (GOSE 5-8) and unfavorable (GOSE
1-4)
outcomes.
[0098] The CanTBI Platform is a National biobank and database for patients
with traumatic
brain injury (TBI) in Canada. This platform is designed to collect data and
samples from TBI
patients across Canada. As of 2021, data and samples from about 450 patients
have been
entered. Clinical Data, imaging and biosamples are collected for analysis.
This is a source of
patient samples and information as utilized herein.
[0099] Outcome measures commonly used in TBI assessment include: (1) Glasgow
Outcome
Scale Extended (GOS-E), which may be referenced herein interchangeably as
"GOSE", "GOS-
E", or GOSe; (2) Quality of Life After Brain Injury (Q0LI BRIT"); and (3)
Pediatrics Quality of Life
After Brain Injury (PedsQLTm).
[00100] Figure 1 is a diagram of the patient flow chart used for
patient selection at
baseline, and patients with measured GOSE outcome at 3 and 12 months.
[00101] Metabolomics Profiling, Quantification of Metabolites. Proton
nuclear
magnetic resonance (1 H-NM R) spectroscopy and tandem mass spectrometry
(MS/MS) were
applied to identify and quantify metabolites in the serum samples at days 1
and 4 post sTBI.
These two techniques were used to quantify a broad list of metabolites with
few overlapping
metabolites. A comprehensive targeted analysis of 130 and 58 metabolites was
carried out
using MS/MS and 1H-NMR, respectively, in the serum-based metabolic profiles of
sTBI patients
at days 1 and 4 post-injury.
[00102] Data and Statistical Analysis. For the prognosis of sTBI
outcome, prediction
models were developed using multivariate statistical analysis (MVA) and
machine learning to
separate sTBI patients with unfavorable outcomes from sTBI patients with
favorable outcomes
- 15 -
CA 03225337 2024- 1-9
WO 2023/279213
PCT/CA2022/051078
based on the serum metabolite profiles on days 1 and 4 post injury. In the
MVA, principal
component analysis (PCA) was carried out to examine the variability and trends
of metabolic
profiles among samples and partial least squares discriminant analysis (PLS-
DA), a type of
machine learning method was used to build prediction models 15 The prediction
models were
created using the most differentiating metabolites with a variable important
of the projection
(VIP) value >1Ø SIMCA-P v15Ø2 (Sartorius Stedim Biotech, Unnea, Sweden)
was used for
the PLS-DA analysis. It was further analyzed whether clinical predictors or
combining clinical
predictors with the metabolomics data yielded a superior model to predict GOSE
outcome.
Statically inspired modification of partial least square (SIMPLS), an
algorithm of the PLS
method suitable for both nominal or continuous variables, was performed to
develop prediction
models using only clinical predictors or combined clinical with metabolites
variables for the
GOSE prognosis at 3 months, 12 months and for mortality_ Developed
prognostication models
were characterized by the metrics R2 (goodness of model fit), Q2 (goodness of
prediction),
cross-validation p-value and permutation testing (200 times). Artificial
Neural Network analysis
(ANN) was performed to predict one response variable (unfavorable and/or
favorable
separately) using a flexible function of the input variables. JMP Pro 14.3.0
(SAS Institute Inc.
USA) was used for SIMPLS and ANN analysis. MetaboAnalyst 4.0 (freeware
available at
www.metaboanalyst.ca) was used for multivariate and univariate analysis. AUC,
sensitivity, and
specificity were obtained using a multivariate approach included in each
software package.
[00103] The data analysis of metabolomics, clinical data and combination of
both for the
predicting 3 and 12-month GOSE outcome was assessed using: Partial Least
Squares-
Discriminate Analysis (PLS-DA, also known as projection to latent structures)-
based
metabolomics prediction models obtained using SIMCA-P software were compared
to
Straightforward Implementation of a statistically inspired Modification to PLS
(SIMPLS)-based
metabolomics prediction models obtained using JMP software. SIMPLS-DA can be
better for
integer-related data whereas PLS-DA is better for continuous variables.
[00104] To choose the most differentiating metabolites, a
Variable Importance of
Projection (VIP) >1.0 approach was used for the PLS-DA and SIMPLS data. 02
(goodness of
model prediction) and R2 (goodness of model fit) are presented in cumulative
form, consistent
between the two PLS-DA and SIMPLS methods. All PLS-DA and SIMPLS prediction
models
use two components. Two components approach was used for clinical-based
prediction
models.
[00105] Two analytical platforms were assessed: Nuclear Magnetic
Resonance
Spectroscopy (NM R) and Direct Infusion Tandem Mass Spectroscopy (DI-MS/MS).
To
- 16 -
CA 03225337 2024- 1-9
WO 2023/279213
PCT/CA2022/051078
compare and contrast these two analytical platforms, data was compared. In
general, NMR is
known for reproducibility, and quantitative strengths. In general DI-MS/MS is
known for the
strengths of targeted quantitative analysis and the inclusion of lipid
quantification in the
analysis. Different metabolites were assessed, with 58 metabolites being
assessed in NMR,
and 130 metabolites (including 70 lipids) being assessed in DI-MS/MS. NMR
metabolite
analysis includes amino acids and sugars. DI-MS/MS analysis includes
phosphatidylcholines,
lysophosphatidylcholines, acylcarnitines, amino acids and amino acid
derivatives.
[00106] RESULTS
[00107] sTBI Patient Characteristics. Out of the 445 adult and
pediatric patients with
TBI enrolled in the CanTBI platform, 59 (13.2%) patients with sTBI were
diagnosed and
enrolled in the current metabolomics study. The sTBI cohort included 48 males
and 11 females
with a mean age of 50 y ( SD, 20.6). Figure 1 shows the patient flow chart
and patients
selection with measured GOSE at 3 and 12 months post-injury. Tables 1 and 2
summarize the
distribution and description of the patients' demographics, clinical
information, GCS, GOSE and
CT findings of the cohort with sTBI and patients with unfavorable outcome
(GOSE 1-4) and
patients with favorable outcome (GOSE 5-8) at 3 and 12 month, respectively. Of
note, the table
shows that the age and injury severity score (ISS) have a significantly
positive correlation with
the prognosis of the unfavorable outcome at 3 months. There was a significant
difference in
age and ISS between patients who died with sTBI (GOSE 1) (n=21) and those who
survived
sTBI (GOSE 3) (n=23) at 3 months (Table Si), with older age and higher injury
severity score
associated with unfavorable outcome. Predictive partition analysis determined
the cut-off value
for ISS 75 and age 49 for the separation of non-survival vs survival at 3
months. The data
also suggested a cut-off value for the Marshall score=4 and GCS=6 between non-
survivors and
survivors, although these two variables were not statistically significantly
different between the
two cohorts.
[00108] Identified, Quantified Metabolites. 130 and 58
metabolites from different
metabolite classes were identified and quantified using targeted DI-MS/MS and
untargeted 1H-
NMR, respectively. Most of the common metabolites (24 of 30) had a similar
trend of change,
showing the accuracy of both techniques.
[00109] Metabolomics for the Prognosis of 3 and 12 Months Outcomes of sTBI.
[00110] Prediction models showed that a serum metabolic
biosignature can be used for
the prognosis of GOSE outcome at 3 and 12 months and the mortality outcome at
3 months.
[00111] Using PCA, a high level of variability (R2X>0.5) was
obtained in the metabolic
biosignature between cohorts with different outcomes, implying a considerable
impact of head
- 17 -
CA 03225337 2024- 1-9
WO 2023/279213
PCT/CA2022/051078
injury on serum metabolic profiles on days 1 and 4 post-injury (Fig S3-S5).
The observed
metabolic variability was phenotypically characterized to visualize more
clearly the grouping
between the unfavorable vs. favorable GOSE and non-survivor vs. survivor
outcomes on day 4
compared to day 1 post-injury for both DI-MS/MS and for 1H-NMR. The prognosis
of sTBI
outcomes was remarkably strong to distinguish the patients with the
unfavorable outcome from
patients with favorable outcome and non-survivor vs survivor outcomes based on
metabolic
biosignatures on day 4 (metabolites included lipid compounds) obtained by DI-
MS/MS. The
prediction models proved to be highly predictive (Q2>0.5) and highly
significant (p-value
<0.0001) (see Table 3 and Figures 2A, 2C, 2E). Importantly, prediction models
revealed that
metabolic biosignatures on day 4 post-injury were significant predictors for
GOSE outcomes
using the two metabolomics analytical platforms (Figures 2B, 20, 2F). All
prediction models
were highly sensitive, specific (>99%) and highly predictive (AUC >0_99)
(Table 3) The validity
of the prediction models were verified using permutation analysis (200 times
permuted, data
not shown) strongly confirming that the models are valid and have not been
overfit. Artificial
neural network analysis (ANN) revealed that the prognosis of the unfavorable
GOSE outcome
was more predictable at 3 months and favorable GOSE outcome showed higher
predictability
at 12 months, (AUC>0.90) respectively. This is illustrated in DI-MS/MS data of
day 4.
[00112] Characterization of Metabolite Biosignature for the
Prognosis of GOSE
Outcome. Further investigation showed that a highly predictive (Q2>0.5) and a
high AUC
(>0.99) was obtained for a list of metabolites (n= 22-56) for the prognosis of
sTBI outcome. For
the model, if one considers using a decrease in the number of DI-MS/MS
metabolites it was
associated with less predictability (02>0.4) and AUC (>0.90) but there is a
still an acceptable
model for prediction of outcome. A further decrease in the number of
metabolite numbers have
lower sensitivity, specificity (<80%), and AUC (0.80). Overall, the metabolite
biosignature for
patients with unfavorable outcomes were characterized by increased
lysophosphatidylcholines
(lysoPCs) and fatty acids such as propionic acid, stearic acid, oleic acid,
linoleic acid, myristic
acid as well as branched-chain and aromatic amino acids.
[00113] Clinical Variables for the Prognosis of GOSE Outcome at 3
Months and 12
Months and Mortality at 3 Months. It was investigated whether clinical
variables could predict
the outcome of sTBI at 3 and 12 months post sTBI. The variables included
gender, age, GCS,
ISS (injury severity score), intubation, hypoxemia, hypotension, loss of
consciousness and
Marshall score for the prediction of GOSE outcome at 3 and 12 months, and for
mortality at 3
months. Individual CT findings were not used in the prediction models as the
Marshall score
showed similar predictability to CT findings for the prognosis of outcome in
the adult cohort
- 18 -
CA 03225337 2024- 1-9
WO 2023/279213
PCT/CA2022/051078
(unpublished data from CanTBI investigators). Depending on the number of
patients evaluated
for 3 and 12 month outcomes, the SIMPLS method revealed age, ISS, Marshall
score and
hypoxemia were the most differentiating clinical variables (VIP>1.0) for
predicting 3 month
GOSE outcome (unfavorable vs favorable). Also, age, GCS, hypoxemia, and loss
consciousness were the most differentiating variables (VIP >1.0) for
predicting 12 month
unfavorable vs favorable GOSE outcome. Despite identifying these
differentiating clinical
variables, the clinical variables had low prediction capacity (Q2<0.16) and
less sensitivity and
specificity (66%-86%) to predict the outcome at 3 and 12 months compared to
metabolomics
data (Table S9). SIMPLS analysis of the clinical data revealed that the age
and severity of
illness score (ISS) are useful predictors (Q2= 0.37, AUC= 0.86) for the
prognosis of mortality.
However, these clinical variables lack significant sensitivity and specificity
(66%-83%)
compared to metabolomics data
[00114] The Combination of Metabolomics and Clinical Variable for
the Predicting
GOSE Outcome at 3 Months and 12 Months Post-Injury. Using SIMPLS analysis, it
was
demonstrated that the clinical features cannot significantly improve the
performance of
metabolomics-based prediction models for the prognosis of GOSE outcome at 3
months and
mortality, however, clinical features were found to minimally improve the
model for GOSE
prognosis at 12 months. For the sTBI cohort, predictor screening analysis
demonstrated that
age could be considered as the most important clinical predictor of outcome,
with a high level of
contribution to almost all outcome prediction models, particularly for
mortality, in association
with other important metabolites followed by Marshall score (3 months outcome)
and GCS (12
months outcome). Although SIMPLS and PLS-DA use different algorithms for
determining
prediction models, the two approaches showed overall similar predictabilities
when metabolites
were used for the prognosis sTBI outcomes, with only slight differences.
Importantly,
permutation tests (data not shown) verified the predictabilities of metabolite-
based prediction
models.
[00115] Table 1 shows the clinical data of patient
characteristics and categorization for
n=59 patients having severe traumatic brain injury (sTBI). The patients
enrolled were 59 adult
sTBI patients from across Canada (GOSE 3 months n=44; GOSE 12 months n=29).
Serum
was collected on day 1 (to reflect primary injury, n=59) and on day 4 post-
sTBI (as a reflection
of possible secondary injury, n=44). Age-matched and sex-matched orthopedic
injury (01)
controls without head injury were also enrolled, with samples from University
of British
Columbia (Vancouver, Canada). Day 1 serum samples were collected from 01
controls.
Patients' characteristics, clinical information, GCS at admission, GOSE
outcome distribution,
- 19 -
CA 03225337 2024- 1-9
WO 2023/279213 PCT/CA2022/051078
CT findings, and Marshall score are shown. In Table 1, "*" indicates the
number of patients
with the clinical information and the percentage of total patients, others
included without clinical
information, and missing information; " ** " indicates the number of patients
(percentage of total)
were included in the same GCS categorized level; " t " indicates the number of
patients with
GOSE data at the same time; and "t t" indicates the number of patients that
had the same CT
findings; the rest may include patients without CT findings or findings
missing in the study.
Table 1
Patient Characteristics and Categorization
Patients Characteristics Subcategory/unit n = 59 severe
TB!
Sex Male/Female 48/11
Age Mean ( SD) 50 20.6
Weight Mean ( SD) 82 19.0
Admission type n (%)
ER 19 (32.3)
ICU 40 (67.7)
Severity (!SS) Mean ( SD) 43.3 19
Intubated Yes (%)* 40 (67.7)
Hypoxia Yes (%)* 8 (13.5)
Hypotension Yes (%)* 9 (15.2)
Paralytic agent Yes (%)* 30 (50.8)
Loss of Consciousness Yes (%)* 40 (67.7)
GCS (total) Mean ( SD) 5.46 2.27
GCS-Motor 2.87 2.07
GCS-Eye 1.54 + 1.02
GCS-Verbal 0.98 0.71
GCS (categorized) n (%)**
GCS 3-4 26 (44)
GCS 5-6 6 (6.7)
GCS 7-8 26 (44)
GOSE
3-month 44 (74.5)
Poor 35 (59.3)
Good 9(15.2)
6-month n (%)t 22 (37.2)
Poor 9(15.2)
Good 13 (22)
12-month 29 (49.7)
Poor 14 (23.7)
Good 15 (25.4)
GOSE 1 & 2 (3 month) n (%) 21 (35.5)
CT Findings (Yes/No) tt
Diffuse Axonal Injury 35/7
Mild Shift 14/26
Skull Fracture 28/14
- 20 -
CA 03225337 2024- 1-9
WO 2023/279213
PCT/CA2022/051078
Cerebral Edema 10/32
Contusion 18/24
Intracranial Hemorrhage 26/16
Epidural Hemorrhage 5/37
Subdural Hemorrhage 30/12
Arachnoid Hemorrhage 32/10
Marshall Score n (%)
1(2.3)
II 23 (54.7)
III 6(14.2)
IV 5(11.9)
V 7(16.6)
[00116] Table 2 shows data obtained regarding prognosis of GOSE
outcome at 3 and 12
months. Patient demographics and clinical characteristics for unfavorable
(GOSE 1-4) and
favorable (GOSE 5-8) outcome groups at 3 and 12 months are shown. In Table 2,
indicates the variables are based on the number of patients; " t " indicates
that data includes
several variables that have not been shown in detail for each cohort. There
was no significant
difference for any type and location of injury between cohorts with favorable
and unfavorable
outcome at 3 and 12 months post injury.
Table 2
Patient Demographics and Prognosis of GOS-E Outcome at 3 and 12 Months
Prognosis of GOSE 3 Month 12 Month
outcome
Patients Characteristics Poor Good p Poor Good
and clinical information Outcome Outcome value Outcome
Outcome value
(n=35) (n=9) (n=14)
(n=15)
Sex (Male/Female) 30/5 6/3 0.42 11/3 13/2
0.82
Age (mean SD) 55.4 40.5 0.03 52.0 18.7
38 19.8 0.06
20.4 21.0
Weight (mean SD) 88.5 76.4 0.08 81.7 22.6
79.3 16.1 0.75
19.5 21.1
Injury Severity Score (ISS) 56.4 35.1 <0.0 35.5 12.5
36.4 12.5 0.81
(mean SD) 22.6 12.6 1
Admission-type 13 2 (22.2%) 0.36 4
(28.5%) 4 (26.6%) 0.58
ER (37.1%) 7(77.7%) 10 (71.4%)
11(73.3%)
ICU 21(60%)
Hypoxia (Yes/No)* 8/22 0/9 0.07 3/8 1/14
0.38
Intubated (Yes/No)* 21/13 7/2 0.61 11/3 10/5
0.77
Hypotension (Yes/No)* 5/25 1/7 0.98 2/10 2/13
0.64
- 21 -
CA 03225337 2024- 1-9
WO 2023/279213
PCT/CA2022/051078
Paralytic-AGT (Yes/No)* 16/17 6/1 0.40 6/7
9/4 0.32
Loss Consciousness* 25/4 5/2 0.30 13/0
8/2 0.48
Location of Injury t 0.70
0.52
Type of Injury t 0.24
0.21
GCS (total) (mean + SD) 5.3 + 2.17 5.3 + 2.5 0.95
4.5+ 1.9 5.8 + 2.3 0.11
GCS-Motor 2.9 1.9 2.4 + 2.2 0.54 2.28 + 2.0
2.7 + 2.1 0.57
GCS-Eye (mean + 1.5 + 1.1 1.0 + 0.0 0.14
1.4 + 0.99 1.6 + 1.3 0.68
SD) 1.0 + 0.75 1.1 0.78 0.94 0.71 + 0.48 1.13 + 0.74
0.08
GCS-Verbal
GCS 3-4 15 5 (55.5%) 0.80 9 (64.2%)
6 (40%) 0.62
GCS 5-6 (mean (42.5%) 0
1(7.1%) 1(6.6%)
SD) 6 (14.1%) 4 (44.4%) 4 (28.5%)
8 (53.3%)
GCS 7-8 14 (40%)
CT Findings** 5/20 0/7 0.57 2/7
2/11 0.62
Diffuse Axonal Injury 6/18 4/3 0.41 4/4
6/7 0.16
Mid Shift 209/6 3/4 0.30 7/2
9/4 0.52
Skull Fracture 6/20 0/7 0.24 3/6
2/11 0.49
Cerebral Edema 14/12 2/5 0.33 3/6
7/6 0.47
Contusion 18/8 3/4 0.53 5/4
8/5 0.63
Intracranial Hemorrhage 3/23 0/7 0.62 7/2
9/4 0.11
Epidural Hemorrhage 20/6 5/2 0.34 8/2
8/4 0.86
Subdural Hemorrhage 22/4 5/2 0.37 6/3
8/5 0.16
Arachnoid Hemorrhage
Marshall Score 0 0 0 0
I 17 3 4 6
II 4 1 0.19 1 2
0.37
III 3 0 3 1
IV 2 3 1 4
V
[00117] Table 3 shows DI-MS/MS Data of Day 1 samples, GOS-E Poor Outcome
and
Good outcome at 3 months.
Table 3
DI-MS/MS data, Day 1 Samples,
GOSE Poor Outcome and Good Outcome at 3 Months
DI- Method Models Q2 R2Y Sensitivity Specificity
AUROC Variables Patients
MS/MS (#)
Day 1
PLS-DA Metabolomics 0.39 0.74 100 100 1 483 Poor
GOSE
outcome SIMPLS Metabolomics 0.45 0.61 98 99 1 48a outcome,
at 3 Clinical 0.17 0.26 86 66 .85
4b n= 35
Variables
- 22 -
CA 03225337 2024- 1-9
WO 2023/279213
PCT/CA2022/051078
months Combination 0.56 0.68 100 92
1 483+4b Good
metabolomics
outcome
and clinical
n=9
variables
a- Metabolites; b- Clinical variables = Age, Severity, Marshall Score,
Hypoxemia
[00118]
Table 4 shows DI-MS/MS Data of Day 1 samples, GOS-E Poor Outcome and
Good outcome at 12 months.
Table 4
DI-MS/MS data, Day 1 Samples,
GOSE Poor Outcome and Good Outcome at 12 Months
DI- Method Models Q2 R2Y Sensitivity Specificity AUROC
Variables Patients
MS/MS (#)
Day 1
PLS-DA Metabolomics 0.55 0.83 100 .. 100 .. 1 .. 433 .. Poor
GOSE
outcome SIMPLS Metabolomics 0.61 0.84 98 99 1 433
outcome,
at 12 Clinical 0.13 0.30 78 73 .79
4b n= 14
months Variables
Good
Combination 0.64 0.84 100 100 .99
433+4b outcome
metabolomics
n=15
and clinical
variables
a- Metabolites; b- clinical variables = Age, GCS, Hypoxemia, Loss of
Consciousness
[00119] Table 5 shows the relative importance of metabolites as predictive
biomarkers of
sTBI outcome at 3 months.
Table 5
The Prediction of sTBI outcome at 3 Months
number of
Most important
metabolites Name of
Metabolites
metabolites
for each set
C3:1, LysoPC 17:0, C14:10H,
The Acylcarnitines LysoPC 18:0,C18:2,
minimum 15 (ACs) and LysoPC16:0,C14,
Lactate,
set of Lysophosphatidylc Glutamate,
Dimethylarginine,
Biomarkers holies (LysoPCs) Citrulline, Ornithine,
Citric acid, Uric
acid, Kynurenine
- 23 -
CA 03225337 2024- 1-9
WO 2023/279213
PCT/CA2022/051078
C3:1, LysoPC 17:0, C14:10H,
LysoPC 18:0,C18:2,
Acylcarnitines,
T,ysoPC16.0,C14, Lactate,
Lysophosphatidylc
Glutamate, Dimethylarginine,
holies and
The middle Citrulline, Ornithine, Citric acid, Uric
excitatory
set of 30
acid, Kynurenine, Aspartate, tyrosine,
neurotransmitters
biomarkers tryptophan, histidine,
C5MDC,
such Glutamate,
Choline, Succinate, Isoleucine,
Tyrosine,
C18:10H, LysoPC 17:0, LysoPC18:1,
Phenylalanine
Pyruvate, Methionine, C4OH,
Phenylalanine
Acylcarnitines C3:1, LysoPC 17:0,
C14:10H,
(ACs), LysoPC 18:0,C18:2,
Lysophosphatidylc LysoPC16:0,C14,
Lactate,
holies (LysoPCs), Glutamate,
Dimethylarginine,
excitatory
Citrulline, Ornithine, Citric acid, Uric
neurotransmitters
acid, Kynurenine, Aspartate, tyrosine,
such Glutamate, tryptophan, histidine,
C5MDC,
The
Tyrosine, Choline, Succinate,
Isoleucine,
maximum
50 Phenylalanine,
C18: 10H, LysoPC 17:0, LysoPC18: 1,
set of
Asparagine, Pyruvate, Methionine,
C4OH,
biomarkers
Phosphatidylcholin Phenylalanine, C14:1, Homocysteine,
es (PCs), Lactate, C2, C6:1, Threonine,
C3,
Pyruvate, PC40:laa,PC40:2aa,
Betaine,
Citrulline, Fumarate, C16:2,
Alanine, C5, C9,
Ornithine, Uric LysoPC20:3,
PC36:0aa
acid, Kynurenine
[00120]
Figure 4A and Figure 4B show DI-MS/MS data of prognosis of GOS-E at 12
months for poor outcome versus good outcome based on TBI Day 1 and Day 4
metabolites,
respectively.
[00121] As observed within the DI-MS/MS data presented in Figure 4A and
Figure 4B,
pertaining to prognosis of GOS-E at 12 months based on Day 1 serum, the
primary increased
metabolites include: ornithine, a-ketoglutaric acid, a-aminoadipic acid,
homocysteine, and
LysoPCs; and the primary decreased metabolites include: hydroxyproline,
serotonin,
dimethylarginine, a-aminoadipic acid, homocysteine, and LysoPCs.
[00122] For the DI-MS/MS data, pertaining to prognosis of GOS-E at 12
months based
on Day 4 serum, the primary increased metabolites include: tryptophan,
tyrosine, valine,
kynurenine, alanine, and uric acid; and the primary decreased metabolites
include: serotonin,
spermine, and 13-hydroxybutyric acid.
- 24 -
CA 03225337 2024- 1-9
WO 2023/279213
PCT/CA2022/051078
[00123]
Table 6 shows DI-MS/MS Data of Day 4 samples, GOS-E Poor Outcome and
Good outcome at 3 months.
Table 6
DI-MS/MS data, Day 4 Samples,
GOSE Poor Outcome and Good Outcome at 3 Months
DI- Method Models Q2
R2Y Sensitivity Specificity AUROC Variables Patients
MS/MS (#)
Day 4
PLS-DA Metabolomics 0.39 0.74 100 100 1 54a Poor
GOSE
outcome SIMPLS Metabolomics 0.45 0.75 98 97 1 54a outcome,
at 3 Clinical 0.26 0.40 75 82 .82
3b n= 23
months Variables
Good
Combination 0.56 0.80 100 92 .98 54a+3b outcome
metabolomics
n=8
and clinical
variables
a- Metabolites; b- Clinical variables = Age, Marshall Score, Hypoxemia
[00124]
Table 7 shows DI-MS/MS Data of Day 4 samples, GOS-E Poor Outcome and
Good outcome at 12 months.
Table 7
DI-MS/MS data, Day 4 Samples,
GOSE Poor Outcome and Good Outcome at 12 Months
DI- Method Models Q2
R2Y Sensitivity Specificity AUROC Variables Patients
MS/MS (#)
Day 4
PLS-DA Metabolomics 0.63 0.83 100 100 1 31a Poor
GOSE
outcome SIMPLS Metabolomics 0.51 0.71 73 100 1 31a outcome,
at 12 Clinical 0.31 0.36 71 78 .79
4b n= 13
months Variables
Good
Combination 0.54 0.75 100 100 1 318+4b outcome
metabolomics
n=13
and clinical
variables
a- Metabolites; b- Clinical variables = Age, GCS, Gender, Loss of
Consciousness
[00125] Figure 5A and Figure 5B show NMR data of prognosis of GOS-
E at 12 months
for poor outcome versus good outcome based on TBI Day 1 and Day 4 metabolites,
respectively.
- 25 -
CA 03225337 2024-1-9
WO 2023/279213
PCT/CA2022/051078
[00126] As observed within the NMR data presented in Figure 5A
and Figure 4B,
pertaining to prognosis of GOS-E at 12 months based on Day 1 serum, the
primary increased
metabolites include: ornithine, alanine, dimethyl sulfone, carnitine, valine,
leucine, and adipate;
and the primary decreased metabolites include: NAA, pyruvate, and mannose.
[00127] For the NMR data, pertaining to prognosis of GOS-E at 12 months
based on Day
4 serum, the primary increased metabolites include: dimethyl sulfone, valine,
tyrosine,
gluconate, urea, NAA, ornithine, and alanine; and the primary decreased
metabolites include:
6-alanine, taurine, and arginine.
[00128] Table 8 shows the prediction of sTBI outcome at 12
months.
Table 8
The Prediction of sTBI outcome at 12 Months
Number of
Most important
metabolites Name of
Metabolites
metabolites
for each set
C3:1, Ornithine, CO,
Acylcarnitines (ACs) and
The Homocysteine,
Glutamate, Spermine,
minimum
Ornithine, Lactate, C4, C16, trans-hydroxyproline,
set of Spermine, Acetyl-
ornithine serine,
, 3
Bi omarkers Gluconate -
C6, C3OH, Tryptophan, C18,
hydroxisobutyrate
Betaine
C3:1, Ornithine, CO,
Homocysteine,
C4, C16, trans-hydroxyproline,
Acylcarnitines, Glutamate,
The middle Spermine, Acetyl-ornithine serine,
Spermine, Ornithine and
set of 25 C6, C3OH,
Tryptophan, C18,
Lysophosphatidylcholines,
biomarkers Betaine, LysoPC
28:1, C18:2,
Lactate, Gluconate, Valine
C18:1, C6, C5, Creatinine,
Serotonin, C7DC, Spermine,
Tyrosine,
C3:1, Ornithine, CO,
Homocysteine,
C4, C16, trans-hydroxyproline,
Acylcarnitines (ACs), Spermine, Acetyl-
ornithine serine,
The Lysophosphatidylcholines C6, C3OH,
Tryptophan, C18,
(LysoPCs), excitatory Betaine, LysoPC
28:1, C18:2,
maximum
40 neurotransmitters such C18:1, C6, C5,
Creatinine,
set of
Glutamate, Tyrosine, Serotonin, C7DC,
Spermine,
biomarkers
Tryptophan, Serine, Tyrosine, C12:1,
LysoPC 14:0,
Lactate, Gluconate, Glutamate, C4:1
LysoPC 26:1,
Spermidine, PC40:6ae, PC38:0aa,
PC40:2aa, C160H,C14,13,
hydroxybutyric acid, alanine,
- 26 -
CA 03225337 2024- 1-9
WO 2023/279213 PCT/CA2022/051078
LysoPC18:0, LysoPC28:1,
LysoPC16:0
[00129] Table 9
shows NMR Data of Day 1 samples, GOS-E Poor Outcome and Good
outcome at 3 months.
Table 9
NMR data, Day 1 Samples,
GOSE Poor Outcome and Good Outcome at 3 Months
NMR Method Models Q2 R2Y Sensitivity Specificity AUROC
Variables Patients
Day 1 (#)
GOSE
PLS-DA Metabolomics 0.21 0.49 99 87 1 22a Poor
outcome
at 3 SIMPLS Metabolomics 0.35 0.55 91 89
1 22a outcome,
months Clinical 0.20 0.27 88 66
0.89 4b n= 35
Variables
Good
Combination 0.48 0.54 100 70 0.95 22a+4b outcome
metabolomics
n=9
and clinical
variables
a- Metabolites; b- Clinical variables = Age, Severity, Marshall Score,
Hypoxemia
[00130] Table 10 shows NMR Data of Day 1 samples, GOS-E Poor Outcome and
Good
outcome at 12 months.
Table 10
NMR data, Day 1 Samples,
GOSE Poor Outcome and Good Outcome at 12 Months
NMR Method Models Q2 R2Y Sensitivity Specificity AUROC
Variables Patients
Day 1 (#)
GOSE
PLS-DA Metabolomics 0.44 0.73 73 .. 93 .. 0.93 .. 24a .. Poor
outcome
at 12 SIMPLS Metabolomics 0.56 0.76 81 89
0.93 24a outcome,
months Clinical 0.07 0.26 73 71
0.78 3b n= 14
Variables
Good
Combination 0.51 0.74 91 100 0.98 24a+3b outcome
metabolomics
n=15
and clinical
variables
- 27 -
CA 03225337 2024- 1-9
WO 2023/279213 PCT/CA2022/051078
a- Metabolites; b- clinical variables = Age, Hypoxemia, Loss of Consciousness
[00131] Table 11 shows NMR Data of Day 4 samples, GOS-E Poor Outcome and
Good
outcome at 3 months.
Table 11
NMR data, Day 4 Samples,
GOSE Poor Outcome and Good Outcome at 3 Months
NMR Method Models Q2 R2Y Sensitivity Specificity AUROC
Variables Patients
Day 4 (#)
GOSE
PLS-DA Metabolomics 0.52 0.75 100 90 0.99 26d Poor
outcome
at 3 simpLs Metabolomics 0.61 0.71 95 93
0.95 26a outcome,
months Clinical 0.25 0.36 85 50 0.83
3b n= 23
Variables
Good
Combination 0.66 0.76 100 100 1 26a+3b outcome
metabolomics
n=8
and clinical
variables
a- Metabolites; b- Clinical variables = Age, Marshall Score, Hypoxemia
[00132] Table 12 shows NMR Data of Day 4 samples, GOS-E Poor Outcome and
Good
outcome at 12 months.
Table 12
NMR data, Day 4 Samples,
GOSE Poor Outcome and Good Outcome at 12 Months
NMR Method Models Q2 R2Y Sensitivity Specificity AUROC
Variables Patients
Day 4 (#)
outcomeGOSE
PLS-DA Metabolomics 0.45 0.71 94 92 0.95 18a Poor
at 12 SIM PLS Metabolomics 0.51 0.71 92 91
0.92 18a outcome,
months Clinical 0.17 0.39 85 54 0.77
3b n= 13
Variables
Good
Combination 0.51 0.71 82 65 0.81 18a+3b outcome
metabolomics
n=13
and clinical
variables
a- Metabolites; b- Clinical variables = Age, GCS, Gender, Loss of
Consciousness
- 28 -
CA 03225337 2024- 1-9
WO 2023/279213
PCT/CA2022/051078
[00133] Figure 6A and Figure 6B show DI-MS/MS data of prognosis
of mortality and
vegetative state for GOS-E level 1-2 versus GOS-E level 3-8 based on TBI Day 1
and Day 4
metabolites, respectively.
[00134] As observed within the DI-MS/MS data pertaining to
prognosis of mortality and
vegetative state (died vs alive) based on Day 1 serum, the primary increased
metabolites
include: acylcarnitines, glucose, methyl histidine, a-aminoadipic acid and
arginine; and the
primary decreased metabolites include: glutamine, valine, isoleucine,
histidine, citrulline,
homocysteine, and homovanillic acid.
[00135] As observed within the DI-MS/MS data pertaining to
prognosis of mortality and
vegetative state (died vs alive) based on Day 4 serum, the primary increased
metabolites
include: indoleacetic acid, a-ketoglutaric acid, hippuric acid,
acylcarnitines, citric acid, ornithine,
threonine, valine, and tryptophan; and the primary decreased metabolites
include: taurine,
glutamine, creatinine, C6, and betaine.
[00136] Table 13 shows DI-MS/MS Data of Day 1 samples, relating
to mortality
outcome.
Table 13
DI-MS/MS data, Day 1 Samples, Mortality Outcome
DI- Method Models Q2 R2Y Sensitivity Specificity AUROC
Variables Patients
MS/MS (#)
Dav
- 4 PLS-DA Metabolomics 0.49 0.72
100 100 1 45a Died,
mortality
outcome SIMPLS Metabolomics 0.71 0.82 94 96 1 45a n= 21
Clinical 0.37 0.44 66
78 0.87 2b Alive,
Variables
n=23
Combination 0.82 0.86 93 100 0.99 45a+2b
metabolomics
and clinical
variables
a- Metabolites; b- Clinical variables = Age, Severity
[00137] Table 14 shows DI-MS/MS Data of Day 4 samples relating to
mortality outcome.
Table 14
DI-MS/MS data, Day 4 Samples, Mortality Outcome
DI- Method Models Q2 R2Y Sensitivity Specificity AUROC
Variables Patients
MS/MS (#)
Day 4
PLS-DA Metabolomics 0.57 0.67 100 100 1 31a Died,
Metabolomics 0.21 0.41 93 94 1 31a n= 13
- 29 -
CA 03225337 2024- 1-9
WO 2023/279213 PCT/CA2022/051078
Mortality SIMPLS Clinical 0.17 0.34 90 83
0.91 2b Alive,
outcome Variables
n=13
Combination 0.22 0.43 93 100 0.96 31 a+2b
metabolomics
and clinical
variables
a- Metabolites; b- Clinical variables = Age, Severity
[00138] Figure 7A and Figure 7B show NMR data of prognosis of mortality and
vegetative state for GOS-E level 1-2 versus GOS-E level 3-8 based on TBI Day 1
and Day 4
metabolites, respectively.
[00139] Table 15 shows NMR Data of Day 1 samples, and mortality outcome.
Table 15
NMR data, Day 1 Samples, Mortality Outcome
NMR Method Models Q2 R2Y
Sensitivity Specificity AUROC Variables Patients
Day 1 (#)
Mortality
PLS-DA Metabolomics 0.30 0.67 81 100 1 20a Died,
Outcome
SIMPLS Metabolomics 0.54 0.71 87 93 1 20a n= 21
Clinical 0.37 0.44 86 95 0.88 2b Alive
Variables
n=23
Combination 0.67 0.73 81 95 0.91 20a+2b
metabolomics
and clinical
variables
a- Metabolites; b- Clinical variables = Age, Severity
[00140] Table 16 shows NMR Data of Day 4 samples, and mortality outcome.
Table 16
NMR data, Day 4 Samples, Mortality Outcome
NMR Method Models Q2 R2Y
Sensitivity Specificity AUROC Variables Patients
Day 4 (#)
Mortality
PLS-DA Metabolomics 0.47 0.62 88 94 0.94 17 Died,
Outcome
SIMPLS Metabolomics 0.65 0.74 87 .. 90 .. 0.94 .. 17a .. n= Alive 12
Clinical 0.19 0.33 84 78
0.86 1 b
Variables
n=19
- 30 -
CA 03225337 2024- 1-9
WO 2023/279213
PCT/CA2022/051078
Combination 0.68 0.75 84 98 0.93 1 7a+2b
metabolomics
and clinical
variables
a- Metabolites; b- clinical variables = Age, Severity
[00141] As observed within the NMR data pertaining to prognosis
of mortality and
vegetative state (died vs alive) based on Day 1 serum, the primary increased
metabolites
include: glucose, betaine, 0-phosphocholine, creatine, citrate, and dimethyl
sulfone; and the
primary decreased metabolites include: glutamine, histidine, succinate,
isoleucine, leucine, and
valine.
[00142] As observed within the NMR data pertaining to prognosis
of mortality and
vegetative state (died vs alive) based on Day 4 serum, the primary increased
metabolites
include: creatine, isobutyrate, dimethylsulfone, creatine, valine, tyrosine,
asparagine, and
tyrosine; and the primary decreased metabolites include: betaine, gluconate,
taurine,
hypoxanthine, urea, serine, and glutamate.
[00143] Table 17 shows the prediction of sTBI outcome at 12
months.
Table 17
The Prediction of sTBI Mortality at 3 Months
number of
Most important
metabolites Name of
Metabolites
metabolites
for each set
C3:1, PC38:0aa, PC40:6ae, Glucose,
The Acylcarnitines (ACs)
C7DC, Glutamine, Valine, Isoleucine,
minimum and
Leucine, C1601-1, a-ketoglutarate,
set of Lysophosphatidylcholine
Hippurate, LysoPC26:0, Taurine
Biomarkers s (LysoPCs)
C3:1, PC38:0aa, PC40:6ae, Glucose,
C7DC, Glutamine, Valine, Isoleucine,
Acylcarnitines, Leucine, C160H, a-
ketoglutarate,
Lysophosphatidylcholine Hippurate, LysoPC26:0, Taurine,
The middle
s and excitatory indole acetic acid,
PC40:laa,
set of 30
neurotransmitters such Methylhistidine, a-
aminoadipic acid,
biomarkers
Glutamate, Tyrosine, C10:1, argi nine,
Citrulline, C51VIDS,
Phenylalanine Homocysteine,
Homovanillic acid,
C4:1, C14:1, C14, Succinate, C18:2
- 31 -
CA 03225337 2024- 1-9
WO 2023/279213
PCT/CA2022/051078
Acylcarnitines (ACs), C3:1, PC38:0aa,
PC40:6ae, Glucose,
Lysophosphatidylcholine C7DC, Glutamine, Valine, Isoleucine,
s (T,ysoPCs), excitatory T,eucine, Cl 60H, a-
ketoglutarate,
neurotransmitters such Hippurate,
LysoPC26:0, Taurine,
The Glutamate, Tyrosine, indole acetic acid,
PC40:laa,
maximum 40 Phenyl alanine, Methylhistidine, a-
aminoadipic acid,
set of Asparagine, C10:1, arginine,
Citrulline, C5MDS,
biomarkers Phosphatidylcholines Homocysteine,
Homovanillic acid,
(PCs), Lactate, Pyruvate, C4:1, C14:1, C14,
Succinate, C18:2,
Citrulline, Ornithine,
C18:1, C12:1, C16:2, Tryosine,
Uric acid, Kynurenine Threonine, C3, Valine.
C8, Creatinine
[00144] The metabolite pathway analysis involved in GOS-E
prognosis at 12 months
suggest that the energy metabolism pathways, excitotoxicity pathways, and
acylcarnitine
metabolism pathways (for example, with mitochondrial involvement) are
impacted. The
involvement of these pathways is affirmed if mortality as an outcome (instead
of GOS-E good
versus bad outcome) is assessed.
[00145] The metabolomics techniques conducted in this Example
exhibited high efficacy
in the prognosis of sTBI using GOS-E at short (3 months) and long term (12
months) intervals.
Favorable (GOS-E 5-8) outcomes can be distinguished from unfavorable outcome
(GOS-E 1-4)
according to the platform methodologies described herein.
[00146] The metabolic biosignatures obtained by MS/MS analysis
(including lipid
compounds) showed excellent predictability for the prognosis of outcome. The
1H-NMR
metabolite analysis also resulted in good predictability.
[00147] While both blood samples provided useful prediction, the
metabolic
biosignatures on day 4 post-injury were more predictive than day 1 post-injury
samples.
[00148] Specifically, increased lysophosphatidylcholines,
acylcarnitines, energy-related
metabolites (glucose, lactate), aromatic amino acids and glutamate were
positively correlated
with poor outcome.
[00149] Metabolomic analysis using either MS/MS or NMR were
effective predictors of
the prognosis of mortality or vegetative state (GOS-E 1-2), as well as the
assessment of
severity of TBI (using GOS-E). QOLIBRITM and PedsQLTM assessment (data not
shown)
provided useful parameters. A minimal number of metabolites may be assessed as
biomarkers
to build effective predictive models. Such models may be useful in making
decisions regarding
clinical care.
- 32 -
CA 03225337 2024- 1-9
WO 2023/279213
PCT/CA2022/051078
[00150] Table 18 shows the quantitative predictive values as
determined using two
different analytical platforms, including test sensitivity and specificity. In
Table 18, the
characteristics of the prediction models show a higher predictability of
metabolic profiles on day
4 than day 1 post-sTBI for 3 and 12 month GOS-E and mortality at 3 months
outcome.
Additionally, the metabolic profiles obtained by MS/MS are more predictive
than 1H-NMR
results. The parameter "R2" indicates the goodness of fit of the model; "Q2"
indicates the
goodness of prediction of the model: and "AUC" represents the area under the
receiver
operating curve of the model.
Table 18
Quantitative Predictive Values
Prognosis Analytical Sampling R2 Q2
p value Sensitivity Specificity AUC
Platforms Time
Poor vs. DI-MS/MS Day 1 0.74 0.39 1.5x10⁻³
>99 >99 .. 0.99
Good Day 4 0.81 0.61 5.4x10⁻⁵ >
99 > 99 0.99
outcome 1H-NMR Day 1 0.49 0.21 2.6x10⁻² >
99 87 0.99
3-month Day 4 0.75 0.52 6.0x10⁻³ >
99 90 0.99
Poor vs. DI-MS/MS Day 1 0.83 0.55 8.0x10⁻⁴
>99 >99 0.99
Good Day 4 0.80 0.63 1.5x10⁻⁴
>99 >99 0.99
outcome 1H-NMR Day 1 0.73 0.44 5.0x10⁻³
73 93 0.92
12-month Day 4 0.71 0.45 1.4x10⁻²
94 92 0.95
Mortality DI-MS/MS Day 1 0.72 0.49 4.2x10⁻⁵ >
99 > 99 0.99
outcome Day 4 0.7 0.57 1.0x10⁻⁴
>99 >99 0.99
1H-NMR Day 1 0.67 0.30 3.0x10⁻³
81 >99 0.94
Day 4 0.62 0.47 5.0x 10⁻³
88 94 0.96
[00151] DISCUSSION
[00152] In the current example, serum-based metabolomics analysis
was successfully
applied on days 1 and 4 post sTBI of patients to predict GOSE outcomes at 3
and 12 months
post-injury. Prediction models showed highly predictive and significant
separation between
sTBI patients with unfavorable and favorable outcomes. A remarkable similarity
was found for
the trends in changes in metabolites measured by both MS/MS and 1H-NMR
methodologies,
showing a high level of reliability of quantification and validation of the
results using two
- 33 -
CA 03225337 2024- 1-9
WO 2023/279213
PCT/CA2022/051078
different analytical platforms. This study showed that the patients'
demographics and clinical
variables were not strong independent predictors of GOSE outcome. However,
age, GCS,
hypoxemia, injury severity score, and Marshall score revealed they can be used
to slightly
enhance the performance of metabolomics-based multivariate models for
predicting outcomes.
Conventional demographics and clinical features predominantly depend on the
characteristics
of the study cohort.
[00153] Although age16-18, GCS19, Marshall score19-22 and CT
findings 21 have had some
value for predicting TBI outcome, it has been shown that conventional
demographics, clinical
variables and CT findings are overall insufficient predictors for the
prognosis of outcome10.
[00154] Figure 3 illustrates typical patient age distribution of TBI, with
the Shapiro-Wilk
test for normality indicating W= .94312 (p= 0.00000).
[00155] CT scanning has been associated with improvement of
prognostic value in
patients with sTBI when combined with physiological findings 22. Our results
were similar to the
IMPACT and CRASH studies 23 in their use of demographics and clinical features
for predicting
unfavorable outcomes and mortality of moderate to severe TBI at 6 months. The
IMPACT and
CRASH models were established based on age, GCS motor, pupillary reactivity,
CT
classification, EDH (epidural hematoma), tSAH (subarachnoid hemorrhage),
hypoxia, and
hypotension 23. In addition, using a population of the European Brain Injury
Consortium Core
Data (EBIC) and Traumatic Coma Data Bank (TCDB) studies, 24 multivariate
analysis
highlighted that age, GCS motor, pupillary reactivity, hypoxia, hypotension
and CT classification
were the most important predictors of outcomes (AUC 0.83-0.89). Age and injury
severity score
were shown as the most differentiating prognostic variables for mortality,
while the IMPACT
prediction model revealed age, GCS motor score, pupillary reactivity, hypoxia,
hypotension,
basal cisterns narrowing, midline shift and tSAH as the most predictive
variables for 14-day
mortality 25. Using a multimodal approach, physiological (ICP, MAP, CPP and
pbt02) and
biochemical (pyruvate, lactate, glycine, glutamate, and glucose) parameters
could predict the
outcome in sTBI with a high degree of prediction accuracy around 90% 26. This
study also
demonstrated the importance of multivariate predictive and machine learning
based-models
versus simplified methods to determine the most differentiating metabolites
and clinical
variables as key predictors. It has previously been shown that using a
Bayesian networks
approach can improve the prediction models using variables that were not
predictive in
simplified models 27. PLS-DA and SIMPLS demonstrate the power of multivariate
methods to
explore big and complex datasets with many variables and relatively small
sample sizes 28.
- 34 -
CA 03225337 2024- 1-9
WO 2023/279213
PCT/CA2022/051078
[00156] The present study also provides evidence for clinically
and biologically relevant
correlation of metabolite alterations to prognosticate sTBI outcome that
provides mechanistic
insight into the pathogenesis of sTBI. More specifically, increased lysoPC
compounds in
patients with the unfavorable outcome may be correlated with microvascular
barrier disruption,
promotion of oligodendrocyte demyelination and pericyte loss and induced
inflammation 23.
Increased 018 and its derivatives (stearic acid, oleic acid, linoleic acid)
and lysoPCs in
unfavorable outcome may correlate with docosahexaenoic acid (DHA) metabolism,
a highly
enriched lipid in the brain 30. It has previously been shown there is an
increase of lysoPCs in
CSF samples on day 1 post-injury in non-survivors and an increase of PCs in
survivors from
TBI 31 and in mild TBI patients compared to non-concussed controls 32. Within
one day post-
sTBI, an increase of energy-related metabolites (lactate, glucose, and TCA
cycle compounds)
was observed in patients with unfavorable outcomes. The lactate/pyruvate ratio
has been well-
recognized as a predictor for the prognosis of brain injuries such as
apoptosis, cerebral anoxia,
and anaerobic metabolism33,34. There is a correlation between elevated lactate
with unfavorable
outcomes in TBI, in association with reduced cerebral blood flow (CBF),
elevated ICP, and
ischemia33,34. The increased tryptophan, kynurenine, tyrosine, phenylalanine,
and glutamate on
day 4 post-injury may intriguingly imply the correlation of excessive
excitotoxicity mechanisms35
and aromatic amino acids metabolism36 with unfavorable outcome. Increased
quinolinic acid,
the final product of the tryptophan-kynurenine pathway, has been associated
with the
inflammatory response due to infiltration of macrophages and activated
microglia in the CNS 37
and with unfavorable outcome and mortality in sTBI, indicating the possibility
of the elevation of
macrophage-derived (or microglia-derived) excitotoxin in the contribution of
secondary injury to
poor outcome 37'38. In our study, elevated kynurenine, and tryptophan in
patients with an
unfavorable outcome on day 4 after injury may characterize excessive
neuroinflammation, a
well-known secondary injury mechanism in brain injury. Also increased NAA and
phenylalanine
mainly on day 4 post sTBI, two well-known neurotransmitters in patients with
unfavorable
outcomes, may be associated with alteration of osmolality and
catecholaminergic mechanism of
injury 39. The current data also showed the association of day 1 hyperglycemia
and increased
lactate with poor outcome. Hyperglycemia and hyperlactatemia have been
previously shown to
be potential predictors for the prognosis of unfavorable TBI outcome 40-42.
[00157] There are important limitations to this study, in
particular, there is a relatively
small sample size in general and there are a small number of patients with
outcome measures
missing at different time points. In addition, the study is noted to be male-
dominated, a
common problem when studying sTBI in adults. These limitations, therefore,
require that this
- 35 -
CA 03225337 2024- 1-9
WO 2023/279213
PCT/CA2022/051078
study be validated using a larger cohort of adults with sTBI. Nonetheless,
this study does show
great promise in using metabolomics to evaluate sTBI, particularly in
prognosis assessment.
[00158] Metabolic profiling of sTBI patient samples for a longer
period than the first 4
days may enhance the predictability of metabolomics for the prognosis of
outcome and may
provide more definitive information about molecular changes post sTBI,
especially in those who
have a favorable outcome of sTBI. Also, applying an untargeted mass
spectrometry approach
may help identify more known and unknown metabolites that may be correlated
with the
prognosis of sTBI and may more clearly define the mechanisms of injury (both
primary and
secondary) in sTBI.
[00159] Despite the study limitations, it can be concluded that multiple
metabolite
alterations are detectable in serum due to sTBI early in the injury process.
In the current study,
metabolite alterations on days 1 and 4 post-sTBI were well-correlated with the
GOSE
unfavorable and favorable outcomes at 3 and 12 months and importantly, may be
used as a
promising prognostic tool for predicting the worst GOSE outcome, i.e., death
post-injury.
Metabolomics appears to be superior to patients' demographics and clinical
features in
predicting GOSE outcome at 3 and 12 months post injury. Notably, the
combination of
metabolomics with clinical and CT variables can enhance the prognostication of
sTBI in the
early days post-injury. Importantly, the information derived from metabolomics
and prediction
models may be used for the stratification of patients with sTBI that can be
applied in future
clinical trials, especially therapeutic trials as a means of prognostic
enrichment. Targeted DI-
MS/MS (including multiple lipid metabolites) appears to be superior to 1H-NMR
for predicting
sTBI outcome and this information may be useful for future studies.
[00160] Example 1A
[00161] Metabolomic Profiles in Serum Predict Global Functional
Neurological
Outcome at 3 and 12 Months And Death at 3 Months Following sTBI
[00162] SUMMARY
[00163] Prognostication is very important to clinicians and
families during the early
management of severe traumatic brain injury (sTBI). However, there are no
clinically reliable
biomarkers to determine prognosis in sTBI. As has been demonstrated in several
diseases,
early measurement of serum metabolomic profiles can be used as sensitive and
specific
biomarkers to predict outcome.
[00164] Methods. Data from Example 1 is further analysed and
elaborated upon in this
Example 1A. Adults with sTBI (Glasgow coma scale 8) were prospectively
enrolled in a
multicenter CanTBI study. Serum samples were drawn on the 1st and 4th day
following injury
- 36 -
CA 03225337 2024- 1-9
WO 2023/279213
PCT/CA2022/051078
for metabolomic profiling. The Glasgow outcome scale extended (GOSE) was
collected at 3
and 12 months post-injury. Targeted direct infusion liquid chromatography
tandem mass
spectrometry (DI/LC-MS/MS or simply "MS/MS" herein) and untargeted proton
nuclear
magnetic resonance spectroscopy (1H-NMR) were used to profile serum
metabolites.
Multivariate analysis was used to determine the association between serum
metabolomics and
GOSE, dichotomized into favorable and unfavorable, outcomes.
[00165] Findings. Serum metabolic profiles on days 1 and 4 post-
injury were highly
predictive (Q2>0.4-0.5) and highly accurate (AUC>0.99) to predict GOSE outcome
at 3 and 12
months post-injury and mortality at 3 months. The metabolic profiles on day 4
were more
predictive (02>0.55) than those measured on day 1 post-injury. Increased
lysophosphatidylcholines, acylcarnitines, energy-related metabolites (glucose,
lactate),
aromatic amino acids and glutamate were associated with poor outcome and
mortality.
[00166] Interpretation. Metabolomic profiles were strongly
associated with prognosis of
GOSE outcome at 3 and 12 months and mortality following sTBI in adults. The
current findings
strongly support the use of serum metabolomics which are shown to be better
than clinical data
in determining prognosis in adults with sTBI in the early days post-injury.
Our findings, however,
require validation in a larger cohort of adults with sTBI before using in
clinical practice.
[00167] INTRODUCTION
[00168] Traumatic brain injury (TBI) is a neurologic injury
resulting from an external
mechanical force and one of the most common causes of long-term neurological
disability and
death.1 Worldwide, approximately 69 million people suffer TBI annually.2 There
are 5.3 and 7.7
million individuals living with TBI-related disability in the United States
and European countriesl,
respectively. Severe TBI has a mortality of 30-50% and 30% of survivors have
severe
neurologic sequelae.3-7 Large variability in the mechanisms of TBI, patterns
of brain injury and a
large range of outcomes make it difficult to determine prognosis in the first
few days following
TBI.8 Clinical factors and neuroimaging findings are not reliable predictors
of outcomes
following TBI.9,1 Blood biomarkers have the potential to improve prognostic
models. These
models could help clinicians during discussions with surrogate decision-makers
about the
intensity of acute care and help plan rehabilitation and support services for
survivors and their
caregivers. Metabolomics is widely used to provide potential insights into
mechanisms of injury
and may allow the development of sensitive and specific biomarkers for these
prognostic
models."
[00169] In this study, it was hypothesized that serum metabolites
would be associated
with favorable and unfavorable outcomes at 3 and 12 months following severe
TBI. The
- 37 -
CA 03225337 2024- 1-9
WO 2023/279213
PCT/CA2022/051078
objectives were to measure metabolites in serum sampled at 1 and 4 days
following severe
TBI, to determine concentration thresholds for prognosis and to compare
prognostic models
using metabolomics biomarkers to models using clinical predictors.
[00170] MATERIALS AND METHODS
[00171] Patients' characteristics and primary clinical information.
Patients 18
years old with severe TBI (Glasgow coma scale 8) were enrolled prospectively
at 3 hospitals
in Vancouver, Calgary and Halifax, Canada. Serum samples were collected on
days 1 and 4
post-injury. Demographics, injury characteristic, neuroimaging (CT scan) and
physiologic
clinical variables were collected electronically as well as global
neurological function and
mortality at 3 and 12 months following injury using the Glasgow Outcome Scale-
Extended
(GOSE). All data was collected and cleaned by trained research coordinators
and database
engineers. The GOSE was dichotomized into favorable (GOSE 5-8) and unfavorable
(GOSE 1-
4) outcomes. The collected clinical variables in this study included gender,
age, GCS, ISS
(injury severity score), intubation, hypoxemia, hypotension, loss of
consciousness and Marshall
score that were used for the prediction of GOSE outcome at 3 and 12 months,
and for mortality
at 3 months.
[00172] A total of 445 adult and pediatric patients with mild,
moderate and severe forms
of TBI were entered into the CanTBI study and database. All patients were
admitted to critical
care units, and/or emergency departments and/or assessed in concussion clinics
at
participating centers. There were both pediatric and adult arms to the CanTBI
study. In the
adult arm, the inclusion criteria for adults severe sTBI included:
[00173] 1. Patient yrs with acute mild, moderate or severe
TBI.
[00174] 2. Patient had at least 1 research blood sample drawn
within 24 hours + 6 hours
from TBI.
[00175] 3. Patient/substitute decision maker can speak and read English
and/or French.
[00176] 4. Patient/substitute decision maker has a fixed address.
[00177] 5. Obtaining informed consent from patient or designated
legal surrogate either
directly or in a delayed fashion.
[00178] Exclusion criteria consisted of:
[00179] 1. Patient had a severe neurodevelopmental disorder pre-injury.
[00180] 2. Patient has a confirmed or suspected brain death at
the time of enrollment
determined by the attending physician.
[00181] 3. Patient has a terminal illness, expected to live less
than 12 months from TBI.
- 38 -
CA 03225337 2024- 1-9
WO 2023/279213
PCT/CA2022/051078
[00182] 4. Patient has ongoing neurologic deficit from a previous
TBI or other acquired
brain injury (e.g. stroke).
[00183] 5. Patient had a cardiac event that potentially caused a
TBI.
[00184] 6. Patient/substitute decision maker is unwilling to
participate in study follow-up.
[00185] Biological samples including whole blood, serum, plasma, buffy
coat, CSF and
brain material from any biopsy or from operative procedure that were collected
in the CanTBI
study at various dates and times over 28 days (as per the CanTBI Protocol).
All biological
samples were collected and handled as per predefined CanTBI SOPs with the goal
of sample
collection to freezer within 2 hours. Demographic and clinical data were
collected from
individuals including age at the time of TBI, sex, cause of TBI, pre-hospital
events, GCS score,
Abbreviated Injury Score (AIS), Injury severity score (ISS), clinical
monitoring, medication and
medical interventions.
[00186] Extra information such as socioeconomic status, education
and past medical
history (prior concussion, migraine, psychiatric history, neurological
history) were collected and
assessed by an expert team for relevance. Details of lab and neuroimaging and
neurophysiology were documented. Entered patients in the study participated in
a battery of
questionnaires and performance-based cognitive and behavioral assessments that
focused on
global outcome, TBI-related symptoms and quality of life at time points
predetermined based on
the severity of the injury. Glasgow Outcome Scale Extended (GOSE)/ Extended
Pediatric
(GOS-EP) and Extended Pee Wee GOS (GOS-E P-WEE) for pediatric patients,
Rivermead
Post Concussion Symptom Questionnaire (RPSQ), Brief Test of Adult Cognition
(BTACT),
Pediatric Quality of Life Questionnaire (PedsQLTm), Health Behavior Inventory
(HBO, and
Patient-Reported Outcomes Measurement Information System (PROMIS) were the
primary and
supplementary TBI outcomes collected from patients. This study focused on GOSE
outcome at
3 and 12 months post injury and mortality at 3 months.
[00187] Metabolomics Methods and Quantification. Untargeted
proton nuclear
magnetic resonance (1H-NMR) spectroscopy and targeted direct injection, liquid
chromatography tandem mass spectrometry (DI/LC-MS/MS) were applied to identify
and
quantify serum metabolites on days 1 and 4 post sTBI. These two techniques
were used to
quantify a broad list of metabolites with few overlapping metabolites. A
comprehensive targeted
analysis of 130 and 58 metabolites was carried out using DI/LC-MS/MS and 1H-
NMR,
respectively, to determine serum metabolites on days 1 and 4 post-injury.
[00188] Direct infusion/liquid chromatography tandem mass
spectrometry (DI/LC-
MS/MS). Targeted, quantitative DI/LC-MS/MS was performed on days 1 and 4 post-
sTBI serum
- 39 -
CA 03225337 2024- 1-9
WO 2023/279213
PCT/CA2022/051078
samples using an ABI 4000 Q-Trap (Applied Biosystems/MDS Sciex) mass
spectrometer. A
targeted list of metabolites used in this study consisted of 130 metabolites
including lipids,
amino acids, biogenic amines and organic acids plus other metabolites.
[00189] Table 19 provides a list of quantified metabolites.
Reverse-phase liquid
chromatography-tandem Mass Spectrometry (LC-MS/MS) was used to quantify amino
acids,
biogenic amines, and organic acids. Direct infusion tandem mass spectrometry
(DI-MS/MS)
was applied to quantify glycerophospholipids (lysophosphatidylcholines
(lysoPCs) and
phosphatidylcholines (PCs), acylcarnitines (Cs), and sphingomyelins (SMs).
- 40 -
CA 03225337 2024- 1-9
WO 2023/279213
PCT/CA2022/051078
Table 19
Metabolites quantified using DI/LC-MS/MS
Metabolite Metabolite Metabolite
1 Asymmetric dimethylargir 45 C3:1 (Propenoylcarnitine) 89 PC
acyl-alkyl cae) C40:6
2 total dimethylarginine 46 C3
(Propionylcarnitine) 90 PC ae C360
3 alpha-Aminoadipicacid 47 C4:1
(Butenylcarnitine) 91 SM (OH) C14:1
4 Creatinine 48 C4 (butyrylcarnitine) 92 SM (OH)
C16:1
Dopamine 49 C3-0H (hydroxyPropionylcarnitine) 93 SM (OH) C22:1
6 Kynurenine 50 C5-1 (Tiglylcarnitine) 94 SM (OH)
C22=2
7 Methioninesulfoxide 51 C5
(Valerylcarnitine) 95 SM (OH) C24.1
Hydroxyproline (t4-0H-Pr 52 C4-0H (C3-0C) (Hydroxybutyrylcarnitine) 46 SM
C16:0
9 Phenylethylamine 53 C6:1 (Hexenoylcarnitine) 97 SM C1671
Putreseine 54 C6 (C4:1-DC) (lexanoylcarritine) 98 SM C180
11 Sarcosine 55 C5-0H (C3-DC-M) (hydroxyvalerylcarnitine)
99 5M C181
12 Serotonin 55 C5:1-0C (Giutaeonyicarnitine) 100 SM C202
13 Spermidine 57 C5-DC (C6-0H)(Glutarylcarnitine) 101.
lysoPC a C14.0
14 Spermine 58 C8 (Octanoylcarnitine) 102 lysoPC a
C16.0
Taurine 59 C5-M-DC (methylgiutarylcarnitine) 103 lysoPC
a C161
16 Tyramine 60 C9 (Nonaylcarnitine) 104 lysoPC a
C170
17 Alanine 61 C7-0C (pimelylcarnitine) 105 lysoPC a
C18.0
18 Arginine 62 C10:2 (decadienylcarnitine) 106 lysoPC a
C1871
19 Asparagine 63 C101 (Derenoyirarnitine) 107 tysoPC a
C182
Aspa rtate 64 C10 (Decanoylcarnitine) 108 lysoPC a C20.3
21 Citrulline 55 C121 (Dodecenoykarnitine) 109 lySOPC a
C20:4
22 Glutamate 66 C12 (dodecanoylcarnitine) 110 lysoPC a
C240
23 Glutamine 57 C14:2 (Tetradecadienylcarnitme) 111 lysoPC
a C26:0
24 Glycine 58 C14:1 (tetradecenoyl carnitine) 112 tysoPC
a C26_1
Histidine 69 C14 (tetradecanoylcarnitine) 113 lysoPC a C280
25 Isoleurine 70 C12-DC (dodecanedioylcarnitine) 114 lysoPC
a C28.1
27 Leucine 71 C14:2-0H (hydroxytetradecadienylcarnitine)
115 Lactic acid
28 Lysine 72 C14:1-0H (Hydroxytetradecenoyl carnitine)
116 beta-Hydroxybutyric acid
29 Methionine 73 C16:2 (Hexadecadienylcarnitine) 117 alpha-
Ketoglutaric acid
Ornithine 74 C16:1 (Hexadecenoylcarnitine) 118 Citric acid
31 Phenylalanine 75 C16 (Hexadecanoylcarnitine) 119 Butyric
acid
32 Proline 76 C16:1-0H (Hydroxyhexadecenoylcarnitine)
120 HPHPA
33 Serine 77 C15-0H (hydroxyhexadecanoykarnitine) 121
para-hydroxyhippuric acid
34 Threonine 78 C13:2 (Octadecadienylcarnitine) 122
Succinic acid
Tryptophan 79 C18:1 (Oetadecenoylcarnitine) 123 Fumaric
acid
35 Tyrosine 80 C18 (Octadecanoylcarnitine) 124 Pyruvic
acid
37 Valine 81 C18.1-0H (Hydroxyoctadecenoylcarnitine)
125 Isobutyric acid
38 Betaine 82 PC diacyl (aa) C36:6 126 Hippuric
acid
39 Choline 83 PC aa C32:2 127
Methylmalonic acid
Creatine 84 PC aa C38:0 128 Homovanillic
acid
41 Methylhistidine 85 PC aa C3815 129 Indole
acetic acid
42 Homocysteine 86 PC aa C40:1 130 Uric acid
43 CO (Carnitine) 87 PC aa C40:2
44 C2 (Acetylcarnitine) 88 PC aa C4015
[00190] To quantify organic acids, 150 pl of ice-cold methanol
was added to thawed 50
5 pl serum samples followed by adding 10 pl of isotope-labelled
standards. To precipitate
proteins, the mixtures were kept in -20 C overnight, and were centrifuged at
13,000xg for 20
min. 50 pl of supernatant extracts were added to a 96-well plate followed by
adding 3-
- 41 -
CA 03225337 2024- 1-9
WO 2023/279213
PCT/CA2022/051078
nitrophenylhydrazine reagent and were incubated for 2 hours. Before LC-MS/MS,
2mg/mlof
Butylated hydroxytoluene was added to the extract.
[00191] To quantify amino acids and lipids, 10 pl of samples were
added to a 96-well
plate and samples were dried using a nitrogen stream. Phenyl-isothiocyanate
reagent was
used to derivatize the compounds. Samples in the plate were incubated and
dried using an
evaporator. Extraction solvent (300 pl) was added to the samples followed by
centrifugation to
drive the analytes to the lower part of the 96-well plate. Formic acid (0.2%)
in water and formic
acid (0.2%) in acetonitrile was used in dilution. The isotope-labeled internal
standards and
other standards were used to quantify each metabolite in the list using
multiple reaction
monitoring (MRM) pairs.
[00192] For LC-MS/MS analyses, chromatography was performed using
an Agilent
reversed-phase Zorbax Eclipse XDB C18 column (3.0 mm x 100 mm, 3.5 pm particle
size, 80 A
pore size) with a Phenomenex (Torrance, CA, USA) Security Guard C18 pre-column
(4.0 mm x
3.0 mm) was used to quantify the amino acids and biogenic amines. The
parameter for
chromatography was set up as follows: mobile phase A was 0.2% (v/v) formic
acid in the water,
and mobile phase B was 0.2% (v/v) formic acid in acetonitrile. The gradient
parameters were t
= 0 min, 0% B; t = 0.5 min, 0% B; t = 5.5 min, 95% B; t=6.5 min, 95% B; t =
7.0 min, 0% B; and
t = 9.5 min, 0% B. The chromatography column was set as 50 C. 10 pl of
samples were
injected into the column with the flow rate at 300 pl/min. For organic acid
chromatography was
set up as follows: mobile phase A was 0.01% (v/v) formic acid in the water,
and mobile phase B
was 0.01% (v/v) formic acid in methanol. The gradient parameters were t = 0
min, 30% B; t =
2.0 min, 50% B; t = 12.5 min, 95% B; t=12.5 min, 100% B; t = 13.5 min, 100% B;
and t = 13.6
min, and finally 30% B for 4.4 min. The column was set at 40 C. 10 pl of
samples were injected
into the column with flow rate at 300 pl/min.
[00193] For DI-MS/MS analyses, samples were directly injected into the mass
analyzer
from the autosampler. The mobile phase was set by mixing 60 pl of formic acid,
10 ml of water
and 290 ml of methanol. The flow rate was t=0 min, 30 pi/min; t=1.6 min, 30
pl/min; t= 2.4 min,
200 pl/min; t=2.8 min, 200 ul/min and t= 3.0 min, 30 pl/min. 20 pl of samples
were injected into
MS. The lipid concentration was measured semi-quantitatively using a single
point calibration of
representative metabolites obtaining by a linear regression.
[00194] For quantification of metabolites, standard calibration
(seven points) was
obtained for each of the organic acids, amino acids, and biogenic amines. The
signal ion
intensity of metabolites was corrected to the corresponding internal standards
followed by
calculating the concentration using the quadric regression with a 1/x2
weighting
- 42 -
CA 03225337 2024- 1-9
WO 2023/279213
PCT/CA2022/051078
[00195] The first row of the plate is devoted to 1 blank, 3 zero samples, 1
standard, and 3 quality
controls. The samples were delivered to the mass spectrometer using direct
infusion.47 MetIQ
software was used to control the entire assay workflow, from sample
registration to automated
calculation of metabolite concentrations to the export of data into other data
analysis programs.
A targeted profiling scheme was used to quantitatively screen for known small
molecule
metabolites using multiple reaction monitoring, neutral loss, and precursor
ion scans. Analyst
1.6.2 and MulitQuant 3Ø3 software was used for the quantification of
metabolites
concentration. Further details are previously described.47
[00196] Proton Nuclear magnetic resonance spectroscopy.
Untargeted one
dimensional (1D) 1H-NMR spectroscopy was used to identify and quantify the
serum
metabolites on days 1 and 4 post-sTBI samples using a 600 MHz Bruker
Ultrashield Plus NMR
spectrometer (Bruker BioSpin Ltd., Canada) at the University of Calgary. To
extract the
metabolites, 200 pl of serum from each patient sample was ultrafiltered using
3 KDa NanoSep
microcentrifuge filters that filters small molecules < 3 KDa for analysis. DSS
(4,4-dimethy1-4-
silapentane-1-sulfonic acid) was used as an internal reference compound to
quantify individual
compounds43. 10 pl sodium azide (NaN3) was added to all filtrates to inhibit
bacteria growth in
the sample. The final volume of samples was adjusted to 400 pl by adding D20
followed by
adjusting pH to 7.0 0.04 at room temperature". The NMR spectroscopy was
obtained in 1D
spectra using the pre-saturation pulse sequence (noesypr1d) with an optimal
water
suppression program and a mixing time of 100 milliseconds (nns).44,45 NMR
acquisition was
shimmed and calibrated based on the DSS peak at 0.0 ppm when the half-height
line width of
the DSS peak was less than 1.5 Hz. NMR spectra were obtained using 1028 scans
then zero-
filled and Fourier transformed to 128K points. All NMR spectra were corrected
for line
broadening, phasing, baseline correction based on the DSS peak at 0.0 ppm
using a Topspin
software program (Bruker BioSpin Ltd., Canada)46. ChenomX NMR Suite 7.1
software
(ChenomX Inc., Edmonton, Alberta, Canada) was used to process and profile the
NMR spectra
for the identification and quantification of metabolites. In the processing
module, NMR spectra
were manually phased followed by baseline correction, and the water peak
region was
removed from the spectra. Processed NMR spectra were then transferred to the
profiler
module. Untargeted profiling was performed in a semi-manual approach to
quantify metabolites
based on the DSS concentration at mM or mg/d1. All spectra were randomly
ordered for
untargeted profiling to avoid progressive or systematic bias. Spectroscopy
analysis has been
described previously.47
[00197] Table 20 provides a list of metabolites quantified by 1H-
NMR.
- 43 -
CA 03225337 2024- 1-9
WO 2023/279213
PCT/CA2022/051078
Table 20
Metabolites Quantified Using 1H-NMR
Metabolite Metabolite
1 2-Aminobutyrate 30 Glutamate
2 2-Hydr o xybutyrate 31 Glutamine
3 2-Hydroxyisovalerate 32 Glycerol
4 2-0xoglutarate 33 Glycine
2-0xoisocaproate 34 Histidine
6 3-Hydroxybutyrate 35 Hypoxanthine
7 3-Hydroxyisovalerate 36 Isobutyrate
8 3-Methyl-2-oxovalerate 37 Isoleucine
9 4-1-lydroxybutyrate 38 Isopropanol
to Acetate 39 Lactate
11 Acetoacetate 40 Leucine
12 Acetone 41 Lysine
13 Adipate 42 Mannose
14 Alanine 43 Methionine
Arginine 44 N-Acetylaspartate
16 Asparagine 45 N-Acetyltyrosine
17 Aspartate 46 0-Phosphocholine
18 Betaine 47 Ornithine
19 Camitine 48 Phenylalanine
Choline 49 Proline
21 Citrate 50 Pyruvate
22 Creatine Si Serine
23 Creatinine 52 Succinate
24 Dimethyl sulfone 53 Tau rifle
Dimethylamine 54 Threonine
26 Formate 55 Tyrosine
27 Fumarate 56 Urea
28 Gluconate 57 Valine
29 Glucose 58 Beta-Alanine
[00198] Data Analysis. PCA was performed initially to find the
trends, similarity,
5 clustering and outliers (technical and biological outliers). PCA was
performed as an
unsupervised analysis to examine the metabolomics data before applying
supervised analyses
including partial least square discriminant analysis (PLS-DA), statistically
inspired modification
of partial least squares analysis (SIMPLS) and artificial neural network (ANN)
analysis.
[00199] For MVA, the sensitivity, specificity, and AUC were
calculated for PLS-DA
10 models using prediction analysis and multivariate misclassification.
Following a standard
protocol, the prediction models were selected and verified based on
performance parameters
R2Y (or R2, goodness of fit), Q2Y (or Q2, goodness of prediction) and p value
(level of
significance) through a cross-validation (CV) method. CV was performed based
on the leave-
one-out cross validation (LOOCV) to assess generalizability of the results
using an independent
15 data set. These parameters are assigned for assessing the reliability,
predictability and
- 44 -
CA 03225337 2024- 1-9
WO 2023/279213
PCT/CA2022/051078
significance level of a mode1.48 The prediction models were built using the
most differentiating
metabolites based on a variable importance in projection (VIP) level >1Ø
Additionally, in order
to minimize the metabolites in a model but still be predictable, the best
prediction models were
selected according to the criteria including the highest Q2, with a
significant p-value, with
sensitivity and specificity > 85% and with an AUC > 0.90. This approach did
not change the
topmost important metabolites but dropped the less important metabolites in
the prediction
models. Permutation tests were performed using 200-times testing and this was
applied to each
prediction model to verify the Q2 value and help ensure the data was not
overfit. Coefficient
plots were applied to illustrate the most differentiating metabolites obtained
by the prediction
models (PLS-DA). The Coefficient plot, by default, displays the coefficients
referring to scaled
and centered data for a given response, with 95% confidence intervals derived
from jack-
knifing. Statistically inspired modification of PLS (SIM PLS), an alternative
approach to PLS
regression49, was performed to build prediction models using clinical data and
for the
combination of clinical and metabolite variables. Also, artificial neural
network (ANN) and
predictor screening analysis were applied to extract more information from
metabolomics
datasets and clinical variables as well as internal validation of prediction
models obtained by
PLS-DA and SIMPLS. ANN, as a supervised nonlinear approach, was used to
classify
metabolomics data particularly for model data where the relations or functions
are not known. In
this study, ANN was a suitable complementary method to PLS analysis due to
identification of a
subset of the variables with maximal explanatory power. ANN provided an
interpretable
description of biological data using prediction models obtained by training
and validation
subsets.59 ANN was performed through launching two types of prediction models:
training, and
validation models using the most differentiating metabolites (VIP>1.0)
obtained by PLS.
Partition analysis (PA) was performed to find the relationship between the
clinical variables and
GOSE outcomes at 3 and 12 months. The algorithm of PA finds all possible
splits of the clinical
variables to best predict GOSE outcomes. PA can classify the patients using
cutoff points of
each clinical variable with either continuous or ordinal values. Cross-
validation ANOVA (CV-
ANOVA) and permutation test (200 times) analyses were performed as internal
validation and
to verify the predictability of the models.
[00200] Statistical Analysis. Multivariate analysis and machine learning
were used to
determine which serum metabolites were associated with favorable versus
unfavorable
Glasgow outcome scale extended (GOSE) outcomes. Principal component analysis
(PCA) was
used as a multi-variable analysis method to examine the variability and trends
of metabolic
profiles and to detect outliers. Partial least squares discriminant analysis
(PLS-DA), a type of
- 45 -
CA 03225337 2024- 1-9
WO 2023/279213
PCT/CA2022/051078
machine learning, was used to build prognostic models. Prognostic models were
created using
the most differentiating metabolites with a variable important of the
projection (VIP) value >1Ø
SIMCA-P v15Ø2 (Sartorius Stedim Biotech, Umea, Sweden) was used for the PLS-
DA
analysis. It was further analyzed whether clinical predictors or combining
clinical predictors with
metabolomics data yielded a superior model compared to metabolomics alone in
predicting
GOSE outcome. Statistically inspired modification of partial least squares
(SIMPLS), an
algorithm of the PLS method suitable for both nominal or continuous variables,
was used to
develop prediction models using only clinical predictors or combined clinical
with metabolites
variables for outcomes at 3 months, 12 months and for mortality at 3 months.
Developed
prognostication models were characterized by the metrics R2 (goodness of model
fit), Q2
(goodness of prediction), cross-validation p-value and permutation testing
(200 times). Artificial
Neural Network analysis (ANN) was performed to predict one response variable
(unfavorable
and/or favorable separately) using a flexible function of input variables. JMP
Pro 14.3.0 (SAS
Institute Inc. USA) was used for SIMPLS and ANN analysis. MetaboAnalyst 4.0
(available at
www.metaboanalyst.ca) was used for multivariate and univariate analysis. Area
under the
receiver operating curve (AUC), sensitivity, and specificity were obtained
using a multivariate
approach.
[00201] To build prognostic models of outcome using clinical
factors univariate analysis
was first used, followed by multivariable analysis and generated AUC. Clinical
factors with a P
> 0.05 from the univariate analysis were included in the multi-variable
models.
[00202] RESULTS
[00203] Patient Characteristics. A total of 8239 patients were
screened in the CanTBI
study; 3465 patients screened positive for TBI (42%). After informed consent,
466 adult and
pediatric patients with mild, moderate, and severe TBI were enrolled into the
prospective
CanTBI biobank and database for TBI study. There were 300 adult patients with
TBI and 59 of
these patients (19.6%) were diagnosed with severe TBI (sTBI) and included in
this study.
[00204] Table 1 of Example 1 provides detailed patient and injury
characteristics.
Patients' characteristics, clinical information, GCS at admission, GOSE
outcome distribution,
CT findings, and Marshall score. * Shows the number of patients with the
clinical information
and the percentage of total patients, others included without clinical
information, and missing
information. ** the number of patients (percentage of total) were included in
the same GCS
categorized level. t the number of patients with GOSE data at the same time. t
t the number of
patients that had the same CT findings; the rest may include patients without
CT findings or
findings missing in the study.
- 46 -
CA 03225337 2024- 1-9
WO 2023/279213
PCT/CA2022/051078
[00205] These 59 patients had a mean age of 50 years 20.6 (SD).
Figure 1 of
Example 1 shows the patient flow chart with the numbers of patients with
follow-up data at 3
and 12 months post-injury.
[00206]
Table 21 shows the clinical prognostic model results for each clinical
variable.
Patient's demographics and clinical characteristics for unfavorable (GOSE 1-4)
and favorable
(GOSE 5-8) outcome groups at 3 and 12 months. * The variables are based on the
number of
patients. 'These data included several variables that have not been shown in
detail for each
cohort. There was no significant difference for any type and location of
injury between cohorts
with favorable and unfavorable outcome at 3 and 12 months post injury.
Table 21
Clinical Variables
Prediction of GOSE 3 Month 12 Month
Patients Characteristics Poor Good p value Poor Outcome
Good p value
and clinical information Outcome Outcome (n=14) Outcome
(n=35) (n=9) (n=15)
Sex (Male/Female) 30/5 6/3 0.42 11/3 13/2
0.82
Age (mean SD) 55.4 20.4 40.5 21.0
0.03 52.0 18.7 38 19.8 0.06
Weight (mean SD) 88.5 19.5 76.4 21.1
0.08 81.7 22.6 79.3 16.1 0.75
Injury Severity Score (ISS) 56.4 22.6 35.1 12.6 <0.01 35.5 12.5
36.4 12.5 0.81
(mean + SD)
Admission-type 13 (37.1%) 2 (22.2%) 0.36
4 (28.5%) 4 (26.6%) 0.58
ER 21(60%) 7 (77.7%) 10 (71.4%)
11(73.3%)
ICU
Hypoxia (Yes/No)* 8/22 0/9 0.07 3/8 1/14
0.38
Intubated (Yes/No)* 21/13 7/2 0.61 11/3 10/5
0.77
Hypotension (Yes/No)* 5/25 1/7 0.98 2/10 2/13
0.64
Paralytic-AGT (Yes/No)* 16/17 6/1 0.40 6/7 9/4
0.32
Loss Consciousness* 25/4 5/2 0.30 13/0 8/2
0.48
Location of Injury 0.70
0.52
Type of Injury 0.24
0.21
- 47 -
CA 03225337 2024- 1-9
WO 2023/279213
PCT/CA2022/051078
GCS (total) (mean + SD) 5.3 + 2.17 5.3 + 2.5 0.95 4.5 +
1.9 5.8 + 2.3 0.11
GCS-Motor 2.9 1.9 2.4 2.2 0.54 2.28
2.0 2.7 2.1 0.57
GCS-Eye (mean SD) 1.5 1.1 1.0 0.0 0.14 1.4
0.99 1.6 1.3 0.68
GCS-Verbal 1.0 0.75 1.1 0.78 0.94 0.71
0.48 1.13 0.74 0.08
GCS 3-4 15 (42.5%) 5 (55.5%) 0.80 9
(64.2%) 6 (40%) 0.62
GCS 5-6 (mean SD) 6 (14.1%) 0 1(7.1%) 1(6.6%)
GCS 7-8 14 (40%) 4 (44.4%) 4 (28.5%) 8
(53.3%)
CT Findings**
Diffuse Axonal Injury 5/20 0/7 0.57 2/7
2/11 0.62
Mid Shift 6/18 4/3 0.41 4/4 6/7
0.16
Skull Fracture 209/6 3/4 0.30 7/2 9/4
0.52
Cerebral Edema 6/20 0/7 0.24 3/6
2/11 0.49
Contusion 14/12 2/5 0.33 3/6 7/6
0.47
Intracranial Hemorrage 18/8 3/4 0.53 5/4 8/5
0.63
Epidural Hemorrhage 3/23 0/7 0.62 7/2 9/4
0.11
Subdural Hemorrhage 20/6 5/2 0.34 8/2 8/4
0.86
Arachnoid Hemorrage 22/4 5/2 0.37 6/3 8/5
0.16
Marshall Score
I 0 0 0 0
II 17 3 4 6
III 4 1 0.19 1 2
0.37
IV 3 0 3 1
V 2 3 1 4
[00207] Only, age and injury severity score (ISS) were
significantly (p <0.05) associated
with unfavorable outcome at 3 months, but not significant at 12 months. There
was a significant
difference in age and ISS between patients who died (n=21) and those who
survived (n=23) at
3 months, with older age and higher ISS associated with unfavorable outcome.
The cut points
of !SS and age were determined at <75 and 49, respectively, the significant
predictors to
separate non-survivors from survivors at 3-month. Also, the cut points were
calculated for
Marshall score=4 and GCS=6 between non-survivors and survivors. These two
variables were
not statistically significantly different between the two cohorts.
[00208] Identified, Quantified Metabolites. 130 and 58 metabolites from
different
metabolite classes were identified and quantified using targeted DI/LC-MS/MS
and untargeted
1H-NMR, respectively, as outlined in Table 19 and Table 20.
[00209] Twenty-four of the 30 common metabolites measured by each
technique had a
similar trend of change, showing the accuracy of both techniques.
[00210] Metabolomics for the prognosis of 3 and 12 month outcomes of sTBI.
The
prediction models described illustrated that a serum metabolic biosignature
can be used to
prognosticate GOSE outcome at 3 and 12 months and the mortality outcome at 3
months.
- 48 -
CA 03225337 2024- 1-9
WO 2023/279213
PCT/CA2022/051078
[00211]
Unsupervised PCA showed a relatively good grouping between cohorts with
unfavorable and favorable outcome using all metabolites detected in serum
samples collected
on days 1 and 4. PCA revealed a high level of variability (R2X>0.5) of
metabolic biosignature
between two cohorts. Metabolic biosignatures obtained by DI/LC-MS/MS using
samples on day
4 presented clearer groupings between unfavorable and favorable cohorts
compared with 1H-
NMR and samples on day 1. PLS-DA-based analysis demonstrated a good predictive
(Q2>0.5),
highly significant (p <0.001) and highly sensitive and specific (>99%)
prediction model to
discriminate between patients with unfavorable vs favorable outcomes using a
serum metabolic
biosignature on day 4 obtained by DI/LC-MS/MS.
[00212] Table 22
shows the prediction models' characteristics show a higher
predictability of metabolic profiles on day 4 than day 1 post-sTBI for 3 and
12 month GOSE and
mortality at 3 month outcome_ Additionally, the metabolic profiles obtained by
DI/LC-MS/MS are
more predictive than 1H-NMR results. R2, the goodness of fit of the model; Q2,
the goodness of
prediction of the model: and AUC, area under the receiver operating curve of
the model.
Table 22
Prediction Model Characteristics
Prognosis Analytical Sampling R2 Q2 p
value Sensitivity Specificity AUC
Platforms Time
Metabolites
Poor vs. MS/MS Day 1 0.60 0.40 0.0004 93 100 0.99
26
Good
outcome Day 4 0.75 0.54 0.0003 100 100
1.00 24
3-month
11-1-NMR Day 1 0.47 0.25 0.017 72 100
0.92 10
Day 4 0.75 0.59 0.0001 100 96
1.00 9
Poor vs. MS/MS Day 1 0.88 0.58 0.0002 100 100 0.99
21
Good
outcome Day 4 0.79 0.62 0.0004 100 100 0.98
29
12-month
'H-NMR Day 1 0.64 0.46 0.003 76 91
0.91 12
Day 4 0.7 0.41 0.044 100 100
1.00 9
Mortality MS/MS Day 1 0.54 0.35 0.002 79 100
0.98 19
outcome
Day 4 0.76 0.50 0.0006 100 100
1.00 16
11-I-NMR Day 1 0.50 0.24 0.01 84 87
0.88 17
Day 4 0.61 0.39 0.011 91 90
0.96 16
- 49 -
CA 03225337 2024- 1-9
WO 2023/279213
PCT/CA2022/051078
[00213] Nonetheless, day 1 metabolic biosignatures were also
significant predictors for
GOSE outcomes. The permutation analysis (200 times permuted, not shown)
verified that the
models are valid and unlikely to be overfit. Artificial neural network
analysis (ANN), a machine
learning-based analysis indicated the higher predictability (AUC>0.90) for the
prognosis of
GOSE outcome among patients with unfavorable outcome compared with patients
with
favorable outcome at 3 months and higher predictability (AUC>0.90) for the
prognosis of GOSE
outcome among patients with favorable outcome compared with patients with
unfavorable
outcome at 12-month. This is based primarily on DI/LC-MS/MS data on day 4.
[00214] Further analyses were performed to illustrate the
relative correlation of the most
differentiating metabolites between unfavorable and favorable outcomes for
each prediction
model-based list of metabolites including 9 to 26 metabolites for different
models.
[00215]
Table 23 shows relative concentration correlation of the metabolite
alterations
between the two cohorts with unfavorable and favorable GOSE outcome at 3
months on day 1
post-injury samples based on the DI/LC-MS/MS dataset. Fold change is also
displayed for each
metabolite.
Table 23
GOSE 3-month (Day 1) MS/MS
Fold Change is Increase or Decrease in Patients with Unfavourable Outcome
Name Mean (SD) of Favorable Mean (SD) of Unfavorable p-
value Fold Change Unfavorable/
outcome Outcome
Favorable
LYSOC17:0 0.530 (0.091) 0.732 (0.241) 0.0003
1.38 UP
LYSOC16:0 38.088 (9.033) 48.442 (14.023)
0.0422 1.27 Up
LYSOC18:0 8.556 (2.083) 12.521 (4.367) 0.0662
(W) 1.32 Up
C18 0.024 (0.005) 0.032 (0.012) 0.0662
(W) 1.32 Up
C18:2 0.032 (0.010) 0.046 (0.023) 0.0295
(W) 1.45 Up
Histidine 96.527 (22.009) 77.035 (18.290) 0.009 -1.25
Down
Glutamine 467.018 (72.297) 364.854 (105.588) 0.0092
-1.28 Down
Methionine 18.537 (2.669) 15.130 (5.773) 0.0152
-1.23 Down
Phenylalanine 77.266 (20.639) 62.451 (16.749) 0.0292 -1.24
Down
Glutamic acid 65.982 (21.544) 50.805 (17.553) 0.0327 -1.3
Down
Tyrosine 35.836 (7.295) 29.787 (7.877) 0.0433
-1.2 Down
Methionine- 0.901 (0.302) 0.605 (0.256) 0.0065
(W) -1.49 Down
sulfoxide
Isoleucine 63.284 (16.785) 47.666 (22.718) 0.0180
(W) -1.33 Down
Asparagine 30.707 (6.731) 24.935 (9.329) 0.0180
(W) -1.23 Down
Threonine 72.222 (15.831) 63.244 (37.829) 0.0273
(W) -1.14 Down
Leucine 130.653 (38.222) 103.716 (55.160) 0.0466
(W) -1.26 Down
PC322AA 3.378 (1.151) 2.607 (0.821) 0.0466
(W) -1.3 Down
- 50 -
CA 03225337 2024- 1-9
WO 2023/279213
PCT/CA2022/051078
SM20:2 0.900 (0.454) 0.611 (0.239) 0.0479 (W) -
1.47 Down
[00216] Table 24 shows relative concentration correlation of the
metabolite alterations
between the two cohorts with unfavorable and favorable GOSE outcome at 3
months on day 4
post-injury samples based on the MS/MS dataset. Fold change is displayed for
select
metabolites.
Table 24
GOSE 3-month (Day 4) MS/MS
Name Mean (SD) of Mean (SD) of p-value
Fold Unfavorable/
Favorable Unfavorable Change
Favorable
Uric acid 174.750 (59.974) 102.108 (43.449)
0.0009 1.71 Down
Glutamine 440.799 (90.105) 354.923 (79.954)
0.0169 1.24 Down
Serine 93.096 (19.529) 74.917 (17.059) 0.0181
1.24 Down
SM 22:2 OH 5.905 (0.508) 5.177 (1.256) 0.0296
1.14 Down
Betaine 33.416 (14.184) 24.632 (8.770) 0.0475
1.36 Down
Glycine 183.912 (42.079) 155.385 (55.625)
0.0481 (W) 1.18 Down
C14:1 0.096 (0.030) 0.075 (0.043) 0.0481
(W) 1.27 Down
C16:1 0.047 (0.027) 0.031 (0.012) 0.0481
(W) 1.52 Down
PC36:0 aa 2.919 (0.693) 3.979 (1.686) 0.0197
-1.36 UP
[00217] Table 25 shows relative concentration correlation of the
metabolite alterations
between the two cohorts with unfavorable and favorable GOSE outcome at 3
months on day 1
post-injury samples based on the NMR dataset. Fold change is shown for select
metabolites.
Table 25
GOSE 3-month (Day 1) NMR
Name Mean (SD) of Mean (SD) of p-value
Fold Unfavorable/
Favorable Unfavorable Change
Favorable
Glycerol 2.583 (1.228) 5.102 (3.593) 0.0115
(W) -1.98 Up
Lactate 30.611 (8.837) 47.671 (19.590) 0.0138
(W) -1.56 Up
Serine 1.624 (0.463) 2.234 (1.027) 0.0232
(W) -1.38 Up
Glycine 1.903 (0.440) 2.716 (1.376) 0.0345
(W) -1.43 Up
Betaine 0.815 (0.323) 1.169 (0.619) 0.0402
(W) -1.43 Up
Choline 0.144 (0.034) 0.190 (0.065) 0.0402
(W) -1.32 Up
[00218] Table 26 shows relative concentration correlation of the metabolite
alterations
between the two cohorts with unfavorable and favorable GOSE outcome at 3
months on day 4
post-injury samples based on the NMR dataset. Fold change shown for select
metabolites.
- 51 -
CA 03225337 2024- 1-9
WO 2023/279213
PCT/CA2022/051078
Table 26
GOSE 3-month (Day 4) NMR
Name Mean (SD) of Mean (SD) of p-value Fold
Unfavorable /
Favorable Unfavorable
Change Favorable
Lactate 19.621 (5.153) 26.251 (3.743)
0.0006 -1.34 Up
Valine 4.350 (1.500) 6.056 (1.080) 0.0018 -1.39
Up
N-Acetylaspartate 0.517 (0.211) 0.754 (0.204) 0.0093 -1.46
Up
Arginine 1.967 (0.602) 3.101 (1.176) 0.0152 -1.58
Up
Lysine 3.325 (1.027) 4.583 (1.419) 0.03 -1.38
Up
2-Aminobutyrate 1.283 (0.477) 1.774 (0.554) 0.035 -1.38
Up
Choline 0.143 (0.048) 0.195 (0.062) 0.0406 -1.37
Up
Adipate 0.133 (0.029) 0.168 (0.065) 0.0497 -1.27
Up
Tyrosine 2.147 (0.789) 3.113 (0.688)
0.0030 (W) -1.45 Up
Gluconate 2.038 (1.507) 0.906 (0.585)
0.0099 (W) 2.25 Down
Histidine 1.161 (0.389) 1.388 (0.235)
0.0134 (W) -1.2 Up
Glutamate 1.409 (0.501) 2.475 (1.468)
0.0237 (W) -1.76 Up
Urea 0.434 (0.213) 1.009 (0.864)
0.0237 (W) -2.33 Up
Isoleucine 1.637 (0.562) 2.085 (0.602)
0.0270 (W) -1.27 Up
Alanine 3.529 (1.538) 4.811 (1.147)
0.0349 (W) -1.36 Up
Leucine 2.788 (0.816) 3.610 (1.135)
0.0446 (W) -1.29 Up
[00219]
Table 27 shows relative concentration correlation of the metabolite
alterations
between the two cohorts with unfavorable and favorable GOSE outcome at 12
months on day 1
post-injury samples based on the MS/MS dataset. Fold change is shown for
select metabolites.
Table 27
GOSE 12-month (Day 1) MS/MS
Name Mean (SD) of Mean (SD) of p-value Fold
Unfavorable/
Favorable Unfavorable Change
Favorable
Trans-Hydroxyproline 5.250 (1.661) 3.521 (0.957) 0.0018 -
1.49 Down
Methionine-sulfoxide 0.814 (0.328) 0.573 (0.193) 0.0221 -
1.42 Down
Acetyl-ornithine 0.568 (0.269) 0.383 (0.160) 0.0315 -
1.48 Down
Dimethylarginine A 0.394 (0.140) 0.292 (0.102) 0.0318 -
1.35 Down
Serine 74.190 (17.235) 60.344 (16.826) 0.0374 -
1.23 Down
Sperm me 0.203 (0.082) 0.147 (0.030) 0.0027 -
1.38 Down
(W)
- 52 -
CA 03225337 2024- 1-9
WO 2023/279213
PCT/CA2022/051078
PC360AE 0.897 (0.263) 0.708 (0.193) 0.0470 -
1.27 Down
(W)
[00220]
Table 28 shows relative concentration correlation of the metabolite
alterations
between the two cohorts with unfavorable and favorable GOSE outcome at 12
months on day 4
post-injury samples based on the MS/MS dataset. Fold change is shown for
select metabolites.
Table 28
GOSE 12-month (Day 4) MS/MS
Name Mean (SD) of Mean (SD) of p-
value Fold Unfavorable/
Favorable Unfavorable Change
Favorable
Tyrosine 39.250 (7.928) 46.480 (8.290) 0.0362
1.18 Up
Creatinine 126.029 (56.501) 171.078 (47.437)
0.041 1.36 Up
Betaine 36.109 (14.187) 25.021 (8.153)
0.0238 -1.44 Down
C18 0.039 (0.017) 0.024 (0.009)
0.0055 (W) -1.58 Down
C142 0.039 (0.007) 0.029 (0.017)
0.0066 (W) -1.34 Down
Aspartic acid 12.717 (7.980) 7.108 (3.371)
0.0457 (W) -1.79 Down
[00221]
Table 29 shows relative concentration correlation of the metabolite
alterations
between the two cohorts with unfavorable and favorable GOSE outcome at 12
months on day 1
post-injury samples based on the NMR dataset. Fold change is shown for select
metabolites.
Table 29
GOSE 12-month (Day 1) NMR
Name Mean (SD) of Mean (SD) of p-value
Fold Unfavorable/
Favorable Unfavorable Change
Favorable
Alanine 4.450 (1.081) 5.999 (2.521) 0.0483
-1.35 Up
3-Hydroxyisovalerate 0.048 (0.026) 0.029 (0.012) 0.0328
(W) -1.68 Down
Ornithine 0.719 (0.276) 1.183 (0.799) 0.0367
(W) 1.65 UP
[00222]
Table 30 shows relative concentration correlation of the metabolite
alterations
between the two cohorts with unfavorable and favorable GOSE outcome at 12
months on day 4
post-injury samples based on the NMR dataset. Fold change shown for select
metabolites.
Table 30
GOSE 12-month (Day 4) NMR
Name Mean (SD) of Mean (SD) of p-value
Fold Unfavorable!
Favorable Unfavorable Change
Favorable
Tyrosine 2.299 (0.680) 3.137 (0.850)
0.0156 1.36 Up
Valine 4.464 (1.181) 5.851 (1.445)
0.0193 1.31 Up
Alanine 3.903 (1.398) 5.320 (1.661)
0.0374 1.36 Up
Ornithine 1.149 (0.495) 1.588 (0.478)
0.0443 1.38 Up
Dimethyl sulfone 0.059 (0.026) 0.571 (1.041)
0.0178 (W) 9.7 Up
- 53 -
CA 03225337 2024- 1-9
WO 2023/279213
PCT/CA2022/051078
[00223] Table 31 shows relative concentration correlation of the
metabolite alterations
between non-survivor and survivor cohorts at 3 months on day 1 post-injury
based on the
DI/LC-MS/MS data.
Table 31
Mortality outcome (Day 1) MS/MS
Name Mean (SD) of Alive Mean (SD) of Died
p-value Fold Alive/Died
Change
Isoleucine 59.398 (23.850) 41.511 (16.616) 0.0066
1.43 Up
Glutamine 426.519 (101.926) 341.101 (96.682) 0.0068
1.25 Up
Histidine 87.192 (22.533) 74.265 (15.755) 0.0345
1.17 Up
C3:1 0.042 (0.013) 0.050 (0.011) 0.0532
-1.17 Down
Valine 156.222 (50.515) 121.700 (37.588) 0.0177
(W) 1.28 Up
Leucine 127.249 (60.615) 89.486 (34.529) 0.0261
(W) 1.42 Up
Citrulline 20.039 (8.801) 15.305 (7.297) 0.0278 (W)
1.31 Up
PC38:0AA 1.164 (0.351) 1.290 (0.285) 0.0364 (W)
-1.11 Down
[00224] Table 32 shows relative concentration correlation of the metabolite
alterations
between non-survivor and survivor cohorts based on day 4 post-injury based on
the DI/LC-
MS/MS data.
Table 32
Mortality outcome (Day 4) MS/MS
Name Mean (SD) of Alive Mean (SD)
of Died p-value Fold Died/Alive
Change
Taurine 50.190 (16.576) 32.495 (15.675)
0.0062 1.54 Down
Glutamine 410.051 (84.099) 324.887 (74.218)
0.0076 1.26 Down
LYSOC26:0 0.511 (0.181) 0.334 (0.152) 0.0088
1.53 Down
C6 0.086 (0.046) 0.052 (0.016) 0.0009
(W) 1.66 Down
C12:1 0.223 (0.070) 0.171 (0.058) 0.0227
(W) 1.31 Down
Creatinine 141.578 (62.375) 97.911 (65.780)
0.0317 (W) 1.45 Down
C14:1 0.086 (0.032) 0.071 (0.052) 0.0353
(W) 1.21 Down
C8 0.239 (0.224) 0.141 (0.039) 0.0392
(W) 1.7 Down
Glycine 176.007 (54.428) 141.751 (46.064)
0.0435 (W) 1.24 Down
C10 0.169 (0.126) 0.114 (0.036) 0.0435
(W) 1.48 Down
[00225]
Table 33 shows relative concentration correlation of metabolite alterations
between non-survivor and survivor cohorts at 3-mos on day 1 post-injury based
on NMR data.
Table 33
Mortality outcome (Day 1) NMR
Name Mean (SD) of Alive Mean (SD) of Died
p-value Fold Change Died/Alive
- 54 -
CA 03225337 2024- 1-9
WO 2023/279213
PCT/CA2022/051078
Glucose 261.897 (75.982) 322.188 (92.781) 0.0226
-1.23 Up
Fumarate 0.032 (0.014) 0.044 (0.018) 0.0255
-1.35 Up
Isoleucine 1.303 (0.538) 0.991 (0.358) 0.0177 (W)
1.32 Down
Betaine 0.896 (0.309) 1.315 (0.733) 0.0230 (W)
-1.47 Up
Leucine 2.468 (0.983) 1.927 (0.753) 0.0401 (W)
1.28 Down
Citrate 4.176 (1.657) 5.500 (2.384) 0.0477 (W)
-1.32 Up
[00226]
Table 34 shows relative concentration correlation of the metabolite
alterations
between non-survivor and survivor cohorts at 3-mos on day 4 post-injury based
on NMR data.
Table 34
Mortality outcome (Day 4) NMR
Name Mean (SD) of Mean (SD) of p-value Fold
Change Alive/Die
Alive Died
d
Valine 5.110 (1.184) 6.349 (1.320) 0.0121
-1.24 Up
Lysine 3.668 (1.206) 4.961 (1.535) 0.0154
-1.35 Up
Isobutyrate 0.183 (0.056) 0.238 (0.068) 0.0223
-1.3 Up
2-Aminobutyrate 1.478 (0.426) 1.918 (0.632) 0.0301
-1.3 Up
Gluconate 1.458 (1.041) 0.667 (0.376) 0.0016
(W) 2.19 Down
Betaine 1.125 (0.387) 0.830 (0.359) 0.0346
(W) 1.35 Down
3-Hydroxyisovalerate 0.096 (0.216) 0.067 (0.029) 0.0387
(W) 1.44 Down
[00227] A predictive metabolic biosignature to predict GOSE outcome at 3-
months was
characterized by an increased in lysoPCs, propionic acid, stearic acid, oleic
acid, linoleic acid,
myristic acid, choline, acylcarnitine, glycerol, glucose, lactate, pyruvate,
tryptophan,
homocysteine, and ketone bodies (2-hydroxybutyric acid, acetoacetate, and
acetone) on the 1st
day post-injury yielding an unfavorable outcome. Interestingly, a predictive
metabolic
biosignature on day 4 showed increased glutamate (excitotoxicity),
phenylalanine, tyrosine,
kynurenine , NAA, aspartate, and branched chained amino acids (valine,
leucine, and
isoleucine) in those with an unfavorable outcome, while these metabolites were
decreased on
day 1 post-injury. For prognosis of GOSE at 12-months, patients with
unfavorable outcome
were characterized by increased lysoPCs, short chain ACs, palmitic acid, oleic
acid, linoleic
acid, lactate, gluconate, branched chain amino acids, carnitine, glycerol,
alanine, and a
decrease in spermine, methionine-sulfoxide, glutamate, ketone bodies,
hydroxyisovalerate
- 55 -
CA 03225337 2024- 1-9
WO 2023/279213
PCT/CA2022/051078
compounds, and dimethylamine on day 1 post-injury. 12 month unfavorable
outcome was
associated with increased lysoPCs, tryptophan, caproic acid, lauric, and
lauroleic (9-
dodecanoid) acids, oleic acid, tyrosine, branched chain amino acids and
ornithine on day 4
post-injury. To predict 3 month mortality, metabolomic analysis showed
increased glucose,
PCs, long chain acylcarnitines (oleic acid, linoleic acid, palmitoleic acid,
myristolinoleic acid,
lauroleic acid, capric acid, and myristoleic acid), TCA cycle metabolites,
tryptophan, tyrosine,
and ketone bodies in deceased patients on day 1 and 4 post-injury. Deceased
patients showed
decreased short chain acylcarnitines, glutamine, and betaine on day 4.
Univariate T-test
analysis showed remarkable similarities to PLS-based prediction models to
identify predictive
biomarkers.
[00228] A brief overview highlights that unfavorable outcome was
associated with
increased metabolites related to lipids and anaerobic metabolism and decreased
metabolites
related to serotonergic, polyamine metabolism and NMDA receptor integrity in
day 1 post-injury.
Increased metabolites related to neuroinflammation, excitotoxicity and brain
injury specific
biomarkers were found on day 4 post-injury. Also, notable was an association
of increased
metabolites related to acylcarnitines metabolism and energy metabolism with
mortality.
[00229] Clinical variables for the prognosis of GOSE outcome at 3
month, 12
months, and mortality. It was investigated whether clinical variables could
predict the
outcome of sTBI at 3 and 12 months post sTBI. Statistically inspired
modification of partial least
square (SIM PLS) analysis revealed the most differentiating clinical variables
for predicting
outcomes at 3 months (age, ISS, Marshall score and hypoxemia) and 12 months
(age, GCS,
hypoxemia, and loss of consciousness). However, these clinical variables had
low prediction
capacity (Q2<0.16) and less sensitivity (66%) and specificity (86%) compared
to metabolites
(Table S6). SI MPLS analysis of clinical data revealed that age and severity
of illness score
(ISS) are useful predictors (Q2= 0.37, AUC= 0.86) to prognosticate mortality.
However, these
clinical variables lack significant sensitivity and specificity (66%-83%)
compared to
metabolomics data.
[00230] The prognosis of the unfavorable GOSE outcome cohort
showed different
predictabilities at 3 and 12 months. ANN revealed that the prediction of
unfavorable GOSE
outcome was more accurate (AUC>0.97) than the prediction of favorable GOSE
outcome
according to training and validation sets (Table S4). A higher level of
predictability for the
prognosis of unfavorable GOSE outcome was observed using day 4 samples and the
DI/LC-
MS/MS dataset compared to the day 1 dataset. Of note, the DI/LC-MS/MS dataset
was better
than the 1H-NMR dataset in predicting unfavorable GOSE outcome at 3 months.
While the
- 56 -
CA 03225337 2024- 1-9
WO 2023/279213
PCT/CA2022/051078
prognosis of favorable GOSE outcome was more predictive than the prognosis of
unfavorable
outcome at 12 months using both training and validation sets in ANN analysis
of 1H-NMR
dataset. Further analysis showed that the prognosis of GOSE outcome at 12
months overall
was slightly less predictive than the prognosis of GOSE outcome at 3 months.
Overall, the
prognosis of 12 month GOSE outcome was less predictable than the prognosis of
3 month
GOSE outcome.
[00231] ANN analysis indicates the prognosis of unfavorable
outcome is more predictive
than the prognosis of favorable GOSE outcome at 3 months. In addition, there
is a higher
predictability using day 4 data compared to day 1 data according to both
training and validation
sets. Further, ANN analysis indicates the prognosis of favorable GOSE outcome
is more
predictive than the prognosis of unfavorable outcome at 12 months as well as
higher
predictability of day 4 samples post sTBI compared to day 1 samples post sTBI.
[00232] SIMPLS analysis was used for the prediction of GOSE
outcome using the most
differentiating metabolites (VIP > 1) (metabolomics) and a combination of the
most
differentiating metabolites (with VIP >1) and the most differentiating
clinical variables (VIP > 1).
Only prediction models where the combined use of clinical variables and
metabolomics could
improve the predictability compared to metabolomics only prediction models;
notably the 12
month prediction models were not improved with the clinical variables, and
therefore are not
shown here.
[00233] Figure 9A and Figure 9B show predictor screening analysis,
illustrating the
importance of clinical variables in the prediction models for the prognosis of
GOSE outcome
based on Day 1 serum samples (Figure 9A) and Day 4 (Figure 9B) serum samples
at 3
months and 12 months using DI/LC-MS/MS data. The figures present the ranking
of
metabolites and clinical variables in each prediction model.
[00234] Identified, quantified metabolites using DI/LC-MS/MS and 1H-NMR.
130 and
58 metabolites were quantified using targeted DI/LC-MS/MS and untargeted 1H-
NMR,
respectively (Table 19 and Table 20). The quantified metabolites by the DI/LC-
MS/MS platform
included 75 lipids (glycerophospholipids, acylcarnitines, sphingomyelins), 22
amino acids, 23
biogenic amines, 17 organic acids, and several compounds from different
metabolite classes.
In addition, the quantified metabolites by 1H-NMR included 22 amino acids, 20
organic acids, 4
sugars and 12 biogenic acids for a total of 58 metabolites. Though there are
several common
metabolites between DI/LC-MS/MS and 1H-NMR methods, the approaches to identify
and
quantify metabolites were completely different between the techniques. Both
techniques were
quantitative analyses in this study, but the quantification of metabolites was
based on the ion
- 57 -
CA 03225337 2024- 1-9
WO 2023/279213
PCT/CA2022/051078
intensities of metabolite fragmentations and the physical-chemistry of the
hydrogen atom
(proton 1H) in intact metabolites for DI/LC-MS/MS and 1H- NM R, respectively.
Further analysis
showed that 80% (24 out of 30) of the overlapping metabolites followed a
similar trend of
change that illustrates the accuracy of both techniques.
[00235] Patients' demographics, clinical information and CT findings
between non-
survivors and survivors' cohorts.
[00236] There was a significant difference in age and ISS between
patients who died
(n=21) and those who survived (n=23) at 3 months, with older age and higher
ISS associated
with unfavorable outcome.
[00237] Characterization of metabolite biosignature for the prognosis of
GOSE
outcome. A large number of metabolites contributed to the highly predictive
(02>0.5) and
significant separation (AUC>0.99) between cohorts with unfavorable and
favorable GOSE
outcomes at 3 and 12 months as well as non-survivors vs. survivors at 3
months. Nonetheless,
further analyses showed that one may be able to decrease the number of
metabolites and still
build reasonable predictive (Q2>0.4) and accurate (AUC>0.90) models as shown
in tables S4-
S6. As the metabolites used in the models are decreased, there is an
associated lower
sensitivity (<80), specificity(<80), and AUC (<0.75) (data not shown). The
following metabolic
biosignature characterizations are based on the best prediction models.
[00238] 3 month prognosis. Unfavorable outcome was characterized
by an increase in
lysophosphatidylcholine (lysoPCs), propionic acid, stearic acid, oleic acid,
linoleic acid, myristic
acid, choline, glycerol, glucose, lactate, pyruvate, tryptophan, homocysteine,
and ketone bodies
(2-hydroxybutyric acid, acetoacetate, and acetone) on theist day post-injury,
while glutamate,
phenylalanine, tyrosine, kynurenine, NAA, aspartate, and branched chained
amino acids
(valine, leucine, and isoleucine) increased from the 1s1 day to the 41h day
post-injury.
[00239] 12 month prognosis. Unfavorable outcome was characterized by an
increase
in lysophosphatidylcholines (lysoPCs), short chain acylcarnitines (ACs),
palmitic acid, oleic
acid, linoleic acid, lactate, gluconate, branched chain amino acids,
carnitine, glycerol and
alanine and a decrease in spermine, methionine-sulfoxide, glutamate, ketone
bodies,
hydroxyisovalerate compounds, and dimethylamine on day 1 after injury. On day
4 after injury
there was an increase in lysoPCs, tryptophan, caproic acid, lauric acid,
lauroleic acids, oleic
acid, tyrosine, branched chain amino acids, and ornithine and a decrease in
spermine,
spermidine, PCs, most medium and long chain ACs and serotonin in patients with
unfavorable
outcome vs. the patients with favorable GOSE outcome at 12 months.
- 58 -
CA 03225337 2024- 1-9
WO 2023/279213
PCT/CA2022/051078
[00240] Prognosis of Mortality. Non-survivors were characterized
by an increase in
glucose, PCs, long chain acylcarnitines (oleic acid, linoleic acid,
palmitoleic acid, myristolinoleic
acid, lauroleic acid, capric acid, and myristoleic acid), TCA cycle
metabolites, tryptophan,
tyrosine, and ketone bodies on days 1 and 4 post-injury. There was a decrease
in short chain
acylcarnitines, glutamine and betaine that were correlated with a non-survival
outcome on day
4 post injury.
[00241] The combination of metabolomics and clinical variables
for the predicting
GOSE outcome at 3 and 12 months post-injury. SIMPLS analysis demonstrated that
clinical
variables could moderately improve the performance of metabolomics-based
prediction models
to prognosticate only GOSE outcome at 3 months and mortality. For the
prognosis of GOSE
outcome at 12-month, clinical variables were found to minimally improve the
metabolomics
model (data not shown). However, age was an important clinical predictor of
outcome among
clinical variables, with a high level of contribution to prediction models,
particularly for mortality.
Consequently, Marshall score (3 months outcome) and GCS (12 months outcome)
remain
important clinical variable (Table S8). Although SIMPLS and PLS-DA use
different algorithms,
the two approaches showed overall similar predictabilities when metabolites
were used to
prognosticate sTBI outcomes, with only slight differences. Importantly,
permutation tests (not
shown) verified the predictabilities of metabolite-based prediction models and
was used to help
prevent overfitting of the data.
[00242] DISCUSSION
[00243] The current findings show that metabolite alterations on
days 1 and 4 post-sTBI
were highly-predictive and well-correlated with GOSE unfavorable and favorable
outcomes at 3
and 12 months and importantly, may also be used as a promising prognostic tool
to predict the
worst GOSE outcome, i.e., death. The metabolic biosignatures on day 4 post-
injury were more
predictive and significant to prognosticate 3 and 12 month outcomes. From a
total of 160
metabolites, multivariate analysis revealed that several metabolites
contributed to the
separation of groups with unfavorable versus favorable outcome, implying
fundamental
metabolic alterations with sTBI that allows one to predict outcome with good
sensitivity,
specificity, and AUC. The higher predictability of serum metabolic
biosignatures on day 4 for the
prognosis of outcomes may reflect the contribution of secondary brain injury
in addition to
primary brain injury (reflected by day 1 metabolites) that correlates with
outcome. A remarkable
similarity was found for the trends in changes in metabolites measured by two
distinct
methodologies, showing a high level of accuracy of quantification using two
different analytical
platforms. The current study demonstrated that subtle changes in the metabolic
profiles
- 59 -
CA 03225337 2024- 1-9
WO 2023/279213
PCT/CA2022/051078
correlate with known and unknown pathophysiological pathways that can be
applied to predict
3 and 12 month outcomes.
[00244] Metabolomics appeared to be superior to patients'
demographics, clinical
features, and CT findings in predicting GOSE outcome at 3 and 12 months post
injury. Notably,
the combination of metabolomics with clinical and CT variables enhanced the
metabolomics
prognostication of sTBI outcome in the early days post-injury, though clinical
and CT data only
improved the metabolomics prediction models for the prognosis of GOSE outcome
at 3 months
but not 12 months. Addition of age, GCS, hypoxemia, injury severity score, and
Marshall score
apparently enhanced the performance of metabolomics-based prediction of
outcome. These
results were similar to the IMPACT and CRASH studies23 in their use of age,
GCS motor,
pupillary reactivity, CT classification, EDH (epidural hematoma), tSAH
(subarachnoid
hemorrhage), hypoxia, and hypotension23 and identified age, GCS motor,
pupillary reactivity,
hypoxia, hypotension and CT classification as the most important predictors of
outcomes using
multivariate analysis (AUC 0.83-0.89) that is also similar to the European
Brain Injury
Consortium Core Data (EBIC) and Traumatic Coma Data Bank (TCDB) studies.24 It
was shown
that age and ISS are the most differentiating prognostic variables for
mortality, while the
IMPACT prediction model revealed age, GCS motor score, pupillary reactivity,
hypoxia,
hypotension, basal cisterns narrowing, midline shift and tSAH as the most
predictive variables
for 14 day mortality.25 Using a multimodal approach, physiological (ICP, MAP,
CPP and pbt02)
and biochemical (pyruvate, lactate, glycine, glutamate, and glucose)
parameters could predict
sTBI outcome with approximately 90% accuracy.26 This study also demonstrates
the
importance of multivariate predictive and machine learning based-models versus
simplified
methods to determine predictive metabolites. A Bayesian networks approach
previously
showed an improvement in prediction models using variables that were not
predictive in
simplified models.27
[00245] The current study suggests that, as previously described,
increased lysoPCs in
patients with unfavorable outcome may be correlated with microvascular barrier
disruption,
promotion of oligodendrocyte demyelination and pericyte loss and with induced
inflammation.29
Increased stearic acid (C18) and its derivatives (stearic acid, oleic acid,
linoleic acid) and
lysoPCs in those with unfavorable outcome may correlate with docosahexaenoic
acid (DHA)
metabolism, a highly enriched brain lipid.30 Increased CSF levels of lysoPCs
and PCs were
previously observed in non-survivors and survivors31 respectively, and in mild
TBI patients
compared to non-concussed controls.32 Within one day post-sTBI, increased
energy-related
metabolites (lactate, glucose, and TCA cycle compounds) have been observed in
patients with
- 60 -
CA 03225337 2024- 1-9
WO 2023/279213
PCT/CA2022/051078
unfavorable outcomes. The lactate/pyruvate ratio is well-recognized as a
predictor for the
prognosis of brain injuries such as apoptosis, cerebral anoxia, and anaerobic
metabolism.33,34
There was a correlation between elevated lactate with unfavorable outcomes in
TBI, in
association with reduced cerebral blood flow (CBF), elevated ICP, and
ischemia.33,34 In this
study, increased tryptophan, kynurenine, tyrosine, phenylalanine, and
glutamate on day 4 post-
injury may intriguingly imply the correlation of excessive excitotoxicity
mechanisms35 and
aromatic amino acid metabolism36 with unfavorable outcome. Increased
quinolinic acid, the final
product of the tryptophan-kynurenine pathway, has been associated with the
inflammatory
response due to infiltration of macrophages and activation of microglia in the
CNS37 and with
unfavorable outcome and mortality in sTBI, indicating the possibility of
elevated macrophage-
derived (or microglia-derived) excitotoxins in the contribution of secondary
injury to poor
outcome.37,38 In addition, day 4 increased NAA and phenylalanine, two well-
known
neurotransmitters in patients with unfavorable outcomes, may be associated
with alteration of
osmolality and catecholaminergic mechanism of injury.39 The current data also
showed the
association of day 1 hyperglycemia and increased lactate with poor outcome.
Hyperglycemia
and hyperlactatemia have been previously shown to be potential predictors for
the prognosis of
unfavorable TBI outcome:49-42
[00246] Current findings provide novel evidence of targeted
metabolomic profiling for the
prognosis of short and long-term GOSE outcome using serum samples at days 1
and 4 post-
injury. A combination of amino acids, organic acids, fatty acids, clinical and
CT findings as
variables were defined to prognosticate GOSE outcome of sTBI among adult
patients.
[00247] Limitations of the current study include a relatively
small sample size, not all
patients had GOSE outcomes measured (lost to follow-up), and there was a
skewed cohort
towards males (not uncommon in TBI studies), thus a larger and gender-balanced
cohort could
be used to further affirm these findings. It is controversial what role blood
and blood product
transfusion in trauma care plays in metabolites found in serum. In this study
15 patients had
blood or blood product transfusion between 1 to 4 units. The transfusion was
performed for 8
out of 15 patients after day 1 post injury and for 2 patients after day 4 post
injury (thus not
affecting measured metabolites), however the impact on serum metabolites is
uncertain for
those samples collected after transfusion. Further analysis on patients'
demographics and
clinical symptoms on admission date showed a random effect of those patients
lost to follow up
(i.e. there was no systematic loss to follow-up noted). Despite these
limitations, this study
shows great promise in using metabolomics to evaluate sTBI, particularly for
prognostic
assessment.
- 61 -
CA 03225337 2024- 1-9
WO 2023/279213
PCT/CA2022/051078
[00248] Metabolic profiling of sTBI patient samples beyond the
first 4 days may
potentially enhance the predictability of metabolomics to prognosticate
outcome and may
provide more definitive information about molecular changes post sTBI,
especially in those who
have a favorable outcome of sTBI. Also, applying an untargeted mass
spectrometry approach
may help identify more known and unknown metabolites that may be correlated
with sTBI
prognosis and help to more clearly define the mechanisms of injury in sTBI
(for both primary
and secondary injury).
[00249] In this study the prognostication models showed highly
predictive and significant
separation between sTBI patients with unfavorable and favorable outcomes using
serum
metabolomics with remarkable similarities between two different metabolomics
analytical
platforms while the patients' demographics and clinical variables were not
strong independent
predictors of GOSE outcome. Importantly, the information derived from
metabolomics and
prediction models may be used to stratify patients with sTBI that can be
applied in future clinical
trials, especially therapeutic trials as a means of prognostic enrichment.
Targeted DI/LC-
MS/MS (including multiple lipid metabolites) appears to be superior to 1H-NMR
to predict sTBI
outcome and this information may be useful for future studies.
[00250] In summary, the best prognostic metabolomics models for
unfavorable 3 month
and 12 month GOSE outcomes include increased glycolytic metabolites,
hyperglycemia, and
lactate on day 1, increased aromatic amino acids (tryptophan, tyrosine, and
phenylalanine) on
day 4, metabolites involved in excitotoxicity (increased glutamate), increased
neuroinflammation metabolites (increased lysoPCs and kynurenine) on both days
1 and 4,
increased neurobiomarkers (increased NAA and tyrosine), decreased ketone
bodies,
decreased urea cycle metabolites and degradation of branched chain amino acids
(BCAA) on
day 4.
[00251] Example 1B
[00252] Metabolomic Profiles in Serum: Metabolite Lists,
Sensitivity, Specificity,
and Modeling for Predicting Global Functional Neurological Outcome at 3 And 12
Months And Death at 3 Months Following Severe Traumatic Brain Injury
[00253] The information from Example 1 and Example 1A was further
analyzed in the
context of most predictive metabolites depending upon stated conditions of: i)
whether the
blood sample was taken from Day 1 vs Day 4; ii) whether 3-month vs 12-month
GOSE outcome
was assessed; iii) whether and whether MS/MS versus NMR analysis was used; iv)
whether
mortality outcome was assessed. Larger metabolite groups were compared with
smaller
- 62 -
CA 03225337 2024- 1-9
WO 2023/279213
PCT/CA2022/051078
metabolite subsets to determine an optimal test in which sensitivity and
sensitivity were
adequately high relative to accurately predict outcome based on a minimum set
of metabolites.
[00254] In this example, the metabolites of interest are assessed
as biomarkers, such
that the number of metabolomic variables are minimized and optimized to
develop significant
predictive models while using the fewest biomarkers to accurately represent
the parameter of
poor vs. good outcome, GOSE at 3-month or 12-month; or mortality. Prediction
models were
assessed with decreasing number of metabolites using PLS-DA modeling.
[00255] The following tables show change relative to control for
specific metabolites
under the conditions as indicted.
[00256] Table 35A indicates MS/MS profile of a Day 1 serum sample, GOSE 3-
month for
26 metabolites.
Table 35A
MS/MS Day 1, GOSE 3-month (26 metabolites)
Metabolites P- Fold Poor /Good
value Change outcome
Lyso PC 17:0 0.003 1.38 Up
Lyso PC 18:0 0.0066 1.32 Up
03:1 0.437 1.08 Up
Lyso PC 16:0 0.0422 1.27 Up
Lyso PC 18:1 0.115 1.27 Up
018:2 0.0295 1.45 Up
C14 0.0662 1.32 Up
C18 0.0066 1.32 Up
C18:1 0.0062 1.34 Up
C16 0.0757 1.26 Up
C14:2 0.204 1.45 Up
Tyrosine 0.0433 -1.2 Down
Asparagine 0.018 -1.23 Down
PC ae 36:0 0.0606 -1.26 Down
C16:2 0.3358 1.3 Up
Phenylalanine 0.0292 -1.24 Down
C16:1 0.373 1.22 Up
Glutamine 0.0092 -1.28 Down
SM 20:2 0.479 -1.47 Down
PC aa 32:2 0.0466 -1.3 Down
Isoleucine 0.018 -1.23 Down
Citrulline 0.0538 -1.38 Down
- 63 -
CA 03225337 2024- 1-9
WO 2023/279213
PCT/CA2022/051078
Histidine 0.009 -1.25 Down
Glutamate 0.0327 -1.3 Down
Methionine-Sulfoxide 0.0066 -1.49 Down
Asymmetric 0.0506 -1.38 Down
dimethylargine
[00257] Table 35B indicates MS/MS profile of a Day 1 serum
sample, GOSE 3-month for
13 metabolites.
Table 35B
MS/MS Day 1, GOSE 3-month (13 metabolites)
Metabolites P- Fold Poor /Good
value Change outcome
LYSOC17:0 0.003 1.38 Up
LYSOC18:0 0.0066 1.32 Up
LYSOC16:0 0.0422 1.27 Up
C18:2 0.0295 1.45 Up
C14 0.0662 1.32 Up
C18:1 0.0295 1.45 Up
C18 0.0066 1.32 Up
C16 0.0757 1.26 Up
Glutamine 0.0092 -1.28 Down
Histidine 0.009 -1.25 Down
SM 20:2 0.479 -1.47 Down
Methionine-sulfoxide 0.0066 -1.49 Down
Asymmetric dimethylarginine 0.0506 -1.38 Down
[00258] Regarding Tables 35A and 35B, a Multivariate Data Analysis (OPLS-
DA/PLS-
DA) for Day 1 serum with MS/MS analysis (Poor vs. Good outcome 3-months) is
represented in
Table 35C, showing (*) optimized prediction using 26 and 13 metabolites,
versus 48, 40, 32,
and 21 metabolites.
Table 35C
Multivariate Data Analysis (OPLS-DA/PLS-DA) - Day 1 MS/MS
(Poor vs. Good outcome GOSE 3-months)
Analytical Sampling R2 02 p Sensi Specificit AUROC VIP >
Metabolites Patients
Platforms Time value tivity y
MS/MS Day 1 0.7390.3930.0015100 100 0.99 1
48 Poor
outcome
Day 1 0.5930.3770.001 78 100 0.94
1.1 .. 40 .. N= 35
Day 1 0.5930.3920.000691 100 0.96
1.2 .. 32 .. Good
outcome
Day 1* 0.5960.3980.0004 93 100 0.99 .. 1.3 .. 26* .. N= 9
- 64 -
CA 03225337 2024- 1-9
WO 2023/279213
PCT/CA2022/051078
Day 1* 0.5580.3420.002 80 95 0.92 1.4 21*
Day 1* 0.5030.3540.001765 100 0.85 1.5 /3*
[00259] Table 36A indicates MS/MS analysis of metabolites in a
Day 4 serum sample,
predictive of GOSE 3-month for 15 metabolites.
Table 36A
MS/MS Day 4, GOSE 3-month (15 metabolites)
Metabolites P- Fold Poor /Good
value Change outcome
C3OH 0.0029 1.33 Up
Glutamic acid 0.0164 1.31 Up
LYSOC18:0 0.0155 1.49 Up
Ornithine 0.044 1.31 Up
PC aa3 6:0 0.0048 1.52 Up
018:2 0.119 1.26 Up
alpha-Aminoadipic acid 0.0339 1.33 Up
Indole acetic acid 0.172 1.93 Up
03:1 0.061 1.24 Up
PC aa 40:2 0.963 -1.01 Down
C16:1 0.249 -1.37 Down
Serine 0.264 -1.1 Down
Glutamine 0.294 -1.1 Down
13-Hydroxybutyric acid 0.0538 -5.24 Down
Uric acid 0.0422 -1.48 Down
[00260] Table 36B indicates MS/MS analysis of a Day 4 serum sample, for
prediction of
GOSE 3-month for 11 metabolites.
Table 36B
MS/MS Day 4, GOSE 3-month (11 metabolites)
Metabolites a- Fold Poor /Good
value Change outcome
C3OH 0.0029 1.33 Up
Glutamic acid 0.0164 1.31 Up
LYSOC18:0 0.0155 1.49 Up
Ornithine 0.044 1.31 Up
PC36:0AA 0.0048 1.52 Up
018:2 0.119 1.26 Up
C3:1 0.061 1.24 Up
016:1 0.249 -1.37 Down
Glutamine 0.294 -1.1 Down
beta-Hydroxybutyric acid 0.0538 -5.24 Down
Uric acid 0.0422 -1.48 Down
- 65 -
CA 03225337 2024- 1-9
WO 2023/279213
PCT/CA2022/051078
[00261] Regarding Tables 36A and 36B, a Multivariate Data
Analysis (OPLS-DA/PLS-
DA) for Day 4 MS/MS analysis (Poor vs. Good outcome 3-months) GOSE 3-month is
represented in Table 36C, showing (*) optimized prediction using 15 and 11
metabolites,
versus 54, 39, 28, or 24 metabolites.
Table 36C
Multivariate Data Analysis (OPLS-DA/PLS-DA)
Day 4 MS/MS analysis
(Poor vs. Good outcome 3-months)
Analytical Sampli R2 Q2 p value Sensitiv Specific AURO VIP
Metab Patients
Platforms ng ity ity C > olites
Time
MS/MS Day 4 0.81 0.61 5.4 x10 5 100 100 0.99 1 54 Poor
outcome
Day 4 0.82 0.662 1.2 x10 5 100 100 0.99
1.1 39
Day 4 0.754 0.568 0.0001 100 100 1 1.2 28
n= 23
Good
Day 4 0.753 0.543 0.0003 100 100 1 1.3 24
outcome
Day 4* 0.574 0.464 0.00016 100 100 1 1.4 15*
n=8
Day 4* 0.543 0.462 0.00017 82 100 0.95 1.5 11*
[00262] Table 37A indicates MS/MS analysis of a Day 1 serum
sample, for prediction of
GOSE outcome at 12-month for 21 metabolites.
Table 37A
MS/MS Day 1, GOSE 12-month (21 metabolites)
Metabolites p-value Fold Poor /Good
Change outcome
C5OH 0.6041 -1.04 Down
Homocysteine 0.344 -1.09 Up
C3 0.085 1.27 Up
CO 0.504 1.31 Up
C4 0.2898 1.26 Up
Ornithine 0.0581 1.36 Up
LYSOC14:0 0.088 1.19 Up
SM 16:1 OH 0.4628 1.05 Up
LYSOC20:3 0.234 1.13 Up
LYSOC28:1 0.1261 1.26 Up
C10:2 0.3536 -1.14 Down
Acetyl-ornithine 0.0315 -1.48 Down
C9 0.133 -1.21 Down
Adimethylarginine 0.0318 -1.35 Down
Methionine-sulfoxide 0.0221 -1.42 Down
- 66 -
CA 03225337 2024- 1-9
WO 2023/279213
PCT/CA2022/051078
Spermine 0.0027 -1.38 Down
PC ae 36:0 0.047 -1.27 Down
Citrulline 0.2172(VV) -1.17 Down
Serotonin 0.084 -1.27 Down
Serine 0.0347 -1.23 Down
trans-Hydroxyproline 0.0018 -1.49 Down
[00263] Table 37B indicates MS/MS analysis of a Day 1 serum
sample for prediction of
outcome GOSE at 12-month for 15 metabolites.
Table 37B
MS/MS Day 1, GOSE 12-month (15 metabolites)
Metabolites a- Fold Poor /Good
value Change outcome
C3 0.085 1.27 Up
Ornithine 0.0581 1.36 Up
CO 0.504 1.31 Up
SM 16:1 OH 0.462 1.05 Up
LYSOC14:0 0.088 1.19 Up
LYSOC20:3 0.234 1.13 Up
Homocysteine 0.344 -1.09 Up
Serotonin 0.084 -1.27 Down
C9 0.133 -1.21 Down
PC ae 36:0 0.047 -1.27 Down
Methionine-sulfoxide 0.0221 -1.42 Down
Serine 0.0347 -1.23 Down
Adimethylarginine 0.0318 -1.35 Down
Spermine 0.0027 -1.38 Down
trans-Hydroxyproline 0.0018 -1.49 Down
[00264]
Regarding Tables 37A and 37B, a Multivariate Data Analysis (OPLS-DNPLS-
DA) for Day 1 MS/MS analysis (Poor vs. Good outcome 12-months) GOSE 12-month
is
represented in Table 37C, showing (*) optimized prediction using 21 and 15
metabolites,
versus 43, 34, 29, or 23 metabolites.
Table 37C
Multivariate Data Analysis (OPLS-DA/PLS-DA)
Day 1 MS/MS analysis
(Poor vs. Good outcome 12-months)
Analytical Sampling R2
Q2 p value Sensitivity Specificity AUROC VIP Metabolites Patients
Platforms Time
MS/MS Day 1 0.832 0.5580.0011 100 100 0.99 1 43
Poor
Day 1 0.81 0.5 0.002 100 100 1 1.1 34
outcome,
- 67 -
CA 03225337 2024- 1-9
WO 2023/279213 PCT/CA2022/051078
Day 1 0.824 0.5480.0009 100 100 1 1.2 29 n= 14
Day 1 0.799 0.5560.0006 100 100 1 1.3 23 Good
outcome
Day 1* 0.881 0.5840.0002 100 100 0.99 1.4 21* n= 15
Day 1* 0.571 0.373 0.002 100 86 0.98 1.5 15*
[00265]
Table 38A indicates MS/MS metabolite analysis in a Day 4 serum sample,
for
prediction of GOSE 12-month for 18 metabolites.
Table 38A
MS/MS Day 4, GOSE 12-month (18 metabolites)
Metabolites P- Fold Poor /Good
value Change outcome
C6 0.151 1.36 Up
030H 0.198 1.16 Up
018:1 OH 0.532 1.06 Up
Tryptophan 0.0678 1.32 Up
03:1 0.151 1.25 Up
Tyrosine 0.0362 1.18 Up
Creatinine 0.041 1.36 Up
LysoPC 14:0 0.0911 1.16 Up
Alanine 0.176 1.17 Up
016 0.225 -1.16 Up
C2 0.186 -1.61 Down
014 0.059 -1.42 Down
Beta-hydroxy butyric 0.186 -10.21 Down
Spermine 0.079 -1.19 Down
Betaine 0.0238 -1.65 Down
014:2 0.0066 -1.34 Down
Aspartic acid 0.0457 -1.79 Down
018 0.005 -1.58 Down
[00266] Table 38B indicates MS/MS Day 4, GOSE 12-month for 13 metabolites.
Table 38B
MS/MS Day 4, GOSE 12-month (13 metabolites)
Metabolites a- Fold Poor /Good
value Change outcome
06 0.151 1.36 Up
C3 OH 0.198 1.16 Up
Tryptophan 0.0678 1.32 Up
03:1 0.151 1.25 Up
Tyrosine 0.0362 1.18 Up
Creatinine 0.041 1.36 Up
- 68 -
CA 03225337 2024- 1-9
WO 2023/279213
PCT/CA2022/051078
LysoPC 14:0 0.0911 1.16 Up
C14 0.059 -1.42 Down
Beta-hydroxy butyric 0.186 -10.21 Down
Betaine 0.0238 -1.65 Down
C14:2 0.0066 -1.34 Down
Aspartic acid 0.0457 -1.79 Down
C18 0.005 -1.58 Down
[00267]
Regarding Tables 38A and 38B, a Multivariate Data Analysis (OPLS-
DA/PLS-
DA) for Day 4 MS/MS analysis (Poor vs. Good outcome 12-months) GOSE 12-month
is
represented in Table 38C, showing (*) optimized prediction using 18 and 13
metabolites, versus
using 53, 39, 29, or 26 metabolites.
Table 38C
Multivariate Data Analysis (OPLS-DA/PLS-DA)
(Poor vs. Good outcome 12-months)
Analytical Sampling R2 Q2 p value Sensitivity SpecificityAUROC VIP Metabolites
Patients
Platforms Time
MS/MS Day 4 0.75 0.4880.00015 85 88 0.99
1 53 Poor outcome,
n= 13
Day 4 0.7930.593 0.0004 93 100 1
1.1 39 Good outcome
Day 4 0.7920.624 0.0004 100 100 1
1.2 29 n= 13
Day 4 0.7790.583 0.0003 77 100
0.98 1.3 26
Day 4* 0.7070.497 0.0023 93 100 1 1.4 18*
Day 4* 0.5590.488 0.0004 86 100 0.97 1.5 13*
[00268] Table 39A indicates NMR Day 1, GOSE 3-month for 12
metabolites.
Table 39A
NMR Day 1, GOSE 3-month (12 metabolites)
Metabolites P- Fold Poor /Good
value Change outcome
Ornithine 0.218 1.21 Up
Glucose 0.0868 1.23 Up
Acetone 0.0501 2.37 Up
Lactate 0.0138 1.56 Up
Glycerol 0.0115 1.79 Up
Betaine 0.04 1.56 Up
Choline 0.0402 1.32 Up
Serine 0.0232 1.38 Up
Glycine 0.0345 1.43 Up
Formate 0.156 1.21 Up
Isoleucine 0.0538 -1.6 Down
- 69 -
CA 03225337 2024- 1-9
WO 2023/279213
PCT/CA2022/051078
Dimethylamine 0.389 -1 Down
[00269] Table 39B indicates NMR Day 1, GOSE 3-month for 6
metabolites.
Table 39B
NMR Day 1, GOSE 3-month (6 metabolites)
Metabolites p- Fold Poor /Good
value Change outcome
Ornithine 0.218 1.21 Up
Acetone 0.0501 2.37 Up
Lactate 0.0138 1.56 Up
Glycerol 0.0115 1.98 Up
Betaine 0.04 1.43 Up
Choline 0.0402 1.32 Up
[00270] Regarding Tables 39A and 39B, a Multivariate Data
Analysis (OPLS-DA/PLS-
DA) for Day 1 NMR analysis (Poor vs. Good outcome 3-months) GOSE 3-month is
represented
in Table 39C, showing (*) optimized prediction using 12 and 6 metabolites,
versus using 22, 14,
or 10 metabolites.
Table 39C
Multivariate Data Analysis (OPLS-DA/PLS-DA)
(Poor vs. Good outcome 3-months)
Analytical Sampling R2 Q2 p Sensitivity SpecificityAUROC VIP >
Metabolites Patients
Platforms Time value
NMR Day 1 0.49 0.21 0.026 100 0_87 0.99
1.0 22 Poor
Day 1 0.4650.192 0.053 75 100 0.99
1.1 14 outcome,n= 35
Day 1* 0.474 0.18 0.067 89 100 0.97 1.2 12 Good
outcome
Day 1 0.47 0.25 0.017 72 100 0.92
1.4 10 n=9
Day 1* 0.4140.151 0.194 83 89 0.96 1.5 6
[00271] Table 40A indicates NMR Day 4, GOSE 3-month for 9
metabolites.
Table 40A
NMR Day 4, GOSE 3-month (9 metabolites)
Metabolites P- Fold Poor /Good
value Change outcome
Valine 0.0018 1.39 Up
N-Acetylaspartate 0.0093 1.46 .. Up
Tyrosine 0.003 1.45 Up
Lysine 0.03 1.38 Up
Histidine 0.0134 1.2 Up
Dimethyl Sulfone 0.0596 5.88 Up
Pyruvate 0.732 -1.05 Down
- 70 -
CA 03225337 2024- 1-9
WO 2023/279213 PCT/CA2022/051078
Taurine 0.715 -1.06 Down
Gluoconate 0.009 -2.25 Down
[00272] Table 40B indicates NMR Day 4, GOSE 3-month for 6
metabolites.
Table 40B
NMR Day 4, GOSE 3-month (6 metabolites)
Metabolites P- Fold Poor /Good
value Change outcome
Valine 0.0018 1.39 Up
N-Acetylaspartate 0.0093 1.46 Up
Tyrosine 0.003 1.45 Up
Lysine 0.03 1.38 Up
Taurine 0.715 -1.06 Down
Gluconate 0.009 -2.25 Down
[00273] Regarding Tables 40A and 40B, a Multivariate Data
Analysis (OPLS-DA/PLS-
DA) for Day 4 NMR analysis (Poor vs. Good outcome 3-months) GOSE 3-month is
represented
in Table 40C, showing (*) optimized prediction using 9 and 6 metabolites,
versus using 26, 19,
16, and 10 metabolites.
Table 40C
Multivariate Data Analysis (OPLS-DA/PLS-DA) - NMR
(Poor vs. Good outcome 3-months)
Analytical Sampling R2 Q2 p value Sensitivity SpecificityAUROC VIP
Metabolites Patients
Platforms Time
NMR Day 4 0.75 0.52 0.0016 99 90 0.99
1 26 Poor
Day 4 0.727 0.52 0.0012 100 100 1 1.1 19
outcome,n= 23
Day 4 0.7430.541 0.0007 100 100 1 1.2 16 Good
outcome
Day 4 0.75 0.576 0.0002 100 100 1 1.3 10 n= 8
Day 4* 0.7510.595 0.0001 100 96 1 1.4 9*
Day 4* 0.6510.575 1.4x2- 100 75 0.9 1.5 6*
-5
[00274] Table 41A indicates NMR Day 1,GOSE 12-month for 8
metabolites.
Table 41A
NMR Day 1, GOSE 12-month (8 metabolites)
Metabolites p- Fold Poor /Good
value Change outcome
Ornithine 0.028 1.65 Up
Valine 0.532 1.07 Up
- 71 -
CA 03225337 2024- 1-9
WO 2023/279213
PCT/CA2022/051078
Succinate 0.477 2.35 Up
Leucine 0.948 1.09 Up
Gluconate 0.273 4.04 Up
Alanine 0.048 1.35 Up
Mannose 0.298 -1.15 Down
3-Hyroxyisovalerate 0.029 -1.68 Down
[00275] Table 41B indicates NMR Day 1, GOSE 12-month for 5
metabolites.
Table 41B
NMR Day 1, GOSE 12-month (5 metabolites)
Metabolites P- Fold Poor /Good
value Change outcome
Ornithine 0.028 1.65 Up
Succinate 0.532 2.35 Up
Gluconate 0.273 4.04 Up
Alanine 0.048 -1.15 Down
3-Hyroxyisovalerate 0.029 -1.68 Down
[00276] Regarding Tables 41A and 41B, a Multivariate Data
Analysis (OPLS-DA/PLS-
DA) for Day 1 NMR analysis (Poor vs. Good outcome 12-months) GOSE 12-month is
represented
in Table 41C, showing (*) optimized prediction using 8 and 5 metabolites,
versus using 26, 19,
16, and 12 metabolites.
Table 41C
Multivariate Data Analysis (OPLS-DA/PLS-DA)
(Poor vs. Good outcome 12-months) ¨ Day 1 - NMR
Analytical Sampling R2 Q2 p SensitivitySpecificityAUROC VIP
Metabolites Patients
Platforms Time value
NMR Day 1 0.731 0.463 0.003 73 93
0.92 1.0 26 Poor outcome,
n= 14
Day 1 0.6340.345 0.028 91 95
0.98 1.1 19 Good outcome
Day 1 0.6360.386 0.015 83 91
0.94 1.2 16 n= 15
Day 1 0.6450.463 0.003 76 91 0.91
1.3 12
Day 1* 0.5430.348 0.03 93 86 0.96 1.4 8
Day 1* 0.5190.361 0.02 100 100 1
1.5 5
[00277] Table 42A indicates NMR Day 4, GOSE 12-month for 9
metabolites.
Table 42A
NMR Day 4, GOSE 12-month (9 metabolites)
Metabolites P- Fold Poor /Good
value Change outcome
Dimethyl sulfone 0.0178 9.7 Up
Tyrosine 0.0156 1.36 Up
Hisitidine 0.106 1.2 Up
- 72 -
CA 03225337 2024- 1-9
WO 2023/279213 PCT/CA2022/051078
Valine 0.0193 1.31 Up
Leucine 0.088 1.2 Up
Taurine 0.387 1.17 Up
Hypoxanthine 0.891 -1.02 Down
Isopropanol 0.41 -1.6 Down
Beta-alanine 0.166 -1.23 Down
[00278] Table 42B indicates NMR Day 4, GOSE 12-month for 5
metabolites.
Table 42B
NMR Day 4, GOSE 12-month (5 metabolites)
Metabolites P- Fold Poor /Good
value Change outcome
Dimethyl sulfone 0.0178 9.7 Up
Tyrosine 0.0156 1.36 Up
Valine 0.0193 1.31 Up
Hypoxanthine 0.891 -1.02 Down
Beta-alanine 0.166 -1.23 Down
[00279] Regarding Tables 42A and 42B, a Multivariate Data
Analysis (OPLS-DA/PLS-
DA) for Day 4 NMR analysis (Poor vs. Good outcome 12-months) GOSE 12-month is
represented
in Table 42C, showing (*) optimized prediction using 9 and 5 metabolites,
versus using 24, 19,
and 12 metabolites.
Table 42C
Multivariate Data Analysis (OPLS-DA/PLS-DA)
(Poor vs. Good outcome 12-months) ¨ NMR ¨ Day 4
Analytical Sampling R2 Q2 p Sensitivity SpecificityAUROC VIP
Metabolites Patients
Platforms Time value
NMR Day 4 0.6910.396 0.029 94 92 0.95
1 24 Poor outcome,
n= 13
Day 4 0.7 0.423 0.018 93 94 0.96 1.1 19
Good outcome
Day 4 0.7080.339 0.056 100 100 1 1.2 12
n= 13
Day 4* 0.701 0.408 0.044 100 .. 100 .. 1 .. 1.3 .. 9
Day 4 0.6510.364 0.16 71 100 1 1.4 6
Day 4* 0.631 0.394 0.31 100 100 1 1.5 5
[00280] Table 43A indicates MS/MS Day 1, Mortality for 26
metabolites.
Table 43A
MS/MS Day 1, Mortality (26 metabolites)
Metabolites P- Fold Poor /Good
value Change outcome
C3:1 0.0532 1.17 Up
PC aa 38:0 0.0364 1.11 Up
- 73 -
CA 03225337 2024- 1-9
WO 2023/279213
PCT/CA2022/051078
Glucose 0.153 1.12 Up
PC ae 40:6 0.455 1.06 Up
010:1 0.215 1.1 Up
C14:1 0.272 1.54 Up
C14 0.455 1.24 Up
010 0.262 1.41 Up
C16:2 0.529 1.39 Up
C8 0.852 1.27 Up
012 0.962 1.15 Up
Citrulline 0.027 -1.31 Down
010:2 0.352 -1.08 Down
Leucine 0.0261 -1.42 Down
Valine 0.352 -1.28 Down
Isoleucine 0.352 -1.43 Down
Histidine 0.352 -1.17 Down
C16 OH 0.161 -1.07 Down
Glutamine 0.0068 -1.25 Down
[00281] Table 436 indicates MS/MS Day 1, Mortality for 19
metabolites.
Table 43B
MS/MS Day 1, Mortality (11 metabolites)
Metabolites a- Fold Poor /Good
value Change outcome
03:1 0.0532 1.17 Up
PC aa 38:0 0.0364 1.11 Up
Glucose 0.153 1.12 Up
016:2 0.529 1.39 Up
Leucine 0.0261 -1.42 Down
C10:2 0.352 -1.08 Down
Valine 0.352 -1.28 Down
Isoleucine 0.352 -1.43 Down
Histidine 0.352 -1.17 Down
0160H 0.161 -1.07 Down
Glutamine 0.0068 -1.25 Down
[00282] Regarding Tables 43A and 43B, a Multivariate Data
Analysis (OPLS-DA/PLS-
DA) for Day 1 MS/MS mortality analysis (Died vs. Survived) is represented in
Table 43C, showing
(*) optimized prediction using 26, 19, and 11 metabolites, versus using 48,
39, and 32
metabolites.
Table 43C
Multivariate Data Analysis (OPLS-DA/PLS-DA)
(Mortality) - Day 1 -MS/MS
- 74 -
CA 03225337 2024- 1-9
WO 2023/279213
PCT/CA2022/051078
Analytical Sampling Time R2 Q2 p value Sensitivity Specificity AUROC VIP >
Metabolites Patients
Platforms
MS/MS Day 1 0.684 0.429 0.00017 95 100 0.96 1
48 Died
N= 21
Day 1 0.679 0.427 0.00023 88 94 0.94 1.1
39 Survived
Day 1 0.6260.377 0.0012 94 94 0.95 1.2 32
N= 23
Day 1* 0.628 0.424 0.00027 88 88 0.98 1.3
26*
Day 1* 0.5360.347 0.0022 79 100 0.98 1.4
19*
Day 1* 0.48 0.257 0.017 82 75 0.91 1.5
11*
[00283] Table 44A indicates MS/MS Day 4, Mortality for 22
metabolites
Table 44A
MS/MS Day 4, Mortality (22 metabolites)
Metabolites P- Fold Poor /Good
value Change outcome
Indole acetic acid 0.0141 2.12 Up
Alpha- Ketglutaric acid 0.064 1.43 Up
Hippric acid 0.0927 2.28 Up
C16:2 OH 0.0697 1.16 Up
Ornithine 0.0541 1.23 Up
PC aa 36:0 0.0284 1.3 Up
C3 0.11 1.28 Up
Threonine 0.06 1.3 Up
Alpha-Aminoadipic acid 0.027 1.29 Up
PC aa 38:0 0.0629 1.23 Up
Tyrosine 0.0887 1.19 Up
Valine 0.0484 1.53 Up
Tryptophan 0.055 1.21 Up
C2 0.235 -1.35 Down
C8 0.261 -1.46 Down
C12:1 0.119 -1.16 Down
Betaine 0.0589 -1.34 Down
C6 0.0027 -1.48 Down
Glutamine 0.161 -1.12 Down
Taurine 0.029 -1.41 Down
LysoPC 26:0 0.0486 -1.37 Down
[00284] Table 44B indicates MS/MS Day mortality for 16
metabolites.
Table 44B
MS/MS Day 4, Mortality (16 metabolites)
Metabolites P- Fold Poor /Good
value Change outcome
Alpha-Ketoglutaric acid 0.064 1.43 Up
- 75 -
CA 03225337 2024- 1-9
WO 2023/279213
PCT/CA2022/051078
C16:2 OH 0.0697 1.16 Up
Hippuric acid 0.0927 2.28 Up
Indole acetic acid 0.0141 2.12 Up
PC aa 36:0 0.0284 1.3 Up
Ornithine 0.0541 1.23 Up
PC aa 38:0 0.0629 1.23 Up
Alpha-Aminoadipic acid 0.027 1.29 Up
Tryptophan 0.055 1.21 Up
Valine 0.0484 1.19 Down
Leucine 0.131 1.28 Down
C12:1 0.119 -1.16 Down
C6 0.0027 -1.48 Down
Glutamine 0.161 -1.12 Down
LysoPC 26:0 0.0486 -1.37 Down
Taurine 0.029 -1.41 Down
[00285] Regarding Tables 44A and 44B, a Multivariate Data
Analysis (OPLS-DA/PLS-
DA) for Day 4 MS/MS mortality analysis (Died vs. Survived) is represented in
Table 44C, showing
(*) optimized prediction using 22 and 16 metabolites, versus using 45, 35, 29,
and 26 metabolites.
Table 44C
Multivariate Data Analysis (OPLS-DA/PLS-DA)
(Poor vs. Good outcome 3-month) MS/MS - Day 4
Analytical Sampling Time R2 Q2 p value Sensitivity Specificity AUROC VIP >
Metabolites Patients
Platforms
MS/MS Day 4 0.761 0.476 0.001 90 87 0.95
1 45 Died
Day 4 0.7790.491 0.001 90 83 1
1.1 35 N=12
Day 4 0.7770.491 0.0006 100 100 1
1.2 29 Survived 19
Day 4 0.792 0.542 0.0003 100 100 1
1.3 26
Day 4* 0.775 0.499 0.0009 100 100 1
1.4 22*
Day 4* 0.757 0.505 0.0006 100 100 1
1.5 16*
[00286] Table 45A indicates NMR Day 1 mortality for 17
metabolites.
Table 45A
NMR Day 1, Mortality (17 metabolites)
Metabolites P- Fold Poor /Good
value Change outcome
Glucose 0.018 1.23 Up
Betaine 0.1 1.47 Up
3-Hydroxyisovalerate 0.157 1.54 Up
Citrate 0.139 1.32 Up
0-Phosphocholine 0.0414 1.51 Up
Dimethyl Sulfone 0.673 6.64 Up
- 76 -
CA 03225337 2024- 1-9
WO 2023/279213
PCT/CA2022/051078
Formate 0.0201 1.12 Up
Fumarte 0.0124 1.35 Up
2-Oxglutarate 0.189 1.14 Up
Pyruvate 0.089 1.26 Up
Lactate 0.36 -1.17 Down
Valine 0.112 -1.13 Down
Isoleucine 0.0275 -1.32 Down
Leucine 0.0414 -1.28 Down
Diemthylamine 0.487 -1.14 Down
Glutamine 0.0189 -1.17 Down
Histidine 0.284 -1.13 Down
[00287] Table 45B indicates NMR Day 1 Mortality for 5
metabolites.
Table 45B
NMR Day 1, Mortality (5 metabolites)
Metabolites P- Fold Poor /Good
value Change outcome
Glucose 0.018 1.23 Up
Betaine 1.47 Up
3-Hydroxyisovalerate 0.157 1.54 Up
Citrate 0.139 1.32 Up
Lactate 0.36 -1.17 Down
[00288] Regarding Tables 45A and 45B, a Multivariate Data
Analysis (OPLS-DA/PLS-
DA) for Day 1 NMR mortality analysis (Died vs. Survived) is represented in
Table 45C, showing
(*) optimized prediction using 17 and 6 metabolites, versus using 21, 14, 11,
and 10
metabolites.
Table 45C
Multivariate Data Analysis (OPLS-DA/PLS-DA)
(Mortality) NMR - Day 1
Analytical Sampling Time R2 Q2 p value Sensitivity Specificity AUROC VIP >
Metabolites Patients
Platforms
NMR Day 1 0.6070.281 0.007 85 75 0.95
1.0 21 Died
N= 21
Day 1* 0.4980.243 0.01 84 87 0.88
1.1 17* Survived
Day 1 0.4960.265 0.01 95 63 0.91
1.2 14 N= 23
Day 1 0.514 0.26 0.014 58 94 0.79
1.3 11
Day 1 0.46 0.228 0.033 77 80 0.85
1.4 10
Day 1* 0.4170.239 0.025 86 81 89
1.5 6*
[00289] Table 46A indicates NMR Day 4 mortality for 16
metabolites
Table 46A
NMR Day 4, Mortality (16 metabolites)
- 77 -
CA 03225337 2024- 1-9
WO 2023/279213
PCT/CA2022/051078
Metabolites P- Fold Poor /Good
value Change outcome
Isobutyrate 0.685 1.3 Up
Creatine 0.163 1.39 Up
Creatinine 0.564 1.17 Up
Valine 0.49 1.24 Up
Lysine 0.0507 1.35 Up
Asparagine 0.424 1.19 Up
Leucine 0.754 1.27 Up
Tyrosine 0.837 1.17 Up
2-Aminobutyrate 0.0961 1.3 Up
4-Hydroxybutyrate 0.723 -2 Down
Methionine 0.452 -1.08 Down
Urea 0.721 -1.87 Down
Hypoxanthine 0.013 -1.26 Down
Taurine 0.07 -1.29 Down
Gluconate 0.0077 -2.19 Down
Betaine 0.0261 -1.35 Down
[00290] Table 46B indicates NMR Day 4 Mortality for 8
metabolites.
Table 46B
NMR Day 4, Mortality (8 metabolites)
Metabolites a- Fold Poor /Good
value Change outcome
Isobutyrate 0.685 1.3 Up
Valine 0.49 1.24 Up
Lysine 0.0507 1.35 Up
2-Aminobutyrate 0.0961 1.3 Up
Hypoxanthine 0.013 -1.26 Down
Taurine 0.07 -1.29 Down
Gluconate 0.0077 -2.19 Down
Betaine 0.0261 -1.35 Down
[00291] Table 46C indicates NMR analysis of Day 4 blood sample as
a prediction of
Mortality based on 5 metabolites.
- 78 -
CA 03225337 2024- 1-9
WO 2023/279213
PCT/CA2022/051078
Table 46C
NMR Day 4, Mortality (5 metabolites)
Metabolites p-value Fold Change Poor /Good outcome
Valine 0.49 1.24 Up
Lysine 0.0507 1.35 Up
Taurine 0.07 -1.29 Down
Gluconate 0.0077 -2.19 Down
Betaine 0.0261 -1.35 Down
[00292] Regarding Tables 46A, 46B, and 46C, a Multivariate Data
Analysis (OPLS-
DA/PLS-DA) for Day 4 NMR mortality analysis (Died vs. Survived) is represented
in Table 460,
showing (*) optimized prediction using 16, 8, and 5 metabolites, versus using
23, 19, and 7
metabolites.
Table 46D
Multivariate Data Analysis (OPLS-DA/PLS-DA)
(Mortality) ¨ NMR ¨ Day 4
Analytical Sampling Time R2 Q2 p value Sensitivity Specificity AUROC VIP >
Metabolites Patients
Platforms
NMR Day 4 0.662 0.464 0.0027 94 91 1 1
23 Died
N= 12
Day 4 0.649 0.468 0.0025 100 71 1 1.1
19 Survived
Day 4* 0.6080.393 0.011 91 90 0.96 1.2 16*
N= 19
Day 4* 0.5460.387 0.022 84 93 1 1.3 8*
Day 4 0.5460.375 0.015 86 76 0.95 1.4 7
Day 4* 0.538 0.42 0Ø38 75 93 0.89 1.5 5*
[00293] The metabolite optimization modeling represented from
Table 35A to Table 460
indicates that predictions based on a Day 4 or Day 1 serum samples can
effectively determine
outcomes with reliable sensitivity and specificity. An optimized multivariate
analysis can be
tailored to the analytical platform of either MS/MS or NMR, using as few
metabolite variables as
possible, based on metabolites capable of being measured on the selected
analytical platform.
Outcomes regarding the GOSE parameter (at 3-months or 12-months) or mortality
are valuable
to know when a patient presents with a severe traumatic brain injury.
[00294] References
[00295] 1. Roozenbeek B, Maas Al, Menon DK. Changing patterns
in the
epidemiology of traumatic brain injury. Nature reviews. Neurology.
2013;9(4):231-236.
- 79 -
CA 03225337 2024- 1-9
WO 2023/279213
PCT/CA2022/051078
[00296] 2. Dewan MC, Rattani A, Gupta S, et al. Estimating the
global incidence of
traumatic brain injury. J Neurosurg. 2018:1-18.
[00297] 3. Multi-Society Task Force on PVS. Medical aspects of
the persistent
vegetative state (2). N Engl J Med. 1994;330(22):1572-1579.
[00298] 4. Multi-Society Task Force on PVS. Medical aspects of the
persistent
vegetative state (1). N Engl J Med. 1994;330(21):1499-1508.
[00299] 5. Lannoo E, Van Rietvelde F, Colardyn F, et al. Early
predictors of
mortality and morbidity after severe closed head injury. J Neurotrauma.
2000;17(5):403-414.
[00300] 6. Levati A, Farina ML, Vecchi G, Rossanda M,
Marrubini MB. Prognosis of
severe head injuries. J Neurosurg. 1982;57(6):779-783.
[00301] 7. Zygun DA, Laupland KB, Hader WJ, et al. Severe
traumatic brain injury
in a large Canadian health region. Can J Neurol Sci. 2005;32(1):87-92.
[00302] 8. Greenwald BD, Ambrose AF, Armstrong GP. Mild brain
injury. Rehabil
Res Pract. 2012;2012:469475.
[00303] 9. Rees PM. Contemporary issues in mild traumatic brain injury.
Arch Phys
Med Rehabil. 2003;84(12):1885-1894.
[00304] 10. Jacobs B, Beems T, van der Vliet TM, et al.
Outcome prediction in
moderate and severe traumatic brain injury: a focus on computed tomography
variables.
Neurocrit Care. 2013;19(1):79-89.
[00305] 11. Banoei MM, Casault C, Metwaly SM, Winston BW. Metabolomics
and
Biomarker Discovery in Traumatic Brain Injury. J Neurotrauma. 2018;35(16):1831-
1848.
[00306] 12. Wilson JT, Pettigrew LE, Teasdale GM. Structured
interviews for the
Glasgow Outcome Scale and the extended Glasgow Outcome Scale: guidelines for
their use. J
Neurotrauma. 1998;15(8):573-585.
[00307] 13. Maas Al, Murray G, Henney H, 3rd, et al. Efficacy and safety
of
dexanabinol in severe traumatic brain injury: results of a phase III
randomised, placebo-
controlled, clinical trial. Lancet Neurol. 2006;5(1):38-45.
[00308] 14. Alali AS, Vavrek D, Barber J, Dikmen 5, Nathens
AB, Temkin NR.
Comparative study of outcome measures and analysis methods for traumatic brain
injury trials.
J Neurotrauma. 2015;32(8):581-589.
[00309] 15. Mendez KM, Reinke SN, Broadhurst DI. A comparative
evaluation of the
generalised predictive ability of eight machine learning algorithms across ten
clinical
metabolomics data sets for binary classification. Metabolomics : Official
journal of the
Metabolomic Society. 2019;15(12):150.
- 80 -
CA 03225337 2024- 1-9
WO 2023/279213 PCT/CA2022/051078
[00310] 16. Pere! P, Arango M, Clayton T, et al. Predicting
outcome after traumatic
brain injury: practical prognostic models based on large cohort of
international patients. Bmj.
2008;336(7641):425-429.
[00311] 17. Hukkelhoven C, Steyerberg E, Rampen A, et al.
Patient age and
outcome following severe traumatic brain injury: an analysis of 5600
patients. Journal of
neurosurgery. 2003;99:666-673.
[00312] 18. Tokutomi T, Miyagi T, Ogawa T, et al. Age-
associated increases in poor
outcomes after traumatic brain injury: a report from the Japan Neurotrauma
Data Bank. J
Neurotrauma. 2008;25(12):1407-1414.
[00313] 19. Lenell S, Nyholm L, Lewen A, Enblad P. Clinical outcome and
prognostic
factors in elderly traumatic brain injury patients receiving neurointensive
care. Acta Neurochir
(Wien). 2019;161(6):1243-1254.
[00314] 20. Mata-Mbemba D, Mugikura S, Nakagawa A, et al.
Early CT findings to
predict early death in patients with traumatic brain injury: Marshall and
Rotterdam CT scoring
systems compared in the major academic tertiary care hospital in
northeastern Japan. Acad
Radial. 2014;21(5):605-611.
[00315] 21. Zhu GW, Wang F, Liu WG. Classification and
prediction of outcome in
traumatic brain injury based on computed tomographic imaging. The Journal of
international
medical research. 2009;37(4):983-995.
[00316] 22. Mahadewa TGB, Golden N, Saputra A, Ryalino C. Modified
Revised
Trauma-Marshall score as a proposed tool in predicting the outcome of moderate
and severe
traumatic brain injury. Open Access Emerg Med. 2018;10:135-139.
[00317] 23. Roozenbeek B, Lingsma HF, Lecky FE, et al.
Prediction of outcome after
moderate and severe traumatic brain injury: external validation of the
International Mission on
Prognosis and Analysis of Clinical Trials (IMPACT) and Corticoid Randomisation
After
Significant Head injury (CRASH) prognostic models. Crit Care Med.
2012;40(5):1609-1617.
[00318] 24. Hukkelhoven C, Steyerberg E, Habbema J, et al.
Predicting Outcome
after Traumatic Brain Injury: Development and Validation of a Prognostic Score
Based on
Admission Characteristics. Journal of neurotrauma. 2005;22:1025-1039.
[00319] 25. Roozenbeek B, Chiu Y-L, Lingsma HF, et al. Predicting 14-
day mortality
after severe traumatic brain injury: application of the IMPACT models in the
brain trauma
foundation TBI-trac New York State database. Journal of neurotrauma.
2012;29(7):1306-
1312.
- 81 -
CA 03225337 2024- 1-9
WO 2023/279213 PCT/CA2022/051078
[00320] 26. Low D, Kuralmani V, Ng SK, Lee KK, Ng I, Ang
BT. Prediction of
outcome utilizing both physiological and biochemical parameters in severe head
injury. J
Neurotrauma. 2009;26(8):1177-1182.
[00321] 27. Zador Z, Sperrin M, King AT. Predictors of
Outcome in Traumatic Brain
Injury: New Insight Using Receiver Operating Curve Indices and Bayesian
Network Analysis.
PLoS One. 2016;11(7):e0158762.
[00322] 28. Eriksson L, Antti H, Gottfries J, et al. Using
chemometrics for navigating
in the large data sets of genomics, proteomics, and metabonomics (gpm).
Analytical and
bioanalytical chemistry. 2004;380(3):419-429.
[00323] 29. Law S-H, Chan M-L, Marathe GK, Parveen F, Chen C-H, Ke L-Y.
An
Updated Review of Lysophosphatidylcholine Metabolism in Human Diseases. Int J
Mol Sci.
2019;20(5):1149.
[00324] 30. Sugasini D, Thomas R, Yalagala PCR, Tai LM,
Subbaiah PV. Dietary
docosahexaenoic acid (DHA) as lysophosphatidylcholine, but not as free acid,
enriches brain
DHA and improves memory in adult mice. Scientific Reports. 2017;7(1):11263.
[00325] 31. Pasvogel AE, Miketova P, Moore IM. Differences
in CSF phospholipid
concentration by traumatic brain injury outcome. Biological research for
nursing.
2010;11(4):325-331.
[00326] 32. Fiandaca MS, Mapstone M, Mahmoodi A, et al.
Plasma metabolomic
biomarkers accurately classify acute mild traumatic brain injury from
controls. PLoS One.
2018;13(4):e0195318.
[00327] 33. Kerr ME, Ilyas Kamboh M, Yookyung K, et al.
Relationship between
apoE4 allele and excitatory amino acid levels after traumatic brain injury.
Crit Care Med.
2003;31(9):2371-2379.
[00328] 34. Wagner AK, Fabio A, Puccio AM, et al. Gender associations
with
cerebrospinal fluid glutamate and lactate/pyruvate levels after severe
traumatic brain injury. Crit
Care Med. 2005;33(2):407-413.
[00329] 35. Amorini AM, Lazzarino G, Di Pietro V, et al.
Severity of experimental
traumatic brain injury modulates changes in concentrations of cerebral free
amino acids.
Journal of cellular and molecular medicine. 2017;21(3):530-542.
[00330] 36. Aquilani R, ladarola P, Boschi F, Pistarini C,
Arcidiaco P, Contardi A.
Reduced plasma levels of tyrosine, precursor of brain catecholamines, and of
essential amino
acids in patients with severe traumatic brain injury after rehabilitation.
Archives of physical
medicine and rehabilitation. 2003;84(9):1258-1265.
- 82 -
CA 03225337 2024- 1-9
WO 2023/279213 PCT/CA2022/051078
[00331] 37. Yan EB, Frugier T, Lim CK, et al. Activation of
the kynurenine pathway
and increased production of the excitotoxin quinolinic acid following
traumatic brain injury in
humans. Journal of neuroinflammation. 2015;12:110-110.
[00332] 38. Sinz EH, Kochanek PM, Heyes MP, et al.
Quinolinic Acid is Increased in
CSF and Associated with Mortality after Traumatic Brain Injury in Humans.
Journal of Cerebral
Blood Flow & Metabolism. 1998;18(6):610-615.
[00333] 39. Dumas ME, Davidovic L. Metabolic Profiling and
Phenotyping of Central
Nervous System Diseases: Metabolites Bring Insights into Brain Dysfunctions. J
Neuroimmune
Pharmacol. 2015;10(3):402-424.
[00334] 40. Shi J, Dong B, Mao Y, et al. Review: Traumatic brain injury
and
hyperglycemia, a potentially modifiable risk factor. Oncotarget.
2016;7(43):71052-71061.
[00335] 41. Carpenter KL, Jalloh I, Hutchinson PJ.
Glycolysis and the significance of
lactate in traumatic brain injury. Front Neurosci. 2015;9:112.
[00336] 42. Brooks GA, Martin NA. Cerebral metabolism
following traumatic brain
injury: new discoveries with implications for treatment. Front Neurosci.
2014;8:408.
[00337] 43. VVishart DS, Knox C, Guo AC, et al. HMDB: a
knowledgebase for the
human metabolome. Nucleic Acids Research 2009; 37(Database): D603-D10.
[00338] 44. Weljie AM, Newton J, Mercier P, Carlson E,
Slupsky CM. Targeted
profiling: quantitative analysis of 1H NMR metabolomics data. Anal Chem 2006;
78(13): 4430-
42.
[00339] 45. Nicholson JK, Foxall PJ, Spraul M, Farrant RD,
Lindon JC. 750 MHz 1H
and 1H-13C NMR spectroscopy of human blood plasma. Anal Chem 1995; 67(5): 793-
811.
[00340] 46. Weljie AM, Dowlatabadi R, Miller BJ, Vogel HJ,
Jirik FR. An Inflammatory
Arthritis-Associated Metabolite Biomarker Pattern Revealed by1H NMR
Spectroscopy. Journal
of Proteome Research 2007; 6(9): 3456-64.
[00341] 47. Banoei MM, Vogel HJ, Weljie AM, Yende S, Angus
DC, Winston BW.
Plasma lipid profiling for the prognosis of 90-day mortality, in-hospital
mortality, ICU admission,
and severity in bacterial community-acquired pneumonia (CAP). Crit Care 2020;
24(1): 461.
[00342] 48. Eriksson L, Trygg J, Wold S. CV-AN OVA for
significance testing of PLS
and OPLSO models. Journal of Chemometrics 2008; 22(11-12): 594-600.
[00343] 49. de Jong S. SIMPLS: An alternative approach to
partial least squares
regression. Chemometrics and Intelligent Laboratory Systems 1993; 18(3): 251-
63.
- 83 -
CA 03225337 2024- 1-9
WO 2023/279213
PCT/CA2022/051078
[00344] 50. Goodacre R, Vaidyanathan S, Dunn WB, Harrigan GG,
Kell DB.
Metabolomics by numbers: acquiring and understanding global metabolite data.
Trends
Biotechnol 2004; 22(5): 245-52.
[00345] The embodiments described herein are intended to be examples only.
Alterations, modifications and variations can be effected to the particular
embodiments by those
of skill in the art. The scope of the claims should not be limited by the
particular embodiments
set forth herein, but should be construed in a manner consistent with the
specification as a
whole.
[00346] All publications, patents and patent applications mentioned in this
Specification
are indicative of the level of skill those skilled in the art to which this
invention pertains and are
herein incorporated by reference to the same extent as if each individual
publication patent, or
patent application was specifically and individually indicated to be
incorporated by reference.
[00347] The invention being thus described, it will be obvious
that the same may be
varied in many ways. Such variations are not to be regarded as a departure
from the spirit and
scope of the invention, and all such modification as would be obvious to one
skilled in the art
are intended to be included within the scope of the following claims.
- 84 -
CA 03225337 2024- 1-9