Note: Descriptions are shown in the official language in which they were submitted.
TREATMENT OF AGE-RELATED WHITE MATTER LOSS BY COMPETITIVE
REPLACEMENT OF GLIAL CELLS
FIELD
The present application relates to treatment of oligodendrocyte loss,
astrocyte loss, or
white matter loss, including age-related oligodendrocyte loss, age-related
astrocyte loss, or
age-related white matter loss.
BACKGROUND
Age-related loss of white matter, oligodendrocyte, or astrocyte commonly
occurs in
older people and can lead to poor outcomes, including cognitive impairment,
dementia,
urinary incontinence, gait disturbances, depression, and increased risk of
stroke and death.
This loss involves partial loss of myelin, axons, and oligodendroglial cells;
mild reactive
astrocytic gliosis; sparsely distributed macrophages as well as stenosis
resulting from hyaline
fibrosis of arterioles and smaller vessels. Age-related white matter loss is
generally regarded
as a form of incomplete ischemia mainly related to cerebral small vessel
arteriolosclerosis.
Such small vessel alterations can result in damage to the blood-brain barrier
and chronic
leakage of fluid and macro-molecules in the white matter. Indeed, an increased
concentration
of cerebrospinal fluid albumin and IgG values were found in patients having
age-related
white matter loss. Although age-related white matter loss has been a
significant problem
clinically, there have been relatively few studies conducted to evaluate
treatments for this
condition.
The Epidemiology of Vascular Ageing MRI study has shown a positive linear
relationship between blood pressure and the severity of age-related white
matter loss severity.
Statins have long been used to reduce cardiovascular events and ischemic
stroke in coronary
patients. However, it is uncertain whether statins are useful in treating age-
related white
matter loss. Acetylcholinesterase inhibitors (donepezil, galantamine, and
rivastigmine) and
N-methyl-D-aspartate (NM DA) receptor antagonists (memantine) have been
approved for
treatment of Alzheimer's Disease. There is also evidence that
hyperhomocysteinemia is
1
CA 03234809 2024-4- 11
WO 2023/069979
PCT/US2022/078344
associated with age-related white matter loss.
It is uncertain, however, whether
homocysteine lowering therapy will be useful in slowing such white matter
loss.
There is a need for therapeutics and methods for treating disorders and
conditions
mediated by or characterized by loss of white matter, oligodendrocytes, or
astrocytes. The
present disclosure is directed to overcoming these and other deficiencies in
the art.
SUMMARY
This disclosure addresses the need mentioned above in a number of aspects.
In some aspects, the disclosure provides a method of treating in a subject a
condition
mediated by age-related oligodendrocyte loss. The method comprises
administering a
therapeutically effective amount of a population of isolated glial progenitor
cells to the
subject in need thereof. The condition can be a vascular leukoencephalopathy,
an adult-onset
autoimmune demyelination condition, a chronic post-radiation induced
demyelination
condition, an adult-onset lysosomal storage disease, an adult-onset
leukodystrophy, or
cerebral palsy.
In another aspect, the disclosure provides a method of treating in a subject a
condition
mediated by age-related astrocyte loss.
The method comprises administering a
therapeutically effective amount of a population of isolated glial progenitor
cells to the
subject in need thereof. The condition can be amyotrophic lateral sclerosis,
frontotemporal
dementia, schizophrenia, Huntington disease, Alexander disease, or Vanishing
White Matter
Disease.
In yet another aspect, the disclosure provides a method of treating in a
subject a
condition mediated by age-related white matter loss. The method comprises
administering a
therapeutically effective amount of a population of isolated glial progenitor
cells to the
subject in need thereof.
Examples of the condition can include a vascular
leukoencephalopathy, an adult-onset autoimmune demyelination condition, a
chronic post-
radiation induced demyelination condition, an adult-onset lysosomal storage
disease, an
adult-onset leukodystrophy, cerebral palsy, amyotrophic lateral sclerosis,
frontotemporal
dementia, schizophrenia, Huntington disease, Alexander disease, and Vanishing
White
Matter Disease.
In each of the methods described above, the condition can be Huntington's
disease or
subcortical dementia. Examples of the vascular leukoencephalopathy include
subcortical
stroke, diabetic leukoencephalopathy, and hypertensive leukoencephalopathy.
Examples of
the adult-onset autoimmune demyelination condition include relapsing-remitting
multiple
2
CA 03234809 2024-4- 11
WO 2023/069979
PCT/US2022/078344
sclerosis, chronic or progressive multiple sclerosis, neuromyelitis optica,
transverse myelitis,
and optic neuritis.
In some embodiments for each of the methods described above, the population of
the
isolated glial progenitor cells are younger than glial progenitor cells,
oligodendrocytes, or
astrocytes in the subject. In some embodiments, the population of the isolated
glial
progenitor cells or progenies thereof replace at least some of glial
progenitor cells,
oligodendrocytes, or astrocytes in the subject. In some embodiments, the
population of the
isolated glial progenitor cells or progenies thereof grow or proliferate or
divide faster than
glial progenitor cells, oligodendrocytes, or astrocytes in the subject. In
some embodiments,
the population of the isolated glial progenitor cells or progenies thereof
have a higher level of
MYC and YAP1 pathway activity than glial progenitor cells, oligodendrocytes,
or astrocytes
in the subject.
In some embodiments, the subject is a mammal such as a human. The population
of
the isolated glial progenitor cells can be derived from pluripotent stem
cells. Examples of the
pluripotent stem cells include embryonic stem cells and induced pluripotent
stem cells. In
some embodiments, the glial progenitor cells can be cells rejuvenated from
glial cells (such
as glial progenitor cells, astrocytes, or oligodendrocytes) as disclosed
herein.
For each of the methods described above, the administering can be carried out
by
intraparenchymal, intracallosal, intraventricular, intrathecal, intracerebral,
intraci sternal, or
intravenous transplantation. In some examples, the population of isolated
glial progenitor
cells or progenies can be administered to the forebrain, striatum, and/or
cerebellum. The
isolated glial progenitor cells or progenies can be heterologous, xenogenic,
allogeneic,
isogenic, or autologous to the subject.
In some other aspects, the disclosure provide a method of rejuvenating, or
enhancing
the development potential of, a glial progenitor cell or a progeny thereof.
The method
comprises suppressing in the glial progenitor cell or the progeny a
transcription repressor
selected from the group consisting of E2F6, ZNF274, MAX, and IKZF3. The glial
progenitor cell can be an aged glial progenitor cell The progeny can be an
oligodendrocyte
or an astrocyte. The suppressing step may comprise expressing or introducing
in the glial
progenitor cell or the progeny a suppressor of the transcription repressor.
In another aspect, the disclosure provides a cell prepared according to the
method
described above or progeny thereof. The disclosure also provides an isolated
glial progenitor
cell or a progeny thereof comprising a suppressor of a transcription repressor
selected from
3
CA 03234809 2024-4- 11
WO 2023/069979
PCT/US2022/078344
UR 6-22023 /FR: 161118.03801 &03802
the group consisting of E2F6, ZNF274, MAX, and IKZF3. In some embodiments, the
isolated glial progenitor cell or progeny comprises an exogenous suppressor.
That is the
suppressor is exogenous to the cell or progeny.
In a further aspect, the disclosure provides a method of treating a condition
mediated
by white matter loss, oligodendrocyte loss, or astrocyte loss. The method
comprises
administering to a subject in need thereof (i) a therapeutically effective
amount of a
suppressor of a transcription repressor selected from the group consisting of
E2F6, ZNF274,
MAX, and IKZF3; and/or (ii) a therapeutically effective amount of the cell
prepared
according to the method described above or a progeny thereof; and/or (iii) a
therapeutically
effective amount of the suppressor-containing glial progenitor cell or progeny
described
above. In some embodiments, the white matter loss, oligodendrocyte loss, or
astrocyte loss is
age-related.
The subject can be a mammal such as a human.
In some embodiments, the suppressor comprises a small molecule compound, an
oligonucleotide, a nucleic acid, a peptide, a polypeptide, a CRISPR/Cas
system, or an
antibody or an antigen-binding portion thereof. In some examples, the
suppressor can be
miRNA or siRNA molecule, or a CRISPR/Cas system, or antisense nucleic acid.
In some embodiments, the nucleic acid comprises or encodes a miRNA or siRNA
molecule. In some examples, the miRNA or siRNA molecule comprises a sequence
that is at
least 70% (e.g., 70%, 75%, 80%, 85%, 90%, 95%, 96%, 97%, 98%, or 99%)
identical to one
selected from the group consisting of miR-125b-5p, miR-106a-5p, miR-17-5p, miR-
130a-3p,
miR-130b-3p, miR-3'79-5p, miR-93-3p, miR-1260b, miR-767-5p, miR-30b-5p, miR-9-
3p,
miR-9-5p, and miR-485-5p. Preferably, the miRNA or siRNA molecule comprises a
sequence that is at least 70% (e.g., 70%, 75%, 80%, 85%, 90%, 95%, 96%, 97%,
98%, or
99%) identical to the sequence of one selected from the group consisting of
miR-125b-5p,
miR-106a-5p, miR-17-5p, miR-130a-3p, miR-130b-3p, miR-379-5p, and miR-485-5p.
In some embodiments, the suppressor comprises a CRISPR-Cas system.
In the methods described above, the suppressor can be administered by
intraparenchymal, intracallosal, intraventricular, intrathecal, intracerebral,
intraci sternal, or
intravenous administration to the subject having the condition. Examples of
the condition
include a lysosomal storage disease, an autoimmune demyelination condition
(e.g., multiple
sclerosis, neuromyelitis optica, transverse myelitis, and optic neuritis), a
vascular
leukoencephalopathy (e.g., subcortical stroke, diabetic leukoencephalopathy,
hypertensive
4
CA 03234809 2024-4- 11
WO 2023/069979
PCT/US2022/078344
UR 6-22023 /FR: 161118.03801 &03802
leukoencephalopathy, age-related white matter disease, and spinal cord
injury), a radiation
induced demyelination condition, a leukodystrophy (e.g., Pelizaeus-Merzbacher
Disease,
Tay-Sach Disease, Sandhoff s gangliosidoses, Krabbe's disease, metachromatic
leukody strophy, mu cop oly s acchari doses, Niemann-Pick A disease,
adrenoleukody strophy,
Canavan's disease, Vanishing White Matter Disease, and Alexander Disease), or
periventricular leukomalacia or cerebral palsy. In some embodiments, the
condition is
Huntington's disease or subcortical dementia.
The administering can be carried out by intraparenchymal, intracallosal,
intraventri cul ar, intrathecal , intracerebral , i ntraci sternal , or
intravenous transplantation. In
some embodiments, the cell or the isolated glial progenitor cell or progeny
thereof can be
administered to the forebrain, striatum, and/or cerebellum. The cell or the
isolated glial
progenitor cell or progeny thereof can be heterologous, xenogenic, allogeneic,
isogenic, or
autologous to the subject.
The details of one or more embodiments of the disclosure are set forth in the
description below. Other features, objectives, and advantages of the
disclosure will be
apparent from the description and from the claims.
BRIEF DESCRIPTION OF THE DRAWINGS
The patent or application file contains at least one drawing executed in
color. Copies
of this patent or patent application publication with color drawing(s) will be
provided by the
Office upon request and payment of the necessary fee.
FIG. lA shows representative images of expression of WT-mCherry. CRISPR-
mediated integration of transgenic reporter cassette into the AAVS1 safe
harbor locus yields
color-tagged WT that express mCherry. E1-3, exon 1-3; LHA, left homology arm;
SA, splice
acceptor site; T2A, 2A self-cleaving peptide; Puro, Puromycin resistance gene;
pA,
polyadenylation sequence; CAG, CAG promoter; RHA, right homology arm. Scale:
500 m.
FIG 1B shows representative images of expression of HD-EGFP CRTSPR-mediated
integration of transgenic reporter cassette into the AAVS1 safe harbor locus
yields color-
tagged HD hESCs that express EGFP.
FIG. 1C shows the engineered WT and HD hESC lines' HTT CAG length and
respective transgenic insert.
FIG. 1D shows a PCR screening strategy to assess transgene cassette
integration and
zygosity using primers dna 803, dna 804, and dna 1835, (SEQ ID NOs: 1-3). PCR
screening
shows that WT-EGFP, WT-mCherry and HD-EGFP integrated the transgenic cassette
in the
5
CA 03234809 2024-4- 11
WO 2023/069979
PCT/US2022/078344
UR 6-22023 /FR: 161118.03801 &03802
correct site, with WT-mCherry and WT-EGFP harboring a homozygous integration
while
HD-EGFP harbors a heterozygous integration. E1-3, exon 1-3; LHA, left homology
arm;
RHA, right homology arm.
FIG. lE shows representative images of WT-mCherry and HD-EGFP expression in
the brain. Immunostaining for OCT4 shows that pluripotency is maintained
following
transgene insert.
FIG. 2A shows representative karyotypes from WT-mCherry and HD-EGFP to assess
acquired copy number variants (CNVs) and loss-of-heterozygosity regions (LOH).
Karyotyping shows that no chromosomal abnormalities were acquired during the
transgene
integration process.
FIG. 2B shows example of aCGH profiling of a human chromosome 20 carrying an
amplification commonly found in hESCs (within the dashed lines), known to
impart a
selective growth advantage to hESCs. No such mutation was detected in WT-EGFP,
WT-
mCherry or HD-EGFP hESCs.
FIG. 2C shows comparative aCGH profiles detected multiple mutations in the
engineered lines, within and outside of normal range. None are expected to
influence
experimental outcomes.
FIG. 3A illustrates creation of HD-chimeric mice, differentiation process and
phenotypic characterization prior to experimental grafting.
FIG. 3B shows phase-contrast images of WT-mCherry- and HD-EGFP glial cultures,
both highly enriched in bipolar hGPCs at 150 DIV. Scale: 50 lam.
FIG. 3C shows flow cytometry of 150 DIV cell preparations (WT-mCherry, n=10,
HID-EGFP, n=6) reveals high enrichment of CD140a (PDGFRa) /CD44+ hGPCs, with
the
remainder comprised of less mature A2B5+ hGPCs and PDGFRa-/CD44+ astrocytes.
Fluorescent reporter expression remained consistent throughout glial
differentiation
Unpaired two-tailed t tests; data are shown as means + SEM.
FIG. 3D shows that immunocytochemistry confirmed the enrichment of PDGFRct+
hGPCs in cultures generated from both WT-mCherry and HD-EGFP hESCs. A fraction
of
these hGPCs differentiated into GFAP+ astrocytes. Scale: 100 um.
FIGs. 3E, 3F, and 3G show percentages of cells expressing (A) the reporters,
(B)
PDGFRe, and (C) GFAP in HD-chimeric mice, respectively.
FIG. 4A are representative images demonstrating human wildtype glia
outcompeting
and displacing previously integrated HID glia. Engraftment of WT glia (mCherry-
, red) into
6
CA 03234809 2024-4- 11
WO 2023/069979
PCT/US2022/078344
UR 6-22023 /FR: 161118.03801 &03802
the striatum of HD chimeras yielded progressive replacement of HD glia (EGFP+,
green)
creating extensive exclusive domains in their advance. Dashed outlines (white)
demarcate the
striatal outlines within which human cells were mapped and quantified. STR ¨
striatum
(caudate-putamen); LV ¨ lateral ventricle; CTX ¨ cortex. Dashed rectangle
(orange)
represents inset at 72 weeks. Left scale bars: 500 p.m; Right scale bars 100
um.
FIGs. 4B-4C are representative images demonstrating human wildtype glia
outcompeting and displacing previously integrated HD glia. FIG.4B demonstrates
that these
exclusive domains are formed as WT GPCs (01ig2+, white) displace their HD
counterparts.
Scale bar: 50 [1.m. FIG. 4C shows GPC replacement precedes astrocytic
replacement, as
within regions dominated by WT glia, HD astrocytes (hGFAP+, white) could be
found
Scale bar: 10 um.
FIGs. 4D-4E show human wildtype glia outcompeting and displacing previously
integrated HD glia. FIG. 4D is a cartoon depicting the strategy employed to
quantify
distribution of human glia in the striatum over time. Human glia were mapped
in 15
equidistant sections (5 are shown as example) of the murine striatum and
reconstructed in 3D
for analysis. Their distribution was measured radially as a function of
distance to the injection
site. FIG. 4E shows that WT glia increase their spatial dominance over time;
WT vs. HD (HD
vs WT Group) ¨ 54 n=8 for 54 weeks, n=7 for 72 weeks. Their advance was
accompanied by
a progressive eradication of HD glia relative to HD chimera controls; HD (HD
vs WT
Group).
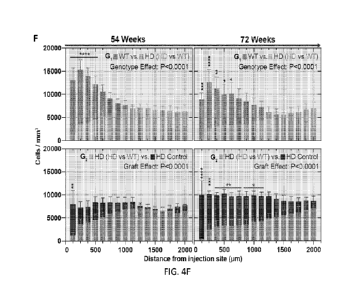
FIG. 4F shows human wildtype glia outcompete and displace previously
integrated
HD glia. Volumetric quantification shows that WT glia increase their spatial
dominance over
time; WT vs. HD (HD vs WT Group) ¨ 54 n=8 for 54 weeks, n=7 for 72 weeks.
Their
advance was accompanied by a progressive eradication of HD glia relative to HD
chimera
controls; RD (RD vs WT Group) ¨ n=8 for 54 weeks, n=7 for 72 weeks vs. HID
Control ¨
n=4 for both timepoints; Two-way ANOVA with idak's multiple comparisons test;
Main
effects are shown as numerical P values, while post-hoc comparisons are shown
as: ****
P<0.0001, *** P<0.001, **P<0.01, *p<0.05; Data is presented as means s.e.m.
FIG. 5 illustrates the experimental design of the HD vs WT mouse and the HD
control
mouse.
FIGs. 6A-6C show human wildtype glia outcompete previously integrated human HD
glia
7
CA 03234809 2024-4- 11
WO 2023/069979
PCT/US2022/078344
UR 6-22023 /FR: 161118.03801 &03802
FIG. 6A provides stereological estimations demonstrate that the total number
of HD
glia progressively decreases relatively to EID chimera controls as WT glia
expands within the
humanized striatum; Two-way ANOVA with S'idak's multiple comparisons test.
FIGs. 6B and 6C show the proportion of GPCs (01ig2+, FIG. 6B) and astrocytes
(GFAP+, FIG. 6C) in both populations was maintained as they competed for
striatal
dominance; HD Control ¨ n=4 for both timepoints; WT Control ¨ n=4 for 54
weeks, n=3 for
72 weeks; HD vs WT ¨ n=5 for 54 weeks, n=3 for 72 weeks; Orange arrows point
to co-
labelled cells. Data shown as means s.e.m with individual data points.
FIGs. 6D-6E shows representative images of HD glia (FIG. 6D) and WT glia (FIG
6E) of WT glia expanded as 01ig2+ (white) GPCs displacing their HD
counterparts. Within
areas where they became dominant, they further differentiated into hGFAP+
(white)
astrocytes.
FIG. 7A illustrates the experimental design and analytic timepoints of the WT
Control
group.
FIG. 7B shows representative images of engraftment of WT glia (mCherry+, red)
into
the adult striatum of Ragl(-/-) mice yields substantial humanization of the
murine striatum
over time.
FIGs. 7C-7D are volumetric quantifications show that WT glia infiltrate and
disperse
throughout the murine striatum over time, and they do so more broadly than
those grafted
onto HD chimeras. WT (HD vs WT Group) ¨ n=8 for 54 weeks, n=7 for 72 weeks vs
WT
Control ¨ n=7 for 54 weeks, n=5 for 72 weeks; Two-way ANOVA with sSiclak's
multiple
comparisons test; Main effects are shown as numerical P values; Data is
presented as means
+ s.e.m. FIG. 7C shows WT control. FIG. 7D shows cells/mm3.
FIG. 8 illustrates the experimental design for mice that received a 1:1
mixture of
mCherry-tagged (WT-mCherry) and untagged (WT-untagged) WT glia.
FIGs. 9A-9D show co-engrafted isogenic clones of wildtype glia thrive and
admix
while displacing HD glia.
FIG. 9A shows immunolabeling against human nuclear antigen (hN) shows that
both
WT-mCherry (mCherry+ hN+, red, white) and WT-untagged (mCherry- EGFP- hN+,
white)
glia expanded within the previously humanized striatum, progressively
displacing HD glia
(EGFP+ hN+, green, white). Scale bar 500 um.
FIG. 9B shows vast homotypic domains were formed as mixed WT glia expanded and
displaced resident HD glia. Scale bar 100 lam.
8
CA 03234809 2024-4- 11
WO 2023/069979
PCT/US2022/078344
UR 6-22023 /FR: 161118.03801 &03802
FIG. 9C shows isogenic WT-mCherry and WT-untagged were found admixing. Scale
bar 100 um.
FIG. 9D shows that within WT glia dominated domains, only more complex
astrocyte-like HD glia could be found, typically within white matter tracts.
Scale bar: 10 m.
FIG. 10 shows quantification of the proportion of WT-mCherry and WT-untagged
glia within the striatum showed no significant difference between the two
populations at
either quantified timepoint (n=6 for each timepoint); Two-way ANOVA with
iiclak's
multiple comparisons test; means s.e.m.
FIG. 11 illustrates the experimental design for co-engrafting WT and 1-IT glia
in
neonatal mice.
FIG. 12A, 12B, 12B', and 12C show representative images of the proportion of
WT
and HD glia within the striatum in mice co-engrafted with WT and HT glia. The
images show
no significant growth advantage to either cell population; n=5; two-tailed
paired t-test.
FIGs. 13A-13B demonstrates equal growth of neonatally engrafted WT and HD glia
is sustained by equally proliferative Ki67+ (white) glial pools; HD Control ¨
n=3; WT
Control ¨ n=4; HD vs WT ¨ n=5; One-way ANOVA with Tukey's multiple comparisons
test.
FIG. 13A shows striatal occupancy. FIG. 13B shows relative amount of Ki67+
cells.
FIG 14A shows the experimental design to demonstrate differences in cellular
age are
sufficient to drive human glial repopulation.
FIG. 14B shows differences in cellular age are sufficient to drive human glial
repopulation.
FIGs. 15A-15D show murine chimeras with striata substantially humanized by HD
glia were generated to provide an in vivo model by which to assess the
replacement of
diseased human glia by their healthy counterparts. hGPCs derived from mHtt-
expressing
hESCs engineered to express EGFP were implanted into the neostriatum of
immunocompromised Ragl(-/-) mice and monitored their expansion histologically.
FIG. 15A shows the experimental design and analytical endpoints.
FIG. 15B shows that neonatally engrafted HD glia (EGFP+, green) expand within
the
murine striatum yielding substantial humanization of the tissue over time.
Dashed lines
demarcate the striatal borders within which human cells were mapped and
quantified. Scale:
500 tni. STR, neostriatum.
FIG. 15C shows that their expansion is concomitant with an increase in the
number of
I-1D glia harbored in the murine striatum over time. Data presented as means
s.e.m with
9
CA 03234809 2024-4- 11
WO 2023/069979
PCT/US2022/078344
UR 6-22023 /FR: 161118.03801 &03802
individual data points (n=4). One-way ANOVA with Tukey's multiple comparisons
test; 12
weeks (n=3), 24 weeks (n=3), 36 weeks (n=4).
FIG. 15D shows that their expansion is concomitant with an increase in the
number of
HD glia harbored in the murine striatum over time at the cost of their Ki67+
proliferative cell
pool.
FIGs. 15E-15J show murine chimeras with striata substantially humanized by HD
glia
were generated to provide an in vivo model by which to assess the replacement
of diseased
human glia by their healthy counterparts. hGPCs derived from mHtt-expressing
hESCs
engineered to express EGFP were implanted into the neostriatum of
immunocompromised
Ragl(-/-) mice and monitored their expansion histologically.
FIG. 15E shows strategy employed to assess the extent of striatal humanization
36
weeks following neonatal implantation of HD GPCs. HD cell distribution was
mapped in 15
equidistant sagittal sections (5 are shown for example) and reconstructed in
3D for analysis.
FIG. 15F shows rendered example of a mapped and reconstructed striatum for
volumetric analysis.
FIG. 15G shows volumetric quantification shows that by 36 weeks HD glia had
expanded throughout whole striatum assuming a uniform distribution; Data are
shown as
mean (line) and individual data points (n=4). Data presented as means s.e.m
with individual
data points (n=4).
FIG. 15H-J show that as they colonized the murine striatum, HD glia either
expanded
and persisted as Olig2+ GPCs (arrows point to OlignEGFP (red/green) cells) or
differentiated into hGFAP (red) astrocytes. Proliferating (Ki67+, red) HD
glia can be found
even after 36 weeks of expansion, albeit in decreased numbers (D). Scale: 10
[rm. Data
presented as means s.e.m with individual data points (n=4)
FIGs. 16A, 16B, 16B', and 16C show proliferative advantage drives WT glia to
advance through the humanized HD striatum.
FIGs. 17A, 17B, 17C, 17D, 17E, 17F, 17G, 17H and 171 show differences in
cellular
age are sufficient to drive competitive glial repopulation.
FIG. 17A shows an experimental design and analytical endpoints.
FIG. 17B shows that engraftment of younger WT glia (EGFP , green) into the
striatum of WT chimeras yielded selective replacement of their aged
counterparts (mCherry ,
red). Dashed outlines demarcate the striatal regions within which human cells
were mapped
CA 03234809 2024-4- 11
WO 2023/069979
PCT/US2022/078344
UR 6-22023 /FR: 161118.03801 &03802
and quantified. STR, striatum (caudate-putamen); LV, lateral ventricle; CTX,
cortex. Scale:
500 um.
FIG. 17C shows WT chimeric control, engrafted only at birth. Scale: 100 p.m.
FIG. 17D shows rendered examples of mapped striata. Volumetric quantification
shows that the younger WT glia replace their older isogenic counterparts as
they expand from
their injection site.
FIG. 17E shows results of Aged vs. Young (Isograft), n=3. Their advance
tracked the
progressive elimination of aged WT glia from the tissue, relative to control
WT chimeras
(Aged control). Scale: 100 um.
FIG. 17F shows results of Aged (Isograft) vs. Aged (Control) n=3 each; 2-way
ANOVA with i[clak's multiple comparisons test; Interactions or main effects
are shown as
numerical P values, while post-hoc comparisons are shown as: **** P<0.0001,
*** P<0.001,
**P<0.01, *P<0.05; data presented as means SEM.
FIG. 17G shows that at the interface between young and aged WT glia, a higher
incidence of Ki67 (white) cells can be seen within the younger population.
Dashed square
represents inset color split (FIG. 17H). Scale: 50 um
FIG. 171. shows quantification of Ki67 cells, indicating that younger WT glia
are
significantly more proliferative than their aged counterparts; n=3 for all
experimental groups;
One-way ANOVA with iozlak's multiple comparisons test; data are shown as means
+ SEM
with individual data points..
FIG. 18A shows gating strategy flow cytometry analysis of WT-mCherry hESC
lines.
FIG. 18B shows gating strategy flow cytometry analysis of HD-EGFP hESC lines.
From dissociated glial cultures, live cells were identified by their lack of
DAPI incorporation.
Of these, cells stained for PDGFRa, CD44, PDGFRa/CD44 and A2B5 were identified
based
on antibody-specific fluorescence intensity, relative to their respective
unstained gating
controls. Essentially all cells retained their respective reporter expression
throughout glial
differentiation in vitro.
FIG. 19A shows that at the boundary between WT and HD glia, a high incidence
of Ki67+
(white) cells can be seen exclusively within the WT glial population. I'.
Higher magnification of two
WT daughter cells at the edge of the competitive boundary.
FIG. 19B shows quantification of Ki67+ glia within each population as a
function of
time shows a significant proliferative advantage by WT glia, that is sustained
throughout the
experiment. HD control: 54 wks (n=4), 72 wks (n=4); WT control: 54 wks (n=5),
72 wks:
11
CA 03234809 2024-4- 11
WO 2023/069979
PCT/US2022/078344
UR 6-22023 /FR: 161118.03801 &03802
n=3; WT vs. HD allograft: 54 wks (n=5), 72 wks (n=3). Comparisons by 2-way
ANOVA
with Sidak's multiple comparisons tests; mean SEM.
FIG. 20A-20I show WT glia acquire a dominant competitor transcriptional
profile in the
face of resident HD glia.
FIG. 20A shows an experimental design.
FIG. 20B shows uniform manifold approximation projection (UMAP) visualization
of
the integrated scRNA-seq data identifying six major cell populations.
FIG. 20C shows UNIAP visualization of the split by group scRNA-seq data
identifying the six major cell populations.
FIG. 20D shows stacked bar plot proportions of cell types in each group.
FIG. 20E shows cell cycle analysis notched box plots of cycling GPCs and GPCs
in
the G2/1VI phase. The box indicates the interquartile range, the notch
indicates the 95%
confidence interval with the median at the center of the notch, and the error
bars represent the
minimum and maximum non-outlier values. Comparisons between groups utilized
Dunn tests
following a Kruskal-Wallis test with multiple comparisons adjusted via the
Benj amini-
Hochberg method. * = < 0.05, ** <0.01, *** = < 0.001, **** = < 0.0001 adjusted
p-value.
FIG. 20F shows Venn diagram of pairwise differentially expressed GPC genes
(Log2
fold change >0.15, adjusted p-value <0.05).
FIG. 20G shows curated ingenuity pathway analysis of genes differentially
expressed
between GPC groups. The size of circles represent p-value while the shading
indicates
activation Z-Score with red being more active in the upper group and green
being more active
in the lower group.
FIG. 20H shows a heatmap of curated pairwise differentially expressed GPC
genes.
FIG. 201 shows violin plots of pairwise differentially expressed GPC ribosomal
gene
1og2 fold changes.
FIG. 21A-21I show that WT glia acquire a dominant transcriptional profile when
confronting their aged counterparts.
FIG. 21A shows the experimental design.
FIG. 21B shows UNIAP visualization of the integrated scRNA-seq data
identifying
six major cell populations.
FIG. 21C shows UNIAP visualization of the split by group scRNA-seq data
identifying the six major cell populations.
FIG. 21D shows stacked bar plot proportions of cell types in each group.
12
CA 03234809 2024-4- 11
WO 2023/069979
PCT/US2022/078344
UR 6-22023 /FR: 161118.03801 &03802
FIG. 21E shows cell cycle analysis notched box plots of cycling GPCs and GPCs
in
the G2/IVI phase. The box indicates the interquartile range, the notch
indicates the 95%
confidence interval with the median at the center of the notch, and the error
bars represent the
minimum and maximum non-outlier values. Comparisons between groups utilized
Dunn
tests, following a Kruskal-Wallis test with multiple comparisons adjusted via
the Benj amini-
Hochberg method. * = < 0.05, ** < 0.01, *** = < 0.001, **** = < 0.0001
adjusted p-value.
FIG. 21F shows Venn diagram of pairwise differentially expressed GPC genes
(Log2
fold change >0.15, adjusted p-value <0.05).
FIG. 21G shows curated Ingenuity Pathway analysis of genes differentially
expressed
between GPC groups. The size of circles represent p-value while the shading
indicates
activation Z-Score with red being more active in the upper group and green
being more active
in the lower group.
FIG. 21H shows a heatmap of curated pairwise differentially expressed GPC
genes.
FIG. 211 shows violin plots of pairwise differentially expressed GPC ribosomal
gene
1og2 fold changes.
FIGs. 22A-22F show transcriptional signature of competitive advantage.
FIG. 22A shows schematic of transcription factor candidate identification.
FIG. 22B shows violin plots of identified WGCNA module eigengenes per
condition.
Represented are significant modules (black, green, blue, brown, red, cyan),
whose members
are enriched for the downstream targets of the five transcription factors in
(FIG. 22E).
FIG. 22C shows relative importance analysis to estimate the differential
contribution
of each biological factor (age vs genotype) to each module eigengene.
FIG. 22D shows that gene set enrichment analysis (GSEA) highlighted those
prioritized transcription factors whose regulons were enriched for upregulated
genes in
dominant young WT cells
FIG. 22E shows important transcription factors predicted via SCENIC to
establish
competitive advantage and their relative activities across groups.
FIG. 22F shows regulatory network with represented downstream targets and
their
functional signaling pathways. Targets belong to highlighted modules in FIG.
22B, and their
expressions are controlled by at least one other important transcription
factors in FIG. 22E.
NE S: Network enrichment score.
FIGs. 23A, 23B, and 23C show that aged human glia are eliminated by their
younger
counterparts through induced apoptosis.
13
CA 03234809 2024-4- 11
WO 2023/069979
PCT/US2022/078344
UR 6-22023 /FR: 161118.03801 &03802
FIG. 23A shows that at the border between young (EGFP', green) and aged WT
glia
(mCherry , red), a higher incidence of apoptotic TUNEL (white) cells are
apparent in the
aged population. Scale: 100 um.
FIG. 23B illustrates that higher magnification of a competitive interface
between
these distinct populations shows resident glia selectively undergoing
apoptosis. Scale: 50 um.
FIG. 23C illustrates that quantification of TUNEL cells shows significantly
higher
incidence of TUNEL cells among aged resident WT glia, relative to both their
younger
isogenic counterparts, and to aged WT chimeric controls not challenged with
younger cells.
Quantification was performed on pooled samples from 60 and 80 weeks timepoints
(n=5 for
all experimental groups). One-way ANOVA with S'iclak's multiple comparisons
test; data are
shown as means SEM with individual data points.
FIGs. 24A and 24B show isolation of implanted human cells from their chimeric
hosts.
FIG. 24A is a schematic illustrating the experimental workflow involved in the
isolation of human cells from the striata of their chimeric hosts.
FIG. 24B shows example of the gating strategy employed in the FACS enrichment
of
human cells extracted from dissociated chimeric striata. Live cells were
identified by their
lack of DAPI incorporation. Of these, human cells were sorted based on their
expression of
their respective fluorescent reporter (EGFP+ or mCherry+), and harvested for
single-cell
sequencing and downstream analysis.
FIGs. 25A, 25B, 25C, 25D, 25E, and 25F show bulk RNA-Seq characterization of
human fetal GPCs.
FIG. 25A shows a workflow of bulk and scRNA-Sequencing of CD140a-h, CD140a-,
and A2B5+/PSA-NCAM--selected 2nd trimester human fetal brain isolates.
FIG. 25B shows principal component analysis of all samples across two batches.
FIG. 25C shows a Venn diagram of CD140a+ vs CD140a- and CD140+ vs
A2B5+/PSA-NCAM- differentially-expressed gene sets (p <0.01 and absolute 1og2-
fold
change >1).
FIG. 25D shows Significant Ingenuity Pathway Analysis terms for both gene
sets.
Size represents -log10 p-value and color represents activation Z-Score (Blue,
CD140a+; Red,
A2B5+ or CD140a-).
FIG. 25E shows 1og2-fold changes of significant genes for both genesets.
Missing
bars were not significant.
14
CA 03234809 2024-4- 11
WO 2023/069979
PCT/US2022/078344
UR 6-22023 /FR: 161118.03801 &03802
FIG. 25F shows a heatmap of transformed transcripts per million (TPM) of
selected
genes in 1E.
FIGs. 26A, 26B, 26C, 26D, 26E, 26F, 26G and 26H show single cell RNA-
sequencing of CD140a and A2B5 selected human fetal GPCs
FIG. 26A shows a UMAP plot of the primary cell types identified during scRNA-
Seq
analysis of FACS isolated hGPCs derived from 20 week gestational age human
fetal
VZ/SVZ.
FIG. 26B shows a UMAP of only PSA-NCAM7A2B5 human fetal cells.
FIG. 26C shows a UMAP of only CD140a+ human fetal cells.
FIG. 26D shows violin plots of cell type-selective marker genes.
FIG. 26E shows a volcano plot of GPC vs pre-GPC populations.
FIG. 26F shows feature plots of select differentially expressed genes between
GPCs
and pre-GPCs.
FIG. 26F shows select significantly-enriched GPC and pre-GPC IPA terms,
indicating their -log10 p-value and activation Z-Score.
FIG. 26H shows select feature plots of transcription factors predicted to be
significantly activated in fetal hGPCs. Relative transcription factor regulon
activation is
displayed as calculated using the SCENIC package.
FIGs. 27A, 27B, 27C, 27D, 27E, and 27F show that adult human GPCs are
transcriptionally and functionally distinct from fetal GPCs
FIG. 27A shows a workflow of bulk RNA-Seq analysis of human adult and fetal
GPCs.
FIG. 27B shows principal component analysis of all samples across three
batches.
FIG. 27C shows a Venn Diagram of both Adult vs Fetal differential expression
gene
sets.
FIG. 27B shows an IPA network of curated terms and genes. Node size is
proportionate to node degree. Label color corresponds to enrichment in either
adult (red) or
fetal (blue) populations.
FIG. 27E shows bar plots of significant IPA terms by module. Z-Scores indicate
predicted activation in fetal (blue) or adult (red) hGPCs.
FIG. 27F shows a bar plot of 1og2-fold changes and heatmap of network genes'
TPM.
CA 03234809 2024-4- 11
WO 2023/069979
PCT/US2022/078344
UR 6-22023 /FR: 161118.03801 &03802
FIGs. 28A, 28B, 28C, 28D, 28E, 28F, and 28G show that inference of
transcription
factor activity implicates a set of transcriptional repressors in the
establishment of adult
hGPC identity.
FIG. 28A shows that normalized enrichment score plots of significantly
enriched
transcription factors predicted to be active in fetal and adult GPCs. Each dot
is a motif
whose size indicates how many genes in which that motif is predicted to be
active, and the
color represents the window around the promoter at which that motif was found
enriched.
FIG. 28B shows a heatmap of enriched TF TPMs
FIG. 28C shows log-fold changes vs adult GPCs, for both fetal hGPC isolates.
FIGs. 28D-G show predicted direct transcription factor activity of curated
genes split
into: (FIG. 28 D) fetal activators; (FIG. 28E) fetal repressors; (FIG. 28F)
adult activators;
and (FIG. 28G) adult repressors. Color indicates differential expression in
either adult
(red) or fetal (blue) hGPCs; shape dictates type of node (octagon, repressor;
rectangle,
activator; oval, other target gene). Boxed and circled genes indicate
functionally-related
genes contributing to either glial progenitor/oligodendrocyte identity,
senescence/proliferation targets, or upstream or downstream TFs that were also
deemed
activated.
FIGs. 29A, 29B, 29C, and 29D show induction of an aged GPC transcriptome via
adult hGPC-enriched repressors.
FIG. 29A shows a schematic outlining the structure of four distinct
doxycycline
(Dox)-inducible EGFP lentiviral expression vectors, each encoding one of the
transcriptional repressors: E2F6, IKZF3, MAX, or ZNF274.
FIG. 29B shows that induced pluripotent stem cell (iPSC)-derived hGPC cultures
(line C27) were transduced with a single lentivirus or vehicle for one day,
and then
treated with Dox for the remainder of the experiment. At 3, 7, and 10 days
following
initiation of Dox-induced transgene expression, hGPCs were isolated via FACS
for qPCR.
FIG. 29C illustrates qPCRs of Dox-treated cells showing expression of each
transcription factor, vs matched timepoint controls.
FIG. 29D shows qPCR fold-change heatmap of select aging related genes. Within
timepoint comparisons to controls were calculated via post hoc least-squares
means tests of
linear models following regression of a cell batch effect. FDR adjusted p-
values: *<0.05, **
<0.01, ***<0,001.
16
CA 03234809 2024-4- 11
WO 2023/069979
PCT/US2022/078344
UR 6-22023 /FR: 161118.03801 &03802
FIGs. 30A, 30B, 30C, 30D, and 30E show that miRNAs drive adult GPC
transcriptional divergence in parallel to transcription factor activity.
FIG. 30A shows principal component analysis of miRNA microarray samples from
human A2B5+ adult and CD140a+ fetal GPCs.
FIG. 30B shows 1og2 fold change bar plots and heatmap of differentially
expressed
miRNAs.
FIG. 30C shows characterization bubble plot of enrichment of miRNAs, versus
the
average 1og2 FC of its predicted gene targets.
FIG. 30D shows curated signaling networks of fetal enriched miRNAs and their
predicted targets.
FIG. 30E shows curated signaling networks of adult enriched miRNAs and their
predicted targets.
FIGs. 31A, 31B, 31C, 31D, and 31E show enrichment of human fetal GPCs via
CD140a+ or A2B5+/PSA-NCANI- selection.
FIG. 31A shows principal component analysis of CD140a+ and A2B5+ fetal GPCs.
FIG. 31B shows volcano plots indicating significant A2B5 (Green) and CD140a
(Blue) enriched genes.
FIG. 31C shows principal component analysis of CD140a+ and CD140a- fetal
cells.
FIG. 31D shows volcano plots indicating significant CD140a- (Magenta) and
CD140a
(Blue) enriched genes.
FIG. 31E shows upset plot of significant up and downregulated genes in both
genesets.
FIGs. 32A, 32B, 32C, and 32D show single cell RNA-Seq quality filtering.
FIG. 32A shows violin plots of unfiltered A2B5+/PSA-NCANI- captures.
FIG. 32B shows violin plots of unfiltered CD140a scRNA-seq captures.
FIG. 32C shows violin plots following quality filtration (Percent
mitochondrial gene
expression <15% and >500 unique genes) of A2B5 /PSA-NCA1VI- captures.
FIG. 32D shows violin plots following quality filtration (Percent
mitochondrial gene
expression <15% and >500 unique genes) CD140a+ captures.
FIGs. 33A, 33B, and 33C show single cell RNA-sequencing of A2B5+/PSA-NCANI"
vs. CD140a. fetal hGPCs. FIG. 33A shows UNIAP plot of A2B5' and CD140a fetal
hGPCs.
FIG. 3313 shows frequency of cell types in each sorting paradigm isolate. FIG.
33C shows
17
CA 03234809 2024-4- 11
WO 2023/069979
PCT/US2022/078344
UR 6-22023 /FR: 161118.03801 &03802
scatter plot of differentially expressed bulk RNA-Seq 1og2 fold changes vs
pseudobulk 1og2
fold changes between CD140a and A2B5+ fetal hGPC isolates.
FIG. 34 shows shared motifs of active transcription factors in fetal or adult
hGPCs.
Matrix of all predicted active transcription factors in fetal and adult GPCs.
Size and color
indicate degree of motifs that are shared between transcription factors.
FIG. 35 shows adult repressor isoform expression. Bar plots of transcripts per
million
(TPMs) of all protein coding adult repressor isoforms in each GPC group.
FIG. 36 shows bulk RNA-Seq of iPSC-derived hGPCs reveals concordant abundance
of age-associated genes. iPSC-derived hGPCs (C27) were isolated via CD140a+
FACS and
assayed via bulk RNA sequencing. Abundance of relevant glial age-associated
genes,
including those in an active transcription factor cohort, are displayed
alongside fetal and adult
hGPC data.
FIGs. 37A and 37B show transcription factor regulation of miRNAs provides post-
transcriptional modulation of glial aging gene expression. FIG. 37A shows 1og2
FC violin
plots of significant adult vs fetal GPC transcription factors predicted to be
upstream of
differentially expressed adult vs fetal GPC miRNAs. FIG. 37B shows network of
identified
transcription factors from FIG. 26 and their predicted regulation of
differentially expressed
adult vs fetal hGPC miRNAs.
DETAILED DESCRIPTION
This disclosure relates to compositions and methods for treating a condition
mediated
by oligodendrocyte loss, astrocyte loss, or white matter loss, including age-
related
oligodendrocyte loss, age-related astrocyte loss, or age-related white matter
loss. This
disclosure also relates to (a) rejuvenating a glial progenitor cell or a
progeny thereof or (b)
enhancing the development potential of a glial progenitor cell or a progeny
thereof
Conditions Mediated By Loss Of While Matter/Oligodendrocytes/Astrocytes And
Related Disorders
Certain aspects of this disclosure relate to compositions and methods for
treating a
condition or disorder mediated by oligodendrocyte loss, astrocyte loss, or
white matter loss.
Such a condition often entails a deficiency in myelin in central nerve system
("CNS").
Examples of such conditions or disorders include any diseases or conditions
related to
demyelination, insufficient myelination and remyelination, or dysmyelination
in a subject.
Such a condition or disorder can be inherited, acquired, or due to the ageing
process, i.e., age-
related. In some embodiments, the condition is that of age-related white
matter disease
18
CA 03234809 2024-4- 11
WO 2023/069979
PCT/US2022/078344
UR 6-22023 /FR: 161118.03801 &03802
defined as or characterized by oligodendrocyte loss, astrocyte loss, or white
matter atrophy in
the setting of normal otherwise healthy aging.
In humans, ageing represents the accumulation of changes in a human being over
time and can encompass physical, psychological, and social changes. Ageing
increases the
risk of human diseases such as cancer, diabetes, cardiovascular disease,
stroke, and many
more, including demyelination in the CNS, which are often seen in various
neurodegenerative
diseases. Accordingly, in some embodiments of this disclosure, the condition
or disorder is
mediated by age-related oligodendrocyte loss, age-related astrocyte loss, or
age-related white
matter loss.
Demyelination in the CNS may occur in response to genetic mutation
(leukodystrophies), autoimmune disease (e.g., multiple sclerosis), or trauma
(e.g., traumatic
brain injury, spinal cord injury, or ischemic stroke). Perturbation of myelin
function may
play a critical role in neurologic and psychiatric disorders such as Autism
Spectrum Disorder
(ASD), Alzheimer's disease, Huntington's disease, Multiple System Atrophy,
Parkinson's
disease, Fragile X syndrome, schizophrenia, and various leukodystrophies.
Leukodystrophies are a group of rare, primarily inherited neurological
disorders that
result from the abnormal production, processing, or development of myelin and
are the result
of genetic defects (mutations). Some forms are present at birth, while others
may not produce
symptoms until a child becomes older. A few primarily affect adults.
Leukodystrophies
include Canavan disease, Pelizaeus-Merzbacher disease, Hypomyelination with
Atrophy of
the Basal Ganglia and Cerebellum, Krabbe disease (Globoid cell
leukodystrophy), X-linked
adrenoleukodystrophy, Metachromatic leukodystrophy, Pelizaeus-Merzbacher-like
disease
(or hypomyelinating leukodystrophy-2), Niemann-Pick disease type C (NPC),
Autosomal
dominant leukodystrophy with autonomic diseases (ADLD), 4H Leukodystrophy (Pol
III-
related leukodystrophy), Zellweger Spectrum Disorders (ZSD), Childhood ataxia
with central
nervous system hypomyelination or CACH (also called vanishing white matter
disease or
VWMD), Cerebrotendinous xanthomatosis (CTX), Alexander disease (AXD), SOX10-
associated peripheral demyelinating neuropathy, central dysmyelinating
leukodystrophy,
Waardenburg syndrome, Hirschsprung disease (PCWH), Adult polyglucosan body
disease
(APBD), Hereditary diffuse leukoencephalopathy with spheroids (HDLS), Aicardi-
Goutieres
syndrome (AGS), and Adult Refsum disease.
Suitable subjects for treatment in accordance with the methods described
herein
include any human subject having a condition mediated by a deficiency in
myelin, which
19
CA 03234809 2024-4- 11
WO 2023/069979
PCT/US2022/078344
UR 6-22023 /FR: 161118.03801 &03802
may be manifested by age-related oligodendrocyte loss, age-related astrocyte
loss, or age-
related white matter loss.
In another embodiment, the condition mediated by a deficiency in myelin is
selected
from the group consisting of pediatric leukodystrophies, the lysosomal storage
diseases,
congenital dysmyelination, cerebral palsy, inflammatory demyelination, post-
infectious and
post-vaccinial leukoencephalitis, radiation- or chemotherapy induced
demyelination, and
vascular demyeli nati on.
In a further embodiment, the condition mediated by a deficiency in myelin
requires
myelination. In another embodiment, the condition mediated by a deficiency in
myelin
requires remyelination. In some embodiments, the condition requiring
remyelination is
selected from the group consisting of multiple sclerosis, neuromyelitis
optica, transverse
myelitis, optic neuritis, subcortical stroke, diabetic leukoencephalopathy,
hypertensive
leukoencephalopathy, age-related white matter disease, white matter dementia,
Binswanger's
disease, spinal cord injury, radiation- or chemotherapy induced demyelination,
post-
infectious and post-vaccinial leukoencephalitis, periventricular leukomalacia,
and cerebral
palsy.
In a further embodiment, the condition mediated by a deficiency in myelin is
neurodegenerative disease. In some embodiments, the neurodegenerative disease
is
Huntington's disease. Huntington's disease is an autosomal dominant
neurodegenerative
disease characterized by a relentlessly progressive movement disorder with
devastating
psychiatric and cognitive deterioration. Huntington's disease is associated
with a consistent
and severe atrophy of the neostriatum which is related to a marked loss of the
GABAergic
medium-sized spiny projection neurons, the major output neurons of the
striatum.
Huntington's disease is characterized by abnormally long CAG repeat expansions
in the first
exon of the Huntingtin gene. The encoded polyglutamine expansions of mutant
huntingtin
protein disrupt its normal functions and protein-protein interactions,
ultimately yielding
widespread neuropathology, most rapidly evident in the neostriatum.
Other neurodegenerative diseases treatable in accordance with the present
application
include frontotemporal dementia, Alzheimer's disease, Parkinson's disease,
multisystem
atrophy, and amyotrophic lateral sclerosis.
In an embodiment, the condition mediated by a deficiency in myelin is a
neuropsychi atri c disease. In some embodiments, the neuropsychi atri c
disease is
schizophrenia. Schizophrenia is a serious mental illness that affects how a
person thinks,
CA 03234809 2024-4- 11
WO 2023/069979
PCT/US2022/078344
UR 6-22023 /FR: 161118.03801 &03802
feels, and behaves. The symptoms of schizophrenia generally fall into the
following three
categories: (1) psychotic symptoms including altered perceptions, (2) negative
symptoms
including loss of motivation, disinterest and lack of enjoyment, and (3)
cognitive symptoms
including problems in attention, concentration, and memory. Other
neuropsychiatric diseases
treatable in accordance with the present application include autism spectrum
disorder and
bipolar disorder.
The above-described myelin-related disorders, inherited or acquired or age-
related,
impact millions of people, levying a heavy burden on affected individuals and
their families.
The pathological processes underlying many of these disorders remain poorly
understood and
few disease-modifying therapies exist. There are unmet needs for therapeutics
for treating
these disorders. This disclosure address these needs in a number of ways, such
as
competitive replacement of aged or older glial progenitor cells in the brain
and rejuvenation
of glial progenitor cells or their progeny cells.
Competitive Replacement Of Glial Progenitor Cells In Adult Brain
Some aspects of this disclosure relate to competitive replacement of glial
progenitor
cells. Competition among cell populations in development and oncogenesis is
well-
established, and yet competition among cells in the adult brain has remained
little-studied. In
particular, it is unknown whether allografted human glia can outcompete
diseased cells to
achieve therapeutic replacement in the adult human brain.
As disclosed herein, inventors engrafted healthy, fluorophore-tagged wild-type
(WT)
hGPCs produced from human embryonic stem cells (hESCs), into the striata of
adult mice
that had been neonatally chimerized with spectrally-distinct mutant HTT-
expressing hGPCs
produced from Huntington disease (HD)-derived hESCs. The WT hGPCs outcompeted
and
ultimately eliminated their human HD counterparts, repopulating the host
striata with healthy
glia. Single-cell RNA-Seq revealed that WT donor hGPCs acquired a YAP1/NlYC-
defined
dominant competitor phenotype upon interaction with the resident HD-derived
glia.
Competitive success depended primarily upon the age difference between
competing
populations, in that adult-transplanted WT hGPCs outcompeted resident isogenic
WT cells
that had been transplanted neonatally, and were thus older. These data
indicate that aged and
diseased human glia may be broadly replaced in adult brain by younger healthy
hGPCs, and
suggest that the transplantation of newly-generated glial progenitors may be
used as a broad
therapeutic platform for the replacement of aged as well as diseased human
glia.
21
CA 03234809 2024-4- 11
WO 2023/069979
PCT/US2022/078344
UR 6-22023 /FR: 161118.03801 &03802
Glial dysfunction is a causal contributor to a broad spectrum of neurological
conditions. Astrocytic and oligodendrocytic pathology have been associated
with the genesis
and progression of a number of both neurodegenerative and neuropsychiatric
disorders,
including conditions as varied as amyotrophic lateral sclerosis (ALS) and
Huntington's
disease (HD), as well as schizophrenia and bipolar disease. In such
conditions, the
replacement of diseased glia by healthy glial progenitor cells (hGPCs) might
provide real
therapeutic benefit, given their ability to disperse and colonize their hosts
while giving rise to
new astrocytes and oligodendrocytes. Yet, while human GPCs can outcompete and
replace
their murine counterparts in a variety of experimental therapeutic models, it
has remained
unclear if allografted human GPCs can replace other human cells, diseased or
otherwise.
As disclosed in the examples below, human glial-chimeric mice were used to
model
competition between healthy and diseased human glia in vivo, by engrafting
healthy hGPCs
into the striata of adult mice neonatally chimerized with hGPCs derived from
subjects with
HD. HD is a prototypic monogenic neurodegenerative disease, resulting from the
expression
of a mutant, CAG-repeat expanded, Huntingtin (mHTT) gene.
Glial pathology is causally involved in the synaptic dysfunction of HD.
Replacement
of mHTT-expressing murine glia by implanted healthy hGPCs was sufficient to
rescue
aspects of HD phenotype in transgenic mouse models. As disclosed herein,
inventors used
genetically-tagged wild-type (WT) and mHTT-expressing hGPCs, derived from
sibling lines
of human embryonic stem cells (hESCs), to ask if healthy WT hGPCs can replace
diseased
HID hGPCs in vivo. It was found that when healthy hGPCs were delivered into
the striata of
adult mice chimerized with HD hGPCs, the healthy hGPCs outcompeted and
displaced the
already resident I-ID hGPCs. However, since the WT donor cells were
effectively younger
than the resident host glia that they were replacing, it was asked if
differences in cell age
might also contribute to competitive outcome. It was found this to be so, in
that healthy
young hGPCs implanted into adult mice that had been neonatally engrafted with
separately-
tagged glia derived from the same healthy line, inexorably replaced their
older isogenic
counterparts. Single cell RNA sequence analysis (scRNA-seq) of the younger
winning and
older losing hGPC populations revealed a set of differentially-expressed
pathways that
overlapped those of winning WT and losing HD hGPCs, suggesting a common
transcriptional signature of competitively dominant GPC S. These data indicate
that dynamic
competition among clonally-distinct gli al populations may occur in the mature
adult brain,
22
CA 03234809 2024-4- 11
WO 2023/069979
PCT/US2022/078344
UR 6-22023 /FR: 161118.03801 &03802
and that the replacement of both existing and diseased glia may thereby be
achieved by the
introduction of young healthy hGPCs.
In light of the contribution of glial pathology to a broad variety of
neurodegenerative
and neuropsychiatric disorders, inventors sought here to establish the
relative fitness of wild-
type and diseased human GPCs in vivo, so as to assess the potential for
allogeneic glial
replacement as a therapeutic strategy. Some parts of this disclosure focused
on Huntington's
disease, given the well-described role of glial pathology in HD. It was found
that when WT
hGPCs were introduced into brains already chimerized with HD hGPCs, the WT
cells
competitively dominated and ultimately replaced the already-resident HD glial
progenitors.
The selective expansion of the healthy cells was associated with the active
elimination of the
resident HD glia from the tissue, supported by the sustained proliferative
advantage of the
healthy donor cells relative to their already-resident diseased counterparts.
Single-cell RNA sequence analysis revealed that the dominance of healthy WT
hGPCs encountering HD glia in vivo was associated with their expression of a
signature
typical of successful cell-cell competition. Surprisingly though, when
controlled for the
relative ages of the already-resident (older) and newly-introduced (younger)
donor hGPCs, it
was found that WT hGPCs transplanted into adult neostriata that had been
chimerized
neonatally, with separately-tagged but otherwise isogenic WT hGPCs, similarly
dominated
and replaced the already-resident hGPCs. This observation suggested that
cellular youth was
a critical determinant of competitive success, and of the ability of a donor
hGPC population
to replace that of the host. Accordingly, transplanted young WT hGPCs acquired
the gene
expression signature of a dominant competitor phenotype in vivo, whether
challenged by
already-resident older HD or isogenic WT hGPCs; indeed, the analysis described
herein
suggested that cellular youth was an even stronger determinant of competitive
fitness than
was disease genotype.
These observations suggest that this process was driven by a recapitulation of
developmental cell competition, an evolutionarily conserved selection process
by which less
fit clones are sensed and eliminated from a tissue by their fitter neighbors,
but as manifested
here dynamically in the adult brain. This process has been shown in a variety
of systems to
comprise the active elimination of relatively slowly growing cells by their
faster growing,
more competitively fit neighbors. It was noted that in the adult brain, WT
hGPCs typically
expanded from their implantation sites in an advancing proliferative wave.
These younger
hGPCs largely eliminated their hitherto stably resident ¨ and hence older -
counterparts,
23
CA 03234809 2024-4- 11
WO 2023/069979
PCT/US2022/078344
UR 6-22023 /FR: 161118.03801 &03802
whether the latter were mHTT-expressing HD cells, or isogenic WT cells that
had been
transplanted months earlier. In both cases, the younger cells ultimately
recolonized their host
brains with healthy new hGPCs (FIGs. 4 and 17), and in both cases the younger
donor cells
differentially expressed gene sets associated with competitive dominance
(FIGs. 20-22). In
particular, the competitive dominance of younger, adult-transplanted hGPCs was
associated
with their increased levels of predicted MYC and YAP1 pathway activity. These
data
provided a striking parallel to cell-cell competition in the mouse embryo, in
which defective
cells are eliminated by their neighbors following the acquisition of
differential MYC
expression during competitive challenge, and in which YAP and MYC interact to
determine
competitive outcomes during cell-cell competition. Indeed, the concurrent
enrichment for
YAP1 pathway members in "winner" WT hGPCs, including transcripts both upstream
and
downstream of YAP1, suggests that the Hippo pathway might be an especially
promising
target for the regulation of glial replacement in the adult human brain.
Indeed, these
observations parallel the results of liver repopulation studies, in which
mouse fetal liver
progenitors were found to drive faster and more extensive replacement when
allografted into
older than into younger hosts, and for which MYC and YAP1 activities were
predominant
determinants of competitive success. As such, the identification of YAP1 and
MYC as
important regulators of competition among hGPCs may enable strategies by which
to further
enhance the competitive advantage, speed and extent of donor cell colonization
following the
delivery of these cells to the brain.
The competitive replacement of resident glia by younger hGPCs that were
observed
resembles that of mouse glial replacement by implanted human GPCs, as their
expansion
within the murine brain is also sustained by a relative proliferative
advantage, and progresses
with the elimination of their murine counterparts upon contact. As in the
xenograft setting,
the winning population of young WT hGPCs appears to trigger the apoptotic
death and local
elimination of the resident losing population, whether comprised of older
isogenic WT or
sibling BD cells. The relative localization of dying host cells to the
advancing wavefronts of
younger WT cells suggests that the latter trigger the death of already-
resident hGPCs via
contact-dependent means. Potential mechanisms for such contact-dependent
expression of
relative cell fitness have been described in a variety of models, and include
selective
expression of Fwr isoforms, as well as mechanical signals, potentially
transduced through
Piezol-dependent modulation of YAP. In addition, the selective elimination of
both HD and
isogenic hGPCs when confronted with younger hGPCs was paralleled by their
depletion of
24
CA 03234809 2024-4- 11
WO 2023/069979
PCT/US2022/078344
UR 6-22023 /FR: 161118.03801 &03802
ribosomal encoding transcripts, consistent with the loss of ribosomal
transcripts by 'loser'
cells during cell competition, and highlighting the contribution of ribosomal
protein
transcription to the regulation of cell fitness. Together, these data suggest
that the
transcriptional control of translational machinery is as important in cell-
cell competition in
the adult brain as it is in development.
These observations suggest that the brain may be a far more dynamic structural
environment than previously recognized, with cell-cell competition among glial
progenitor
cells - and potentially their derived astrocytes - playing as critical a role
in adult brain
maintenance as in development. Indeed, this competitive advantage inventors
noted of young
over older resident cells seems to largely mimic development, where successive
waves of
GPCs compete amongst each other, with the oldest largely eradicated from the
brain by birth,
replaced by younger successors. In adulthood, one may similarly envision that
somatic
mutation among dividing glial progenitors may yield selective clonal advantage
to one
daughter lineage or the other, resulting in the inexorable competitive
replacement of the
population by descendants of the dominant daughter. This scenario, while
typifying the onset
of carcinogenesis and potentially gliomagenesis as well, may also be involved
in tumor
suppression, via the competitive elimination of neoplastic cells by more fit
non-neoplastic
neighbors. It is especially intriguing to consider whether such a process of
dynamic
competition among differentially fit hGPCs may be similarly involved in the
development of
non-neoplastic adult-onset brain disorders in which glia are involved, such as
some
schizophrenias, and HD itself. Indeed, such a mechanism may contribute to the
late-stage
acceleration in disease progression often noted among those neurodegenerative
and
neuropsychiatric disorders in which glial pathology is involved. In broad
terms, these data
suggest that resident, and hence older, diseased human glia may be replaced
following the
introduction of younger and healthier hGPCs. Indeed, such glial replacement
may offer a
viable strategy towards the cell-based treatment of those diseases of the
human brain in which
glial cells are causally involved.
Rejuvenation Of Glial Progenitor Cells Or Progenies Thereof
Some aspects of this disclosure relate to rejuvenation of glial progenitor
cells or their
progeny cells. Human glial progenitor cells emerge during the 2' trimester to
colonize the
brain, in which a parenchymal pool remains throughout adulthood. While fetal
hGPCs are
highly migratory and proliferative, their expansion competence diminishes with
age, as well
as following demyelination-associated turnover.
CA 03234809 2024-4- 11
WO 2023/069979
PCT/US2022/078344
UR 6-22023 /FR: 161118.03801 &03802
As disclosed herein, to determine the basis for their decline in mobilization
capacity,
bulk and single cell RNA-Sequencing were used to compare the transcriptional
programs of
fetal and adult hGPCs. To that end, age-associated changes in gene expression
were
identified suggesting a loss of proliferative competence, concurrent with the
onset of
differentiation and senescence-associated transcriptional programs. More
specifically, adult
hGPCs developed a repressive transcription factor network centered on MYC, and
regulated
by ZNF274, MAX, IKZF3, and E2F6. Shown below are some exemplary nucleic acid
sequences and amino acid sequences of these repressors.
E2F6
cDNA (SEQ TO NO: 4):
ATGAGTCAGCAGCGGCCGGCGAGGAAGTTACCCACTCTCCTCCTGGACCCGACGGAGGAGACGGITCGCC
GTCGGTGCCGAGACCCCATCAACGTGGAGGGCCTGCTGCCATCAAAAATAAGGATTAATTTAGAAGATAA
TGTACAATATGTGTCCATGAGAAAAGCTCTAAAAGTGAAGAGACCTCGTTTTGATGTATCGCTGGTTTAT
TTAACTCGAAAATTTATGGATCTTGTCAGATCTGCTCCCGGGGGTATTCTTGACTTAAACAAGGTTGCAA
CGAAACTGGGAGTCCGAAAGCGGAGAGTGTATGACATCACCAATGTCTTAGATGGAATCGACCTCGTTGA
AAAGAAATCCAAGAACCATATTAGATGGATAGGATCTGATCTTAGCAATTTTGGAGCAGTTCCCCAACAA
AACAAGCTACAGGAGGAACTTTCTCACTTATCACCAATCGAACATCCTTTCGATGAGTTAATTAAGGATT
GTGCTCAGCAGCTGTTTGAGTTAACAGATGACAAAGAAAATGAAAGACTAGCATATGTGACCTATCAAGA
CATTCATAGCATTCAGGCCTTCCATGAACAGATCGTCATTGCAGTTAAAGCTCCAGCAGAAACCAaATTG
GATGTTCCAGCTCCCAGAGAAGACTCTATCACAGTGCACATAAGGAGCACCAACGGACCTATCGATGTCT
ATTTGTGTGAAGTGGAGCAGGGTCAGACCAGTAACAAAAGGTCTGAAGGTGTCGGGACCTCTTCATCTGA
GAGCACTCATCCAGAAGGCCCTGAGGAAGAAGAAAATCCTCAGCAAAGTGAAGAATTGCTTGAAGTAAGC
AACTGA
Amino Acid (SEQ ID NO: 5):
MSQQRPARKLPSLLLDPTEETVRRRCRDPINVECLLPSKIRINLEDNVQYVSMRKALKVKRPRFDVSLVY
LTRKFMDLVRSAPGGILDLNKVATKLGVRKRRVYDITNVLDGIDLVEKKSKNHIRWIGSDLSNFGAVPQQ
KKLQEELSDLSAMEDALDELIKDCAQQLFELTDDKENERLAYVTYQDIHSIQAFHEQIVIAVKAPAETRL
DVPAPREDSITVHIRSTNGPIDVYLCEVEQGQTSNKRSEGVGTSSSESTHPEGPEEEENPQQSEELLEVS
N
IKZF3
cDNA (SEQ ID NO: 6):
ATGGGAAGTGAAAGAGCTCTCGTACTGGACAaATTAGCAAGCAATGTGGCAAAACGAAAAAGCTCAATGC
CTCAGAAATTCATTGGTGAGAAGCGCCACTGCTTTGATGTCAACTATAATTCAAGTTACATGTATGAGAA
AGAGAGTGAGCTCATACAGACCCGCATGATGaACCAAGCCATCAATAACGCCATCAGCTATCTTGGCGCC
GAAGCCCTGCGCCCCTTGGTCCAGACACCGCCTGCTCCCACCTCGGAGATGGTTCCAGTTATCAGCAGCA
TGTATCCCATAGCCCTCACCCGGGCTGAGATGTCAAACGGTGCCCCTCAAGAGCTGGAAAAGAAAAGCAT
CCACCTTCCAGAGAAGAGCGTGCCTTCTGAGAGAGGCCTCTCTCCCAAaAATAGTGGCCACGACTCCACG
GACACTGACAGCAACCATGAAGAACGCCAGAATCACATCTATCAGCAAAATCACATGGTCCTGTCTCGGG
CCCGCAATGGGATGCCACTTCTGAAGGAGGTTCCCCGCTCTTACGAACTCCTCAAGCCCCCGCCCATCTG
CCCAAGAGACTCCGTCAAAGTGATCAACAAGaAAGGGGAGGTGATGGATGTGTATCGGTGTGACCACTGC
CGCGTCCTCTTCCTGGACTATGTGATGTTCACGATTCACATGGGCTGCaACGGCTTCCGTGACCCTTTCG
AGTGTAACATGTGTGGATATCGAAGCCATGATCGGTATGAGTTCTCGTCTCACATAGCCAGAGGAGAACA
CAGAGCCCTGCTGAAGTGA
Amino Acid (SEQ ID NO: 7):
MGSERALVLDRLASNVAKRKSSMPQKFIGEKRHCFDVNYNSSYMYEKESELIQTRKMDQAINNAISYLGA
EALRPLVQTPPAPTSEMVPVISSMYPIALTRAEMSNGAPQELEKKSINLPEKSVPSERGLSPNNSGEDST
DTDSNHEERQNHIYQQNHMVLSRARNGMPLLKEVPRSYELLKPPPICPRDSVKVINKEGEVMDVYRCDHC
RVLELDYVMFTIHMGCHGFRDPFECNMCGYRSHDRYEFSSHIARGEHRALLK
26
CA 03234809 2024-4- 11
WO 2023/069979
PCT/US2022/078344
UR 6-22023 /FR: 161118.03801 &03802
MAX
cDNA (SEQ ID NO: 8) :
AT GAGCGATAAC GAT GACAT CGAGGT GGAGAG CGAC GAAGAGCAACCGAGGT TT CAAT CT GCGGCT
GACA
AACGGGCT CAT CATAATGCACT GGAACGAAAACGTAGGGACCACATCAAAGACAGCTIT CACAGTT T GC G
GGACT CAGTCCCATCACTCCAAGGAGAGAAGCTCTATTTCCT CT T TT GGAAATT GT GTACT CCTGT C
CT T
CAT C GT CAAAGT T T GAT GCAGAAAT GC CACAC CT T CAT T T CAAGCTACCAAGT
GCACAA.GAAAAAAGAAT
GCAAGATTTAA
Amino Acid ( SEQ ID NO: 9) :
MS DND DI EVES D EEQ P RFQ SAADKRAHHNAL E RKRRDH I KDS FHSLRDSVP SLQGEKLYFL
FWKLCT PVL
HRQSLMQKCHTFI SSYQVHKKKECKI
ZNF2 7 4
cDNA (SEQ ID NO: 10) :
AT GCT GGAGAACTACAGGAACC T GGT CT CAGT GGAACAT CAGCT T T C CAAAC CAGAT GT
GGTAT CT CAGT
TAGAGGAGGCAGAAGATTTCTGGCCAGTGGAGAGAGGAATTCCT CAAGACAC CAT T CCAGAGTAT C CT GA
GCTCCAGCTGGACCCTAAATTGGAT CCTCTTC CT GCT GAGAGTCCCCTAATGAACATTGAGGTTGTTGA.G
GT CCT CACACT GAAC CAGGAGGT GGCT GGT CC CCGGAAT GCCCAGAT CCAGGCCCTATAT GOT
GAAGAT G
GAAGC CT GAGT GCAGATGCC CC CAGTGAGCAG GT CCAACAGCAGGGCAAGCATCCAGGT GACCCTGAGGC
CGCGCGCCAGAGGTT CCGGCAGTTCCGTTATAAGGACATGACAGGTCCC CGGGAGGCCCTGGACCAGCTC
CGAGAGCT GTGT CAC_:CAGTGGCTACAGCCTAAGGCACGCTCCAAGGAGCAGATCCT GGAGCT GCT GGT GC
T GGAGCAGT TCCTAGGTGCA CT GCCTGTGAAGCTCCGGACATGGGTGGAATCGCAGCACCCAGAGAACTG
CCAAGAGGTGGT GGC CCT GGTAGAGGGTGT GACCTGGAT GT CT GAGGAG GAAGTACTT C CT
GCAGGACAA
C CT GC CGA.GGGCACCACCT GCT GCCTCGAGGT
CACTGCCCAGCA.GGAGGAGAAGCAGGA.GGATGCA.GCCA
ICI0000AGACAG1GC1CcAGGAGCCAG1GACCTTCCAGGATGT GGCTGT GGAC'1"1' CAGCCGGGA
GGAGT GGGGGCT GCT GGGCC CGACACAGAGGACCGAGTACCGCGATGT GAT GCT GGAGACCT T
TGGGCAC
CT GGT CT CT GT GGGGT GGGA GA CTACACT GGAAAATAAAGAGT TAGCT C CAAAT T CTGA CAT
T CCT GAGG
AAGAACCA.GCCC C CAGCCT GAAAGTACAAGAAT CCT CAAGGGAT T GT GC CT T GT CCTCTACAT
TAGAAGA
TACCTTGCAGGGT GGGGT CCAG GAAGT CCAAGACACAGT GT T GAAGCAGATGGAGT CT GCT
CAGGAAAAA
GACCTTCCTCAGAAGAAGCACTTTGACAACCGTGAGT CCCAGGCAAACAGTGGTGCTCTTGACACAAACC
AAGTTTCGCTCCAGAAAATT GACAACCCTGAGTCCCAGGCAAACAGTGGCGCTCTT GACACAAACCAAGT
T T T GCTCCACAAAAT T CCT C CTAGAAAAC GAT T GCGCAAAC GT GACT CACAAGT TAAAAGTAT
GAAACAT
AAT T CAC GT GTAAAAATT CAT CAGAAGAG C T GT GAAAG G CAAAAG GC CAAG GAAG G CAAT
G GT T GTAGGA
AAACCTTCAGTCGGAGTACTAAACAGATTACGTTTATAAGAATT CACAAGGGGAGC CAAGT T T GCC GAT G
CAGTGAAT GTGGTAAAATAT TC CGGAACCCAAGATACT T T T CT GT
GCATAAGAAAATCCATACCGGAGAG
AGGCC CTA T GT GT GT CAAGA CT GT GGGAAAGGAT TT GT T CAGAGCTCT T
CCCTCACACAGCATCAGAGAG
T T CAT TCT GGAGAGAGACCAT T T GAAT GT CAG GAGT GT GGGAGGACCT T CAATGAT CGCT
CAGCCA.T CT C
CCAGCACCTGAGGACTCACACT GCCGCTAACC CCTACAAGT GT CAGGAC T GT GGAAAAGCCT T
CCGCCAG
AGCT C CCACCT CAT CAGACAT CAGAGGACT CACACCGGGGAGCGCCCATAT GCAT GCAA.CAAAT GT
GGAA
AGGCCTTCACCCAGAGCTCACA.CCTTATTGGGCACCAGAGAACCCACAATAGGACAAAGCGAAAGAAGAA
ACAGCCTACCTCATAG
Amino Acid ( SEQ ID NO: 11) :
MLENYRNI,VSVEHQL SKPDVVS QLEEAEDFWPVERGI PQDT I PEYPELQ LDPKLDP LPAES P LMN I
EVVE
VLTLNQEVAGPRNAQ QALYAE DCS LSADAP S EQVQQQGKHP GDPEAARQRFROFRYKDMT GP REAL DQL
RELCHQWLQPKARSKEQI LELLVLEQFLGALPVKLRTWVESQHP ENCQEVVALVEGVTWMS EEEVL PAGQ
PAEGTTCCLEVTAQQEEKQEDAAI C PVTVL E E PVT FQDVAVD FS REEW GL L GP TQ RT EYRDVML
ET FGH
LVSVGWETTLENKELAPNSDIP EEE PAP S LKVQE S S RDCAL S STL EDT L QGGVQEVQDTVL KQME
SAQEK
D L PQKKH FDNRE SQAN S GAL DTNQVS LQK I DN PESQANS GAL DTNQVL L HKI
PPRKRLRKRDSQVKSMKH
NSRVKIHQKSCERQKAKEGNGCRKT FSRSTKQ IT FT RIHKGSQVCRCSECGKI FRN PRYFSVHKKI HTGE
RP YVCQDC GKGFVQ S S SLTQHQRVHSGERP FE CQECGRT FNDRSAI
SQHLRTHTGAKPYKCQDCGKAFRQ
S S HL I RHQRTHT GERPYACNKCGKAFTQS S EL I GHQRTHNRT KRKKKQP TS
Individual over-expression of each of these factors in human iPSC-derived GPCs
led
to a loss of proliferative gene expression and an induction of markers of
senescence, that
replicated the transcriptional changes incurred during glial aging. Parallel
miRNA profiling
identified an adult-selective miRNA expression signature, whose targets may
further
27
CA 03234809 2024-4- 11
WO 2023/069979
PCT/US2022/078344
UR 6-22023 /FR: 161118.03801 &03802
constrain the expansion competence of aged GPCs. These observations indicate
that hGPCs
age through the acquisition of a MYC-repressive environment, suggesting that
suppression of
these repressors of glial expansion and turnover permits the effective
rejuvenation of aged
hGPCs.
Glial progenitor cells (GPCs, also referred to as oligodendrocyte progenitor
cells and
NG2 cells) colonize the human brain during development, and persist in
abundance
throughout adulthood. During development, human GPCs (hGPCs) are highly
proliferative
bipotential cells, producing new oligodendrocytes and astrocytes (Ffrench-
Constant and Raff,
1986; Raff et al., 1983). In rodents, this capacity wanes during normal aging,
with
proliferation, migration, and differentiation competence all diminishing in
aged GPCs (Chari
et al., 2003; Gao and Raff, 1997; Moyon et al., 2021; Segel et at., 2019; Tang
et at., 2000;
Temple and Raff, 1986; Wolswijk and Noble, 1989; Wren et al., 1992).
Similarly, adult
human GPCs are less proliferative, less migratory, and more readily
differentiated than their
fetal counterparts when transplanted into congenitally dysmyelinated murine
hosts (Windrem
et al., 2004). Yet despite the manifestly different competencies of fetal and
adult hGPCs, and
the abundant data on GPC transcription in rodent models of aging, little data
are available
that address changes in GPC gene expression during human aging (Perlman et
al., 2020; Sim
et at., 2006), or that provide clear head-to-head comparisons of transcription
by fetal and
adult human GPCs. Certain parts of this disclosure therefore compare the
transcriptional
patterns of fetal and adult hGPCs, and use that data to identify those
regulatory pathways
causally linked to the maturation and aging of these cells
To this end, inventors first utilized bulk and single cell RNA-Sequencing
(scRNA-
Seq) of A2B5, and CD140a/PDGFRa, hGPCs isolated from human fetal forebrain, so
as to
define their transcriptional signatures and heterogeneity. Inventors then
compared these data
to the gene expression of isolated adult hGPCs, and found that the latter
exhibited
transcriptional patterns suggesting a loss of proliferative capacity, the
onset of an early
phenotypically-differentiated profile, and the induction of senescence.
Transcription factor
motif enrichment analysis of the promoters of differentially expressed genes
then implicated
the adult-induced transcriptional repressors E2F6, ZNF274, MAX, and IKZF3 as
principal
drivers of the human glial aging program. Network analysis strongly suggested
that as a
group, these genes worked though the inhibition of MYC and its proximal
targets, which
were relatively over-expressed in fetal hGPCs. Critically, it was then found
that over-
expression of these adult repressors in newly generated human iPSC-derived
GPCs, which
28
CA 03234809 2024-4- 11
WO 2023/069979
PCT/US2022/078344
UR 6-22023 /FR: 161118.03801 &03802
are analogous to fetal hGPCs in their expression signatures, indeed led to the
induction of
transcriptional signatures that substantially recapitulated those of adult
GPCs. Inventors then
identified a cohort of miRNAs selectively-expressed by adult hGPCs, that were
predicted to
post-transcriptionally inhibit fetal GPC gene expression, especially so in
concert with the
adult-acquired repressor network. Together, these data suggest that a cohort
of repressors
appears during the aging of adult human GPCs, whose activity is centered on
MYC and
MYC-dependent transcription. As such, these repressors may comprise feasible
therapeutic
targets, whose modulation may restore salient features of the mitotic and
differentiation
competence of aged or otherwise mitotically-exhausted GPCs.
Suppressor/Rejuvenation Therapy
In one aspect, the present disclosure provides therapy methods by suppressing
a
transcription repressor selected from the group consisting of E2F6, ZNF274,
MAX, and
IKZF3. In some examples, this can be achieved by administering to a subject in
need thereof
or a target cell in need thereof a suppressor or inhibitor of one or more of
the transcription
repressor. Such a suppressor or inhibitor can comprise or be a small molecule
compound, an
oligonucleotide, a nucleic acid, a peptide, a polypeptide, a CRISPR/Cas
system, or an
antibody or an antigen-binding portion thereof. Examples of the
suppressor/inhibitor include
activators, agonists, or potentiators of the related YAP or MYC pathway
signaling pathways
(e.g, the Hippo signaling pathway). Various activators for this signaling
pathway are known
in the art. In some embodiments, the suppressor is an inhibitory nucleic acid
or interfering
nucleic acid, such as siRNA, shRNA, miRNA, antisense oligonucleotides (AS0s),
and/or a
nucleic acid comprising one or more modified nucleic acid residues.
Inhibitory nucleic acids
Certain aspects of the disclosure provide one or more inhibitory nucleic acids
(e.g.,
inhibitory RNA molecules), polynucleotides encoding such inhibitory nucleic
acids, and
transgenes engineered to express such inhibitory nucleic acids. The one or
more inhibitory
nucleic acids may target the same gene (e.g., hybridize or specifically bind
to a same mRNA
sequence or different mRNA sequences of the same gene) or different genes
(e.g., hybridize
or specifically bind to mRNAs of different genes). Accordingly, the methods
described herein
can include reducing expression of E2F6, ZNF274, MAX, or IKZF3 gene using
inhibitory
nucleic acids that target the E2F6, ZNF274, MAX, or IKZF3 gene or mRNA
29
CA 03234809 2024-4- 11
WO 2023/069979
PCT/US2022/078344
UR 6-22023 /FR: 161118.03801 &03802
An inhibitory nucleic acid refers to a nucleic acid that can bind to a target
nucleic acid
(e.g, a target RNA) in a cell and reduce or inhibit the level or function of
the target nucleic
acid in the cell. Example of the inhibitory nucleic acid include antisense
oligonucleotides,
ribozymes, external guide sequence (EGS) oligonucleotides, small interfering
(si)RNA
compounds, single- or double-stranded RNA interference compounds, modified
bases/locked
nucleic acids (LNAs), antagomirs, peptide nucleic acids (PNAs), and other
oligomeric
compounds or oligonucleotide mimetics that specifically hybridize to at least
a portion of a
target nucleic acid (e.g., E2F6, ZNF274, MAX, or IKZF3 mRNA) and modulate its
level or
function.
In some embodiments, the inhibitory nucleic acid can be an antisense RNA, an
antisense DNA, a chimeric antisense oligonucleotide, an antisense
oligonucleotide
comprising modified linkages, an interference RNA (iRNA), a short or small
interfering RNA
(siRNA), a micro RNA or micro interfering RNA (miRNA), a small temporal RNA
(stRNA),
a short hairpin RNA (shRNA), a small RNA-induced gene activation agent (RNAa),
a small
activating RNA (saRNA), or combinations thereof. The inhibitory nucleic acids
can be
modified, e.g., to include a modified nucleotide (e.g., locked nucleic acid)
or backbone (e.g.,
backbones that do not include a phosphorus atom therein), or can by mixmers or
gapmers,
see, e.g., W02013/006619, which is incorporated herein by reference for its
teachings related
to modifications of oligonucleotides.
In some examples, the inhibitory nucleic acid is an inhibitory RNA molecule
that
mediates RNA interference (RNAi), a process by which cells regulate gene
expression. A
double-stranded RNA (dsRNA) in the cell cytoplasm triggers the RNAi pathway in
which the
double-stranded RNA is processed into small double-stranded fragments of
approximately
21-23 nucleotides in length by the RNAse III-like enzyme DICER. These double-
stranded
fragments are integrated into a multi-subunit protein called the RNA-induced
silencing
complex (RISC). The RISC contains Argonaute proteins that unwind the double-
stranded
fragment into a passenger strand that is removed from the complex and a guide
strand that is
complementary to a target sequence in a specific mRNA and which directs the
RISC complex
to cleave or suppress the translation of the specific target mRNA molecule
(Kotowska-
Zimmer et al., 2021). In this way the gene that encoded the mRNA molecule is
rendered
essentially inactive or "silenced."
RNAi technology may employ a number of tools, including synthetic siRNAs,
vector-
based shRNAs, and artificial miRNAs (amiRNAs). Synthetic siRNAs are exogenous
double
CA 03234809 2024-4- 11
WO 2023/069979
PCT/US2022/078344
UR 6-22023 /FR: 161118.03801 &03802
stranded RNAs that must be delivered into cells and must overcome stability
and
pharmacokinetic challenges. shRNAs are artificial RNA molecules with a tight
hairpin loop
structure that are delivered to cells using plasmids or viral expression
vectors. shRNAs are
typically transcribed from strong poi III promoters (e.g., U6 or H1) and enter
the RNAi
pathway as hairpins. However, transcription driven by strong pol III promoters
can produce
supraphysiologic levels of shRNA that saturate the endogenous miRNA biogenesis
machinery, resulting in toxicity. AmiRNAs embed a target-specific shRNA insert
in a
scaffold based on a natural primary miRNA (pri-miRNA). This ensures proper
processing
and transport similar to endogenous miRNAs, resulting in lower toxicity
(Kotowska-Zimmer
et al., 2021).
In some embodiments of this disclosure, the inhibitory RNA molecule can be an
siRNA, a miRNA (including an amiRNA), or an shRNA. An siRNA is known in the
art as a
double-stranded RNA molecule of approximately 19-25 (e.g., 19-23) base pairs
in length that
induces RNAi in a cell. In some embodiments, the siRNA sequence can also be
inserted into
an artificial miRNA scaffold ("shmiRNA"). An shRNA is known in the art as an
RNA
molecule comprising approximately 19-25 (e.g., 19-23) base pairs of double
stranded RNA
linked by a short loop (e.g., about 4-11 nucleotides) that induces RNAi in a
cell. An miRNA
is known in the art as an RNA molecule that induces RNAi in a cell comprising
a short (e.g.,
19-25 base pairs) sequence of double-stranded RNA linked by a loop and
containing one or
more additional sequences of double-stranded RNA comprising one or more bulges
(e.g.,
mis-paired or unpaired base pairs).
As used herein, the term "miRNA" encompasses endogenous miRNAs as well as
exogenous or heterologous miRNAs. In some embodiments, "miRNA" may refer to a
pri-
miRNA or a pre-miRNA. During miRNA processing, a pri-miRNA transcript is
produced.
The pri-miRNA is processed by Drosha-DGCR8 to produce a pre-miRNA by excising
one or
more sequences to leave a pre-miRNA with a 5' flanking region, a guide strand,
a loop
region, a non-guide strand, and a 3' flanking region; or a 5' flanking region,
a non-guide
strand, a loop region, a guide strand, and a 3' flanking region. The pre-miRNA
is then
exported to the cytoplasm and processed by Dicer to yield a siRNA with a guide
strand and a
non-guide (or passenger) strand. The guide strand is then used by the RISC
complex to
catalyze gene silencing, e.g., by recognizing a target RNA sequence
complementary to the
guide strand. Further description of miRNAs may be found, e.g., in WO
2008/150897. The
recognition of a target sequence by a miRNA is primarily determined by pairing
between the
31
CA 03234809 2024-4- 11
WO 2023/069979
PCT/US2022/078344
UR 6-22023 /FR: 161118.03801 &03802
target and the miRNA seed sequence, e.g., nucleotides 1-8 (5' to 3') of the
guide strand (see,
e.g., Boudreau, R. L. etal. (2013) Nucleic Acids Res. 41:e9).
Shown below are some exemplary suppressor miRNAs that target and suppress one
or
more of E2F6, ZNF274, MAX, and 1KZF3.
Table. Sequences of suppressor miRNAs
Name Nucleic Acid Sequence Accession number SEQ ID
NO
hsa-miR-125b-5p ucccugagacccuaacuuguga MIMAT0000423 12
hsa-miR-106a-5p aaaagugcuuacagugcagguag MIMAT0000103 13
hsa-miR-17-5p caaagugcuuacagugcagguag MIMAT0000070 14
hsa-miR-130a-3p cagugcaauguuaaaagggcau MIMAT0000425 15
hsa-miR-130b-3p cagugcaaugaugaaagggcau MIMAT0000691 16
hsa-miR-379-5p ugguagacuauggaacguagg M1MAT0000733 17
hsa-miR-93-3p acug cugagcuagcacuucccg MIMAT0004509 18
hsa-miR-1260b aucc ca cc acugc cac cau MIMAT0015041 19
hsa-miR-767-5p ugca ccaugguugucugagcaug MIMAT0003882 20
hsa-miR-30b-5p uguaaacauccuacacucagcu MIMAT0000420 21
hsa-miR-9-3p auaaagcuagauaa ccgaaagu MIMAT0000442 22
hsa-miR-9-5p ucuuugguuaucuagcuguauga MIMAT0000441 23
hsa-miR-485-5p agaggcuggccgugaugaauuc MIMAT0002175 24
In some embodiments of this disclosure, an inhibitory RNA molecule forms a
hairpin
structure. Generally, hairpin-forming RNAs are arranged into a self-
complementary "stem-
loop" structure that includes a single nucleic acid encoding a stem portion
having a duplex
comprising a sense strand (e.g., passenger strand) connected to an antisense
strand (e.g.,
guide strand) by a loop sequence. The passenger strand and the guide strand
share
complementarity. In some embodiments, the passenger strand and guide strand
share 100%
complementarity. In some embodiments, the passenger strand and guide strand
share at least
50%, at least 60%, at least 70%, at least 80%, at least 90%, at least 95%, or
at least 99%
complementarity. A passenger strand and a guide strand may lack
complementarity due to a
base-pair mismatch. In some embodiments, the passenger strand and guide strand
of a
hairpin-forming RNA may have at least 1, at least 2, at least 3, at least 4,
at least 5, at least 6,
at least 7 at least 8, at least 9, or at least 10 mismatches. Generally, the
first 2-8 nucleotides of
the stem (relative to the loop) are referred to as "seed" residues and play an
important role in
target recognition and binding. The first residue of the stem (relative to the
loop) is referred
to as the "anchor" residue. In some embodiments, hairpin-forming RNA have a
mismatch at
the anchor residue.
In some embodiments, an inhibitory RNA molecule is processed in a cell (or
subject)
to form a "mature miRNA". Mature miRNA is the result of a multistep pathway
which is
32
CA 03234809 2024- 4- 11
WO 2023/069979
PCT/US2022/078344
UR 6-22023 /FR: 161118.03801 &03802
initiated through the transcription of primary miRNA from its miRNA gene or
intron, by
RNA polymerase II or III generating the initial precursor molecule in the
biological pathway
resulting in miRNA. Once transcribed, pri-miRNA (often over a thousand
nucleotides long
with a hairpin structure) is processed by the Drosha enzyme which cleaves pri-
miRNA near
the junction between the hairpin structure and the ssRNA, resulting in
precursor miRNA (pre-
miRNA). The pre-miRNA is exported to the cytoplasm where is further reduced by
Dicer
enzyme at the pre-miRNA loop, resulting in duplexed miRNA strands.
Of the two strands of a miRNA duplex, one arm, the guide strand (miR), is
typically
found in higher concentrations and binds and associates with the Argonaute
protein which is
eventually loaded into the RNA-inducing silencing complex The guide strand
miRNA-RISC
complex helps regulates gene expression by binding to its complementary
sequence of
mRNA, often in the 3' UTR of the mRNA. The non-guide strand of the miRNA
duplex is
known as the passenger strand and is often degraded, but may persist and also
act either intact
or after partial degradation to have a functional role in gene expression.
In some embodiments, a transgene is engineered to express an inhibitory
nucleic acid
(e.g., an miRNA) having a guide strand that targets a human gene. "Targeting"
refers to
hybridization or specific binding of an inhibitory nucleic acid to its cognate
(e.g.,
complementary) sequence on a target gene (e.g., mRNA transcript of a target
gene). In some
embodiments, an inhibitory nucleic acid that targets a gene transcript shares
a region of
complementarity with the target gene that is 1, 2, 3, 4, 5, 6, 7, 8, 9, 10,
11, 12, 13, 14, 15, 16,
17, 18, 19, 20, 21, 22, 23, 24, 25, 26, 27, 28, 29, or 30 nucleotides in
length. In some
embodiments, a region of complementarity is more than 30 nucleotides in
length.
Typically, the guide strand may target a human gene transcript associated with
a
disease or disorder of myelin. Examples include that for ZNF274, MAX, IKZF3,
or E2F6. In
some embodiments, a guide strand that targets any of these gene transcripts is
encoded by an
isolated nucleic acid comprising a suitable segment of the sequences set forth
above.
Accordingly, the inhibitory nucleic acids can be used to mediate gene
silencing,
specifically one or more of ZNF274, MAX, IKZF3, and E2F6, via interaction with
RNA
transcripts or alternately by interaction with particular gene sequences,
wherein such
interaction results in gene silencing either at the transcriptional level or
post-transcriptional
level such as, for example, but not limited to, RNAi or through cellular
processes that
modulate the chromatin structure or methylation patterns of the target and
prevent
33
CA 03234809 2024-4- 11
WO 2023/069979
PCT/US2022/078344
UR 6-22023 /FR: 161118.03801 &03802
transcription of the target gene, with the nucleotide sequence of the target
thereby mediating
silencing.
These inhibitory nucleic acids can comprise short double-stranded regions of
RNA.
The double stranded RNA molecules can comprise two distinct and separate
strands that can
be symmetric or asymmetric and are complementary, i.e., two single-stranded
RNA
molecules, or can comprise one single-stranded molecule in which two
complementary
portions, e.g., a sense region and an antisense region, are base-paired, and
are covalently
linked by one or more single-stranded "hairpin" areas (i.e. loops) resulting
in, for example, a
single-stranded short-hairpin polynucleotide or a circular single-stranded
polynucleotide.
The linker can be polynucleotide linker or a non-nucleotide linker. In some
embodiments, the linker is a non-nucleotide linker. In some embodiments, a
hairpin or
circular inhibitory nucleic acid molecule contains one or more loop motifs,
wherein at least
one of the loop portion of the molecule is biodegradable. For example, a
single-stranded
hairpin molecule can be designed such that degradation of the loop portion of
the molecule in
vivo can generate a double-stranded siRNA molecule with 3'-terminal overhangs,
such as 3'-
terminal nucleotide overhangs comprising 1, 2, 3 or 4 nucleotides. Or
alternatively, a circular
inhibitory nucleic acid molecule can be designed such that degradation of the
loop portions of
the molecule in vivo can generate, for example, a double-stranded siRNA
molecule, with 3'-
terminal overhangs, such as 3'-terminal nucleotide overhangs comprising about
2 nucleotides.
In symmetric inhibitory nucleic acid molecules, each strand, the sense
(passenger)
strand and antisense (guide) strand, can be independently about 15 to about 40
(e.g-., about 15,
16, 17, 18, 19, 20, 21, 22, 23, 24, 25, 26, 27, 28, 29, 30, 31, 32, 33, 34,
35, 36, 37, 38, 39, or
40) nucleotides in length
In asymmetric inhibitory nucleic acid molecules, the antisense region or
strand of the
molecule can be about 15 to about 30 (e.g., about 15, 16, 17, 18, 19, 20, 21,
22, 23, 24, 25,
26, 27, 28, 29, or 30) nucleotides in length, wherein the sense region is
about 3 to about 25
(e.g., about 3,4, 5,6, 7,8, 9, 10, 11, 12, 13, 14, 15, 16, 17, 18, 19, 20, 21,
22, 23, 24, or 25)
nucleotides in length.
In yet other embodiments, inhibitory nucleic acid molecules described herein
can
comprise single stranded hairpin siRNA molecules, wherein the molecules can be
about 25 to
about 70 (e.g., about 25, 26, 27, 28, 29, 30, 31, 32, 33, 34, 35, 36, 40, 45,
50, 55, 60, 65, or
70) nucleotides in length.
34
CA 03234809 2024-4- 11
WO 2023/069979
PCT/US2022/078344
UR 6-22023 /FR: 161118.03801 &03802
In still other embodiments, the molecules may comprise single-stranded
circular
siRNA molecules, wherein the molecules are about 38 to about 70 (e.g, about
38, 40, 45, 50,
55, 60, 65, or 70) nucleotides in length.
In various symmetric embodiments, the inhibitory nucleic acid duplexes
described
herein independently may comprise about 15 to about 40 base pairs (e.g., about
15, 16, 17,
18, 19, 20, 21, 22, 23, 24, 25, 26, 27, 28, 29, 30, 31, 32, 33, 34, 35, 36,
37, 38, 39, or 40).
In yet other embodiments, where the inhibitory nucleic acid molecules
described
herein are asymmetric, the molecules may comprise about 3 to 25 (e.g., about
3, 4, 5, 6, 7, 8,
9, 10, 11, 12, 13, 14, 15, 16, 17, 18, 19, 20, 21, 22, 23, 24, or 25) base
pairs)
In still other embodiments, where the inhibitory nucleic acid molecules are
hairpin or
circular structures, the molecules can comprise about 3 to about 30 (e.g.,
about 15, 16, 17, 18,
19, 20, 21, 22, 23, 24, 25, 26, 27, 28, 29, or 30) base pairs.
The sense strand and antisense strands or sense region and antisense regions
of the
inhibitory nucleic acid molecules can be complementary. Also, the antisense
strand or
antisense region can be complementary to a nucleotide sequence or a portion
thereof of a
target RNA (e.g., that of ZNF274, MAX, IKZF3, and E2F6). The sense strand or
sense
region if the inhibitory nucleic acid can comprise a nucleotide sequence of
the target gene or
a portion thereof
In some embodiments, the inhibitory nucleic acid can be optimized (based on
sequence) or chemically modified to minimize degradation prior to and/or upon
delivery to
the tissue of interest. Commercially available sources for these interfering
nucleic acids
include, but are not limited to, Thermo-Fisher Scientific/Ambion, Origene,
Qiagen,
Dharmacon, and Santa Cruz Biotechnology. In some embodiments, such
optimizations
and/or modifications may be made to assure sufficient payload of the
inhibitory nucleic acid
is delivered to the tissue of interest. Other embodiments include the use of
small molecules,
aptamers, or oligonucleotides designed to decrease the expression of a E2F6,
ZNF274, MAX,
or 1KZF3 gene by either binding to a gene's DNA to limit expression, e.g.,
antisense
oligonucleotides, or impose post-transcriptional gene silencing (PTGS) through
mechanisms
that include, but are not limited to, binding directly to the targeted
transcript or gene product
or one or more other proteins in such a way that said gene's expression is
reduced; or the use
of other small molecule decoys that reduce the specific gene's expression.
CA 03234809 2024-4- 11
WO 2023/069979
PCT/US2022/078344
UR 6-22023 /FR: 161118.03801 &03802
Any inhibitory nucleic acid molecule or construct described herein can
comprise one
or more chemical modifications. Modifications can be used to improve in vitro
or in vivo
characteristics such as stability, activity, toxicity, immune response (e.g.,
prevent stimulation
of an interferon response, an inflammatory or pro-inflammatory cytokine
response, or a Toll-
like Receptor (TIF) response), and/or bioavailability.
Chemically modified molecules exhibit improved RNAi activity compared to
corresponding unmodified or minimally modified molecules. The chemically
modified motifs
disclosed herein provide the capacity to maintain RNAi activity that is
substantially similar to
unmodified or minimally modified active siRNA while at the same time providing
nuclease
resistance and pharmacokinetic properties suitable for use in therapeutic
applications.
In various embodiments, the inhibitory nucleic acid molecules described herein
can
comprise modifications wherein any (e.g., one or more or all) nucleotides
present in the sense
and/or antisense strand are modified nucleotides. In some embodiments, the
molecules can
be partially modified (e.g., about 1, 2, 3,4, 5, 6, 7, 8, 9, 10, 11, 12, 13,
14, 15, 16, 17, 18, 19,
20, 21, 22, 23, 24, 25, 26, 27, 28, 29, 30, 31, 32, 33, 34, 35, 36, 37, 38,
39, 40, 45, 50, 55, 60,
65, 70, 75, 80 nucleotides are modified) with chemical modifications. In other
embodiments,
the molecules may be completely modified (e.g., 100% modified) with chemical
modifications.
The chemical modification within a single molecule can be the same or
different. In
some embodiments, at least one strand has at least one chemical modification.
In other
embodiments, each strand has at least one chemical modifications, which can be
the same or
different, such as, sugar, base, or backbone (i.e., intemucleotide linkage)
modifications. In
other embodiments, a molecules may contain at least 2, 3, 4, 5, or more
different chemical
modifications.
Non-limiting examples of suitable chemical modifications include those
disclosed in,
e.g., U.S. Patent No. 8202979 and U.S. 20050266422 and include sugar, base,
and phosphate,
non-nucleotide modifications, and/or any combination thereof.
In various embodiments, a majority of the pyrimidine nucleotides present in
the
double-stranded inhibitory nucleic acid molecule comprises a sugar
modification. In yet other
embodiments, a majority of the purine nucleotides present in the double-
stranded molecule
comprises a sugar modification. In certain instances, the purines and
pyrimidines are
differentially modified at the 2'-sugar position (i.e., at least one purine
has a different
36
CA 03234809 2024-4- 11
WO 2023/069979
PCT/US2022/078344
UR 6-22023 /FR: 161118.03801 &03802
modification from at least one pyrimidine in the same or different strand at
the 2'-sugar
position).
In certain specific embodiments, at least one modified nucleotide is a 2'-
deoxy-2-
fluoro nucleotide, a 2'-deoxy nucleotide, or a 2'-0-alkyl (e.g., 2'-0-methyl)
nucleotide. In yet
other embodiments, at least one nucleotide has a ribo-like, Northern or A form
helix
configuration (see e.g., Saenger, Principles of Nucleic Acid Structure,
Springer-Verlag ed.,
1984). Non-limiting examples of nucleotides having a Northern configuration
include locked
nucleic acid (LNA) nucleotides (e.g., 2'-0, 4'-C-methylene-(D-ribofuranosyl)
nucleotides);
2 '-m ethoxyethoxy (MOE) nucleoli des; 2 '-methyl -thi o-ethyl nucl eoti des,
21-deoxy-2'-fluoro
nucleotides, 2'-deoxy-2'-chloro nucleotides, 2'-azido nucleotides, 2'-0-
trifluoromethyl
nucleotides, 2 '-0-ethyl-tri fluorom ethoxy
nucleotides, 2 '-0-difluoromethoxy-ethoxy
nucleotides, 4'-thio nucleotides and 2'-0-methyl nucleotides.
The inhibitory nucleic acids described herein can be obtained using a number
of
techniques known to those of skill in the art. For example the inhibitory
nucleic acids can be
chemically synthesized or may be encoded by plasmid (e.g., transcribed as
sequences that
automatically fold into duplexes with hairpin loops). siRNA can also be
generated by
cleavage of longer dsRNA.
In some embodiments, inhibitory nucleic acids are chemically synthesized.
Oligonucleotides (e.g., certain modified oligonucleotides or portions of
oligonucleotides
lacking ribonucleotides) can be synthesized using protocols known in the art,
for example as
described in Caruthers et al., 1992, Methods in Enzymology 211, 3-19, Thompson
et al.,
International PCT Publication No. WO 99/54459, Wincott et at., 1995, Nucleic
Acids
Res. 23, 2677-2684, Wincott et al., 1997, Methods Mol. Bio., 74, 59, Brennan
et at., 1998,
Biotechnol Bioeng., 61, 33-45, and Brennan, U.S. Pat. No. 6,001,311. The
synthesis of
oligonucleotides makes use of common nucleic acid protecting and coupling
groups, such as
dimethoxytrityl at the 5'-end, and phosphoramidites at the 3'-end.
Alternatively, the inhibitory nucleic acids can be synthesized separately and
joined
together post-synthetically, for example, by ligation (Moore et at., 1992,
Science 256, 9923;
Draper et at., International PCT Publication No. WO 93/23569; Shabarova et
al., 1991,
Nucleic Acids Research 19, 4247; Bellon et at., 1997, Nucleosides
&Nucleotides, 16, 951;
Bellon et al., 1997, Bioconjugate Chem. 8, 204), or by hybridization following
synthesis
and/or deprotecti on.
37
CA 03234809 2024-4- 11
WO 2023/069979
PCT/US2022/078344
UR 6-22023 /FR: 161118.03801 &03802
In some embodiments, inhibitory nucleic acids can be expressed and delivered
from
transcription units inserted into recombinant DNA or RNA vectors. The
recombinant vectors
can be DNA plasmids or viral vectors. Viral vectors can be constructed based
on, but not
limited to, adeno-associated virus, retrovirus, adenovirus, or alphavirus.
CRISPR/Cas System
In one aspect, suppressing or knocking down of one or more of the genes
described
herein can also be achieved via a CRISPR-Cas guided nuclease using a
CRISPR/Cas system
and related methods known in the art. See, e.g., U511225659B2, W02021168799A1,
W02022188039A1, W02022188797A1, W02022068912A1, and W02022047624A1. See
also Gimenez et al., "CRISPR-on System for the Activation of the Endogenous
human INS
gene," Gene Therapy 23: 543-547 (2016); Wiedenheft et al., "RNA-Guided Genetic
Silencing Systems in Bacteria and Archaea," Nature 482:331-338 (2012); Zhang
et al.,
"Multiplex Genome Engineering Using CRISPR/Cas Systems," Science 339(6121):
819-23
(2013); and Gaj et al., "ZEN, TALEN, and CRISPR/Cas-based Methods for Genome
Engineering," Cell 31(7):397-405 (2013), which are hereby incorporated by
reference in their
entirety.
CRISPR-Cas system is a genetic technique which allows for sequence- specific
control of gene expression in prokaryotic and eukaryotic cells by guided
nuclease double-
stranded DNA cleavage. It is based on the bacterial immune system-derived
CRISPR
(clustered regularly interspaced palindromic repeats) pathway.
In another aspect, this application provides a complex comprising: (i) a
protein
composition that comprise a Cas protein, or orthologs, homologs, derivatives,
conjugates,
functional fragments thereof, conjugates thereof, or fusions thereof; and (ii)
a polynucleotide
composition, comprising a CRISPR RNA and a programmable spacer sequence or
guide
sequence complementary to at least a portion of a target RNA or DNA. The
programmable
guide RNA, CRISPR RNA and the Cas protein together form a CRISPR/Cas-based
module
for sequence targeting and recognition.
The target RNA can be any RNA molecule of interest, including naturally-
occurring
and engineered RNA molecules. The target RNA can be an mRNA, a tRNA, a
ribosomal
RNA (rRNA), a microRNA (miRNA), an interfering RNA (siRNA), a ribozyme, a
riboswitch, a satellite RNA, a microswitch, a microzyme, or a viral RNA.
In some embodiments, the target nucleic acid is associated with a condition or
disease, such as a condition or disorder mediated by loss of while
38
CA 03234809 2024-4- 11
WO 2023/069979
PCT/US2022/078344
UR 6-22023 /FR: 161118.03801 &03802
matter/oligodendrocytes/astrocytes and related disorders as described herein.
Thus, in some
embodiments, the systems described herein can be used to treat such a
condition or disease by
targeting these nucleic acids.
For instance, the target nucleic acid associated with a condition or disease
may be an
RNA molecule that is overexpressed in a diseased cell, an old or older cell,
or a senescent
cell. The target nucleic acid may also be a toxic RNA and/or a mutated RNA
(e.g., an mRNA
molecule having a splicing defect or a mutation). The target nucleic acid may
also be an
miRNA.
For example, the target nucleic acid may be that of a gene whose increased
activity
has been linked to senescence, such as STATs, and a transcription repressor
(e.g., E2F6,
ZNF274, MAX, or IKZF3) as illustrated FIGs. 28, 30, and 37. The target nucleic
acid may
be that of an miRNA that promotes senescence in adult GPCs, such as miR-584-
5p, miR-330-
3p, miR-23b-3p, and miR-140-3p as illustrated FIGs. 28, 30, and 37.
Various Cos proteins can be used in this invention. A Cas protein, CRISPR-
associated protein, or CRISPR protein, used interchangeably, refers to a
protein of or derived
from a CR1SPR-Cas Class 1 or Class 2, including type I, type II, type III,
type IV, type V, or
type VI system, which has an RNA-guided DNA-binding. Non-limiting examples of
suitable
CRISPR/Cas proteins include Cas3, Cas4, Cas5, Cas5e (or CasD), Cas6, Cas6e,
Cas6f, Cas7,
Cas8a1, Cas8a2, Cas8b, Cas8c, Cas9, Cas10, CaslOd, Cas13, Cas13e, Cas13f,
CasF, CasG,
CasH, Csyl, Csy2, Csy3, Csel (or CasA), Cse2 (or CasB), Cse3 (or CasE), Cse4
(or CasC),
Cscl, Csc2, Csa5, Csn2, Csm2, Csm3, Csm4, Csm5, Csm6, Cmrl, Cmr3, Cmr4, Cmr5,
Cmr6, Csbl, Csb2, Csb3, Csx17, Csx14, Csx10, Csx16, CsaX, Csx3, Cszl, Csx15,
Csfl,
Csf2, Csf3, Csf4, and Cu1966.
See e.g., US11225659B2, W02021168799A1,
W02022188039A1, W02022188797A1, W02022068912A1, W02022047624A1,
W02014144761 W02014144592, W02013176772, US20140273226, and US20140273233,
the contents of which are incorporated herein by reference in their
entireties.
Expression Cassettes and Expression Vectors
The disclosure also provides an expression cassette, comprising or consisting
of a
recombinant nucleic acid encoding an inhibitory nucleic acid or a CRISPR/Cas
system
described above. Where such recombinant nucleic acid may not already comprise
a promoter,
the expression cassette may additionally comprise a promoter. Thus, an
expression cassette
according to the present invention comprises, in 5' to 3' direction, a
promoter, a coding
sequence, and optionally a terminator or other elements. The expression
cassette allows an
39
CA 03234809 2024-4- 11
WO 2023/069979
PCT/US2022/078344
UR 6-22023 /FR: 161118.03801 &03802
easy transfer of a nucleic acid sequence of interest into an organism,
preferably a cell and
preferably a disease cell.
The expression cassette of the present disclosure is preferably comprised in a
vector.
Thus, the vector of the present disclosure allows to transform a cell with a
nucleic acid
sequence of interest. Correspondingly the disclosure provides a host cell
comprising an
expression cassette according to the present disclosure or a recombinant
nucleic acid
according to the present disclosure. The recombinant nucleic acid may also
comprise a
promoter or enhancer such as to allow for the expression of the nucleic acid
sequence of
interest.
Exogenous genetic material (e.g., a nucleic acid, an expression cassette, or
an
expression vector encoding one or more therapeutic or inhibitory RNAs) can be
introduced
into a target cells of interest in viva by genetic transfer methods, such as
transfection or
transduction, to provide a genetically modified cell. Various expression
vectors (i.e., vehicles
for facilitating delivery of exogenous genetic material into a target cell)
are known to one of
ordinary skill in the art. As used herein, "exogenous genetic material" refers
to a nucleic acid
or an oligonucleotide, either natural or synthetic, that is not naturally
found in the cells; or if
it is naturally found in the cells, it is not transcribed or expressed at
biologically significant
levels by the cells. Thus, "exogenous genetic material" includes, for example,
a non-naturally
occurring nucleic acid that can be transcribed into an RNA.
As used herein, "transfection of cells" refers to the acquisition by a cell of
new genetic
material by incorporation of added nucleic acid (DNA, RNA, or a hybrid
thereof) without use
of a viral delivery vehicle. Thus, transfection refers to the introducing of
nucleic acid into a
cell using physical or chemical methods. Several transfection techniques are
known to those
of ordinary skill in the art including: calcium phosphate nucleic acid co-
precipitation,
strontium phosphate nucleic acid co-precipitation, DEAE-dextran,
electroporation, cationic
liposome-mediated transfection, and tungsten particle-facilitated
microparticle bombardment.
In contrast, "transduction of cells" refers to the process of transferring
nucleic acid into a cell
using a DNA or RNA virus. An RNA virus (e.g., a retrovirus) for transferring a
nucleic acid
into a cell is referred to herein as a transducing chimeric virus. Exogenous
genetic material
contained within the virus can be incorporated into the genome of the
transduced cell. A cell
that has been transduced with a chimeric DNA virus (e.g., an adenovirus
carrying a DNA
encoding a therapeutic agent), may not have the exogenous genetic material
incorporated into
CA 03234809 2024-4- 11
WO 2023/069979
PCT/US2022/078344
UR 6-22023 /FR: 161118.03801 &03802
its genome but may be capable of expressing the exogenous genetic material
that is retained
extrachromosomally within the cell.
Typically, the exogenous genetic material may include a heterologous gene
(coding
for a therapeutic RNA or protein) together with a promoter to control
transcription of the new
gene. The promoter characteristically has a specific nucleotide sequence
necessary to initiate
transcription. Optionally, the exogenous genetic material further includes
additional
sequences (i.e., enhancers) required to obtain the desired gene transcription
activity. The
exogenous genetic material may introduced into the cell genome immediately
downstream
from the promoter so that the promoter and coding sequence are operatively
linked so as to
permit transcription of the coding sequence. A retroviral expression vector
may include an
exogenous promoter element to control transcription of the inserted exogenous
gene. Such
exogenous promoters include both constitutive and inducible promoters.
Naturally-occurring constitutive promoters control the expression of essential
cell
functions. As a result, a gene under the control of a constitutive promoter is
expressed under
all conditions of cell growth. Exemplary constitutive promoters include the
promoters for the
following genes that encode certain constitutive or "housekeeping" functions:
hypoxanthine
phosphoribosyl transferase, dihydrofolate reductase, adenosine deaminase,
phosphoglycerol
kinase, pyruvate kinase, phosphoglycerol mutase, the actin promoter,
ubiquitin, elongation
factor-1 and other constitutive promoters known to those of skill in the art.
In addition, many
viral promoters function constitutively in eucaryotic cells. These include the
early and late
promoters of SV40, the long terminal repeats (LTRs) of Moloney Leukemia Vin.is
and other
retroviruses; and the thymidine kinase promoter of Herpes Simplex Virus, among
many
others. Accordingly, any of the above-referenced constitutive promoters can be
used to
control transcription of a heterologous gene insert.
Genes that are under the control of inducible promoters are expressed only in,
or
largely controlled by, the presence of an inducing agent, (e.g., transcription
under control of
the metallothionein promoter is greatly increased in presence of certain metal
ions). Inducible
promoters include responsive elements (REs) which stimulate transcription when
their
inducing factors are bound. For example, there are REs for serum factors,
steroid hormones,
retinoic acid and cyclic AMP. Promoters containing a particular RE can be
chosen in order to
obtain an inducible response and in some cases, the RE itself may be attached
to a different
promoter, thereby conferring inducibility to the recombinant gene. Thus, by
selecting the
appropriate promoter (constitutive versus inducible, strong versus weak), it
is possible to
41
CA 03234809 2024-4- 11
WO 2023/069979
PCT/US2022/078344
UR 6-22023 /FR: 161118.03801 &03802
control both the existence and level of expression of a therapeutic agent in
the genetically
modified cell. If the gene encoding the therapeutic agent is under the control
of an inducible
promoter, delivery of the therapeutic agent in situ is triggered by exposing
the genetically
modified cell in situ to conditions for permitting transcription of the
therapeutic agent, e.g.,
by injection of specific inducers of the inducible promoters which control
transcription of the
agent. For example, in situ expression by genetically modified cells of a
therapeutic agent
encoded by a gene under the control of the metallothionein promoter, is
enhanced by
contacting the genetically modified cells with a solution containing the
appropriate (i.e.,
inducing) metal ions in situ.
Accordingly, the amount of therapeutic agent that is delivered in situ is
regulated by
controlling such factors as: (1) the nature of the promoter used to direct
transcription of the
inserted gene, (i.e., whether the promoter is constitutive or inducible,
strong or weak); (2) the
number of copies of the exogenous gene that are inserted into the cell; (3)
the number of
transduced/transfected cells that are administered (e.g., implanted) to the
patient; (4) the size
of the implant (e.g., graft or encapsulated expression system); (5) the number
of implants; (6)
the length of time the transduced/transfected cells or implants are left in
place; and (7) the
production rate of the therapeutic agent by the genetically modified cell.
Selection and
optimization of these factors for delivery of a therapeutically effective dose
of a particular
therapeutic agent is deemed to be within the scope of one of ordinary skill in
the art without
undue experimentation, taking into account the above-disclosed factors and the
clinical
profile of the patient.
In addition to at least one promoter and at least one heterologous nucleic
acid
encoding the therapeutic agent, the expression vector may include a selection
gene, for
example, a neomycin resistance gene or a fluorescent protein gene, for
facilitating selection
of cells that have been transfected or transduced with the expression vector.
Alternatively, the
cells are transfected with two or more expression vectors, at least one vector
containing the
gene(s) encoding the therapeutic agent(s), the other vector containing a
selection gene. The
selection of a suitable promoter, enhancer, selection gene, and/or signal
sequence is deemed
to be within the scope of one of ordinary skill in the art without undue
experimentation.
A coding sequence of the present disclosure can be inserted into any type of
target or
host cell. In the context of an expression vector, the vector can be readily
introduced into a
host cell, e.g., mammalian, bacterial, yeast, or insect cell by any method in
the art. For
42
CA 03234809 2024-4- 11
WO 2023/069979
PCT/US2022/078344
UR 6-22023 /FR: 161118.03801 &03802
example, the expression vector can be transferred into a host cell by
physical, chemical, or
biological means.
Carrier/Delivery of polynucleotides
As disclosed herein, the polynucleotides or nucleic acid molecules described
above
can be used for treating a disorder in a subject. Accordingly, this disclosure
provides systems
and methods for delivery of the polynucleotides to a target cell or a subject.
Physical methods for introducing a polynucleotide into a host cell include
calcium
phosphate precipitation, lipofection, particle bombardment, microinjection,
electroporation,
and the like. Methods for producing cells comprising vectors and/or exogenous
nucleic acids
are well-known in the art. See, for example, Sambrook et al. (2012, Molecular
Cloning: A
Laboratory Manual, Cold Spring Harbor Laboratory, New York).
Biological methods for introducing a polynucleotide of interest into a host
cell include
the use of DNA and RNA vectors. Viral vectors, and especially retroviral
vectors, have
become the most widely used method for inserting genes into mammalian, e.g.,
human cells.
Other viral vectors can be derived from lentivirus, poxviruses, herpes simplex
virus I,
adenoviruses and adeno-associated viruses, and the like. See, for example,
U.S. Pat. Nos.
5,350,674 and 5,585,362.
Chemical means for introducing a polynucleotide into a host cell include
colloidal
dispersion systems, such as macromolecule complexes, nanocapsules,
microspheres, beads,
and lipid-based systems including oil-in-water emulsions, micelles, mixed
micelles, and
liposomes. An exemplary colloidal system for use as a delivery vehicle in
vitro and in vivo is
a liposome (e.g., an artificial membrane vesicle).
The polynucleotides or nucleic acids described herein (e.g., inhibitory
nucleic acids,
those encoding a CRISPR-Cas system, expression cassette, and expression
vector) can be
added directly, or can be complexed with cationic lipids, packaged within
liposomes, or as a
recombinant plasmid or viral vectors, or otherwise delivered to target cells
or tissues.
Methods for the delivery of nucleic acid molecules are known in the art. See,
e.g., U.S. Pat.
No. 6,395,713, WO 94/02595, Akhtar et al., 1992, Trends Cell Bio., 2, 139;
Delivery
Strategies fbr Antisen,se Oligonucleotide Therapeutics, ed. Akhtar, 1995,
Maurer et al., 1999,
Mol. Membr. Biol., 16, 129-140; Hofland and Huang, 1999, Handb. Evp.
Pharmacol, 137,
165-192; and Lee et al., 2000, ACS Symp. Ser., 752, 184-192. These protocols
can be utilized
for the delivery of virtually any nucleic acid molecule. Nucleic acid
molecules can be
administered to cells by a variety of methods known to those of skill in the
art, including, but
43
CA 03234809 2024-4- 11
WO 2023/069979
PCT/US2022/078344
UR 6-22023 /FR: 161118.03801 &03802
not restricted to, encapsulation in liposomes, by iontophoresis, or by
incorporation into other
vehicles, such as biodegradable polymers, hydrogels, cyclodextrins (see for
example
Gonzalez et al., 1999, Bioconjugate Chepn., 10, 1068-1074; WO 03/47518 and WO
03/46185), poly(lactic-co-glycolic)acid (PLGA) and PLCA microspheres (see for
example
U.S. Pat. No. 6,447,796 and US 2002130430), biodegradable nanocapsules, and
bioadhesive
microspheres, or by proteinaceous vectors (see, e.g., WO 00/53722).
In one aspect, the present application provides carrier systems containing the
nucleic
acid molecules described herein. In some embodiments, the carrier system is a
lipid-based
carrier system, cationic lipid, or liposome nucleic acid complexes, a
liposome, a micelle, a
virosome, a lipid nanoparticle or a mixture thereof. In other embodiments, the
carrier system
is a polymer-based carrier system such as a cationic polymer-nucleic acid
complex. In
additional embodiments, the carrier system is a cyclodextrin-based carrier
system such as a
cyclodextrin polymer-nucleic acid complex. In further embodiments, the carrier
system is a
protein-based carrier system such as a cationic peptide-nucleic acid complex.
Preferably, the
carrier system in a lipid nanoparticle formulation. Lipid nanoparticle ("LNP")
formulations
described herein can be applied to any nucleic acid molecules (e.g., an RNA
molecule) or
combination of nucleic acid molecules described herein.
In certain embodiment, the nucleic acid molecules described herein are
formulated as
a lipid nanoparticle composition such as is described in U.S. Patent Nos.
7514099 and
7404969. In some embodiments, this application features a composition
comprising a nucleic
acid molecule formulated as any of formulation as described in US 20120029054,
such as
LNP-051; LNP-053; LNP-054; LNP-069; LNP-073; LNP-077; LNP-080; LNP-082; LNP-
083, LNP-060; LNP-061; LNP-086; LNP-097; LNP-098; LNP-099, LNP-100; LNP-101,
LNP-102; LNP-103; or LNP-104.
In other embodiments, this disclosure features conjugates and/or complexes of
nucleic
acid molecules described herein. Such conjugates and/or complexes can be used
to facilitate
delivery of nucleic acid molecules into a biological system, such as a cell.
The conjugates and
complexes provided by hereon can impart therapeutic activity by transferring
therapeutic
compounds across cellular membranes, altering the pharmacokinetics, and/or
modulating the
localization of nucleic acid molecules of the invention. Non-limiting,
examples of such
conjugates are described in e.g., U.S. Pat. Nos. 7,833,992: 6,528,631;
6,335,434; 6, 235,886;
6,153,737; 5,214,136; 5,138,045.
44
CA 03234809 2024-4- 11
WO 2023/069979
PCT/US2022/078344
UR 6-22023 /FR: 161118.03801 &03802
In various embodiments, polyethylene glycol (PEG) can be covalently attached
to
nucleic acid molecules described herein. The attached PEG can be any molecular
weight,
preferably from about 100 to about 50,000 daltons (Da). Accordingly, the
disclosure features
compositions or formulations comprising surface-modified liposomes containing
poly
(ethylene glycol) lipids (PEG-modified, or long-circulating liposomes or
stealth liposomes)
and nucleic acid molecules described herein. See, e.g., WO 96/10391, WO
96/10390, and
WO 96/10392).
In some embodiments, the nucleic acid molecules can also be formulated or
complexed with polyethyleneimine and derivatives thereof, such as
polyethyleneimine-
polyethyleneglycol-N-acetylgalactosamine (PEI-PEG-GAL) or polyethyleneimine-
polyethyleneglycol-tri-N-acetylgalactosamine (PEI-PEG-triGAL) derivatives. In
one
embodiment, the nucleic acid molecules can be formulated in the manner
described in U.S.
20030077829.
In other embodiments, nucleic acid molecules described herein can be complexed
with membrane disruptive agents such as those described in U.S. 20010007666.
In still other
embodiments, the membrane disruptive agent or agents and the molecule can be
complexed
with a cationic lipid or helper lipid molecule, such as those lipids described
in U.S. Pat. No.
6,235,310.
In certain embodiments, nucleic acid molecules described herein can be
complexed
with delivery systems as described in U.S. Patent Application Publication Nos.
2003077829;
20050287551; 20050164220; 20050191627; 20050118594; 20050153919; 20050085486;
and 20030158133; and TWO 00/03683 and WO 02/087541.
In some embodiments, a liposomal formulation described herein can comprise a
nucleic acid molecule described herein (e.g., an inhibitory nucleic acid)
formulated or
complexed with compounds and compositions described in U.S. Pat. Nos.
6,858,224;
6,534,484; 6,287,591; 6,835,395; 6,586,410; 6,858,225; 6,815,432; 6,586,001;
6,120,798;
6,977,223; 6,998,115; 5,981,501; 5,976,567; 5,705,385; and U.S. Patent
Application
Publication Nos. 2006/0019912; 2006/0019258; 2006/0008909; 2005/0255153;
2005/0079212; 2005/0008689; 2003/0077829, 2005/0064595, 2005/0175682,
2005/0118253;
2004/0071654; 2005/0244504; 2005/0265961 and 2003/0077829.
As disclosed herein, the nucleic acid molecules described above can be used
for
treating a disorder in a subject. Vectors (such as recombinant plasmids and
viral vectors) as
discussed above can be used to deliver a therapeutical agent, such as an
inhibitory nucleic
CA 03234809 2024-4- 11
WO 2023/069979
PCT/US2022/078344
UR 6-22023 /FR: 161118.03801 &03802
acid or a CRISPR-Cas system described herein. Delivery of the vectors can be
systemic,
such as by intravenous or intra-muscular administration, by administration to
target cells ex-
planted from a subject followed by reintroduction into the subject, or by any
other means that
would allow for introduction into the desired target cell. Such recombinant
vectors can also
be administered directly or in conjunction with a suitable delivery reagents,
including, for
example, the Mirus Transit LT1 lipophilic reagent; lipofectin; lipofectamine;
cellfectin;
polycations (e.g., polylysine) or liposomes lipid-based carrier system,
cationic lipid, or
liposome nucleic acid complexes, a micelle, a virosome, a lipid nanoparticle.
Viral Vectors
In some embodiments, a polynucleotide encoding the RNA molecule can be
inserted
into, or encoded by, vectors such as plasmids or viral vectors. Preferably,
the polynucleotide
is inserted into, or encoded by, viral vectors. Viral vectors may be
Herpesvirus (HSV)
vectors, retroviral vectors, adenoviral vectors, AAV vectors, lentiviral
vectors, and the like
In some specific embodiments, the viral vectors are AAV vectors. In some
embodiments, the
RNA may be encoded by a retroviral vector (See, e.g., U.S. Pat. Nos.
5,399,346; 5,124,263;
4,650,764 and 4,980,289; the content of each of which is incorporated herein
by reference in
their entirety).
Lentiviral vectors
Lentiviruses, such as HIV, are "slow viruses." Vectors derived from
lentiviruses can
be expressed long-term in the host cells after a few administrations to the
patients, e.g., via ex
vivo transduced stem cells or progenitor cells. For most diseases and
disorders, including
genetic diseases, cancer, and neurological disease, long-term expression is
crucial to
successful treatment. Regarding safety with lentiviral vectors, a number of
strategies for
eliminating the ability of lentiviral vectors to replicate have now been known
in the art. See
e.g., US 20210401868 and 20210403517, each of which is incorporated herein by
reference
in its entirety. For example, the deletion of promoter and enhancer elements
from the U3
region of the long terminal repeat (LTR) are thought to have no LTR-directed
transcription
The resulting vectors are called "self-inactivating" (SIN).
Lentiviral vectors are particularly suitable to achieving long-term gene
transfer since
they allow long-term, stable integration of a transgene and its propagation in
daughter cells.
Lentiviral vectors have the added advantage over vectors derived from onco-
retroviruses such
as murine leukemia viruses in that they can transduce non-proliferating cells,
such as CNS
46
CA 03234809 2024-4- 11
WO 2023/069979
PCT/US2022/078344
UR 6-22023 /FR: 161118.03801 &03802
cells. They also have the added advantage of low immunogenicity. In general, a
suitable
vector contains an origin of replication functional in at least one organism,
a promoter
sequence, convenient restriction endonuclease sites, and one or more
selectable markers,
(e.g., W001/96584 and W001/29058; and U.S. Pat. No. 6,326,193). Several vector
promoter
sequences are available for expression of the transgenes. One example of a
suitable promoter
is the immediate early cytomegalovirus (CMV) promoter sequence. This promoter
sequence
is a strong constitutive promoter sequence capable of driving high levels of
expression of any
polynucleotide sequence operatively linked thereto. Another example of a
suitable promoter
is EFla. However, other constitutive promoter sequences can also be used,
including, but not
limited to the simian virus 40 (SV40) early promoter, mouse mammary tumor
virus
(MMTV), human immunodeficiency virus (HIV) long terminal repeat (LTR)
promoter,
MoMuLV promoter, an avian leukemia virus promoter, an Epstein-Barr virus
immediate
early promoter, a Rous sarcoma virus promoter, as well as human gene promoters
such as,
but not limited to, the actin promoter, the myosin promoter, the hemoglobin
promoter, and
the creatine kinase promoter. Inducible promoters include, but are not limited
to a
metallothionein promoter, a glucocorticoid promoter, a progesterone promoter,
and a
tetracycline promoter.
The present disclosure provides a recombinant lentivirus capable of infecting
dividing
and non-dividing cells, such oligodendrocytes, astrocytes, or glial progenitor
cells. The virus
is useful for the in vivo and ex vivo transfer and expression of nucleic acid
sequences.
Lentiviral vectors of the present disclosure may be lentiviral transfer
plasmids or infectious
lentiviral particles. Construction of lentiviral vectors, helper constructs,
envelope constructs,
etc., for use in lentiviral transfer systems has been described in, e.g., US
20210401868 and
20210403517, each of which is incorporated herein by reference in its
entirety.
Adenovirnses
Adenovinises are eukaryotic DNA viruses that can be modified to efficiently
deliver a
nucleic acid to a variety of cell types in vivo, and have been used
extensively in gene therapy
protocols, including for targeting genes to neural cells and glial cells.
Various replication
defective adenovirus and minimum adenovirus vectors have been described for
nucleic acid
therapeutics (See, e.g., PCT Patent Publication Nos. W0199426914, WO
199502697,
W0199428152, W0199412649, W0199502697 and W0199622378; the content of each of
which is incorporated by reference in their entirety). Such adenoviral vectors
may also be
used to deliver therapeutic molecules of the present disclosure to cells.
47
CA 03234809 2024-4- 11
WO 2023/069979
PCT/US2022/078344
UR 6-22023 /FR: 161118.03801 &03802
Adeno-Associaled Virus
The adeno-associated virus is a widely used gene therapy vector due to its
clinical
safety record, non-pathogenic nature, ability to infect non-dividing cells
(like neurons), and
ability to provide long-term gene expression after a single administration.
Currently, many
human and non-human primate AAV serotypes have been identified. AAV vectors
have
demonstrated safety in hundreds of clinical trials worldwide, and clinical
efficacy has been
shown in trials of hemophilia B, spinal muscular atrophy, alpha 1 antitrypson,
and Leber
congenital amaurosis.
Because of their safety, nonpathogenic nature, and ability to infect neurons,
AAVs
such as AAV1, AAV2, AAV4, AAV5, AAV6, AAV8, and AAV9 are commonly used gene
therapy vectors for CNS applications. However, after direct CNS infusion,
these serotypes
exhibit a dominant neuronal tropism and expression in oligodendrocytes is low,
especially
when gene expression is driven by a constitutive promoter, which restricts
their potential for
use in treating white matter diseases. AAV1/2, AAV2, and AAV8 have been shown
transduce oligodendrocytes. Reliance on cell-specific promoters for expression
specificity
allows for the possibility of nonselective cellular uptake and leaky transgene
expression
through cryptic promoter activity in non¨oligodendrocyte lineage cells.
The approach described herein to alleviate these issues includes using AAV
serotypes
with high tropism for oligodendrocytes or astrocytes or glial progenitor
cells. Recently, using
DNA shuffling and directed evolution, a chimeric AAV capsid with strong
selectivity for
oligodendrocytes, AAV/Olig001, has been described (Powell etal., 2016, Gene
Ther 23:807-
814). Subsequently, AAV/Olig001 was shown to transduce neonatal
oligodendrocytes in a
mouse model of Canavan disease (Francis et al., 2021. Mol Ther Methods Clin
Dev 20:520-
534). Other approaches such as random mutagenesis and peptide library
insertion can be used
to generate capsid libraries that can be screened for tropism and selectivity
for
oligodendrocytes or astrocytes or glial progenitor cells.
As discussed above, the terms "adeno-associated virus" and/or "AAV" refer to
parvoviruses with a linear single-stranded DNA genome and variants thereof.
The term
covers all subtypes and both naturally occurring and recombinant forms, except
where
required otherwise. Parvoviruses, including AAV, are useful as gene therapy
vectors as they
can penetrate a cell and introduce a nucleic acid (e.g., transgene) into the
nucleus. In some
embodiments, the introduced nucleic acid (e.g., rAAV vector genome) forms
circular
concatemers that persist as episomes in the nucleus of transduced cells. In
some
48
CA 03234809 2024-4- 11
WO 2023/069979
PCT/US2022/078344
UR 6-22023 /FR: 161118.03801 &03802
embodiments, a transgene is inserted in specific sites in the host cell
genome. Site-specific
integration, as opposed to random integration, is believed to likely result in
a predictable
long-term expression profile. The insertion site of AAV into the human genome
is referred to
as AAVS1. Once introduced into a cell, RNAs or polypeptides encoded by the
nucleic acid
can be expressed by the cell. Because AAV is not associated with any
pathogenic disease in
humans, a nucleic acid delivered by AAV can be used to express a therapeutic
RNA or
polypeptide for the treatment of a disease, disorder and/or condition in a
human subject.
Multiple serotypes of AAV exist in nature with at least fifteen wild type
serotypes
having been identified from humans thus far (i.e., AAV1-AAV15). Naturally
occurring and
variant serotypes are distinguished by having a protein capsid that is
serologically distinct
from other AAV serotypes. Examples include AAV1, AAV2, AAV, AAV3 (including
AAV3A and AAV3B), AAV4, AAV5, AAV6, AAV7, AAV8, AAV9, AAV10, AAV12,
AAVrh10, AAVrh74 (see WO 2016/210170), avian AAV, bovine AAV, canine AAV,
equine
AAV, primate AAV, non-primate AAV, and ovine AAV, and recombinantly produced
variants (e.g., capsid variants with insertions, deletions and substitutions,
etc.), such as
variants referred to as AAV2i8, NP4, NP22, NP66, DJ, DJ/8, DJ/9, LK3, RHM4-1,
among
many others. "Primate AAV" refers to AAV that infect primates, "non-primate
AAV" refers
to AAV that infect non-primate mammals, "bovine AAV" refers to AAV that infect
bovine
mammals, and so on.
Serotype distinctiveness is determined on the basis of the lack of cross-
reactivity
between antibodies to one AAV as compared to another AAV. Such cross-
reactivity
differences are usually due to differences in capsid protein sequences and
antigenic
determinants (e.g., due to VP1, VP2, and/or VP3 sequence differences of AAV
serotypes).
However, some naturally occurring AAV or man-made AAV mutants (e.g.,
recombinant
AAV) may not exhibit serological difference with any of the currently known
serotypes.
These viruses may then be considered a subgroup of the corresponding type, or
more simply
a variant AAV. Thus, as used herein, the term "serotype" refers to both
serologically distinct
viruses, as well as viruses that are not serologically distinct but that may
be within a subgroup
or a variant of a given serotype.
A comprehensive list and alignment of amino acid sequences of capsids of known
AAV serotypes is provided by Marsic et al. (2014) Molecular Therapy
22(11):1900-1909.
Genomic sequences of various serotypes of AAV, as well as sequences of the
native ITRs,
rep proteins, and capsid subunits are known in the art. Such sequences may be
found in the
49
CA 03234809 2024-4- 11
WO 2023/069979
PCT/US2022/078344
UR 6-22023 /FR: 161118.03801 &03802
literature or in public databases such as GenBank. See, e.g., GenBank
Accession Numbers
NC 002077 (AAV1), AF063497 (AAV1), NC 001401 (AAV2), AF043303 (AAV2),
NC 001729 (AAV3), NC 001863 (AAV3B), NC 001829 (AAV4), U89790 (AAV4),
NC 006152 (AAV5), NC 001862 (AAV6), AF513851 (AAV7), AF513852 (AAV8), and
NC 006261 (AAV8); the disclosures of which are incorporated by reference
herein. See also,
e.g., Srivistava et al. (1983) J. Virology 45:555; Chiorini et al. (1998) J.
Virology 71:6823;
Chiorini et al. (1999) J. Virology 73: 1309; Bantel-Schaal et al. (1999) J.
Virology 73:939;
Xiao et al. (1999) J. Virology 73:3994; Muramatsu et al. (1996) Virology
221:208; Shade et
al. (1986) J. Virol. 58:921; Gao etal. (2002) Proc. Nat. Acad, Sci. USA 99:
11854; Moris et
al. (2004) Virology 33:375-383; international patent publications WO 00/28061,
WO
99/61601, WO 98/11244; WO 2013/063379; WO 2014/194132; WO 2015/121501, and
U.S.
Patent No. 6,156,303 and U.S. Patent No. 7,906,111.
As discussed herein, a "recombinant adeno-associated virus- or "rAAV- is
distinguished from a wild-type AAV by replacement of all or part of the
endogenous viral
genome with a non-native sequence. Incorporation of a non-native sequence
within the virus
defines the viral vector as a "recombinant" vector, and hence a "rAAV vector."
An rAAV
vector can include a heterologous polynucleotide encoding a desired RNA or
protein or
polypeptide (e.g., an RNA molecule disclosed herein). A recombinant vector
sequence may
be encapsidated or packaged into an AAV capsid and referred to as an -rAAV
vector," an
"rAAV vector particle," "rAAV viral particle" or simply a "rAAV."
The present disclosure provides for an rAAV vector comprising a polynucleotide
sequence not of AAV origin (e.g., a polynucleotide heterologous to AAV). The
heterologous
polynucleotide may be flanked by at least one, and sometimes by two, AAV
terminal repeat
sequences (e.g., inverted terminal repeats). The heterologous polynucleotide
flanked by ITRs,
also referred to herein as a "vector genome," typically encodes an RNA or a
polypeptide of
interest, or a gene of interest, such as a target for therapeutic treatment.
Delivery or
administration of an rAAV vector to a subject (e.g. a patient) provides
encoded
RNAs/proteins/peptides to the subject. Thus, an rAAV vector can be used to
transfer/deliver
a heterologous polynucleotide for expression for, e.g., treating a variety of
diseases, disorders
and conditions.
rAAV vector genomes generally retain 145 base ITRs in cis to the heterologous
nucleic acid sequence that replaced the viral rep and cap genes. Such ITRs are
useful to
produce a recombinant AAV vector; however, modified AAV ITRs and non-AAV
terminal
CA 03234809 2024-4- 11
WO 2023/069979
PCT/US2022/078344
UR 6-22023 /FR: 161118.03801 &03802
repeats including partially or completely synthetic sequences can also serve
this purpose.
ITRs form hairpin structures and function to, for example, serve as primers
for host-cell-
mediated synthesis of the complementary DNA strand after infection. ITRs also
play a role in
viral packaging, integration, etc. ITRs are the only AAV viral elements which
are required in
cis for AAV genome replication and packaging into rAAV vectors. An rAAV vector
genome
optionally comprises two ITRs which are generally at the 5' and 3' ends of the
vector genome
comprising a heterologous sequence (e.g., a transgene encoding a gene of
interest, or a
nucleic acid sequence of interest including, but not limited to, an antisense,
and siRNA, a
CRISPR molecule, among many others). A 5' and a 3' ITR may both comprise the
same
sequence, or each may comprise a different sequence. An AAV ITR may be from
any AAV
including by not limited to serotypes 1, 2, 3, 4, 5, 6, 7, 8, 9, 10 or 11 or
any other AAV.
An rAAV vector of the disclosure may comprise an ITR from an AAV serotype
(e.g.,
wild-type AAV2, a fragment or variant thereof) that differs from the serotype
of the capsid
(e.g., AAV8, Olig001). Such an rAAV vector comprising at least one ITR from
one serotype,
but comprising a capsid from a different serotype, may be referred to as a
hybrid viral vector
(see U.S. Patent No. 7,172,893). An AAV ITR may include the entire wild type
ITR
sequence, or be a variant, fragment, or modification thereof, but will retain
functionality.
In some embodiments, an rAAV vector genome is linear, single-stranded and
flanked
by AAV ITRs. Prior to transcription and translation of the heterologous gene,
a single
stranded DNA genome of approximately 4700 nucleotides must be converted to a
double-
stranded form by DNA polymerases (e.g., DNA polymerases within the transduced
cell)
using the free 3'-OH of one of the self-priming ITRs to initiate second-strand
synthesis. In
some embodiments, full length-single stranded vector genomes (i.e., sense and
anti-sense)
anneal to generate a full length-double stranded vector genome. This may occur
when
multiple rAAV vectors carrying genomes of opposite polarity (i.e., sense or
anti-sense)
simultaneously transduce the same cell. Regardless of how they are produced,
once double-
stranded vector genomes are formed, the cell can transcribe and translate the
double-stranded
DNA and express the heterologous gene.
The efficiency of transgene expression from an rAAV vector can be hindered by
the
need to convert a single stranded rAAV genome (ssAAV) into double-stranded DNA
prior to
expression. This step can be circumvented by using a self-complementary AAV
genome
(scAAV) that can package an inverted repeat genome that can fold into double-
stranded DNA
without the need for DNA synthesis or base-pairing between multiple vector
genomes. See,
51
CA 03234809 2024-4- 11
WO 2023/069979
PCT/US2022/078344
UR 6-22023 /FR: 161118.03801 &03802
e.g., U.S. Patent No. 8,784,799; McCarty, (2008) Molec. Therapy 16(10):1648-
1656; and
McCarty et al., (2001) Gene Therapy 8:1248-1254; McCarty et al., (2003) Gene
Therapy
10:2112-2118.
A viral capsid of an rAAV vector may be from a wild type AAV or a variant AAV
such as AAV1, AAV2, AAV3, AAV3A, AAV3B, AAV4, AAV5, AAV6, AAV7, AAV8,
AAV9, AAV10, AAVrh10, AAVrh74 (see W02016/210170), AAV12, AAV2i 8, AAV1 .1,
AAV2.5, AAV6.1, AAV6. 3. 1, AAV9.45, RH1VI4- 1 (WO 2015/013313), RHM15- 1,
RH1V115 -
2, RJ-1M15-3/RHM15-5, RHM15-4, RI-1M15-6, AAV hu .26, AAV1.1, AAV2 .5, AAV6.1,
AAV6.3.1, AAV9,45, AAV218, AAV29G, AAV2,8G9, AVV-LK03, AAV2-TT, AAV2-TT-
S312N, AAV3B-S312N, AAV avian AAV, bovine AAV, canine AAV, equine AAV, primate
AAV, non-primate AAV, snake AAV, goat AAV, shrimp AAV, ovine AAV and variants
thereof (see, e.g., Fields et al., VIROLOGY, volume 2, chapter 69 (4th ed.,
Lippincott-Raven
Publishers). Capsids may be derived from a number of AAV serotypes disclosed
in U.S.
Patent No. 7,906,111; Gao et al. (2004) J. Virol. 78:6381; Morris et al.
(2004) Virol. 33:375;
WO 2013/063379; WO 2014/194132; and include true type AAV (AAV-TT) variants
disclosed in WO 2015/121501, and RHM4-1, RHM15-1 through RHM15-6, and variants
thereof, disclosed in WO 2015/013313. A full complement of AAV cap proteins
includes
VP1, VP2, and VP3. The ORF comprising nucleotide sequences encoding AAV VP
capsid
proteins may comprise less than a full complement AAV Cap proteins or the full
complement
of AAV cap proteins may be provided.
In some embodiments, an rAAV vector comprising a capsid protein encoded by a
nucleotide sequence derived from more than one AAV serotype (e.g., wild type
AAV
serotypes, variant AAV serotypes) is referred to as a "chimeric vector" or
"chimeric capsid"
(See U.S. Patent No. 6,491,907, the entire disclosure of which is incorporated
herein by
reference). In some embodiments, a chimeric capsid protein is encoded by a
nucleic acid
sequence derived from 2, 3, 4, 5, 6, 7, 8, 9, 10 or more AAV serotypes. In
some
embodiments, a recombinant AAV vector includes a capsid sequence derived from
e.g.,
AAV1, AAV2, AAV3, AAV3A, AAV3B, AAV4, AAV5, AAV6, AAV7, AAV8, AAV9,
AAV10, AAV11, AAVrh74, AAVrh10, AAV2i8, or variant thereof, resulting in a
chimeric
capsid protein comprising a combination of amino acids from any of the
foregoing AAV
serotypes (see, Rabinowitz etal. (2002) J. Virology 76(2):791-801).
Alternatively, a chimeric
capsid can comprise a mixture of a VP1 from one serotype, a VP2 from a
different serotype,
a VP3 from yet a different serotype, and a combination thereof. For example a
chimeric virus
52
CA 03234809 2024-4- 11
WO 2023/069979
PCT/US2022/078344
UR 6-22023 /FR: 161118.03801 &03802
capsid may include an AAV1 cap protein or subunit and at least one AAV2 cap
protein or
subunit. A chimeric capsid can, for example include an AAV capsid with one or
more B19
cap subunits, e.g., an AAV cap protein or subunit can be replaced by a B19 cap
protein or
subunit. For example, in one embodiment, a VP3 subunit of an AAV capsid can be
replaced
by a VP2 subunit of B19. In some embodiments, a chimeric capsid is an Olig001
capsid as
described in W02021221995 and W02014052789, which are incorporated herein by
reference.
In some embodiments, chimeric vectors have been engineered to exhibit altered
tropism or tropism for a particular tissue or cell type. The term "tropism"
refers to
preferential entry of the virus into certain cell (e.g., oligodendrocytes) or
tissue types and/or
preferential interaction with the cell surface that facilitates entry into
certain cell or tissue
types. AAV tropism is generally determined by the specific interaction between
distinct viral
capsid proteins and their cognate cellular receptors (Lykken et al. (2018) J.
Neurodev.
Disord. 10:16). Preferably, once a virus or viral vector has entered a cell,
sequences (e.g.,
heterologous sequences such as a transgene) carried by the vector genome
(e.g., an rAAV
vector genome) are expressed.
A "tropism profile" refers to a pattern of transduction of one or more target
cells in
various tissues and/or organs. For example, a chimeric AAV capsid may have a
tropism
profile characterized by efficient transduction of oligodendrocytes or
astrocytes or
oligodendrocyte progenitor cells with only low transduction of neurons and
other CNS cells.
See W02014/052789, incorporated herein by reference. Such a chimeric capsid
may be
considered specific for oligodendrocytes or astrocytes or glial progenitor
cells exhibiting
tropism for oligodendrocytes or astrocytes or glial progenitor cells, and
referred to herein as
"glialtropism," if when administered directly into the CNS, preferentially
transduces
oligodendrocytes or astrocytes or oligodendrocyte progenitor cells over
neurons and other
CNS cell types. In some embodiments, at least about 80% of cells that are
transduced by a
capsid specific for oligodendrocytes or oligodendrocyte progenitor cells are
oligodendrocytes
or oligodendrocyte progenitor cells, e.g., at least about 85%, 90%, 95%, 96%,
97%, 98%
99% or more of the transduced cells are oligodendrocytes or oligodendrocyte
progenitor
cells.
Cell Replacement Therapy
One aspect of the present application relates to a method of alleviating
adverse effects
of age-related oligodendrocyte loss, astrocyte loss, or white matter loss in
the CNS (e.g.,
53
CA 03234809 2024-4- 11
WO 2023/069979
PCT/US2022/078344
UR 6-22023 /FR: 161118.03801 &03802
brain) of an adult subject. This method includes identifying a subject, e.g.,
an adult subject,
undergoing adverse effects of age-related oligodendrocyte loss, astrocyte
loss, or white
matter loss in the CNS (e.g., brain) and providing a population of isolated
glial progenitor
cells. The population of isolated glial progenitor cells is then introduced
into CNS (such as
the brain and/or brain stem) of the selected subject to at least partially
replace cells in the
subject's brain in the location undergoing the adverse effects of age-related
white matter loss.
As used herein, the term "glial cells" refers to a population of non-neuronal
cells that
provide support and nutrition, maintain homeostasis, either form myelin or
promote
myelination, and participate in signal transmission in the nervous system.
"Glial cells" as
used herein encompasses fully differentiated cells of the glial lineage, such
as
oligodendrocytes or astrocytes, and as well as glial progenitor cells. Glial
progenitor cells are
cells having the potential to differentiate into cells of the glial lineage
such as
oligodendrocytes and astrocytes.
The glial progenitor cells described herein may be derived from any suitable
source of
pluripotent stem cells, such as, for example and without limitation, human
induced
pluripotent stem cells (iPSCs) and embryonic stem cells, as described in more
detail below.
In one example, glial progenitor cells can be cells rejuvenated from glial
progenitor cells or
progenies thereof as described herein.
In some embodiments, to treat a subject in need thereof, glial progenitor
cells or
rejuvenated cells are young glial or glial progenitor cells, or are younger
than the counterparts
in the subject to be treated.
As used herein the term "young" glial or glial progenitor cells refers to
cells that are
induced to start differentiation into glial progenitor cell in an in vitro
setting (about 105 days
from cell isolation from fetal donor tissue). In some embodiments, the term
"young glial
cells" refers to differentiated glial progenitor cells that are ready for
transplantation into an
animal (about 160 days from cell isolation from fetal donor tissue). In some
embodiments,
the term "young glial cells" refers to glial progenitor cells or their progeny
that are within 1-
20 weeks of transplantation. The term "older glial cells" is used in relative
to the term "young
glial cells". Compared with older glial cells, young glial cells may have one
or more of the
following characteristics: (i) growing or proliferating or dividing faster,
(ii) having lower
levels than old of senescence-associated transcripts encoding CDKN1A (p21Cip
1) and
CDKN2/p16(INK4) and p14(ARF), and (iii) longer telomeres or higher telomerase
activity or
both.
54
CA 03234809 2024-4- 11
WO 2023/069979
PCT/US2022/078344
UR 6-22023 /FR: 161118.03801 &03802
In some embodiments, older glial cells are glial cells that are derived from
glial
progenitor cells that have been transplanted into a host for 5, 10, 20, 30 or
40 weeks. In some
embodiments, the older glial cells are glial cells that have been cultured for
an additional 5,
10, 20, 30 or 40 weeks from differentiated glial progenitor cells (e.g., about
160 days from
the initial tissue harvest). In some embodiments, the older glial cells are
glial cells that have
been cultured for an additional 5, 10, 20, 30 or 40 weeks from the
introduction of
differentiation (e.g., about 105 days from the initial tissue harvest).
iPSCs are pluripotent cells that are derived from non-pluripotent cells, such
as
somatic cells. For example, and without limitation, iPSCs can be derived from
tissue,
peripheral blood, umbilical cord blood, and bone marrow (see e.g., Cai et al.,
J. Biol. Chetn.
285(15):112227-11234 (2110); Giorgetti et al., Nat. Protocol. 5(4):811-820
(2010);
Streckfuss-Bomeke et al., Eur. Heart J. doi:10.1093/eurheartj/ehs203 (July 12,
2012); Hu et
al., Blood doi:10.1182/blood-2010-07-298331 (Feb. 4, 2011); Sommer et al., J.
Vis. Exp.
68:e4327 doi:10.3791/4327 (2012), which are hereby incorporated by reference
in their
entirety). The somatic cells can be reprogrammed to an embryonic stem cell-
like state using
genetic manipulation. Exemplary somatic cells suitable for the formation of
iPSCs include
fibroblasts (see e.g., Streckfuss-Bomeke et al., Eur. Heart J. doi : 10.
1093/eurheartj /ehs203
(2012), which is hereby incorporated by reference in its entirety), such as
dermal fibroblasts
obtained by a skin sample or biopsy, synoviocytes from synovial tissue,
keratinocytes, mature
B cells, mature T cells, pancreatic p cells, melanocytes, hepatocytes,
foreskin cells, cheek
cells, or lung fibroblasts.
Methods of producing induced pluripotent stem cells are known in the art and
typically involve expressing a combination of reprogramming factors in a
somatic cell.
Suitable reprogramming factors that promote and induce iPSC generation include
one or
more of 0ct4, Klf4, Sox2, c-Myc, Nanog, C/EBPa, Esrrb, Lin28, and Nr5a2 In
certain
embodiments, at least two reprogramming factors are expressed in a somatic
cell to
successfully reprogram the somatic cell. In other embodiments, at least three
reprogramming
factors are expressed in a somatic cell to successfully reprogram the somatic
cell.
iPSCs may be derived by methods known in the art, including the use
integrating viral
vectors (e.g., lentiviral vectors, inducible lentiviral vectors, and
retroviral vectors), excisable
vectors (e.g., transposon and fioxed lentiviral vectors), and non-integrating
vectors (e.g.,
adenoviral and plasmid vectors) to deliver the genes that promote cell
reprogramming (see
e.g., Takahashi and Yamanaka, Cell 126.663-676 (2006); Okita. et al., Nature
448:313-317
CA 03234809 2024-4- 11
WO 2023/069979
PCT/US2022/078344
UR 6-22023 /FR: 161118.03801 &03802
(2007); Nakagawa et al., Nat. Biotechnol. 26:101-106 (2007); Takahashi et al.,
Cell 131:1-12
(2007); Meissner et at. Nat. Biotech. 25:1177-1181(2007); Yu et at. Science
318:1917-1920
(2007); Park et al. Nature 451:141-146 (2008); and U.S. Patent Application
Publication No.
2008/0233610, which are hereby incorporated by reference in their entirety).
Other methods
for generating IPS cells include those disclosed in W02007/069666,
W02009/006930,
W02009/006997, W02009/007852, W02008/118820, U.S. Patent Application
Publication
No. 2011/0200568 to Ikeda et al., U.S. Patent Application Publication No
2010/0156778 to
Egusa et al., U.S. Patent Application Publication No 2012/0276070 to Musick,
and U.S.
Patent Application Publication No 2012/0276636 to Nakagawa, Shi et at, Cell
Stem Cell
3(5):568-574 (2008), Kim et al , Nature 454:646-650 (2008), Kim et al., Cell
136(3):411-419
(2009), Huangfu et at., Nat. Biotechnot 26:1269-1275 (2008), Zhao et al., Cell
Stem Cell
3:475-479 (2008), Feng et al., Nat. Cell Biol. 11:197-203 (2009), and Hanna et
al., Cell
133(2):250-264 (2008) which are hereby incorporated by reference in their
entirety.
The methods of iPSC generation described above can be modified to include
small
molecules that enhance reprogramming efficiency or even substitute for a
reprogramming
factor. These small molecules include, without limitation, epigenetic
modulators such as, the
DNA methyltransferase inhibitor 5'-azacytidine, the histone deacetylase
inhibitor VPA, and
the G9a histone methyltransferase inhibitor BIX-01294 together with BayK8644,
an L-type
calcium channel agonist. Other small molecule reprogramming factors include
those that
target signal transduction pathways, such as TGF-p inhibitors and kinase
inhibitors (e.g.,
kenpaullone) (see review by Sommer and Mostoslaysky, Stem Cell Res. Ther. 1:26
doi:10.1186/scrt26 (August 10, 2010), which is hereby incorporated by
reference in its
entirety).
Methods of obtaining highly enriched preparations of glial progenitor cells
from the
iPSCs that are suitable for making the non-human mammal models described
herein are
disclosed in W02014/124087 to Goldman and Wang, and Wang et al., Cell Stem
Cell
12(2):252-264 (2013), which are hereby incorporated by reference in their
entirety.
In another embodiment of the present application, the glial progenitor cells
are
derived from embryonic stem cells. Embryonic stem cells are derived from
totipotent cells of
the early mammalian embryo and are capable of unlimited, undifferentiated
proliferation in
vitro. As used herein, the term "embryonic stem cells" refer to a cells
isolated from an
embryo, placenta, or umbilical cord, or an immortalized version of such a
cells, i.e., an
embryonic stem cell line. Suitable embryonic stem cell lines include, without
limitation,
56
CA 03234809 2024-4- 11
WO 2023/069979
PCT/US2022/078344
UR 6-22023 /FR: 161118.03801 &03802
lines WA-01 (H1), WA-07, WA-09 (H9), WA-13, and WA-14 (H14) (Thomson el al.,
Science 282 (5391): 1145-47 (1998) and U.S. Patent No. 7,029,913 to Thomson et
al., which
are hereby incorporated by reference in their entirety). Other suitable
embryonic stem cell
lines includes the HAD-C100 cell line (Tannenbaum et al., PLoS One 7(6):e35325
(2012),
which is hereby incorporated by reference in its entirety, the WIBR4, WIBRS,
WIBR6 eel
lines (Lengner et al., Cell 141(5):872-83 (2010), which is hereby incorporated
by reference in
its entirety), and the human embryonic stem cell lines (HUES) lines 1-17
(Cowan et al., N.
Engl. I Med. 350:1353-56 (2004), which is hereby incorporated by reference in
its entirety).
Human embryonic stem cells provide a virtually unlimited source of
clonal/genetically modified cells potentially useful for tissue replacement
therapies. Methods
of obtaining highly enriched preparations of glial progenitor cells from
embryonic cells that
are suitable for making the non-human mammal model of the present disclosure
are described
herein as disclosed in Wang et al., Cell Stem Cell 12:252-264 (2013), which is
hereby
incorporated by reference in its entirety.
Briefly, glial progenitor cells are derived from a pluripotent population of
cells, i.e.,
iPSCs or embryonic stem cells, using a protocol that directs the pluripotent
cells through
serial stages of neural and glial progenitor cell differentiation. Each stage
of lineage
restriction is characterized and identified by the expression of certain cell
proteins. Stage 1 of
this process involves culturing the pluripotent cell population under
conditions effective to
induce embryoid body formation. As described herein, the pluripotent cell
population may
be maintained in co-culture with other cells, such as embryonic fibroblasts,
in an embryonic
stem cell (ESC) media (e.g., DMEM/F12 containing a suitable serum replacement
and
bFGF). The pluripotent cells are passaged before reaching 100% confluence,
e.g., 80%
confluence, when colonies are approximately 250-300um in diameter. The
pluripotential
state of the cells is readily assessed using markers to SSEA4, TRA-1-60, OCT-
4, NANOG,
and/or SOX2.
To generate embryoid bodies (EBs) (Stage 2), which are complex three-
dimensional
cell aggregates of pluripotent stem cells, pluripotent cell cultures are
dissociated once they
achieved ¨80% confluence with colony diameters at or around 250-300um. The EBs
are
initially cultured in suspension in ESC media without bFGF, and then switched
to neural
induction medium supplemented with bFGF and heparin. To induce neuroepithelial
differentiation (Stage 3) EBs are plated and cultured in neural induction
medium
supplemented with bFGF, heparin, laminin, then switched to neural induction
media
57
CA 03234809 2024-4- 11
WO 2023/069979
PCT/US2022/078344
UR 6-22023 /FR: 161118.03801 &03802
supplemented with retinoic acid. Neuroepithelial differentiation is assessed
by the co-
expression of PAX6 and SOX1, which characterize central neural stem and
progenitor cells.
To induce pre-oligodendrocyte progenitor cell ("pre-OPCs") differentiation,
neuroepithelial cell colonies can be cultured in the presence of additional
factors including
retinoic acid, B27 supplement, and a sonic hedgehog (shh) agonist (e.g.,
purmophamine).
The appearance of pre-OPC colonies is assessed by the presence of OLIG2 and/or
NKX2.2
expression. While both OLIG2 and NKX2.2 are expressed by central
oligodendrocyte
progenitor cells, NKX2.2 is a more specific indicator of oligodendroglial
differentiation.
Accordingly, an early pre-oligodendrocyte progenitor cell stage is marked by
OLIG /NKX2.2- cell colonies. OLIGT7NKX2.2- early pre-OPCs are differentiated
into later-
stage OLIG /NKX2.2 pre-OPCs by replacing retinoic acid with bFGF. At the end
of Stage
5, a significant percentage of the cells are pre-OPCs as indicated by
OLIG2/NKX2.2+
expression profile.
Pre-OPCs can be further differentiated into bipotential glial progenitor cells
by
culture in glial induction media supplemented with growth factors such as
triiodothyronine
(T3), neurotrophin 3 (NT3), insulin growth factor (IGF-1), and platelet-
derived growth
factor-AA (PDGF-AA) (Stage 6). These culture conditions can be extended for 3-
4 months
or longer to maximize the production of myelinogenic glial progenitor cells
when desired.
Cell preparations suitable for transplantation into an appropriate subject are
identified as
containing PDGFRa+ glial progenitor cells.
The population of glial progenitor cells used in carrying out the method of
the present
application may comprise at least about 80% glial progenitor cells, including,
for example,
about 80%, 85%, 90%, 95%, 96%, 97%, 98%, 99%, 100% glial cells. The selected
preparation of glial progenitor cells can be relatively devoid (e.g.,
containing less than 20, 15,
10, 9, 8, 7, 6, 5, 4, 3, 2, or 1%) of other cells types such as neurons and
neuronal progenitor
cells. Optionally, the cell population can be a substantially pure populations
of glial
progenitor cells.
The subject being treated in accordance with the method of the present
application
can be an adult afflicted with age-related white
matter/oligodendrocyte/astrocyte loss in the
brain. This method alleviates the adverse effects of this condition which can
arise as part of
the normal aging process.
As used herein, "treating" or "treatment" refers to any indication of success
in
amelioration of an injury, pathology, or condition, including any objective or
subjective
58
CA 03234809 2024-4- 11
WO 2023/069979
PCT/US2022/078344
UR 6-22023 /FR: 161118.03801 &03802
parameter such as abatement; remission; diminishing of symptoms or making the
injury,
pathology, or condition more tolerable to the patient; slowing the rate of
degeneration or
decline; making the final point of degeneration less debilitating; or
improving a subject's
physical or mental well-being. The treatment or amelioration of symptoms can
be based on
objective or subjective parameters; including the results of a physical
examination,
neurological examination, and/or psychiatric evaluation.
"Treating" may include the administration of glial progenitor cells or/and
other
agent(s) to prevent or delay, to alleviate, or to arrest or inhibit
development of the symptoms
or conditions associated with the disease, condition or disorder. "Therapeutic
effect" refers
to the reduction, elimination, or prevention of the disease, symptoms of the
disease, or side
effects of a disease, condition or disorder in the subject. Treatment may be
prophylactic (to
prevent or delay the onset or worsening of the disease, condition or disorder,
or to prevent the
manifestation of clinical or subclinical symptoms thereof) or therapeutic
suppression or
alleviation of symptoms after the manifestation of the disease, condition or
disorder
As used herein, the term "white matter" relates to a component of the central
nervous
system, in the brain and superficial spinal cord, which consists mostly of
glial cells and
myelinated axons that transmit signals from one region of the cerebrum to
another and
between the cerebrum and lower brain centers.
One of the conditions resulting from age-related white matter loss ,
oligodendrocyte
loss, or astrocyte loss in the brain which can be treated by the method of the
present
application is subcortical dimentia.
The glial progenitor cells may be introduced into the subject needing
alleviation of the
adverse effects by a variety of know techniques. These include, but are not
limited to,
injection, deposition, and grafting as described herein.
In one embodiment, the glial progenitor cells can be transplanted bilaterally
into
multiple sites of the subject, as described U.S. Patent No. 7,524,491 to
Goldman, Windrem et
al., Cell Stem Cell 2:553-565 (2008), Han et al., Cell Stem Cell 12:342-353
(2013), and
Wang et at., Cell Stem Cell 12:252-264 (2013), which are hereby incorporated
by reference
in their entirety). Methods for transplanting nerve tissues and cells into
host brains are
described by Bjorklund and Stenevi (eds), Neural Grafting in the Mammalian
CNS, Ch. 3-8,
Elsevier, Amsterdam (1985); U.S. Patent No. 5,082,670 to Gage et al.; and U.S.
Patent No.
6,497,872 to Weiss et al., which are hereby incorporated by reference in their
entirety.
59
CA 03234809 2024-4- 11
WO 2023/069979
PCT/US2022/078344
UR 6-22023 /FR: 161118.03801 &03802
Typical procedures include intraparenchymal, intracallosal, intraventricular,
intrathecal, and
intravenous transplantation.
Intraparenchymal transplantation can be achieved by injection or deposition of
tissue
within the host brain so as to be apposed to the brain parenchyma at the time
of
transplantation. The two main procedures for intraparenchymal transplantation
are: (1)
injecting the donor cells within the host brain parenchyma or (2) preparing a
cavity by
surgical means to expose the host brain parenchyma and then depositing the
graft into the
cavity (Bjorklund and Stenevi (eds), Neural Grafting in the Mammalian CNS, Ch.
3, Elsevier,
Amsterdam (1985), which is hereby incorporated by reference in its entirety).
Both methods
provide parenchymal apposition between the donor cells and host brain tissue
at the time of
grafting, and both facilitate anatomical integration between the graft and
host brain tissue.
This is of importance if it is required that the donor cells become an
integral part of the host
brain and survive for the life of the host.
Glial progenitor cells can also be delivered intracallosally as described in
U.S. Patent
Application Publication No. 20030223972 to Goldman, which is hereby
incorporated by
reference in its entirety. The glial progenitor cells can also be delivered
directly to the
forebrain subcortex, specifically into the anterior and posterior anlagen of
the corpus
callosum. Glial progenitor cells can also be delivered to the cerebellar
peduncle white matter
to gain access to the major cerebellar and brainstem tracts. Glial progenitor
cells can also be
delivered to the spinal cord.
Alternatively, the cells may be placed in a ventricle, e.g., a cerebral
ventricle
Grafting cells in the ventricle may be accomplished by injection of the donor
cells or by
growing the cells in a substrate such as 30% collagen to form a plug of solid
tissue which
may then be implanted into the ventricle to prevent dislocation of the graft
cells. For
subdural grafting, the cells may be injected around the surface of the brain
after making a slit
in the dura. .
Suitable techniques for cell delivery are described supra. In one embodiment,
said
preparation of glial progenitor cells is administered to the striatum,
forebrain, brain stem,
and/or cerebellum of the subject.
Delivery of the cells to the subject can include either a single step or a
multiple step
injection directly into the nervous system. For localized disorders such as
demyelination of
the optic nerve, a single injection can be used. Although adult and fetal
oligodendrocyte
precursor cells disperse widely within a transplant recipient's brain, for
widespread disorders,
CA 03234809 2024-4- 11
WO 2023/069979
PCT/US2022/078344
UR 6-22023 /FR: 161118.03801 &03802
multiple injections sites can be performed to optimize treatment. Injection is
optionally
directed into areas of the central nervous system such as white matter tracts
like the corpus
callosum (e.g., into the anterior and posterior anlagen), dorsal columns,
cerebellar peduncles,
cerebral peduncles. Such injections can be made unilaterally or bilaterally
using precise
localization methods such as stereotaxic surgery, optionally with accompanying
imaging
methods (e.g., high resolution MRI imaging). One of skill in the art
recognizes that brain
regions vary across species; however, one of skill in the art also recognizes
comparable brain
regions across mammalian species.
The cellular transplants can be optionally injected as dissociated cells but
can also be
provided by local placement of non-dissociated cells. In either case, the
cellular transplants
optionally comprise an acceptable solution. Such acceptable solutions include
solutions that
avoid undesirable biological activities and contamination. Suitable solutions
include an
appropriate amount of a pharmaceutically-acceptable salt to render the
formulation isotonic.
Examples of the pharmaceutically-acceptable solutions include, but are not
limited to, saline,
Ringer's solution, dextrose solution, and culture media. The pH of the
solution is preferably
from about 5 to about 8, and more preferably from about 7 to about 7.5.
The injection of the dissociated cellular transplant can be a streaming
injection made
across the entry path, the exit path, or both the entry and exit paths of the
injection device
(e.g., a cannula, a needle, or a tube). Automation can be used to provide a
uniform entry and
exit speed and an injection speed and volume.
The number of glial progenitor cells administered to the subject can range
from about
102-108 at each administration (e.g., injection site), depending on the size
and species of the
recipient, and the volume of tissue requiring cell replacement. Single
administration (e.g.,
injection) doses can span ranges of 103-105, 104-107, and 105-108 cells, or
any amount in total
for a transplant recipient patient.
Since the CNS is an immunologically privileged site, administered cells,
including
xenogeneic, can survive and, optionally, no immunosuppressant drugs or a
typical regimen of
immunosuppressant agents are used in the treatment methods. However,
optionally, an
immunosuppressant agent may also be administered to the subject.
Immunosuppressant
agents and their dosing regimens are known to one of skill in the art and
include such agents
as Azathioprine, Azathioprine Sodium, Cyclosporine, Daltrob an,
Gusperimus
Trihydrochloride, Sirolimus, and Tacrolimus. Dosages ranges and duration of
the regimen
can be varied with the disorder being treated, the extent of rejection, the
activity of the
61
CA 03234809 2024-4- 11
WO 2023/069979
PCT/US2022/078344
UR 6-22023 /FR: 161118.03801 &03802
specific immunosuppressant employed; the age, body weight, general health, sex
and diet of
the subject; the time of administration; the route of administration; the rate
of excretion of the
specific immunosuppressant employed; the duration and frequency of the
treatment; and
drugs used in combination. One of skill in the art can determine acceptable
dosages for and
duration of immunosuppression. The dosage regimen can be adjusted by the
individual
physician in the event of any contraindications or change in the subject's
status.
In one embodiment, one or more immunosuppressant agents can be administered to
the subject starting at 10 weeks prior to cell administration. In one
embodiment, the one or
more immunosuppressant agents are administered to the subject starting at 9
weeks, 8 weeks,
7 weeks, 6 weeks, 5 weeks, 4 weeks, 3 weeks, 2 weeks, 1 week, 7 days, 6 days,
5 days, 4
days, 3 days, 2 days, 1 day, <24 hours prior to cell administration. In one
embodiment, one
or more immunosuppressant agents are administered to the subject starting on
the day of cell
administration and continuing for 1, 2, 3, 4, 5, 6, 7, 8, 9, 10, 11, 12 months
post
administration. In one embodiment, the one or more immunosuppressant agents
are
administered to the subject for > 1 year following administration.
Suitable subjects for treatment in accordance with the methods described
herein
include any mammalian subject afflicted with age-related white matter loss.
Exemplary
mammalian subjects include humans, mice, rats, guinea pigs, and other small
rodents, dogs,
cats, sheep, goats, and monkeys. In one embodiment, the subject is human.
The above-described suppressor/rejuvenation therapy and cell therapy can be
used
together. For example, the inhibitory molecules, CRISPR/Cas systems,
expression cassettes,
or expression vectors described above can be used as therapeutic reagents in
ex vivo
applications. To that end, the reagents can be introduced into tissue or cells
that are
transplanted into a subject for therapeutic effect. The cells and/or tissue
can be derived from
an organism or subject that later receives the explant (e.g., isogenic or
autologous), or can be
derived from another organism or subject (e.g., a relative, a sibling, or a
HLA matching
donor) prior to transplantation (e.g., heterologous, xenogenic, allogeneic, or
isogenic). The
reagents can be used to modulate the expression of one or more genes in the
cells or tissue,
such that the cells or tissue obtain a desired phenotype or are able to
perform a function when
transplanted in vivo. In one embodiment, certain target cells from a patient
are extracted or
isolated. These isolated cells are contacted with the reagent targeting a
specific nucleotide
sequence within the cells under conditions suitable for uptake of the reagent
by these cells
(e.g., using delivery reagents such as cationic lipids, liposomes and the like
or using
62
CA 03234809 2024-4- 11
WO 2023/069979
PCT/US2022/078344
UR 6-22023 /FR: 161118.03801 &03802
techniques such as electroporation to facilitate the delivery of reagent into
cells). The cells
are then reintroduced back into the same patient or other patients.
For therapeutic applications, a pharmaceutically effective dose of the
therapeutic
reagent or pharmaceutical composition can be administered to the subject. A
pharmaceutically effective dose is a dose required to prevent, inhibit the
occurrence, or treat
(alleviate a symptom to some extent, preferably all of the symptoms) of a
disease state. One
skilled in the art can readily determine a therapeutically effective dose of
the reagent to be
administer to a given subject, by taking into account factors, such as the
size and weight of
the subject, the extent of the disease progression or penetration, the age,
health, and sex of the
subject, the route of administration m and whether the administration is
regional or systemic
Generally, an amount between 0.1 mg/kg and 100 mg/kg body weight/day of active
ingredients is administered dependent upon potency of the negatively charged
polymer. The
therapeutic reagent or pharmaceutical composition can be administered in a
single dose or in
multiple doses.
Pharmaceutical Compositions
The present disclosure provides a pharmaceutical composition, or medicament,
for
preventing or treating an inherited or acquired disorder of myelin. In some
embodiments, a
pharmaceutical composition comprises one or more of the above-described
protein molecule,
polynucleotide, expression cassette, expression vector (e.g., viral vector
genome, expression
vector, rAAV vector), system (e.g., a CRISPR/Cas system or nucleic acid(s)
encoding
components of the system), and host cell.
The pharmaceutical composition further comprises a pharmaceutically-acceptable
carrier, adjuvant, diluent, excipient and/or other medicinal agents. A
pharmaceutically
acceptable carrier, adjuvant, diluent, excipient or other medicinal agent is
one that is not
biologically or otherwise undesirable, e.g., the material may be administered
to a subject
without causing undesirable biological effects which outweigh the advantageous
biological
effects of the material. Any suitable pharmaceutically acceptable carrier or
excipient can be
used in the preparation of a pharmaceutical composition according to the
invention (See e.g.,
Remington The Science and Practice of Pharmacy, Adeboye Adej are (Editor)
Academic
Press, November 2020).
A pharmaceutical composition is typically sterile, pyrogen-free and stable
under the
conditions of manufacture and storage. A pharmaceutical composition may be
formulated as
a solution (e.g., water, saline, dextrose solution, buffered solution, or
other pharmaceutically
63
CA 03234809 2024-4- 11
WO 2023/069979
PCT/US2022/078344
UR 6-22023 /FR: 161118.03801 &03802
sterile fluid), microemulsion, liposome, or other ordered structure suitable
to accommodate a
high product (e.g., viral vector particles, microparticles or nanoparticles)
concentration.
In some embodiments, a pharmaceutical composition comprising the above-
described
protein, polynucleotide, expression cassette, expression vector, vector
genome, host cell, or
rAAV vector of the disclosure is formulated in water or a buffered saline
solution. A carrier
may be a solvent or dispersion medium containing, for example, water, ethanol,
polyol (for
example, glycerol, propylene glycol, and liquid polyethylene glycol, and the
like), and
suitable mixtures thereof. Proper fluidity can be maintained, for example, by
use of a coating
such as lecithin, by maintenance of a required particle size, in the case of
dispersion, and by
the use of surfactants. In some embodiments, it may be preferable to include
isotonic agents,
for example, a sugar, a polyalcohol such as mannitol, sorbitol, or sodium
chloride in the
composition. Prolonged adsorption of an injectable composition can be brought
about by
including, in the composition, an agent which delays absorption, e.g., a
monostearate salt and
gelatin. In some embodiments, a nucleic acid, vector and/or host cell of the
disclosure may be
administered in a controlled release formulation, for example, in a
composition which
includes a slow-release polymer or other carrier that protects the product
against rapid
release, including an implant and microencapsulated delivery system.
In some embodiments, a pharmaceutical composition of the disclosure is a
parenteral
pharmaceutical composition, including a composition suitable for intravenous,
intraarterial,
subcutaneous, intraderm al, intraperitoneal, intramuscular, intraarticular,
intraparenchymal
(IP), intrathecal (IT), intracerebroventricular (ICV) and/or intraci sternal
magna (ICM)
administration. In some embodiments, a pharmaceutical composition of this
disclosure is
formulated for administration by ICV injection. In some embodiments, a vector
(e.g., a viral
vector such as AAV) may be formulated in 350 mM NaCl and 5% D-sorbitol in PBS.
Methods of Administration
The above-described molecule, or polynucleotide, or vector (e.g., vector
genome,
rAAV vector), or system (e.g., a CRISPR/Cas systems or nucleic acid(s)
encoding
components of the system), or a cell may be administered to a subject (e.g., a
patient) or a
target cell in order to treat the subject. Administration of a vector to a
human subject, or an
animal in need thereof, can be by any means known in the art for administering
a vector.
Examples of a target cell include cells of the CNS, preferably
oligodendrocytes, astrocytes, or
the progenitor cells thereof.
64
CA 03234809 2024-4- 11
WO 2023/069979
PCT/US2022/078344
UR 6-22023 /FR: 161118.03801 &03802
A vector can be administered in addition to, and as an adjunct to, the
standard of care
treatment. That is, the vector can be co-administered with another agent,
compound, drug,
treatment or therapeutic regimen, either simultaneously, contemporaneously, or
at a
determined dosing interval as would be determined by one skilled in the art
using routine
methods. Uses disclosed herein include administration of an rAAV vector of the
disclosure at
the same time, in addition to and/or on a dosing schedule concurrent with, the
standard of
care for the disease as known in the art.
In some embodiments, a combination composition includes one or more
immunosuppressive agents. In some embodiments, a combination composition
includes an
rAAV vector comprising a transgene (e.g., a polynucleotide encoding an RNA
molecule
disclosed herein) and one or more immunosuppressive agents. In some
embodiments, a
method includes administering or delivering an rAAV vector comprising the
transgene to a
subject and administering an immunosuppressive agent to the subject either
prophylactically
prior to administration of the vector, or after administration of the vector
(i.e., either before or
after symptoms of a response against the vector and/or the protein provided
thereby are
evident).
In one embodiment, a vector of the disclosure (e.g., an rAAV vector) is
administered
systemically. Exemplary methods of systemic administration include, but are
not limited to,
intravenous (e.g., portal vein), intraarterial (e.g., femoral artery, hepatic
artery), intravascular,
subcutaneous, intradermal, intraperitoneal, transmucosal, intrapulmonary,
intralymphatic and
intramuscular administration, and the like, as well as direct tissue or organ
injection One
skilled in the art would appreciate that systemic administration can deliver a
nucleic acid to
all tissues. In some embodiments, direct tissue or organ administration
includes
administration to areas directly affected by oligodendrocyte deficiency (e.g.,
brain and/or
central nervous system). In some embodiments, vectors of the disclosure, and
pharmaceutical
compositions thereof, are administered to the brain parenchyma (i.e., by
intraparenchymal
administration), to the spinal canal or the subarachnoid space so that it
reaches the
cerebrospinal fluid (CSF) (i.e., by intrathecal administration), to a
ventricle of the brain (i.e.,
by intracerebroventricular administration) and/or to the cistema magna of the
brain (i.e., by
intraci sternal magna administration).
Accordingly, in some embodiments, a vector of the present disclosure is
administered
by direct injection into the brain (e.g., into the parenchyma, ventricle, ci
sterna magna, etc.)
and/or into the CSF (e.g., into the spinal canal or subarachnoid space) to
treat a disorder of
CA 03234809 2024-4- 11
WO 2023/069979
PCT/US2022/078344
UR 6-22023 /FR: 161118.03801 &03802
myelin. A target cell of a vector of the present disclosure includes a cell
located in the cortex,
subcortical white matter of the corpus callosum, striatum and/or cerebellum.
In some
embodiments, a target cell of a vector of the present disclosure is an
oligodendrocyte or a
progenitor cell thereof. Additional routes of administration may also comprise
local
application of a vector under direct visualization, e.g., superficial cortical
application, or
other stereotaxic application.
In some embodiments, a vector of the disclosure is administered by at least
two
routes. For example, a vector is administered systemically and also directly
into the brain. If
administered via at least two routes, the administration of a vector can be,
but need not be,
simultaneous or contemporaneous. Instead, administration via different routes
can be
performed separately with an interval of time between each administration.
The above-described protein, or polynucleotide encoding the protein, or a
vector
genome, or a vector (e.g., an rAAV vector) comprising the polynucleotide may
be used for
transduction of a cell ex vivo or for administration directly to a subject
(e.g., directly to the
CNS of a patient with a disease). In some embodiments, a transduced cell
(e.g., a host cell) is
administered to a subject to treat or prevent a disease, disorder or condition
(e.g., cell therapy
for the disease). For example, an rAAV vector comprising a therapeutic nucleic
acid (e.g.,
encoding a protein) can be preferably administered to an oligodendrocyte, an
astrocyte, or a
progenitor cell thereof in a biologically-effective amount.
The dosage amount of a vector depends upon, e.g., the mode of administration,
disease or condition to be treated, the stage and/or aggressiveness of the
disease, individual
subject's condition (age, sex, weight, etc.), particular viral vector,
stability of protein to be
expressed, host immune response to the vector, and/or gene to be delivered.
Generally, doses
range from at least 1 x 10⁸, or more, e.g., 1 x 10⁹, 1 x 10¹⁰, 1 x 10¹¹, 1 x
1012, 1 x 10¹³, 1 x
10', 1 x 10¹⁵ or more vector genomes (vg) per kilogram (kg) of body weight of
the subject to
achieve a therapeutic effect.
In some embodiments, a polynucleotide encoding a protein described herein may
be
administered as a component of a DNA molecule (e.g., a recombinant nucleic
acid) having a
regulatory element (e.g., a promoter) appropriate for expression in a target
cell (e.g., an
oligodendrocyte, an astrocyte, or a progenitor cell thereof). The
polynucleotide may be
administered as a component of a plasmid or a viral vector, such as an rAAV
vector. An
rAAV vector may be administered in vivo by direct delivery of the vector
(e.g., directly to the
CNS) to a patient in need of treatment. An rAAV vector may be administered to
a patient ex
66
CA 03234809 2024-4- 11
WO 2023/069979
PCT/US2022/078344
UR 6-22023 /FR: 161118.03801 &03802
vivo by administration of the vector in vitro to a cell from a donor patient
in need of
treatment, followed by introduction of the transduced cell back into the donor
(e.g., cell
therapy).
Kit
The present disclosure provides a kit with packaging material and one or more
components described therein. A kit typically includes a label or packaging
insert including a
description of the components or instructions for use in vitro, in vivo or er
vivo, of the
components therein. A kit can contain a collection of such components, e.g-.,
the above-
described polynucleotide, nucleic acid, expression cassette, expression vector
(e.g., viral
vector genome, expression vector, rAAV vector), and host cell, and optionally
a second
active agent such as a compound, therapeutic agent, drug or composition.
A kit refers to a physical structure that contains one or more components of
the kit.
Packaging material can maintain the components in a sterile manner and can be
made of
material commonly used for such purposes (e.g., paper, glass, plastic, foil,
ampules, vials,
tubes, etc).
A label or insert can include identifying information of one or more
components
therein, dose amounts, clinical pharmacology of the active ingredients(s)
including
mechanism of action, pharmacokinetics and pharmacodynamics. A label or insert
can include
information identifying manufacture, lot numbers, manufacture location and
date, expiration
dates. A label or insert can include information on a disease (e.g., an
inherited or acquired or
age-related disorder of myelin such as HD) for which a kit component may be
used. A label
or insert can include instructions for a clinician or subject for using one or
more of the kit
components in a method, use or treatment protocol or therapeutic regimen.
Instructions can
include dosage amounts, frequency of duration and instructions for practicing
any of the
methods, uses, treatment protocols or prophylactic or therapeutic regimens
described herein.
A label or insert can include information on potential adverse side effects,
complications or reaction, such as a warning to a subject or clinician
regarding situations
where it would not be appropriate to use a particular composition.
Definitions
Unless otherwise defined, all technical and scientific terms used herein have
the
meaning commonly understood by one of ordinary skill in the art to which this
invention
belongs. The terminology used herein is for the purpose of describing
particular embodiments
only and is not intended to be limiting of the invention. As used in the
description of the
67
CA 03234809 2024-4- 11
WO 2023/069979
PCT/US2022/078344
UR 6-22023 /FR: 161118.03801 &03802
invention and the appended claims, the singular forms "a," "an" and "the" are
intended to
include the plural forms as well, unless the context clearly indicates
otherwise. The following
terms have the meanings given:
As used herein, the term "about," or "approximately" refers to a measurable
value
such as an amount of the biological activity, homology or length of a
polynucleotide or
polypeptide sequence, dose, time, temperature, and the like, and is meant to
encompass
variations of 25%, 20%, 19%, 18%, 17%, 16%, 15%, 14%, 13%, 12%, 11%, 10%, 9%,
8%,
7%, 6%, 5%, 4%, 3%, 2% 1%, 0.5% or even 0.1%, in either direction (greater
than or less
than) of the specified amount unless otherwise stated, otherwise evident from
the context, or
except where such number would exceed 100% of a possible value.
The term "transgene" refers to a heterologous polynucleotide that is
introduced into a
cell and is capable of being transcribed into RNA and optionally, translated
and/or expressed
under appropriate conditions. In aspects, it confers a desired property to a
cell into which it
was introduced, or otherwise leads to a desired therapeutic or diagnostic
outcome. In another
aspect, it may be transcribed into a molecule that mediates RNA interference,
such as
miRNA, siRNA, or shRNA.
As used herein, the term "homologous," or "homology," refers to two or more
reference entities (e.g., a nucleic acid or polypeptide sequence) that share
at least partial
identity over a given region or portion. For example, when an amino acid
position in two
peptides is occupied by identical amino acids, the peptides are homologous at
that position.
Notably, a homologous peptide will retain activity or function associated with
the unmodified
or reference peptide and the modified peptide will generally have an amino
acid sequence
"substantially homologous" with the amino acid sequence of the unmodified
sequence. When
referring to a polypeptide, nucleic acid or fragment thereof, "substantial
homology" or
"substantial similarity," means that when optimally aligned with appropriate
insertions or
deletions with another polypeptide, nucleic acid (or its complementary strand)
or fragment
thereof, there is sequence identity in at least about 70% to 99% of the
sequence. The extent of
homology (identity) between two sequences can be ascertained using computer
program or
mathematical algorithm known in the art. Such algorithms that calculate
percent sequence
homology (or identity) generally account for sequence gaps and mismatches over
the
comparison region or area.
A nucleic acid or polynucleotide refers to a DNA molecule (e.g., a cDNA or
genomic
DNA), an RNA molecule (e.g., an mRNA), or a DNA or RNA analog. A DNA or RNA
68
CA 03234809 2024-4- 11
WO 2023/069979
PCT/US2022/078344
UR 6-22023 /FR: 161118.03801 &03802
analog can be synthesized from nucleotide analogs. The nucleic acid molecule
can be single-
stranded or double-stranded, but preferably is double-stranded DNA.
An isolated or recombinant nucleic acid refers to a nucleic acid the structure
of which
is not identical to that of any naturally occurring nucleic acid or to that of
any fragment of a
naturally occurring genomic nucleic acid. The term therefore covers, for
example, (a) a DNA
which has the sequence of part of a naturally occurring genomic DNA molecule
but is not
flanked by both of the sequences that flank that part of the molecule in the
genome of the
organism in which it naturally occurs; (b) a nucleic acid incorporated into a
vector or into the
genomic DNA of a prokaryote or eukaryote in a manner such that the resulting
molecule is
not identical to any naturally occurring vector or genomic DNA; (c) a separate
molecule such
as a cDNA, a genomic fragment, a fragment produced by polymerase chain
reaction (PCR),
or a restriction fragment; and (d) a recombinant nucleotide sequence that is
part of a hybrid
gene, i.e., a gene encoding a fusion protein. The nucleic acid described above
can be used to
express the protein of this disclosure. For this purpose, one can operatively
linked the nucleic
acid to suitable regulatory sequences to generate an expression vector.
A "recombinant nucleic acid" is a combination of nucleic acid sequences that
are
joined together using recombinant technology and procedures used to join
together nucleic
acid sequences.
The terms "heterologous" DNA molecule and -heterologous" nucleic acid, as used
herein, each refer to a molecule that originates from a source foreign to the
particular host
cell or, if from the same source, is modified from its original form. Thus, a
heterologous
gene in a host cell includes a gene that is endogenous to the particular host
cell but has been
modified through, for example, the use of shuffling or recombination. When
used to describe
two nucleic acid segments, the terms mean that the two nucleic acid segments
are not from
the same gene or, if form the same gene, one or both of them are modified from
the original
forms. The terms also include non-naturally occurring multiple copies of a
naturally
occurring DNA molecule. Thus, the terms refer to a nucleic acid segment that
is foreign or
heterologous to the cell, or homologous to the cell but in a position within
the host cell
nucleic acid in which the element is not ordinarily found. Exogenous DNA
segments are
expressed to yield exogenous RNAs or polypeptides. A "homologous DNA molecule"
is a
DNA molecule that is naturally associated with a host cell into which it is
introduced.
A "regulatory sequence" includes promoters, enhancers, and other expression
control
elements (e.g., polyadenylation signals). Regulatory sequences include those
that direct
69
CA 03234809 2024-4- 11
WO 2023/069979
PCT/US2022/078344
UR 6-22023 /FR: 161118.03801 &03802
constitutive expression of a nucleotide sequence, as well as tissue-specific
regulatory and/or
inducible sequences. The design of the expression vector can depend on such
factors as the
choice of the host cell to be transformed, the level of expression of protein
or RNA desired,
and the like. The expression vector can be introduced into host cells to
produce an RNA or a
polypeptide of interest. A promoter is defined as a DNA sequence that directs
RNA
polymerase to bind to DNA and initiate RNA synthesis. A strong promoter is one
which
causes RNAs to be initiated at high frequency.
A "promoter" is a nucleotide sequence which initiates and regulates
transcription of a
polynucleotide. Promoters can include inducible promoters (where expression of
a
polynucleotide sequence operably linked to the promoter is induced by an
analyte, cofactor,
regulatory protein, etc.), repressible promoters (where expression of a
polynucleotide
sequence operably linked to the promoter is repressed by an analyte, cofactor,
regulatory
protein, etc.), and constitutive promoters. It is intended that the term
"promoter" or "control
element" includes full-length promoter regions and functional (e.g., controls
transcription or
translation) segments of these regions.
"Operably linked" refers to an arrangement of elements wherein the components
so
described are configured so as to perform their usual function. Thus, a given
promoter
operably linked to a nucleic acid sequence is capable of effecting the
expression of that
sequence when the proper enzymes are present. The promoter need not be
contiguous with
the sequence, so long as it functions to direct the expression thereof Thus,
for example,
intervening untranslated yet transcribed sequences can be present between the
promoter
sequence and the nucleic acid sequence and the promoter sequence can still be
considered
"operably linked" to the coding sequence. Thus, the term "operably linked" is
intended to
encompass any spacing or orientation of the promoter element and the DNA
sequence of
interest which allows for initiation of transcription of the DNA sequence of
interest upon
recognition of the promoter element by a transcription complex.
As used here, the term "genetic construct" or "nucleic acid construct," refers
to a non-
naturally occurring nucleic acid molecule resulting from the use of
recombinant DNA
technology (e.g., a recombinant nucleic acid). A genetic or nucleic acid
construct is a nucleic
acid molecule, either single or double stranded, which has been modified to
contain segments
of nucleic acid sequences, which are combined and arranged in a manner not
found in nature.
A nucleic acid construct may be a "cassette" or a "vector" (e.g., a plasmid,
an rAAV vector
CA 03234809 2024-4- 11
WO 2023/069979
PCT/US2022/078344
UR 6-22023 /FR: 161118.03801 &03802
genome, an expression vector, etc.), that is, a nucleic acid molecule designed
to deliver
exogenously created DNA into a host cell.
"Expression cassette" as used herein means a nucleic acid sequence capable of
directing expression of a particular nucleotide sequence in an appropriate
host cell, which
may include a promoter operably linked to the nucleotide sequence of interest
that may be
operably linked to termination signals. It also may include sequences required
for proper
translation of the nucleotide sequence. The coding region usually codes for an
RNA or
protein of interest. The expression cassette including the nucleotide sequence
of interest may
be chimeric. The expression cassette may also be one that is naturally
occurring but has been
obtained in a recombinant form useful for heterologous expression. The
expression of the
nucleotide sequence in the expression cassette may be under the control of a
constitutive
promoter or of a regulatable promoter that initiates transcription only when
the host cell is
exposed to some particular stimulus. In the case of a multicellular organism,
the promoter
can also be specific to a particular tissue or organ or stage of development.
A vector refers to a nucleic acid molecule capable of transporting another
nucleic acid
to which it has been linked. The vector may or may not be capable of
autonomous replication
or integrate into a host DNA. Examples include a plasmid, virus (e.g., an
rAAV), cosmid, or
other vehicle that can be manipulated by insertion or incorporation of a
nucleic acid (e.g., a
recombinant nucleic acid). A vector can be used for various purposes
including, e.g., genetic
manipulation (e.g., cloning vector), to introduce/transfer a nucleic acid into
a cell, to
transcribe or translate an inserted nucleic acid in a cell. In some
embodiments a vector
nucleic acid sequence contains at least an origin of replication for
propagation in a cell. In
some embodiments, a vector nucleic acid includes a heterologous nucleic acid
sequence, an
expression control element(s) (e.g., promoter, enhancer), a selectable marker
(e.g., antibiotic
resistance), a poly-adenosine (polyA) sequence and/or an ITR. In some
embodiments, when
delivered to a host cell, the nucleic acid sequence is propagated. In some
embodiments, when
delivered to a host cell, either in vitro or in vivo, the cell expresses the
polypeptide encoded
by the heterologous nucleic acid sequence. In some embodiments, when delivered
to a host
cell, the nucleic acid sequence, or a portion of the nucleic acid sequence is
packaged into a
capsid. A host cell may be an isolated cell or a cell within a host organism.
In addition to a
nucleic acid sequence (e.g., transgene) which encodes an RNA, or a polypeptide
or a protein,
additional sequences (e.g., regulatory sequences) may be present within the
same vector (i.e.,
in cis to the gene) and flank the gene. In some embodiments, regulatory
sequences may be
71
CA 03234809 2024-4- 11
WO 2023/069979
PCT/US2022/078344
UR 6-22023 /FR: 161118.03801 &03802
present on a separate (e.g., a second) vector which acts in trans to regulate
the expression of
the gene. Plasmid vectors may be referred to herein as "expression vectors.-
As used herein, the term "vector genome" refers to a recombinant nucleic acid
sequence that is packaged or encapsidated to form an rAAV vector. Typically, a
vector
genome includes a heterologous polynucleotide sequence, e.g., a transgene,
regulatory
elements, ITRs not originally present in the capsid. In cases where a
recombinant plasmid is
used to construct or manufacture a recombinant vector (e.g., rAAV vector), the
vector
genome does not include the entire plasmid but rather only the sequence
intended for delivery
by the viral vector. This non-vector genome portion of the recombinant plasmid
is typically
referred to as the "plasmid backbone," which is important for cloning,
selection and
amplification of the plasmid, a process that is needed for propagation of
recombinant viral
vector production, but which is not itself packaged or encapsidated into an
rAAV vector.
As used herein, the term "viral vector- generally refers to a viral particle
that
functions as a nucleic acid delivery vehicle and which comprises a vector
genome (e.g.,
comprising a transgene instead of a nucleic acid encoding an AAV rep and cap)
packaged
within the viral particle (i.e., capsid) and includes, for example, lenti- and
parvo- viruses,
including AAV serotypes and variants (e.g., rAAV vectors). A recombinant viral
vector does
not comprise a vector genome comprising a rep and/or a cap gene.
As used herein, the term "overexpressing," "overexpress," "overexpressed," or
"overexpression," when referring to the production of a nucleic acid or a
protein in a host cell
means that the nucleic acid or protein is produced in greater amounts than it
is produced in its
naturally occurring environment. It is intended that the term encompass
overexpression of
endogenous, as well as exogenous or heterologous nucleic acids and proteins.
As such, the
terms and the like are intended to encompass increasing the expression of a
nucleic acid or a
protein in a cell to a level greater than that the cell naturally contains. In
certain
embodiments, the expression level or amount of the nucleic acid or protein in
a cell is
increased by at least 5%, 10%, 20%, 25%, 30%, 40%, 50%, 60%, 70%, 75%, 80%,
85%,
90%, 95%, 100%, 110%, 120%, 130%, 140%, 150%, 160%, 170%, 180%, 190%, 200%,
250%, 300%, 350%, 400%, 450%, 500%, 550%, 600%, 650%, 700%, 750%, 800%, 850%,
900%, 950%, or 1000% as compared to the level or amount that the cell
naturally contains.
In the context of a mutant or diseased cell, the terms "overexpressing,"
"overexpress,
"overexpressed," and "overexpression," and the like are intended to encompass
increasing the
expression of a nucleic acid or a protein to a level greater than that a
mutant cell, a diseased
72
CA 03234809 2024-4- 11
WO 2023/069979
PCT/US2022/078344
UR 6-22023 /FR: 161118.03801 &03802
cell, a wildtype cell, or a non-diseased cell contains. In certain
embodiments, the expression
level or amount of the nucleic acid or protein in a mutant or diseased cell is
increased by at
least 5%, 10%, 20%, 25%, 30%, 40%, 50%, 60%, 70%, 75%, 80%, 85%, 90%, 95%,
100%,
110%, 120%, 130%, 140%, 150%, 160%, 170%, 180%, 190%, 200%, 250%, 300%, 350%,
400%, 450%, 500%, 550%, 600%, 650%, 700%, 750%, 800%, 850%, 900%, 950%, or
1000% as compared to the level or amount that a mutant cell, a diseased cell,
a wildtype cell,
or a non-diseased cell contains.
-Anti-sense" refers to a nucleic acid sequence, regardless of length, that is
complementary to the coding strand or mRNA of a nucleic acid sequence. Anti
sense RNA
can be introduced to an individual cell, tissue or organanoid. An anti-sense
nucleic acid can
contain a modified backbone, for example, phosphorothioate,
phosphorodithioate, or other
modified backbones known in the art, or may contain non-natural
internucleoside linkages.
As referred to herein, a "complementary nucleic acid sequence" is a nucleic
acid
sequence capable of hybridizing with another nucleic acid sequence comprised
of
complementary nucleotide base pairs. By "hybridize" is meant pair to form a
double-
stranded molecule between complementary nucleotide bases (e.g., adenine (A)
forms a base
pair with thymine (T), as does guanine (G) with cytosine (C) in DNA) under
suitable
conditions of stringency. (See, e.g., Wahl, G. M. and S. L. Berger (1987)
Methods Enzymol.
152:399; Kimmel, A. R. (1987) Methods Enzymol. 152:507).
A "suppressor" or an "inhibitor" refers to an agent that causes a decrease in
the
expression or activity of a target gene or protein, respectively.
The terms "inhibit", "down-regulate", or "reduce", refer to the reduction in
the
expression of a gene, or level of RNA molecules or equivalent RNA molecules
encoding one
or more proteins or protein subunits, or activity of one or more proteins or
protein subunits,
below that observed in the absence of an inhibitor, suppressor or repressor,
such as the
inhibitory nucleic acid molecules (e.g., siRNA) described herein. Down-
regulation can be
associated with post-transcriptional silencing, such as, RNAi mediated
cleavage or by
alteration in DNA methylation patterns or DNA chromatin structure.
As used herein, an "inhibitory nucleic acid" is a double-stranded RNA, RNA
interference, miRNA, siRNA, shRNA, or antisense RNA, or a portion thereof, or
a mimetic
thereof, that when administered to a mammalian cell results in a decrease in
the expression of
a target gene. Typically, a nucleic acid inhibitor comprises at least a
portion of a target
nucleic acid molecule, or an ortholog thereof, or comprises at least a portion
of the
73
CA 03234809 2024-4- 11
WO 2023/069979
PCT/US2022/078344
UR 6-22023 /FR: 161118.03801 &03802
complementary strand of a target nucleic acid molecule. Typically, expression
of a target
gene is reduced by 10%, 25%, 50%, 75%, or even 90-100%.
As used herein, the term "siRNA" intends a double-stranded RNA molecule that
interferes with the expression of a specific gene or genes post-transcription.
In some
embodiments, the siRNA functions to interfere with or inhibit gene expression
using the
RNA interference pathway. Similar interfering or inhibiting effects may be
achieved with
one or more of short hairpin RNA (shRNA), microRNA (mRNA) and/or nucleic acids
(such
as siRNA, shRNA, or miRNA) comprising one or more modified nucleic acid
residue--e.g.
peptide nucleic acids (PNA), locked nucleic acids (LNA), unlocked nucleic
acids (UNA), or
triazole-linked DNA. Optimally, a siRNA is 18, 19, 20, 21, 22, 23 or 24
nucleotides in length
and has a 2-base overhang at its 3' end. These dsRNAs can be introduced to an
individual
cell or culture system. Such siRNAs are used to downregulate mRNA levels or
promoter
activity.
As used herein, the terms "treat,- "treating- or "treatment- refer to
administration of a
therapy that partially or completely alleviates, ameliorates, relieves,
inhibits, delays onset of,
reduces severity of, and/or reduces incidence of one or more symptoms,
features, and/or
causes of a particular disease, disorder, and/or condition.
As used herein, the term "ameliorate" means a detectable or measurable
improvement
in a subject's disease, disorder or condition, or symptom thereof, or an
underlying cellular
response. A detectable or measurable improvement includes a subjective or
objective
decrease, reduction, inhibition, suppression, limit or control in the
occurrence, frequency,
severity, progression or duration of, complication cause by or associated
with, improvement
in a symptom of, or a reversal of a disease, disorder or condition.
As used herein, the term "associated with" refers to with one another, if the
presence,
level and/or form of one is correlated with that of the other. For example, a
particular entity
(e.g., polypeptide, genetic signature, metabolite, microbe, etc.) is
considered to be associated
with a particular disease, disorder, or condition, if its presence, level
and/or form correlates
with incidence of and/or susceptibility to the disease, disorder, or condition
(e.g., across a
relevant p opul ati on).
As used herein, the term -prevent- or -prevention" refers to delay of onset,
and/or
reduction in frequency and/or severity of one or more sign or symptom of a
particular
disease, disorder or condition (e.g., a myelin disease). In some embodiments,
prevention is
assessed on a population basis such that an agent is considered to "prevent" a
particular
74
CA 03234809 2024-4- 11
WO 2023/069979
PCT/US2022/078344
UR 6-22023 /FR: 161118.03801 &03802
disease, disorder or condition if a statistically significant decrease in the
development,
frequency and/or intensity of one or more sign or symptom of the disease,
disorder or
condition is observed in a population susceptible to the disease, disorder or
condition.
Prevention may be considered complete when onset of disease, disorder or
condition has been
delayed for a predefined period of time.
As used herein, the term "therapeutically effective amount" refers to an
amount that
produces the desired therapeutic effect for which it is administered. In some
embodiments,
the term refers to an amount that is sufficient, when administered to a
population suffering
from or susceptible to a disease, disorder or condition in accordance with a
therapeutic dosing
regimen, to treat the disease, disorder or condition. In some embodiments, a
therapeutically
effective amount is one that reduces the incidence and/or severity of, and/or
delays onset of,
one or more symptoms of the disease, disorder, and/or condition. Those of
ordinary skill in
the art will appreciate that the term "therapeutically effective amount- does
not in fact require
successful treatment be achieved in a particular individual. Rather, a
therapeutically effective
amount may be that amount that provides a particular desired pharmacological
response in a
significant number of subjects when administered to patients in need of such
treatment.
"Population" of cells refers to any number of cells greater than 1, but is at
least lx 103
cells, at least ix 104 cells, at least at least ix 105 cells, at least ix 106
cells, at least I x107 cells,
at least 1 x10⁸ cells, at least lx 109 cells, or at least 1 x 10¹⁰ cells.
As used herein, the term "stem cells" refers to cells with the ability to both
replace
themselves and to differentiate into more specialized cells. Their self-
renewal capacity
generally endures for the lifespan of the organism. A pluripotent stem cell
can give rise to all
the various cell types of the body. A multipotent stem cell can give rise to a
limited subset of
cell types. For example, a hematopoietic stem cell can give rise to the
various types of cells
found in blood, but not to other types of cells. Multipotent stem cells can
also be referred to
as somatic stem cells, tissue stem cells, lineage-specific stem cells, and
adult stem cells. The
non-stem cell progeny of multipotent stem cells are progenitor cells (also
referred to as
restricted-progenitor cells). Progenitor cells give rise to fully
differentiated cells, but a more
restricted set of cell types than stem cells. Progenitor cells also have
comparatively limited
self-renewal capacity; as they divide and differentiate they are eventually
exhausted and
replaced by new progenitor cells derived from their upstream multipotent stem
cell.
"Induced pluripotent stem cells," commonly abbreviated as iPS cells or iPSCs,
refer to
a type of pluripotent stem cell artificially prepared from a non-pluripotent
cell, typically an
CA 03234809 2024-4- 11
WO 2023/069979
PCT/US2022/078344
UR 6-22023 /FR: 161118.03801 &03802
adult somatic cell, or terminally differentiated cell, such as fibroblast, a
hematopoietic cell, a
myocyte, a neuron, an epidermal cell, or the like, by introducing certain
factors, referred to as
reprogramming factors.
"Pluripotency" refers to a stem cell that has the potential to differentiate
into all cells
constituting one or more tissues or organs, or particularly, any of the three
germ layers:
endoderm (interior stomach lining, gastrointestinal tract, the lungs),
mesoderm (muscle, bone,
blood, urogenital), or ectoderm (epidermal tissues and nervous system).
"Pluripotent stem
cells" used herein refer to cells that can differentiate into cells derived
from any of the three
germ layers, for example, direct descendants of totipotent cells or induced
pluripotent cells.
As used herein, "therapeutic cells" refers to a cell population that
ameliorates a
condition, disease, and/or injury in a patient. Therapeutic cells may be
autologous (i.e.,
derived from the patient), allogeneic (i.e., derived from an individual of the
same species that
is different from the patient) or xenogeneic (i.e., derived from a different
species than the
patient). Therapeutic cells may be homogenous (i.e., consisting of a single
cell type) or
heterogeneous (i.e., consisting of multiple cell types). The term "therapeutic
cell" includes
both therapeutically active cells as well as progenitor cells capable of
differentiating into a
therapeutically active cell.
The term "autologous" refers to any material derived from the same subject or
individual to which it is later to be re-introduced. For example, the
autologous cell therapy
method described herein involves collection of glial cells, or progenitors
thereof from a
donor, e.g., a patient, which are then engineered to express, e.g., a
transgene, and then
administered back to the same donor, e.g., patient.
The term "heterologous" refers to any material (e.g., cells or tissue
scaffold) derived
from a different subject or individual. As used herein, ''heterologous" or
"non-endogenous"
or "exogenous" also refers to any material (e.g., gene, protein, compound,
molecule, cell, or
tissue or tissue component) or activity that is not native to a host cell or a
host subject, or is
any gene, protein, compound, molecule, cell, tissue or tissue component, or
activity native to
a host or host cell but has been altered or mutated such that the structure,
activity or both is
different as between the native and mutated versions.
The term "allogeneic' refers to any material (e.g., cells or tissue) derived
from one
individual which is then introduced to another individual of the same species,
e.g., allogeneic
cell transplantation. For example, cells may be obtained from a first subject,
modified ex vivo
according to the methods described herein and then administered to a second
subject in order
76
CA 03234809 2024-4- 11
WO 2023/069979
PCT/US2022/078344
UR 6-22023 /FR: 161118.03801 &03802
to treat a disease. In such embodiments, the cells administered to the subject
are allogeneic
and heterologous cells.
The term "xenogenic" refers to any material (e.g., cells or tissue) derived
from an
individual of a different species.
The term "isogenic" refers to any materials (e.g., cells or tissue)
characterized by
essentially identical genes.
As used herein, the term "subject" refers to an organism, for example, a
mammal
(e.g., a human, a non-human mammal, a non-human primate, a primate, a
laboratory animal,
a mouse, a rat, a hamster, a gerbil, a cat, a dog). In some embodiments, a
subject is a non-
human disease model. In some embodiments, a human subject is an adult,
adolescent, or
pediatric subject. In some embodiments, a subject is suffering from a disease,
disorder or
condition, e.g., a disease, disorder or condition that can be treated as
provided herein. In some
embodiments, a subject is suffering from a disease, disorder or condition
associated with
deficient or dysfunctional myelin. In some embodiments, a subject is
susceptible to a disease,
disorder, or condition. In some embodiments, a susceptible subject is
predisposed to and/or
shows an increased risk (as compared to the average risk observed in a
reference subject or
population) of developing a disease, disorder or condition. In some
embodiments, a subject
displays one or more symptoms of a disease, disorder or condition. In some
embodiments, a
subject does not display a particular symptom (e.g., clinical manifestation of
disease) or
characteristic of a disease, disorder, or condition. In some embodiments, a
subject does not
display any symptom or characteristic of a disease, disorder, or condition. In
some
embodiments, a subject is a human patient. In some embodiments, a subject is
an individual
to whom diagnosis and/or therapy is and/or has been administered.
As used herein, the term "therapeutically effective amount" refers to an
amount that
produces the desired therapeutic effect for which it is administered. In some
embodiments,
the term refers to an amount that is sufficient, when administered to a
population suffering
from or susceptible to a disease, disorder or condition in accordance with a
therapeutic dosing
regimen, to treat the disease, disorder or condition. In some embodiments, a
therapeutically
effective amount is one that reduces the incidence and/or severity of, and/or
delays onset of,
one or more symptoms of the disease, disorder, and/or condition. Those of
ordinary skill in
the art will appreciate that the term "therapeutically effective amount" does
not in fact require
successful treatment be achieved in a particular individual. Rather, a
therapeutically effective
77
CA 03234809 2024-4- 11
WO 2023/069979
PCT/US2022/078344
UR 6-22023 /FR: 161118.03801 &03802
amount may be that amount that provides a particular desired pharmacological
response in a
significant number of subjects when administered to patients in need of such
treatment.
The examples below are intended to exemplify the practice of embodiments of
the
disclosure but are by no means intended to limit the scope thereof. Examples
Part A relates
to competitive replacement of glial cells. Examples Part B relates to
rejuvenation of glial
progenitor cells.
EXAMPLES
EXAMPLES PART A: Competitive Replacement Of Glial Progenitor Cells In Adult
Brain
Materials and Methods
Human embryonic stem cell lines and culture conditions
Sibling human embryonic stem cells (hESCs) lines GENEA019 (WT: 18;15 CAG)
and GENEA020 (HD: 48;17 CAG). hESC were regularly cultured under feeder-free
conditions on 0.55 ug/cm2 human recombinant laminin 521 (SIOLAM_INA, cat. no.
LN521)
coated cell culture flasks with mTeSR1 medium (STEMCELL TECHNOLOGIES, cat. no.
85850). Daily medium changes were performed. hESCs were routinely passaged at
80%
confluency onto freshly coated flasks.
Passaging was performed using ReLeSR
(STEMCELL TECHNOLOGIES, cat. no. 05872). All hESCs and differentiated cultures
were maintained in a 5% CO2 incubator at 37 C and routinely checked for
contamination
and mycoplasma free status.
Generation of:fluorescent reporter hESCs
For ubiquitous and distinct fluorescent labeling of WT and HD cells (FIG. 1),
reporter
constructs driving expression of either mCherry or EGFP were inserted into the
AAVS1 safe-
harbor locus of WT GENEA019 and HD GENEA020 hESCs, respectively, using a
modified
version of the CRISPR-Cas9 mediated strategy previously described in Oceguera-
Yanez, F.,
et al., Methods 101, 43--55, which is hereby incorporated by reference in its
entirety). To
prepare hESCs for plasmid delivery by electroporation, hESC were harvested as
single cell
suspension following dissociation with Accutase (StemCell Technologies, cat.
no. 07920),
washed in culture medium, and counted with the automated cell counter
NucleoCounter NC-
200 (ChemoMetec). Per electroporation, a total of 1.5 x 10⁶ cells were mixed
with 5 lag of
the AAVS1 targeting CR1SPR-Cas9 plasmid (pXAT2) and 5 1,tg of reporter donor
plasmid
(pAAVS1-P-CAG-mCh or pAAVS1-P-CAG-GFP). pXAT2 (Addgene plasmid no 80494),
78
CA 03234809 2024-4- 11
WO 2023/069979
PCT/US2022/078344
UR 6-22023 /FR: 161118.03801 &03802
pAAVS1-P-CAG-mCh (Addgene plasmid no. 80491) and pAAVS1-P-CAG-GFP (Addgene
plasmid no. 80492) were a gift from Knut Woltjen. Electroporation was
performed using an
Amaxa 4D-Nucleofector (Lonza) with the P3 primary cell kit (Lonza, cat. no.
V4XP-3024)
according to manufacturer's guidelines. After nucleofection, the
electroporated hESC
suspensions were transferred to 10 cm cell culture dishes and cultured with
mTeSR1
supplemented with 10 uM Y-27632 (Tocris, cat. no. 1254) for the first 24h.
Electroporated
hESCs were grown for 48-72h and then treated with 0,5 ug/uL puromycin
(ThermoFisher,
cat. no. A1113803). Electroporated hESC cultures were kept under puromycin
until
individual colonies were large enough to be picked manually. Colonies were
assessed by
fluorescent microscopy and transferred to a 96-well plate based on uniformity
of fluorescent
protein expression. Following their expansion, each clone was split for
further expansion and
for genotyping. For genotyping, DNA was extracted using the prepGEM Tissue DNA
extraction kit (Zygem). Correctly targeted transgenic integrations in the
AAVS1 locus were
detected by PCR using the following primers: dna803: TCGACTTCCCCTCTTCCGATG
(SEQ ID NO; 1) and dna804: CTCAGGTTCTGGGAGAGGGTAG (SEQ ID NO; 2); while
the zygosity of the integrations was determined by the presence or absence of
a WT allele
using an additional primer: (dna803 and dna183: GAGCCTAGGGCCGGGATTCTC(SEQ
ID NO; 3)). hESC clones with correctly targeted insertions were cryopreserved
with Pro-
Freeze CDM medium (Lonza, cat. no. BEBP12-769E) and expanded for karyotyping
and
array comparative genomic hybridization (aCGH) characterization prior to
experimental
application.
Karyotyping and aCGH
The karyogram of generated reporter hESC lines was analyzed on metaphase
spreads
by G-banding (Institut fiir Medizinishche Genetik und Angewandte Genomik,
Universitatsklinikum Tubingen). All hESC lines used in this study harbor a
normal
karyotype. Additionally, acquired copy number variants (CNVs) and loss-of-
heterozygosity
regions (LOH) were assessed by aCGH (Cell Line Genetics). A variety of CNVs
and LOH
within and outside of normal range were identified (FIG. 2), but none that are
expected to
influence the outcomes of competitive interactions between the clones.
Derivation of hGPCs from reporter WT and HD hESCs
Human GPCs were derived from both reporter WT and HD hESCs using applicants'
well-established protocol (Wang et al., Cell Stem Cell 12, 252-264. which is
hereby
79
CA 03234809 2024-4- 11
WO 2023/069979
PCT/US2022/078344
UR 6-22023 /FR: 161118.03801 &03802
incorporated by reference in its entirety), with minor modifications to the
embryoid body
(EB) generation step. Details on the EB generation step are included in the
supplementary
information. Cells were collected for xenotransplantation between 150 and 200
DIV, at which
time the cultures derived from both WT-mCherry and HD-EGFP hESCs were rich in
PDGFRe/CD44+ bipotential glial progenitor cells. A detailed characterization
of the
generated cultures by flow cytometry and immunocytochemistry can be found in
FIG. 3 and
FIGs. 18A and 18B.
Cell preparation/or xenotransplantation
To prepare cells for xenotransplantation, glial cultures were collected in
Ca2'/Mg2t
free Hanks' balanced salt solution (HBSS (-/-); THERMOFISHER, cat. no.
14170112),
mechanically dissociated to small clusters by gentle pipetting and counted
with a
hemocytometer. The cell suspension was then spun and resuspended in cold HBSS
(-/-) at a
final concentration of 105 cells/nL and kept on ice until transplanted.
Hosts and xenotransplantation paradigms
In vivo modelling of human glial striatal repopulation: To generate human-
mouse
chimeras harboring mHtt-expressing human glia (HD chimeras), newborn
immunocompromised Ragl(-/-) pups (Mombaerts, P. et al, Cell 68, 869--877.
10.1016/0092-
8674(92)90030-g, which is hereby incorporated by reference in its entirety)
were
cryoanesthetized, secured in a custom baked clay stage, and injected
bilaterally with 100,000
ID-EGFP glia (50,000 per hemisphere) into the presumptive striatum within 48h
from birth.
Cells were delivered using a 10 L syringe (HAMILTON, cat. no. 7653-01) with
pulled glass
pipettes at a depth of 1.2 to 1.4 mm. The pups were then returned to their
mother, until
weaned. To model human glial striatal repopulation, 36 weeks old HD chimeras
were
anesthetized by ketamine/xylazine and secured in a stereotaxic frame. 200,000
WT glia were
delivered bilaterally using a 10 uL syringe and metal needle into the
humanized striatum (AP:
+ 0.8 mm; ML: 1.8 mm; DV: -2.5 to -2.8 mm). To minimize damage, cells were
infused at
a controlled rate of 175 nL/min using a controlled micropump system (World
Precision
Instruments). Backflow was prevented by leaving the needle in place for an
additional 5 min.
Experimental animals were compared to HD chimeric littermates that did not
receive WT glia
and to non-chimeric Ragl mice
that received WT glia at 36 weeks of age following this
exact procedure.
CA 03234809 2024-4- 11
WO 2023/069979
PCT/US2022/078344
UR 6-22023 /FR: 161118.03801 &03802
Neonatal stria/al co-engraftments
To model the cell-intrinsic effects of mHtt-expression on the outcomes of
competition
between human glia, newborn Ragl("/") mice were injected following the same
neonatal
striatal xenotransplant protocol above described, but instead a total of
200,000 human glia
(100,000 per hemisphere) composed of a 1:1 mixture of glia derived from WT-
mCherry and
HD-EGFP hESCs were delivered. Control littermates received injections composed
of either
WT-mCherry or HD-EGFP human glia.
Aseptic technique was used for all xenotransplants. All mice were housed in a
pathogen-free environment, with ad libitum access to food and water, and all
procedures were
performed in agreement with protocols approved by the University of Rochester
Committee
on Animal Resources.
Tissue processing
Experimental animals were perfused with HBSS (-/-) followed by 4% PFA. The
brains
were removed, post-fixed for 2h in 4% PFA and rinsed 3x with PBS. They were
then
incubated in 30% sucrose solution (SIGMA-ALDRICH, cat. no. S9378) until
equilibrated at
which point, they were embedded in OCT in a sagittal orientation (Sakura, cat.
no. 4583),
frozen in 2-methylbutane (Fisher Scientific, cat. no. 11914421) at
temperatures between -60
and -70 C and transferred to a -80 C freezer. The resulting blocks were then
cut in 20 pm
sections on a CM1950 cryostat (Leica), serially collected on adhesion slides
and stored at -
20 C until further use.
Immimostaining
Phenotyping of human cells was accomplished by immunostaining for their
respective
fluorescent reporter, together with a specific phenotype marker: Olig2
(oligodendrocyte
transcription factor, marking GPCs) and GFAP (glial fibrillary acidic protein,
marking
astrocytes). Fluorescent reporters were used as makers for human cells as
their expression
remained ubiquitous throughout the animal's life (FIG. 4). In animals that
received a 1:1
mixture of WT-mCherry and WT-untagged human glia, the latter were identified
by the
expression of human nuclear antigen and the lack of fluorescent reporter
expression. To
immunolabel, sections were rehydrated with PBS, then permeabilized and blocked
using a
permeabilization/blocking buffer (PBS + 0.1% Triton-X (SIGMA-ALDRICH cat. no.
18787)
+ 10% Normal Goat Serum (THERMOFISHER, cat. no. 16210072)) for 2h. Sections
were
then incubated overnight with primary antibodies targeting phenotypic makers
at 4 C. The
81
CA 03234809 2024-4- 11
WO 2023/069979
PCT/US2022/078344
UR 6-22023 /FR: 161118.03801 &03802
following day, the primary antibodies were thoroughly rinsed from the sections
with PBS and
secondary antibodies were applied to the sections for lh. After thoroughly
rinsing out the
secondary antibodies with PBS, a second round of primary antibodies, this time
against
fluorescent reporters, were applied to the sections overnight at 4 C. These
were rinsed with
PBS the following day and the sections were incubated with secondary
antibodies for lh. The
slides were again thoroughly washed with PBS and mounted with VECTASHIELD
VIBRANCE (Vector Labs, cat. no. H-1800).
Xenotranspkint mapping and 3D reconstruction
To map human cell distribution within the murine striatum, whole brain
montages of
15 equidistantly spaced 160 !um apart sagittal sections spanning the entire
striatum were
captured using a NIKON NI-E ECLIPSE microscope equipped with a DS-Fil camera
at 10x
magnification and processed in the NIS-Elements imaging software (NIKON). The
striatum
within each section was outlined and immunolabeled human cells were identified
and
mapped within the outlined striatum using the Stereo Investigator software
(MICROBRIGHTFIELD Bioscience) When applicable, the injection site for WT glia
was
mapped as a reference point for further volumetric quantification of human
cell distribution.
Mapped sections were then aligned using the lateral ventricle as a reference
to produce a 3D
reconstructed model of the humanized murine striatum. After 3D reconstruction,
the cartesian
coordinates for each human cell marker, injection site and striatal outlines
were exported for
further analysis.
To assess the distribution and proportion of proliferative cells in each human
cell
population within the striatum, immunolabeled human cells expressing Ki67 were
mapped in
every third section of the 15 sections when performing the 3D reconstructions.
Volumetric Quantification
To quantify the spatial distribution of HD glia in HD chimeras, the volumes
for each
quantified striatal section were calculated by multiplying the section
thickness (20 p,m) by the
section area. The cell density for each section was then calculated by
dividing the number of
marked cells in each section by their respective volume.
To quantify the spatial-temporal dynamics of competing WT and HD glia, a
program
was developed to calculate the volumetric distribution of each cell population
as a function of
distance to the WT glia delivery site in 3D reconstructed datasets (FIG. 4).
To that end, each
quantified section was given an upper and lower boundary ziozI, by
representing the striatal
82
CA 03234809 2024-4- 11
WO 2023/069979
PCT/US2022/078344
UR 6-22023 /FR: 161118.03801 &03802
outline as two identical polygons separated from each other by the section
thickness (20 tun).
Then, since the depth-wise location of each cell marker within each individual
section is
unknown, marked cells within each section were represented as uniform point
probability
functions with constant probability across the section. I.e., each cell marker
in a section from
zi to z" has a probability function:
1
______________________ zi z <Z.
P(z) -
0, otherwise
The spatial distribution of each cell population was then measured by counting
the
number of marked cells within concentric spherical shells radiating from the
WT glia
delivery site in radial increments of 125 1.t.m (For control HD chimeras, an
average of the
coordinates of the WT glia delivery site was used). Marked cells were counted
if their
respective representative line segments are fully inside, fully outside or
intersecting the
spherical shell at either the upper or lower boundary. The density of each
cell population
- where a,b represents the minimum and maximum radii of the spherical shell -
was then
calculated by dividing number of marked cells within the spherical shell by
the combined
section volume within the shell:
N a ,b
P cz,b
/v ,b
where N",b is the sum of integrated point probability functions over each
section for
each point and Ia m is the combined section volume within the spherical shell.
Subsequent
analyses were restricted to a 2 mm spherical radius. The code was implemented
in Python 3.8
and the package Shapely 1.7 to represent polygons and calculate circle
intersections of the
polygons.
Stereological estimations and phenotyping
Estimations of the total amount of human cells and their respective
phenotyping were
performed stereologically using the optical fractionator method (West, M.J.
(1999). Trends in
Neurosciences 22, 51--61, which is hereby incorporated by reference in its
entirety)in 5
equidistantly separated 480 m apart sections spanning the entire striatum.
First, whole
striatum 7-stacked montages were captured using a Nikon Ni -F, Eclipse
microscope equipped
with a DS-Fi1 camera at 20x magnification and processed in the NIS-Elements
imaging
software (Nikon). Each z-stack tile was captured using a 0.9 nm step size. The
montages
83
CA 03234809 2024-4- 11
WO 2023/069979
PCT/US2022/078344
UR 6-22023 /FR: 161118.03801 &03802
were then loaded onto StereoInvestigator and outlines of the striatum were
defined. A set of
200 x 200 m counting frames was placed by the software in a systematic random
fashion
within a 400 x 400 um grid covering the outlined striatum of each section.
Counting was
performed in the entire section height (without guard zones) and cells were
counted based on
their immunolabelling in the optical section in which they first came into
focus.
Statistical analysis and reproducibility
Samples exhibiting artifacts related to technical issues from experimental
procedures
¨ such as mistargeted injections, overt surgical damage, or injections into
gliotic foci ¨ were
excluded from this study. Statistical tests were performed using GraphPad
Prism 9. For
comparisons between more than two groups, one-way analysis of variance
(Tukey's multiple
comparison test) was applied . For comparisons between two groups with more
than two
factors, two-way analysis of variance (S'idak's multiple comparison test) was
applied. When
comparing between two matched groups, paired two-tailed t-tests were applied
for normally
distributed data sets, while for unmatched groups, unpaired two-tailed t-tests
were applied.
Significance was defined as P < 0.05. Respective P values were stated in the
figures whenever
possible, otherwise, **** P<0.0001, *** P<0.001, **P<0.01, *P<0.05. The number
of
replicates is indicated in the figure legends, with n denoting the number of
independent
experiments. Data are represented as the mean standard error of mean
(s.e.m).
Apoptosis assay
Identification of apoptotic cells within human cell populations was
accomplished by
terminal deoxynucl eoti dyl transferase-dUTP nick end labeling (TUNEL)
together with
immunostaining for their respective fluorescent reporters. TUNEL was performed
using the
Click-iT TUNEL Alexa Fluor 647 Imaging Assay (Invitrogen, cat. no. C10247)
following
manufacturer's instructions with the exception that samples were incubated in
Proteinase K
solution for 20 minutes at room temperature. To confirm efficient TUNEL
staining in fixed-
frozen brain cryosections, positive control sections were treated with DNase I
following
manufacturer's instructions. Following TUNEL, sections were immunol ab el ed
for fluorescent
reporters following the previously described immunostaining protocol.
Quantification of TUNEL + human cells
To assess the distribution and proportion of apoptotic cells within each human
cell
pool, whole striatal montages of 5 equidistantly spaced, 480 tm apart,
sagittal sections
spanning the entire striatum were captured using a Nikon Ni-E Eclipse
microscope equipped
84
CA 03234809 2024-4- 11
WO 2023/069979
PCT/US2022/078344
UR 6-22023 /FR: 161118.03801 &03802
with a DS-Fi3 camera, at 10x magnification and stitched in the NIS-Elements
imaging
software. The striatum was outlined within each section, and immunolabeled
human cells
identified and mapped based on their TUNEL labelling within the outlined
striatum using
Stereo Investigator.
Representative images showing whole humanized striata were generated from
previously acquired whole brain montages using the 'crop' function and
adjusting the
`min/max' levels in NIS-Elements imaging software. Representative images of
human glial
competitive interfaces were then captured as large field z-stacked montages,
using a Nikon
Ti-E C2+ confocal microscope equipped with 488nm, 561m and 640nm laser lines,
and a
standard PMT detector. Images were captured at 40x or 60x magnification with
oil-
immersion objectives and stitched in NIS-Elements. Maximum intensity
projections were
then generated, and the `min/max' levels adjusted in NIS-Elements. Similarly,
representative
images of human cell phenotype were captured, imaged, and processed as z-
stacks using the
Nikon Ti-E C2+ confocal and the same laser lines.
Fluorescence activated cell sorting (TA CS) of human glia from chimeric mice
To isolate human cells for scRNA-seq, experimental chimeras were perfused
intracardially with HBSS, their striata dissected and tissue dissociated as
previously described
(Mariani, J. N., Zou, L. & Goldman, S. A. in Oligodendrocytes. Methods in
Molecular
Biology Vol. 1936 (eds David Lyons & Linde Kegel) 311--331 (Humana Press,
2019), and
as illustrated in FIG. 24A. Single cell suspensions were isolated based on
their expression of
mCherry, EGFP, or their absence, using a BD FACSAria Fusion (BD Biosciences).
To
exclude dead cells, 4',6-diamidino-2-phenylindole (DAPI; ThermoFisher cat. no.
D1306) was
added at 1 lug/m1. The gating strategy is shown in FIG. 24B.
Single-cell RNA sequencing analysis
Primary data acquisition Isolated cells were captured for scRNA-seq on a 10X
Genomics chromium controller (v3.1 chemistry). Libraries were generated
according to
manufacturer's instructions and sequenced on an Illumina NovaSeq 6000 at the
University of
Rochester Genomics Center. scRNA-seq libraries were aligned with STARsolo
using a
custom two-pass strategy. First, an annotated chimeric GRCh38 and GRCm38
reference was
generated using Ensembl 102 human and mouse annotations, with the addition of
mCherry
and EGFP. STARsolo was then run with parameters: twopassMode=basic,
limitSjdbInsertNsj=3000000, and soloUMIfiltering= MultiGeneUMI. BAM files were
then
CA 03234809 2024-4- 11
WO 2023/069979
PCT/US2022/078344
UR 6-22023 /FR: 161118.03801 &03802
split by species, and cross-species multimapping reads were assigned to both
human or
mouse BAMs. FASTQ files were re-generated from either the mouse or human BAM
files
and re-aligned to a single species reference.
Differential expression analysis Human data were imported into R using Seurat.
Cells were filtered (Unique genes >250 and percent mitochondrial genes <15).
Cells were
then further filtered for expression of mCherry or EGFP. Counts were imported
into Python
for integration using scvi where the 4,000 most variable features were used.
The model was
trained for integration using the mouse sample and cell line in addition to
the number of
unique genes and percent mitochondria] gene expression. The latent
representation was then
used for dimensionality reduction via UMAP and Louvain community detection.
Smaller
populations of cells were classified into six major types of glia based on
marker expression.
Data were then re-imported into Seurat, and differential expression was
carried out using
MAST. Genes were considered for differential expression if their expression
was detected in
at least 3% of all GPCs. The model design for differential expression utilized
the number of
unique genes in a cell and the experimental group (cell line/age of the cell,
and if the cell was
in the presence or absence of an opposing clone). Significance for
differential expression was
P<0.05, with a 1og2-fold change of at least 0.15. Ingenuity Pathway Analysis
(QIAGEN) was
using for functional analysis of each differentially expressed gene list.
Cell cycle analysis G2M scores of each experimental group were calculated
using
Seurat's CellCycleScoring function. Statistical comparisons between each
model's
experimental groups were then calculated using Dunn tests with Benjamini-
Hochberg
multiple comparison adjustments.
Identification of transcription factor-associated regulons Genes were first
filtered
to retain only those that expressed at least 3 counts in at least 1% of the
cells. All 9,579 cells
were used in this analysis. The filtered raw matrix was then used as input for
the standard
pipeline of pySCENIC to identify each transcription factor and its putative
downstream
targets in the data set. These gene sets are referred to as regulons and are
assigned "Area
Under the Curve" (AUC) values to represent their activities in each cell, with
higher values
indicating a stronger enrichment of such regulon. The resulting AUC matrix
were then used
to look for important transcription factors. Within the GPC subpopulation in
both the isograft
and allograft models, 1 was assigned to cells from the young WT samples, and 0
to cells from
the aged WT or aged HD samples. Lasso logistic regression was then performed
on
86
CA 03234809 2024-4- 11
WO 2023/069979
PCT/US2022/078344
UR 6-22023 /FR: 161118.03801 &03802
predetermined 0/1 outcome with all TF's AUCs as predictor using glinnet.
Lambda for
logistic regression was automatically defined with ev.glmnet.
Inventors isolated TFs with positive coefficients, and further filtered based
on their
mean activity per group, such that TF mean activity in the young WT should be
higher than
that in the aged counterpart. The final step was to perform gene set
enrichment analysis
(GSEA) on regulons identified thus far, to determine if they were enriched for
differentially
upregulated genes in young WT cells compared to aged HD and WT cells (adjusted
P<10-2,
NES>0).
Identification of co-expressed gene sets with competitive advantage Inventors
filtered to exclude genes with fewer than 1 count across all cells, and used
the resulting
matrix to denoise data with DCA. Weighted gene co-expression network analysis
(WGCNA)
was performed on denoised data of the GPC subset. A signed network adjacency
was
calculated with soft thresholding power of 9. Modules were detected after
hierarchical
clustering of genes on topological overlap matrix-based dissimilarity and
dynamic tree cut.
Inventors then identified modules whose gene members represented a significant
overlap
with the important TF targets identified above, using GeneOverlap (adjusted
P<102). The
relative contribution of the linearly-independent covariates age (young, aged)
and genotype
(HD, WT) towards the additive explanation for each module eigengene (e.g., ME
¨ age +
genotype) was calculated by the lmg method, implemented in the relaimpo
package.
Network representation: Functional annotation of transcription factors' gene
targets
was performed with IPA. To create a representative network, inventors focused
on the MYC
regulon and its shared targets with other important TFs. Networks were
constructed with
Cytoscape.
Enibryoid Body (EB) generation
To generate uniform EBs, hESCs were dissociated to small clusters with ReLeSR,
harvested, and counted with the automated cell counter NucleoCounter NC-200 A
total of
3 < 106 hESCs were added per well of a AGGREWELL-800 plate (StemCell
Technologies,
cat. no. 34815) and centrifuged to aggregate the hESCs in the individual
microwells.
Aggregated hESCs were cultured overnight with mTeSR1 supplemented with 10 um Y-
27632 to allow for EB formation. 24h following aggregation, EBs were released
from each
microvvell by gently pipetting medium in each well using a P1000 pipette with
a cut tip and
transferred into ultra-low attachment tissue culture flasks (Corning, cat. no.
3815) for further
87
CA 03234809 2024-4- 11
WO 2023/069979
PCT/US2022/078344
UR 6-22023 /FR: 161118.03801 &03802
directed differentiation. Prior to aggregation, the AGGREWELL-800 plates were
prepared
according to the manufacturer's guideline.
Plow cytometry of hESC-derived glial cultures
Glial cultures were collected as a single cell suspension following 5 min
dissociation
in Accutase, counted with a hemocytometer, and resuspended at 106 cell/ml in
M1LTENYI
wash buffer (MWB; PBS + 0.5% BSA Fraction V (ThermoFisher cat. no. 15260037) +
2 [tM
EDTA (ThermoFisher cat. no. 15575020)). Each cell suspension was then
incubated in MWB
for 15 mins at 4 C to block non-specific antibody binding and divided in 100
FL fractions for
immunolabelling. Each fraction was then incubated with fluorophore-conjugated
antibodies
for 15 min at 4 C, except for the unstained gating controls. Antibody sources
and
concentrations are listed in the table below.
Type Antigen Host Species Dilution Manufacturer
Catalog Number
Primary Olig2 Mouse 1:200 MILLIPORE
MABN50
Primary liGFAP Mouse 1:200 BIOLEGEND
SMI-21
Primary liN Mouse 1:200 ABCAM
ab254080
Primary Ki67 Rabbit 1:200 INVITROGEN
MA5-14520
Primary EGFP Chicken 1:500 INVITROGEN
A10262
Primary mCherry Rat 1:500 INVITROGEN
M11217
CELL
Primary PDGFRa Rabbit 1:200
5241S
SIGNALLING
Primary Oct-4 Mouse 1:100 MILLIPORE
MAB4401
Rat IgG (H+L) - Alexa
Secondary Goat 1:400 INVITROGEN A-11077
Flour 568
Chicken IgY (H+L) -
Secondary Goat 1:400 INVITROGEN A32931
Alexa Flour Plus 488
Rabbit IgG (H+L) -
Secondary Goat 1:400 INVITROGEN A32733
Alexa Fluor Plus 647
Mouse IgG (H+L) -
Secondary Goat 1:400 INVITROGEN A32728
Alcxa Fluor Plus 647
Conjugated CD140a-FITC Mouse 1:10 BD HORIZON
564594
BD
Conjugated CD140a -PE Mouse
1:10 PHARMINGEN
556002
MIL IhNYI
Conjugated CD44-APC Mouse 1:500
BIOTEC
130-113-331
MIL IENYI
Conjugated A2B5-APC Mouse
1:50 BTOTEC
130-093-582
Cells were then washed with MWB, spun for 10 min at 200 x g, resuspended in
MWB, and strained into 5 ml polystyrene tubes with 35 [tm cell-strainer caps
(Corning, cat.
no. 352235). To exclude dead cells, 4',6-diamidino-2-phenylindole (DAN;
ThermoFisher cat.
no. D1306) was added at 1 litg/mL. Flow cytometry analysis of glial cultures
was then
performed on a CYTOFLEX S platform (Beckman Coulter), and the data analyzed
with the
88
CA 03234809 2024-4- 11
WO 2023/069979
PCT/US2022/078344
UR 6-22023 /FR: 161118.03801 &03802
CYTEXPERT (Beckman Coulter) and FLOWJO (BD Biosciences) software. Gating
strategy
and data analysis are exemplified in FIG. 18.
Immunocytochemistry of hESC and glial cultures
Cultures were fixed with 4% paraformaldehyde (PFA) for 7 mins, washed with
phosphate-buffered saline (PBS) and then permeabilized and blocked with
permeabilization/block buffer (PBS + 0.1% Triton-X (Sigma-Aldrich cat. no.
18787) + 1%
BSA Fraction V) for lh. Cultures were then incubated overnight with primary
antibodies at
4 C, washed with PBS, and then incubated with secondary antibodies at room
temperature for
2h. Antibody sources and concentrations are listed in the table above. Nuclear
counterstain
was then performed by incubating with 1 1..tg/mL DAPI for 5 mills at room
temperature, and
then washed with PBS an additional 3 times prior to imaging.
Representative images of hESCs were acquired on a Nikon Eclipse Ti microscope
equipped with a DS-Fi3 camera at 1 Ox magnification while representative
images of glial
cultures were captured with a DS-Qi2 camera at 20x magnification, and min/max'
levels
were adjusted for both in NIS-Elements imaging software (Nikon).
Mapped cell counting and section volume estimation (Volumetric Quantification)
As previously mentioned in the methods section, mapped cells are counted as 1
if
their respective representative line segments are fully inside, 0 if they are
fully outside, and
partially if they are intersecting the radiating spherical shell. To that end,
inventors calculate
the points on the surface of the radiating spherical shells corresponding to
the projection of
mapped cells onto the spherical shell. Inventors here consider only the
calculation of points
above the injection site since points below are similarly handled. The
corresponding points on
the spherical shell are given by:
gd(r) = d
where r is either a or 6, depending on the if the shell intersects the point
at the outer or
inner surface. If zi > (b), the point is outside the shell and thus not
counted, if
the shell has passed beyond the point and it is not counted. If zd (a) 7,, and
z(b) > zi, the
line segment is completely within the spherical shell and it is counted as 1
Additionally,
inventors may have the two limiting cases where the spherical shell intersects
the line
segment. These two examples are similar, so inventors deal only with the case
where the line
segment intersects the upper surface of the spherical shell. That is, the case
where zd (a) >
and zõ. < z(h) < z1, In this case, the part of the line segment inside the
spherical shell has
89
CA 03234809 2024-4- 11
WO 2023/069979
PCT/US2022/078344
UR 6-22023 /FR: 161118.03801 &03802
length zõ ¨ z,- (b) and the mapped cell was counted by integrating its point
probability
function as:
(zu zd1b1)f
w
where w is the width of the section.
To calculate the corresponding section volume within which mapped cells were
counted, inventors first triangulate each polygon representing the anatomical
boundary of
each section. Inventors then form a prism from the triangles with height
matching the section
thickness. Inventors represented each prism as 3 tetrahedra and measure to
cumulative
volume inside the sphere as the total overlap volume between the sphere of
radius r and each
tetrahedra.
For a section with depth coordinate z, each triangle is represented by 3
points
v2, v3 with coordinates (xi,yi:z?), (x2, y2, z.f ), and (x,õ y3,z11). These
triangles together
make a 2D representation of the domain. To get a 3D representation of each
section,
inventors used the known thickness of dz (here 20 nm) and thicken the triangle
into a prism
shape with 3 new points wl,w2,14,3 translated perpendicular the section plane
by dz upon the
upper boundary of the section at coordinates (xi, yi,z,;), (x2, y2, zu _), and
(x2, yg=zu).
Calculating the exact overlap volume of a 3D polygon and a sphere is not
trivial, but
inventors can calculate the overlap volume of spheres and tetrahedra. To that
end, inventors
covered each prism domain by 3 tetrahedra given by the coordinate sets .(vi,
v2, v3, wL),
(v2, v,, wiõw,), and rw w2,14,,). Given a sphere of radius r, the intersecting
volume of each
section with the sphere is then given by the sum over the volume of the
intersection of a
sphere S of radius r and each tetrahedra T:
V(r) ='SrflT
Example Al -- Generation of distinctly color-tagged human glia from WT and
HD hLSCs
To assess the ability of healthy glia to replace their diseased counterparts
in vivo,
inventors first generated fluorophore-tagged reporter lines of WT and HD human
embryonic
stem cells (hESC), so as to enable the production of spectrally-distinct GPCs
of each
genotype, whose growth in vivo could then be independently monitored. A CRISPR-
Cas9-
mediated knock-in strategy (Oceguera-Yanez, F. et al. Methods 101, 43--55
(2016)) was first
used to integrate EGFP and mCherry reporter cassettes into the AAVS1 locus of
matched,
female sibling wild-type (WT, GENEA019) and mHtt-expressing
GENEA020) hESCs
CA 03234809 2024-4- 11
WO 2023/069979
PCT/US2022/078344
UR 6-22023 /FR: 161118.03801 &03802
(Dumevska, B. et al. Stem Cell Research 16, 430--433 (2016) and Dumevska, B.
et al. Stem
Cell Research 16, 397--400 (2016)) (FIG. 1). Inventors then verified that the
reporter
cassettes stably integrated into each of these clones (FIG. 1D), and that
editing did not
influence the self-renewal, pluripotency, or karyotypic stability of the
tagged hESCs (FIGs.
1E and 2A). From these tagged and spectrally-distinct lines, inventors used a
previously
described differentiation protocol (Benraiss, A. et al. Nature Communications
7, 11758
(2016)) to produce color-coded human glial progenitor cells (hGPCs) from each
line, whose
behaviors in vivo could be compared, both alone and in competition. Inventors
validated the
ability of each line to maintain EGFP or mCherry expression after maturation
as astrocytes or
oligodendrocytes, and their lack of any significant differentially-expressed
oncogenic
mutations, or copy number variants (CNVs) that could bias growth (FIGs. 2B and
2C);
inventors also verified that both the WT and mHTT-expressing hGPCs, when
injected alone,
colonized the murine host brains (FIGs. 15 and 6).
Inventors then differentiated both WT-mCherry and HD-EGFP hESCs using a
established protocol for generating hGPCs (Wang, S. et al. Cell Stem Cell 12,
252--264
(2013)) and assessed both their capacity to differentiate into glia and the
stability of their
reporter expression upon acquisition of glial fate (FIG. 3). By 150 days in
vitro (DIV), glial
cultures derived from both WT-mCherry and HD-EGFP were equally enriched for
PDGFRe/CD44+ bipotential GPCs (P=0.78), comprising around half of the cells in
the
cultures, with the rest being immature A2B5+ GPCs and PDGFIta."/CD44+
astrocytes and
their progenitors (FIG. 3 and FIG. 18). Importantly, virtually all immune-
phenotyped cells
derived from WT-mCherry and HD-EGFP hESCs ¨ including mature astrocytes as
well as
GPCs ¨ continued to express their respective fluorescent reporter, indicating
that transgene
expression remained stable upon acquisition of terminal glial identity (Fig.
3D).
Example A2--Establishment of Human HD Glial Chimeric Mice
Murine chimeras with striata substantially humanized by 1-1D glia (HD
chimeras, FIG
15) were generated to provide an in vivo model by which to assess the
replacement of
diseased human glia by their healthy counterparts. hGPCs derived from mHtt-
expressing
hESCs engineered to express EGFP (FIG. 1, FIG. 2, and FIG. 3; henceforth
designated as
HD) were implanted into the neostriatum of immunocompromised Ragl(-/-) mice
and
monitored their expansion histologically (FIG. 15A).
Following implantation, HD glia rapidly infiltrated the murine striatum,
migrating and
expanding firstly within the striatal white matter tracts (FIG. 15B).
Gradually, these cells
91
CA 03234809 2024-4- 11
WO 2023/069979
PCT/US2022/078344
UR 6-22023 /FR: 161118.03801 &03802
expanded outwards, progressively displacing their murine counterparts from the
striatal
neuropil, so that by 36 weeks, the murine striatum was substantially humanized
by HD glia
(FIG. 15B, 15F, and 15G). The advance of HD glia was driven by their mitotic
expansion,
with their total number doubling between 12 and 36 weeks (FIG. 15C; P=0.0032).
Inversely,
as they expanded and matured within their newly established domains, their
proliferative cell
pool (Ki67 ) was progressively depleted (FIG. 15D, and I; P=0.0036), slowing
their
expansion rate over time.
Most of the HD glia expanded as Olig2+ GPCs (72.7 1.9%), which persisted as
the
new resident pool after replacing their murine counterparts. A fraction of
these (4.8 0.9%)
further differentiated into GFAP+ astrocytes (FIG. 151 and 15J). Astrocytic
differentiation
was mostly observed within striatal white matter tracts. These sick astrocytes
lacked the
structural complexity typically observed in healthy counterparts and displayed
abnormal fiber
architecture, as previously reported(FIG. 15J; Osipovitch, M. et al., "Human
ESC-Derived
Chimeric Mouse Models of Huntington's Disease Reveal Cell-Intrinsic Defects in
Glial
Progenitor Cell Differentiation," Cell Stem Cell 24: 107-122 (2019), which is
hereby
incorporated by reference in its entirety).
Example A3--Healthy WT hGPCs Infiltrate the HD Chimeric Adult Striatum
and Outcompete Resident Glia
The established chimeras whose striatal glia are largely mHTT-expressing and
human
were used to determine how the resident HD human glia might respond to the
introduction of
healthy hGPCs and whether the resident glial populations might to some extent
be replaced.
hGPCs derived from WT hESCs engineered to express mCherry (FIG. 1, FIG. 2, and
FIG. 3;
henceforth designated as WT) were engrafted into the striatum of 36 weeks old
HD chimeras
and monitored for expansion using histology as they competed for striatal
domination (FIG.
5).
Following engraftrnent, WT glia pervaded the previously humanized striatum,
gradually displacing their HD counterparts as they expanded from their
implantation site
(FIG. 4). This process was slow but sustained, over time yielding substantial
repopulation of
the HD striatum (FIG. 4; 54 weeks, p<0.0001; 72 weeks, p<0.0001). Remarkably,
the
expansion of WT glia was paralleled by a concurrent elimination of HD glia
from the tissue
(as opposed to their spatial relocation) (FIG. 4; 54 weeks ¨ P<0.0001, 72
weeks ¨ P<0.0001),
and was typically characterized by a discrete advancing front behind which
almost no HD
glia could be found (FIG. 4).
92
CA 03234809 2024-4- 11
WO 2023/069979
PCT/US2022/078344
UR 6-22023 /FR: 161118.03801 &03802
Mutually exclusive domains formed in the wake of competition between Olig2+
GPCs
(FIG. 4). These comprised most of the WT glial population (80.1 4.7% at 72
weeks), which
persisted as the new resident GPC pool after replacing their HD counterparts.
Their potential
to generate astroglia was maintained, as a fraction of these (4.0 1.5% at 72
weeks) further
differentiated into GFAP astrocytes (FIG. 6) within their newly established
domains.
Curiously, within regions dominated by WT glia, HD astrocytes (GFAP+)
lingered, primarily
within white matter tracts (FIG. 4). Nonetheless, the overall ratio between
Olig2+ and GFAP
glia remained stable throughout the experiment in both populations (FIG. 6)
indicating that
while GPC replacement precedes astrocyti c replacement, proportional
phenotypic
repopulation is achieved overtime.
Interestingly, human-human glial replacement developed at a slower rate than
human-
murine glial replacement, as WT hGPCs implanted into naive adult Ragl(') mice
expanded
throughout the host striatum more broadly than those grafted into neonatally-
chimerized
adult Rag 1(') mice (FIG. 7; 54 weeks: P=0.14, 72 weeks: P=0.0009). These
results indicate
that competitive glial replacement develops with species-specific kinetics
that differ between
xenogeneic and allogeneic grafts.
These results were not an artifact of off-target effects derived from gene
editing nor
fluorescent reporter expression toxicity, as co-engrafted hGPCs derived from
WT-mCherry
and their unmodified counterparts (WT-untagged) (FIG. 8), expanded equally
within the
striatum of HD chimeras and yielded analogous glial repopulation (FIG. 9 and
FIG. 10; 54
Weeks ¨ P=0.5227 - 72 Weeks ¨ P=0.1251). As such, analysis done in (FIG. 4)
and (FIG. 6
and FIG. 7) reports samples from both experimental paradigms. Remarkably,
while WT and
glia strongly segregated from each other, the two isogenic clones of WT glia
could be
found admixing (FIG. 9), indicating that active recognition precedes
competitive elimination
of HD glia from the tissue.
Example A4--Human WT Glia Enjoy a Proliferative Advantage Relative to
Resident HD Glia
Striatal humanization by HD glia progressed with a gradual exhaustion of their
proliferative cell pool as they expanded and matured within the tissue (Fig.
15D). Therefore,
whether the selective expansion of younger WT glia within the HD striatum was
sustained by
a difference in proliferative capacity between the two populations was tested.
The temporal
expression of Ki67 in both WT and HD glial populations was assessed as
competitive striatal
repopulation unfolded.
93
CA 03234809 2024-4- 11
WO 2023/069979
PCT/US2022/078344
UR 6-22023 /FR: 161118.03801 &03802
At both 54 and 72 weeks of age, the mitotic fraction of implanted WT glia was
significantly larger than that of resident HD glia (FIGs. 16A-C; 54 weeks ¨
P<0.0001, 72
weeks ¨ P=0.0120). These data indicate that the repopulation of the HD
striatum by WT glia
was fueled by a relatively enriched proliferative cell pool. It's important to
note that while
this proliferative advantage became less pronounced as the cells aged, it was
maintained
throughout the experiment. With this in mind, the sustained proliferative
advantage of
implanted WT glia over their HD counterparts, should provide a driving force
for continuous
striatal repopulation beyond the observed experimental timepoints (FIGs. 16A-
16C).
Discussion of Examples Al-A4:
The striata of human glial chimeric mice harboring HD-derived glia are
repopulated
by their healthy counterparts, following implantation of WT human GPCs (FIG.
4). The data
presented supra suggest that this process was driven by a recapitulation of
developmental
cell-cell competition (Amoyel, M. & Bach, E. A., Development 141: 988-1000
(2014) and
Baker, N. E., Nat Rev Genet 21, 683-697 (2020), which are hereby incorporated
by reference
in their entirety), dynamically effected in the adult brain. Such cell-cell
competition has
traditionally been defined by the active purging of relatively slowly growing
cells from the
tissue, upon their interaction with faster growing neighbors (Morata, G. &
Ripoll, P., Dev
Biol 42: 211-221 (1975), Simpson, P., De'.' Biol 69: 182-193 (1979), and
Simpson, P. &
Morata, G., Dev Biol 85, 299-308 (1981), which are hereby incorporated by
reference in their
entirety). Accordingly, WT human GPCs typically expanded from their
implantation sites in
advancing waves that, upon contact, repulsed and eliminated their hitherto
stably resident
HID-derived counterparts (FIG. 4). The expansion of WT hGPCs in this HD glial
environment was propelled by a sustained proliferative advantage on the part
of these young,
healthy GPCs, which over time yielded their extensive colonization of the host
brain.
The enrichment for MYC targets in their transcriptional signature ¨ one of the
most
well-described regulators of cell competition (Cova, C de la, et al., Cell
117. 107-116
(2004), Moreno, E. & Basler, K. Cell 117: 117-129 (2004), and Villa del Campo,
C., et al .,
Cell Reports 8: 1741-1751 (2014), which are hereby incorporated by reference
in their
entirety)¨ further indicated the conservation of this mechanism in the
elimination of HD
hGPCs. In particular, their loss paralleled a depletion of ribosomal
transcripts, matching the
transcriptional profile of putative 'loser' cells during cell competition in
the developing
mouse embryo (Lima, A. etal. Nat Metabolism 1-18 (2021), which is hereby
incorporated by
reference in its entirety) and skin (Ellis, S. J. et al. Nature 569: 497-502
(2019), which is
94
CA 03234809 2024-4- 11
WO 2023/069979
PCT/US2022/078344
UR 6-22023 /FR: 161118.03801 &03802
hereby incorporated by reference in its entirety). This observation suggests
that the
regulation of translation and protein synthesis is a determinant of cell
competition not only
during development, but also in the adult brain.
Interestingly, this process cannot be completely explained by the deleterious
effects of
mHtt-expression, since when co-engrafted, both clones contributed to the
humanization of the
mouse striatum at the time points assessed (FIG. 11, FIG. 12, FIG. 13). The
repopulation of
HD-chimeras was rather driven by the age difference between the newly
implanted, more
proliferative, WT GPCs and the more mature, relatively quiescent, resident HD
glia. This
notion parallels observations from liver rep opul ati on studies, in which
allogen ei c en graftm en t
of mouse fetal liver progenitors into older, but otherwise healthy, hosts are
associated with
faster and more extensive tissue replacement than their engraftment into
younger hosts
(Menthena, A. el ul. Gastroenterology 140: 1009-1020.e8 (2011), which is
hereby
incorporated by reference in its entirety).
As both the severity and age of onset of HD are closely correlated with CAG
repeat
length, employing cell lines harbouring mHtt with more CAG repeats might
better model its'
influence within the short lifespan of these chimeras. Regardless, the
competitive advantage
imparted by the difference in age ¨ and thus difference in mitotic competence
¨ between
resident and newly implanted GPCs, seems a significant contributor to the
replacement of the
resident pool.
The competitive replacement described here resembles that of murine glial
replacement by implanted hGPCs, as their expansion within the murine brain is
also sustained
by a relative proliferative advantage, and progresses with the elimination of
their murine
counterparts upon contact. Moreover, this competitive behaviour seems to
largely mimic
development, where successive waves of GPCs compete amongst each other, with
the oldest
being almost completely eradicated from the brain by birth and replaced by
their younger
successors. These commonalities suggest that cell-cell competition may reveal
intrinsic
developmental programs that can be re-initiated in the adult brain environment
following the
introduction of new and younger GPCs.
In broad terms, inventors' observations suggest that the brain may be a far
more
dynamic structural environment than previously recognized, with cell-cell
competition among
glial progenitor cells and their derived astrocytes as critical in adult brain
maintenance as in
development. One may readily envision that somatic mutation among glia and
their
progenitors may yield selective clonal advantage to one daughter lineage or
the other,
CA 03234809 2024-4- 11
WO 2023/069979
PCT/US2022/078344
UR 6-22023 /FR: 161118.03801 &03802
resulting in the inexorable replacement of the population by descendants of
the dominant
daughter. Such a mechanism may contribute to the accelerated disease
progression of
disorders in which genomic instability and somatic mutation may yield cells of
distinct
competitive advantages, which might then have competitive advantage over their
sibling
clones. This scenario, while typifying the onset of carcinogenesis broadly and
gliomagenesis
in the brain, may be similarly involved in the development of non-neoplastic
adult-onset
disorders in which glial cells are causally-involved, such as some childhood
onset
schizophrenias, and HD itself
This work lays the foundation for the exploitation, as well as the study, of
mechanisms underlying cell-cell competitive interactions between human glia in
vivo in a
variety of contexts. In practical terms, the present data suggest that
diseased human glia may
be replaced following the introduction of younger and healthier hGPCs. Indeed,
such glial
replacement may offer a viable strategy towards the cell-based treatment of a
variety of
neurological diseases. This study demonstrates that human glia afflicted by a
prototypic
neurodegenerative disease may be replaced in vivo by healthy counterparts
following the
implantation of healthy human GPCs. A novel humanized platform was established
that
allows one to predict the likely efficiency of human glial replacement in a
variety of disease
contexts, while simultaneously interrogating the mechanisms by which
replacement occurs.
The mechanistic insights yielded in this study may enable strategies by which
to further
enhance the speed and extent of human glial replacement following hGPC
delivery. Together,
these data highlight the potential of hGPCs as a cellular vectors for the
treatment of those
diseases of the human CNS in which glial cells are causally involved.
Example A5--Human WT glia assume a dominant competitor profile when
encountering HD glia
Having established that implanted WT hGPCs effectively colonize the HD glial
chimeric striata at the expense of the resident mHTT-expressing glia,
inventors next sought to
define the molecular signals underlying their competitive dominance. To that
end, inventors
analyzed the transcriptional profiles of WT and HD human glia isolated from
the striata of
chimeras in which the two cell populations were co-resident and competing, as
well as from
their respective controls in which one or the other was transplanted without
the other, using
single cell RNA-sequencing (scRNA-seq; 10X Genomics, v3.1 chemistry) (Fig.
20A).
Following integration of all captures and aligning against human sequence,
Louvain
community detection revealed six major populations of human glia; these
included hGPCs,
96
CA 03234809 2024-4- 11
WO 2023/069979
PCT/US2022/078344
UR 6-22023 /FR: 161118.03801 &03802
cycling hGPCs, immature oligodendrocytes (i0L), neural progenitor cells
(NPCs), astrocytes,
and their intermediate progenitors (astrocyte progenitor cells, APCs) (Figs.
20B-D). Within
these populations, cell cycle analysis predicted a higher fraction of actively
proliferating
G2/M phase cells in competing WT cells compared to their HD counterparts (Fig.
20E),
aligning with the histological observations (Fig. 19). To proceed, inventors
focused on
hGPCs as the primary competing population in inventors' model. Pairwise
differential
expression revealed discrete sets of differentially expressed genes across
groups (Fig. 20F),
and subsequent functional analysis with Ingenuity pathway analysis (IPA)
within the hGPC
population revealed numerous salient terms pertaining to their competition
(Fig. 20G).
It was found that during competition, WT GPCs activate pathways driving
protein
synthesis, whereas HD GPCs were predicted to downregulate them. Predicted
upstream
transcription factor activation identified YAP1, MYC, and MYCN ¨ conserved
master
regulators of cell growth and proliferation ¨ as significantly modulated
across experimental
groups. Importantly, inventors found YAP1 and MYC targets to be selectively
down-
regulated in competing HD GPCs relatively to their controls (Fig. 20G).
Notably, this down-
regulation was attended by a marked repression of ribosomal encoding genes
(Fig. 201).
Conversely, competing WT hGPCs showed an upregulation of both YAP 1 and MYC
targets,
as well as in the expression of ribosomal encoding genes, relative to controls
(Figs. 20G-H).
As such, these data suggest that the implanted WT hGPCs actively assumed a
competitively
dominant phenotype upon contact with their HD counterparts, to drive the
latter's local
elimination while promoting their own expansion and colonization.
Example A6--Age differences drive competitive human glial repopulation
Since WT cells transplanted into adult hosts were fundamentally younger than
the
resident host cells that they displaced and replaced, inventors next asked if
differences in cell
age, besides disease status, might have contributed to the competitive success
of the late
donor cells To that end, inventors engrafted hGPCs newly produced from WT
hESCs
engineered to express EGFP into the striata of 40 week-old adult glial
chimeras, which had
been perinatally engrafted with hGPCs derived from mCherry-tagged, otherwise
isogenic WT
hESCs (Fig. 17A). Inventors then monitored the expansion of the transplanted
cells
histologically, so as to map the relative fitness and competitive performance
of these
isogenic, but otherwise distinctly aged pools of hGPCs.
We noted that the expansion of implanted WT glia within the striatum of WT
chimeras was strikingly similar to their expansion in the striata of HD
chimeras (Fig. 4).
97
CA 03234809 2024-4- 11
WO 2023/069979
PCT/US2022/078344
UR 6-22023 /FR: 161118.03801 &03802
Following engraftment, the younger WT glia rapidly infiltrated the previously
humanized
striatum, progressively displacing their aged counterparts as they expanded
from their
implantation site, ultimately yielding substantial recolonization of the
tissue (Figs. 17B-D and
E; P<0.0001). Their expansion was paralleled by the local elimination of aged
WT glia (Figs.
17B-D and F; P<0.0001), which was also marked by a discrete advancing front,
behind which
few already-resident WT glia could be found (Fig. 17C). Accordingly, inventors
also noted
that the mitotic fraction of implanted WT glia was significantly larger than
that of their
resident aged counterparts (Figs. 17G-I; P=0.018). Together, these data
indicated that the
repopulation of the human WT glial chimeric striatum by younger isogenic hGPCs
was
attended by the replacement of the older cells by their younger counterparts,
fueled in part by
the relative expansion of the younger, more mitotically active cell
population.
Example A7--Young cells replace their older counterparts via the induction of
apoptosis
Since younger glia appeared to exert clear competitive dominance over their
older
counterparts, inventors next asked whether the elimination of the older glia
by younger cells
occurred passively, as a result of the higher proliferation rate of the
younger cells leading to
the relative attrition of the older residents during normal turnover, or
whether replacement
was actively driven by the induction of programmed cell death in the older
cells by the more
fit younger cells. To address this question, inventors used the TUNEL assay to
compare the
rates of apoptosis in aged and young WT glial populations as they competed in
the host
striatum, as well as at their respective baselines in singly-transplanted
controls. It was found
that as competitive repopulation unfolded, that aged WT glia underwent
apoptosis at a
markedly higher rate than their younger counterparts (FIGs, 23A-C; P<0.0001).
Critically,
the increased apoptosis of older, resident glia appeared to be driven by their
interaction with
younger cells, since a significantly higher proportion of aged glia was found
to be apoptotic
in chimeras transplanted as adults with younger cells, than in controls that
did not receive the
later adult injection (FIGs, 23A-C; P=0.0013). These data suggest that aged
resident glia
confronted by their younger counterparts are actively eliminated, at least in
part via apoptosis
triggered by their encounter with the younger hGPCs, whose greater relative
fitness permitted
their repopulation of the chimeric host striatum.
Example A8--Young hGPCs acquire a signature of dominance when challenged
with older isogenic cells
98
CA 03234809 2024-4- 11
WO 2023/069979
PCT/US2022/078344
UR 6-22023 /FR: 161118.03801 &03802
To ascertain if the molecular signals underlying the competitive dominance of
younger WT glia over aged WT glia are similar to those underlying their
dominance over HD
glia, inventors analyzed the transcriptional signatures of competing young and
aged WT glia
and their respective controls, using scRNA-seq (Fig. 21A). Within the
sequenced populations
(Figs. 21B-D), it was noted that the fraction of competing aged WT cells in
the G2/M phase
of the cell cycle to be markedly lower than their younger counterparts (Fig.
21E), in accord
with the histological data (Figs. 171). Differential expression analysis
revealed discrete sets of
genes differentially expressed between competing young and aged WT GPCs (Fig.
21F and
H), and subsequent IPA analysis of those gene sets revealed a signature
similar to that
observed between donor (young) WT and already-resident (aged) HD GPCs in the
competitive allograft model (Fig. 21G). In particular, genes functionally
associated with
protein synthesis, including ribosomal genes as well as upstream YAP1, MYC and
MYCN
signaling, were all activated in competing young WT GPCs relative to their
aged counterparts
(Fig. 21G). Yet despite these similarities, in other respects aged WT GPCs
responded
differently than did HD GPCs to newly implanted WT GPCs. In contrast to HD
GPCs, aged
WT cells confronted with younger isogenic competitors upregulated both YAP1
and MYC
targets relative to their non-competing controls (Fig. 21G) with a concomitant
upregulation of
ribosomal genes (Fig. 211). This difference in their profiles may represent an
intrinsic
capacity to respond competitively when challenged, which mHTT-expressing HD
hGPCs
lack. Nonetheless, this upregulation was insufficient to match the greater
fitness of their
younger counterparts, which similarly ¨ but to a relatively greater degree -
manifested the
selective upregulation of YAP1 and MYC targets, as well as ribosomal genes,
relative to their
non-competing controls (Figs. 21G-H). Together, these data indicate that the
determinants of
relative cell fitness may be conserved across different scenarios of
challenge, and that the
outcomes of the resultant competition are heavily influenced by the relative
ages of the
competing populations.
Example A9--Competitive advantage is linked to a discrete set of transcription
factors
We next asked what gene signatures would define the competitive advantage of
newly-transplanted human GPCs over resident cells. To that end, inventors
applied a multi-
stepped analysis using lasso-regulated logistic regression (Fig. 22A), that
pinpointed 5 TFs
(CEBPZ, MYBL2, MYC, NFYB, TFDP1) whose activities could significantly explain
the
dominance of young WT GPCs over both aged HD and aged WT GPCs. These 5 TFs and
99
CA 03234809 2024-4- 11
WO 2023/069979
PCT/US2022/078344
UR 6-22023 /FR: 161118.03801 &03802
their putative targets established gene sets (regulons) which were upregulated
(normalized
enrichment score [NES]> 0, adjusted p < 102) in the young WT cells, in both
the allograft
and isograft models (Fig. 22D). It was also noticed that while their
activities varied when not
in a competitive environment (aged HD, aged WT, young WT alone), their mean
activities
were higher in the dominant young WT cells in both allograft (vs HD) and
isograft (vs older
isogenic self) paradigms, especially so for MYC (Fig. 22E).
Next, inventors set out to identify cohorts of genes with defined expression
patterns,
as well as significant overlaps to the five prioritized regulons above.
Inventors first employed
weighted gene co-expression network analysis (WGCNA) to detect a total of 19
modules in
the GPC dataset (Fig. 22A). Six modules harbored genes with significant
overlap to the
targets of CEBPZ, MYBL2, MYC, NFYB, and TFDP1 (Fig. 22B). Inventors then asked
if
the expression pattern of prioritized modules could be explained by the age of
cells (young
vs. old), by their genotype (HD vs. WT), or both. WGCNA defines module
eigengene as the
first principal component of a gene cohort, representing thereby the general
expression
pattern of all genes within that module. As such, inventors built linear
models where module
eigengene was a response that was described by both age and genotype. It was
observed that
modules brown, red, and cyan were mostly influenced by age, while modules
black, blue, and
green were influenced by both age and genotype (Fig. 22C).
MYC, whose regulated pathway activation had already been inferred as
conferring
competitive advantage (Figs. 20 and 21), was also one of the five prioritized
TFs. Inventors
thus further characterized the MYC regulon and its downstream targets, and
noticed how
these downstream targets were also regulated by other prioritized TFs (Fig.
22F).
Interestingly, while MYC localized to module brown, a large proportion of its
targets
belonged to module blue. The blue module genes were similarly expressed in the
non-
competing control paradigms, but their expression levels were higher in the
young WT
compared to the aged HD in the WT vs HD allograft paradigm (Fig. 22B), a
pattern
suggesting that the blue signature was not activated unless cells were in a
competing
environment. Furthermore, inventors noted lower expression of these genes in
the aged HD
relative to the aged WT hGPCs (Figs. 22E-F), which may highlight the
intrinsically greater
capacity of WT cells to compete, congruent with earlier observation that aged
WT hGPCs
respond differently than HD hGPCs when challenged with newly-engrafted WT
GPCs.
Importantly, the blue module eigengene could be described by both genotype and
age,
demonstrating that the competitive advantage associated with MYC signaling was
driven by
100
CA 03234809 2024-4- 11
WO 2023/069979
PCT/US2022/078344
UR 6-22023 /FR: 161118.03801 &03802
both of these variables. Accordingly, the targets in this network were
enriched for pathways
regulating cell proliferation (TP53, RICTOR, YAP), gene transcription (MYCN,
MLXIPL),
and protein synthesis (LARP1), each of which had been previously noted as
differentially-
expressed in each competitive scenario (Figs. 20 and 21). As such, the output
of this
competition-triggered regulatory network appeared to confer competitive
advantage upon
young WT hGPCs when introduced into the adult brain, whether confronted by
older HID-
derived or isogenic hGPCs.
EXAMPLES - PART B Rejuvenating Glial Progenitor Cell Or A Progeny Thereof
Experimental Models and Subject Details
Human Subjects
Details on fetal and adult brain samples are detailed in the methods section
"Adult and
Fetal Brain Processing for Cell Isolation." The sex of fetal samples was not
provided during
tissue acquisition.
Cell Lines
The human iPSC line C27 was used to generate hGPCs in which predicted
transcripts
of interest were validated. The C27 line is male, and was obtained from Lorenz
Studer.
Cells were differentiated into GPCs as detailed in the methods section (see:
Human iPSC-
derived production of GPCs) (Chambers et al., 2009)
Methods Details
Adult and Fetal Brain Processing for Cell Isolation
Human brain samples were obtained under approved Institutional Review Board
protocols from consenting patients at Strong Memorial Hospital at the
University of
Rochester. Brain tissue was obtained from normal GW 18-24 cortical and/or
VZ/SVZ
dissections or adult white matter/cortex epileptic resections (18F,19M, and
27F years old for
mRNA, 8M, 20F, 43M, and 54F years old for miRNA). Fetal GPC acquisition,
dissociation
and immunomagnetic sorting of A2B5-VPSA-NCAM- cells were as described (Windrem
et
al., 2004). GPCs were isolated from dissociated tissue using a dual
immunomagnetic sorting
strategy: depleting mouse anti-PSA-NCAM+ (Millipore, DSFEB) cells, using
microbead
tagged rat anti-mouse IgM (Miltenyi Biotech), then selecting A2B5+ (clone 105;
ATCC,
Manassas, VA) cells from the PSA-NCAM" pool, as described (Windrem et al.,
2004;
Windrem et al., 2008). After sorting, cells were maintained for 1-14 days in
DMEM-F12/N1
with 10 ng/ml bFGF and 20 ng/ml PDGF-AA. Alternatively CD140a/PDGFccR-defined
101
CA 03234809 2024-4- 11
WO 2023/069979
PCT/US2022/078344
UR 6-22023 /FR: 161118.03801 &03802
GPCs were isolated and sorted using MACS as described (Sim et al., 2011b),
yielding an
enriched population of CD140 glial progenitor cells.
Bulk 1?1VA-Sequencing
RNA was purified from isolates via Qiagen RNeasy kits and bulk RNA
sequencing libraries were constructed. Samples were sequenced deeply on an
Illumina
HiSeq 2500 at the University of Rochester Genomics Research Center. Raw FASTQ
files
were trimmed and adapters removed using fastp (Chen et al., 2018) and aligned
to GRCh38
using Ensembl 95 gene annotations via STAR in 2-pass mode across all samples
(Dobin
etal., 2013) and quantified with RSEM version (Li and Dewey, 2011). Subsequent
analysis
was carried out in R (R Core Team, 2017) where RSEM gene level results were
imported via tximport (Soneson et al., 2015). DE analysis was carried out in
DESeq2
(Love et al., 2014) where paired analyses (Fetal A2B5+ vs CD140a+, fetal
CD140a+ vs
CD140a-) had paired information added to their models. For adult vs fetal DE
analysis, age
was concatenated with sort marker (CD140a- samples were not included) to
define the
group variable where sequencing batch was also added to the model to account
for
technical variability. Genes with an adjusted p-value < 0.01 and an absolute
log2-fold
change >1 were deemed significant. These data were then further filtered by
meaningful
abundance, defined as a median TPM (calculated via RSEM) of 1 in at least I
group
(20,663 genes met this criterion prior to DE),
scRNA-Seq Analysis
The fetal brain sample as processed as above for bulk ma-seq up until single
cells
were sorted via FACS for either CD140a + or PSA-NCAM-/A2B5+ surface
expression.
Single cells were then captured on a 10X genomics chromium controller
utilizing V2
chemistry and libraries generated according to manufacturer's instructions.
Samples were
sequenced on an Illumina HISEQ 2500 system. Demultiplexed samples were then
aligned
and quantified using Cell Ranger to an index generated from GRCh38 and Ensembl
95
gene annotations using only protein coding, lncRNA, or miRNA biotypes.
Analysis of
scRNA-Seq samples was carried out via Seurat (Butler et al., 2018) within R.
Both samples
were merged and low-quality cells filtered out as defined by having
mitochondrial gene
expression greater than 15% or having fewer than 500 unique genes. Samples
were then
normalized utilizing SCTRANSFORM taking care to regress out contributions due
to total
number of U1VIIs, percent mitochondrial gene content or the difference in S
phase and G2M
102
CA 03234809 2024-4- 11
WO 2023/069979
PCT/US2022/078344
UR 6-22023 /FR: 161118.03801 &03802
phase scores of each cell. PCA was then calculated, UMAP was run using the
first 30
dimensions with n.neighbors = 60 and repulsion.strength = 0.8. FindNeighbors
was then run
followed by FindClusters with resolution set to .35. Based on expression
profiles of each
cluster, some similar clusters were merged into broader cell type clusters.
Static
differential expression of clusters was computed using the MAST test (Finak et
al., 2015)
where an adjusted p-value of < 0.01 and an absolute 1og2 fold change of > 0.5
was
deemed significant. Prediction of active transcription factor regulons was
carried out with
the SCENIC package in R (Aibar et al., 2017) using the hg38 databases located
at
resources. aertsl ab. org/ci starget/. Genes were included in co-expression
analyses if they were
expressed in at least 1% of cells.
Ingenuity Pathway Analysis and Network Construction
Differentially expressed genes were fed into Ingenuity Pathway Analysis
(Qiagen) to determine significant canonical, functional, and upstream
signaling terms. For
construction of the IPA network, terms were filtered for adjusted p-values
below 0.001.
Non-relevant IPA terms were removed along with highly redundant functional
terms
assessed via jaccard similarity indices using the iGraph package (Csardi,
2006). Modularity
was established within Gephi (Bastian et al., 2009) and the final network was
visualized
using Cy toseape (Shannon, 2003). Genes and terms of interest were retained
for visualization
purposes. Modules were broken out from one another and organized using the
yFries organic
layout.
Inference of Transcription Factor Activity
Adult and fetal enriched gene lists were fed separately into RcisTarget (Aibar
et al.,
2017) to identify overrepresentation of motifs in windows around the genes'
promoters
(500bp up/100bp down and 10kb up and 10kb down). Transcription factors that
were
associated with significantly enriched motifs (NES > 3) were then filtered by
their significant
differential expression in the input gene list. Within each window and gene
list, only
appropriate 'IF -g en e interactions ("Repressors downregui ati rig genes and
activators
upregulating genes) were kept. Scanning windows were then merged to produce TF-
gene edge
lists of predicted fetal/adult repressors/activators. Inventors finally
narrowed the TiFs of
interest to those primarily reported as solely activators or repressors in the
literature.
miRNA Microarray Analysis
103
CA 03234809 2024-4- 11
WO 2023/069979
PCT/US2022/078344
UR 6-22023 /FR: 161118.03801 &03802
A2B5+ adult (n = 3) and CD140a+ fetal (n = 4) cell suspensions were isolated
via
MACS as noted above and their miRNA isolated using miRNeasy kits according to
manufacturer instructions (QIAGEN). Purified miRNA was then prepared and
profiled on
Affymetrix GeneChip miRNA 3.0 Arrays as instructed by their standard protocol.
Raw
CEL files were then read into R via the oligo (Carvalho and Irizarry, 2010)
package and
samples were normalized via robust multi-array averaging (RMA). Probes were
then filtered
for only human miRNAs according to Affymetrix's annotation, and differential
expression
was carried out in limma (Ritchie et at., 2015) where significance was
established at an
adjusted p-value < 0.01. Finally, differentially expressed miRNAs were
surveyed across
five independent miRNA prediction databases using MIRNATAP (Pajak M, 2020)
with
min src set to 2 and method set to "geom". Transcription factor regulation of
miRNAs was
carried out via querying the TrasmiR V2.0 database (Tong et at., 2019).
Exploratory Analysis and Visualization
PCA of bulk RNA-Seq or microarray samples was computed via prcomp with
default settings on variance stabilized values of DESeq2 objects. PCAs were
plotted via
autoplot in the ggfortify package. Volcano plots were generated using
EnhancedVolcano.
Graphs were further edited or generated anew using ggp1ot2 and aligned using
patchwork.
Human iPSC-derived production of GPCs
Human induced pluripotent stem cells (C27 (Chambers et at., 2009)) were
differentiated into (3-PCs using a previously described protocol (Osipovitch
et al., 2019;
Wang et at., 2013; Windrem et at., 2017). Briefly, cells were first
differentiated to
neuroepithelial cells, then to pre-GPCs, and finally to GPCs. GPCs were
maintained in
glial media supplemented with 13, NT3, ICilF1, and PDCi1-7-AA.
Lentiviral Overexpression
For overexpression of E2F6, ZNF274, IKZE3, or MAX, inventors first identified
the most abundant protein coding transcript of each of these genes from the
adult hGPC
dataset. cDNAs for each transcript were cloned downstream of the tetracycline
response
element promoter in the pTANK-TRE-EGFP-CAG-rtTA3G-WPRE vector. Viral particles
pseudotyped with vesicular stomatitis virus G glycoprotein were produced by
transient
transfection. of 1-11EK293FT cells and concentrated by ultracentrifugation,
and titrated by
QPCR, (VCR Lentivirus Titer Kit, ABM-Applied Biological Materials Inc). iPSC
(C27)
derived GPC cultures (160-180 days in vitro) were infected at 1.0 MOI in Ojai
media for 24
104
CA 03234809 2024-4- 11
WO 2023/069979
PCT/US2022/078344
UR 6-22023 /FR: 161118.03801 &03802
hours. Cells were washed with HI3SS and maintained in glial media supplemented
with 1
tgJrnl doxycycline (Millipore-Sigma St. Louis, MO) for the remainder of the
experiment.
Transduced 11G-PCs were isolated via FACS on DAPIIEGFP expression 3, 7, and
10
days following the initial addition of doxycycline. Doxycycline control cells
were sorted on
DAN" alone,
Quantitative PCR
RNA from overexpression experiments was extracted using RNeasy micro kits
(Qiagen, Germany). First-strand cDNA was synthesized using TaqMan Reverse
Transcription Reagents (Applied Biosystems, USA). qPCR reactions were run in
triplicate
by loading 1 ng of RNA mixed with FASTSTART UNIVERSAL SYBRGREEN
MASTER1VIIX (Roche Diagnostics, Germany) per reaction and analyzed on a real-
time
PCR instrument (CFX Connect Real-Time System thermocycler; Bio-Rad). Results
were
normalized to the expression of 18S from each sample.
Quantification And Statistical Analysis
For qPCR experiments, significant differences in delta CTs for each gene were
analyzed in linear models constructed by the interaction of overexpression
condition and
timepoint with the addition of a cell batch covariate. Post hoc pairwise
comparisons were
tested via least-squares means tests against the Dox control within timepoints
using the
lsmeans package (Lenth, 2016). P-values were adjusted for multiple comparisons
using
the false discovery rate method whereby p-values < 0.05 were deemed
significant.
Additional Resources
Bulk and scRNA-sequencing data from this paper and related previous
publications
can be explored in inventors'
Shiny app at GlialExp orer ,org or at
ctrigol dal aril ab geni ails . c om.
Example B1 -- CD140a selection enriches for human fetal glial progenitors more
efficiently than does 42B5
To identify the transcriptional concomitants to GPC aging, bulk and single
cell RNA-
Seq were first used to characterize hGPCs derived from second trimester fetal
human tissue,
whether isolated by targeting the CD140a epitope of PDGFRa, or the glial
gangliosides
recognized by monoclonal antibody A2B5. To that end, two sample-matched
experiments
were carried out whereby the ventricular/subventricular zones (VZ/SVZ) of 18-
22week
gestational age (g.a.) fetal brains were dissociated and sorted via
fluorescence activated cell
105
CA 03234809 2024-4- 11
WO 2023/069979
PCT/US2022/078344
UR 6-22023 /FR: 161118.03801 &03802
sorting (FACS), for either CD140a+ and A2B5+/PSA-NCAM- (A2B5+) GPCs isolated
from
the same fetal brain (n=3), or for CD140a+ GPCs as well as the CD140a-depleted
remainder
(n=5; FIG. 25A).
Bulk RNA-Seq libraries were then generated and deeply sequenced for both
experiments. Principal component analysis (PCA) showed segregation of the
CD140a+ and
A2B5+ cells, and further segregation of both from the CD140a-depleted samples
(FIG. 25B,
FIGs. 31A-B). Differential expression in both paired cohorts (p<0.01, absolute
1og2 fold
change > 1) identified 723 genes as differentially-expressed between CD140a+
and A2B5+
GPCs (435 in CD140a, 288 in A2B5). In contrast, 2,629 genes distinguished
CD140a+ GPCs
from CD140a- cells (FIG. 25C and FIGs. 31C-D). Differential gene expression
directionality
was highly consistent when comparing CD140+ to either A2B5+ or CD140- cells,
with all
but 4 genes being concordant (FIG. 31E).
Pathway enrichment analysis using Ingenuity Pathway Analysis (IPA) of both of
these gene sets identified similar pathways as relatively active in CD140+
GPCs; these
pathways included cell movement, oligodendroglial differentiation, lipid
synthesis, and
downstream PDGF, SOX10, and TCF7L2 signaling (FIG. 25). As expected, stronger
activation Z-scores were typically observed when comparing CD140a+ GPCs to
CD140a-
cells rather than to A2B5+ GPCs. Interestingly, CD140a+ cells also
differentially expressed a
number of pathways related to the immune system, likely due to small amounts
of microglial
contamination as a result of re-expression of PDGFaR epitopes on the
microglial surface.
A2B5+ samples additionally displayed upregulated ST8SIA1, the enzyme
responsible for
A2B5 synthesis, as well as pro-neural pathways.
Among the genes differentially upregulated in CD140a+ isolates were PDGFRA
itself, and a number of early oligodendroglial genes including OLIG1, OLIG2,
NKX2-2,
SOX10, and GPR17 (FIGs. 25E-F). Furthermore, the CD140a+ fraction also
exhibited
increased expression of later myelinogenesis-associated genes, including MBP,
GAL3ST1,
and UGT8. Beyond enrichment of the oligodendroglial lineage, many genes
typically
associated with microglia were also enriched in the CD140a isolates, including
CD68, C2,
C3, C4, and TREM2. In contrast, A2B5+ isolates exhibited enrichment of
astrocytic (AQ4,
CLU) and early neuronal (NEUROD1, NEUROD2, GABRG1, GABRA4, EOMES, HTR2A)
genes, suggesting the expression of A2B5 by immature astrocytes and neurons as
well as by
GPCs and oligodendroglial lineage cells. Overall then, oligodendroglial
enrichment was
significantly greater in CD140a+ GPCs than A2B5-defined GPCs, when each was
compared
106
CA 03234809 2024-4- 11
WO 2023/069979
PCT/US2022/078344
UR 6-22023 /FR: 161118.03801 &03802
to depleted fractions, suggesting the CD140a isolates as being the more
enriched in hGPCs,
and thus CD140a as the more appropriate phenotype for head-to-head comparison
with adult
hGPCs.
Example B2 --Single cell RNA-Sequencing reveals cellular heterogeneity within
human fetal GPC isolates
To further delineate the composition of fetal hGPC isolates at single cell
resolution,
inventors isolated both CD140a+ and A2B5+ hGPCs from 20-week g.a. fetal VZ/SVZ
via
FACS, and then assayed the transcriptomes of each by single cell RNA-Seq (Fig.
25A, 10X
Genomics V2). Inventors sought to capture >1,000 cells of each; following
filtration of low-
quality cells (unique genes <500, mitochondrial gene percentage >15%),
inventors were left
with 1,053 PSA-NCAM-/A2B5+ and 957 CD140a+ high quality cells (median 6,845
unique
molecular identifiers and 2,336 unique genes per cell; Fig. 32). Dimensional
reduction via
uniform manifold approximation and projection (UM-AP), followed by shared
nearest
neighbor modularity-based clustering of all cells using Seurat (Butler et al.,
2018), revealed
11 clusters with 8 primary cell types, as defined by their differential
enrichment of marker
genes. These primary cell types included: GPCs, pre-GPCs, neural progenitor
cells (NPCs),
immature neurons, neurons, microglia, and a cluster consisting of endothelial
cells and
pericytes. It was found that the CD140a+ FACS isolates were more enriched for
GPC and
pre-GPC populations than were the fetal A2B5+/PSA-NCAM- cells (Figs. 26A-D,
Figs. 33A-
C). Furthermore, whereas the CD140a-sorted cells were largely limited to GPCs
and pre-
GPCs, with only scattered microglial contamination, the A2B5+/PSA-NCAM-
isolates also
included astrocytes and neuronal lineage cells, the latter despite the upfront
depletion of
neuronal PSA-NCAM (Fig. 33A-C). These data supported the more selective and
phenotypically-restricted nature of CD140a rather than A2B5-based GPC
isolation.
On that basis, inventors next explored the gene expression profiles of the
predominant
cell populations in the CD140a+ fetal isolates, GPCs and pre-GPCs (Fig 33B)
Differential
expression between these two pools yielded 269 (143 upregulated, 126 down-
regulated; p <
0.01, 1og2 fold change > 0.5; Fig. 26E). During the pre-GPC to GPC transition,
early
oligodendroglial lineage genes were rapidly upregulated (OLIG2, SOX10, NKX2-2,
PLLP,
APOD), whereas those expressed in pre-GPCs effectively disappeared (VIM, HOPX,
TAGLN2, TNC). Interestingly, genes involved in the human leukocyte antigen
system,
including HLA-A, HLA-B, HLA-C and B2M, were all downregulated as the cells
transitioned to GPC stage (Fig. 26F). IPA analysis indicated that pre-GPCs
were relatively
107
CA 03234809 2024-4- 11
WO 2023/069979
PCT/US2022/078344
UR 6-22023 /FR: 161118.03801 &03802
enriched for terms related to migration, proliferation, and those presaging
astrocytic identity
(B1VIP4, AGT, and VEGF signaling), whereas GPCs displayed enrichment for terms
associated with acquisition of an oligodendroglial identity (PDGF-AA, FGFR2,
CCND1), in
addition to activation of the MYC and MYCN pathways (Fig. 26G). Using single
cell co-
expression data together with promoter motif enrichment using the SCENIC
package (Aibar
et al., 2017), inventors then identified 262 transcription factors that were
predicted to be
relatively activated in GPCs vs pre-GPCs (Wilcoxon rank sum test, p < 0.01).
These included
SATB1, as well as the early GPC specification factors OLIG2, SOX10, and NKX2-2
(Fig.
26H).
Example B3-- Human adult and fetal GPCs are transcriptionally distinct
We next asked how adult hGPCs might differ in their transcription from fetal
hGPCs.
To this end, A2B5+ hGPCs were isolated from surgically-resected adult human
temporal
neocortex (19-21 years old, n=3) and their bulk RNA expression assessed, as
paired together
with four additional fetal CD140aH- samples. It was previously noted that A2B5
selection is
sufficient to isolate GPCs from adult human brain, and is more sensitive than
CD140a in that
regard, given the maturation-associated down-regulation of PDGFRA expression
in adult
hGPCs (Sim et al., 2006; Windrem et al., 2004). Confirming that prior
observation, it was
found here that PDGFRA in A2B5+ adult GPCs was expressed with a median TPM of
0.55,
compared to a median TPM of 47.56 for fetal A2B5+ cells. By pairing sequencing
and
analysis with fetal CD140a-selected cells, inventors enabled regression of
sequencing batch
effects while simultaneously increasing power (Fig. 27A). Depletion of PSA-
NCAM1 cells
was not necessary for adult hGPC samples, as the expression of PSA-NCAM ceases
in the
adult cortex and white matter (Seki and Arai, 1993). As a result, PCA of human
adult and
fetal GPCs illustrated tight clustering of adult GPCs, sharply segregated from
both sorted
fetal hGPC pools (Fig. 27B). Differential expression of adult GPCs compared to
either
A2135+ or CD140a+ fetal GPC populations yielded 3,142 and 5,282 significant
genes,
respectively (p<0.01; absolute 10g2 fold-change >1) (Fig. 27C). To increase
the accuracy of
defining differential expression, downstream analyses were carried out on the
intersecting
2,720 genes (Fig. 27D, 1,060 up-regulated and 1,660 down-regulated in adult
GPCs
compared to fetal hGPCs). Remarkably, within these two differentially-
expressed gene sets,
100% of genes were directionally concordant.
To better understand the differences between adult and fetal GPCs, inventors
next
constructed a gene ontology network of non-redundant significant IPA terms and
their
108
CA 03234809 2024-4- 11
WO 2023/069979
PCT/US2022/078344
UR 6-22023 /FR: 161118.03801 &03802
contributing differentially-expressed genes (Figs. 27D-E). Spin glass
community detection of
this network uncovered three modules (Modules M1-M3) of highly connected
functional
terms (Fig. 27E) and genes (Fig. 27F). M1 included terms and genes linked to
glial
development, proliferation, and movement. Notably, a number of genes
associated with GPC
ontogeny were downregulated in adult GPCs; these included CSPG4/NG2, PCDH15,
CHRDL1, LMNB1, PTPRZ1, and ST8SIA1. In contrast, numerous genes whose
appearance
precedes and continues through oligodendrocyte differentiation and myelination
were
upregulated in adult GPCs, including MAG, MOG, MYRF, PLP1, CD9, CLDN11, CNP,
ERBB4, GJB1, PMP22, and SEMA4D.
Module 2 harbored numerous terms associated with cellular aging and the
modulation
of proliferation and senescence. Cell cycle progression and mitosis were
predicted to be
activated in fetal GPCs due to strong enrichment of proliferative factors
including MKI67,
TOP2A, CENPF, CENPH, CHEK1, EZH2 and numerous cyclins, including CDK1 and
CDK4. Furthermore, proliferation-inducing pathways were also inferred to be
activated; these
included MYC, CCND1, and YAP1 signaling, of which both YAP1 and MYC
transcripts
were similarly upregulated. In that regard, transient overexpression of MYC in
aged rodent
GPCs has recently been shown to restore their capacity to both proliferate and
differentiate.
Conversely, adult GPCs exhibited an upregulation of senescence-associated
transcripts,
including E2F6, MAP3K7, DMTF1/DMP1, OGT, AHR, RUNX1, and RUNX2. At the same
time, adult hGPCs exhibited a down-regulation of fetal transcripts that
included LMNB1,
PATZ1, BCLI IA, FIDAC2, FN1, EZH2, and YAP II and its cofactor TEADI. As a
result,
functional terms predicted to be active in adult hGPCs included senescence,
the rapid onset of
aging observed in Hutchinson-Gilford progeria, and cyclin-dependent kinase
inhibitory
pathways downstream of CDKN1A/p21 and CDKN2A/p16. Furthermore, AHR and its
signaling pathway, which has been implicated in driving senescence via the
inhibition of
MYC, was similarly upregulated in adult GPCs.
Module 3 consisted primarily of developmental and disease linked signaling
pathways
that have also been associated with aging. This included the predicted
activation of ASCL1
and BDNF signaling in fetal hGPCs and MAPT/Tau, APP, and REST signaling in
adult
GPCs. Overall, the transcriptional and functional profiling of adult GPCs
revealed a reduction
in transcripts associated with proliferative capacity, and a shift toward
senescence and more
mature phenotype.
109
CA 03234809 2024-4- 11
WO 2023/069979
PCT/US2022/078344
UR 6-22023 /FR: 161118.03801 &03802
Example B4 --Inference of transcription factor activity implicates adult GPC
transcriptional repressors
Given the significant transcriptional disparity between adult and fetal GPCs,
inventors next asked whether inventors could infer which transcription factors
direct their
identities. To accomplish this, inventors first scanned two promoter windows
(500bp
up/100bp down, 10kb up/lOkb down) of adult or fetal enriched GPC gene sets to
infer
significantly enriched TF motifs. This identified 48 TFs that were also
differentially-
expressed in the scanned intersecting dataset (Fig. 34). Among these,
inventors focused on
TFs whose primary means of DNA interaction were exclusively either repressive
or
stimulatory, while also considering the enrichment of their known cofactors.
This analysis
yielded 12 potential upstream regulators to explore (Figs 28A-C): 4 adult
repressors, E2F6,
ZNF274, MAX, and IKZF3; 1 adult activator, STAT3; 3 fetal repressors, BCL11A
HDAC2, and EZH2; and 4 fetal activators, MYC, HMGA2, NFIB, and TEAD2.
Interestingly, of these predicted TFs, 3 groups shared a high concordance of
motif
similarity within their targeted promoters: 1) E2F6, ZNF274, MAX, and MYC; 2)
STAT3
and BCL11A; and 3) EZH2 and HDAC2, suggesting that they may cooperate or
compete for
DNA binding at shared loci (Fig. 28A and Fig 34).
We next constructed four potential signaling pathways based on curated
transcriptional interactions, to predict those genes targeted by the set of
TFs (Figs. 28D-G).
Among activators enriched in fetal GPCs (Fig. 28D), MYC, a proliferative
factor, NFIB, a
key determinant of gliogenesis, TEAD2, a YAP/TAZ effector, and HIVIGA2,
another
proliferative factor, were each predicted to activate cohorts of progenitor
stage genes,
including both mitogenesis-associated transcripts and those demonstrated to
inhibit the onset
of senescence. Direct positive regulation was also predicted between these
four fetal
activators, with NFIB being driven by EIMGA2 and TEAD2, MYC being driven by
TEAD2 and NFIB, HMGA2 being driven by MYC and TEAD2, and TEAD2 being
reciprocally driven by MYC (Fig. 28D). In contrast to these fetal activators,
fetal stage
repressors, including the C2H2 type zinc finger BCL11A, the polycomb
repressive
complex subunit EZH2, and histone deacetylase HDAC2, were each predicted to
repress
more mature oligodendrocytic gene expression at this stage (Fig. 28E).
Furthermore, all
three of these TFs were predicted to inhibit targets implicated in senescence.
As such, these
factors appear to directly orchestrate downstream transcriptional events
leading to
maintenance of the cycling progenitor state.
110
CA 03234809 2024-4- 11
WO 2023/069979
PCT/US2022/078344
UR 6-22023 /FR: 161118.03801 &03802
We next assessed these predicted adult GPC signaling networks for a
potential mechanism responsible for their age-related gene expression changes.
STAT3
was predicted to shift GPC identity towards glial maturation via the
upregulation of a
large cohort of early differentiation- and myelination- associated
oligodendrocytic genes
(Fig. 28F). In addition, STAT3 was also inferred to activate a set of
senescence-
associated genes including BIN', RUNX1, RUNX2, DMTF1, CD47, MAP3K7,
CTNNA1, and OGT. At the same time, repression in adult GPCs was predicted to
be
effected through the Ikaros family zinc finger IKZF3/Aiolos, the KRAB (kruppel
associated
box) zinc finger ZNF274, the MYC-associated factor MAX, and cell cycle
regulator E2F6
(Fig. 28G) Targeting by this set of transcription factors predicted repression
of those gene
sets contributing to the fetal GPC signature, and this was indeed observed in
the down-
regulation of the early progenitor genes PDGFRA and CSPG4, as well as of the
cell
cyclicity genes CDK1, CDK4, and MKI67. Repression of YAP1, LMNB1, and TEAD1,
whose expression slows or prevents the onset of senescence, was also
predicted.
Interestingly, this set of four adult repressors predicted the down-regulated
expression of
each of the fetal enriched activators NFIB, MYC, TEAD2, and HMGA2, in addition
to
the fetal enriched repressors BCL11A, EZH2, and HDAC2.
Example B5 --Expression of adult-enriched repressors induces age-associated
transcriptional changes in GPCs
We next asked whether the four adult-enriched transcriptional repressors
inventors
identified in FIG. 28G, E2F6, IKZF3, MAX, and ZNF274, were individually
sufficient to
induce aspects of the age-associated changes in gene expression by otherwise
young GPCs.
To accomplish this, inventors designed doxycycline (Dox) inducible
overexpression
lentiviruses for each transcription factor (Fig. 29A).
Briefly, inventors first identified which protein- coding isoform was most
abundant in
adult GPCs for each repressor, so as to best mimic endogenous age- associated
upregulation;
these candidates were E2F6-202, IKZF3-217, MAX-201, and ZNF274-201 (Fig. 35).
These
cDNAs were cloned downstream of a tetracycline response element promoter, and
upstream
of a T2A self-cleaving EGFP reporter (Fig. 29A). Human induced pluripotent
stem cell
(iPSC)- derived hGPC cultures, prepared from the C27 line as previously
described in Wang
el al., 2013, Cell Stem Cell 12, 252-264 were then infected for 24 hrs, and
then treated
with Dox to induce transgene overexpression. C27 iPSC-derived GPCs were chosen
as
their transcriptome resembles that of fetal GPCs (Fig. 36), and they are
similarly capable
111
CA 03234809 2024-4- 11
WO 2023/069979
PCT/US2022/078344
UR 6-22023 /FR: 161118.03801 &03802
of
engrafting and my elinating dy smy el inated mice upon
transplantation. Over-
expressing cells were selected via FACS for EGFP expression, at 3, 7, and 10
days following
Dox addition (Fig. 29B, n =3-5). Uninfected cultures given Dox were used as
controls.
RNA was extracted and aging-associated genes of interest were analyzed by
qPCR. Significant induction of each adult-enriched repressor was observed at
each
timepoint following Dox supplementation (Fig. 29C). MKI67 and CDK1, genes
whose
upregulation are associated with active cell division, were significantly
repressed at two or
more timepoints in each over-expression paradigm (Fig. 29D). This was
consistent with
their diminished expression in adult GPCs (Fig. 27F), and suggested their
direct repression
by E2F6, MAX, and ZNF274 (MKI67), or by all four (CDK1). The GPC stage marker
PDGFRA, the cognate receptor for PDGF-AA, was also significantly repressed at
two
timepoints in the IKZF3-transduced GPCs, as well as in the E2F6-transduced
GPCs at
day 3, consistent with its repression in normal adult GPCs. Interestingly, the
senescence-
associated cyclin-dependent kinase inhibitor CDKN1A/p21 was upregulated in
response to
each of the tested repressors at all timepoints, while CDKN2A/p16 was
similarly
upregulated in at all timepoints in ZNF274-transduced hGPCs, as well as in the
E2F6-
over-expressing GPCs at day 7 (Fig. 29D). In addition, MBP and ILIA, both of
which are
strongly upregulated in adult hGPCs relative to fetal, both exhibited sharp
trends towards
upregulated expression in response to repressor transduction, although
timepoint-
associated variability prevented their increments from achieving statistical
significance.
Together, these data supported the prediction that forced, premature
expression of the adult-
enriched GPC repressors, E2F6, IKZF3, MAX, and ZNF274, are individually
sufficient to
induce multiple features of the aged GPC transcriptome in young, iPSC-derived
GPCs.
Example 136 ¨ The miRNA expression pattern of fetal hGPCs predicts their
suppression of senescence
To identify potential post-transcriptional regulators of gene expression,
inventors
assessed differences in miRNA expression between adult and fetal GPCs (n = 4)
utilizing
Affymetrix GeneChip miRNA 3.0 arrays. PCA displayed segregation of both GPC
populations as defined by their miRNA expression profiles (Fig. 30A).
Differential
expression between both ages (adjusted p-value <0.01) yielded 56 genes (23
enriched in
adult GPCs, 33 enriched in fetal GPCs, Fig. 30B-C).
Notably among these
differentially expressed miRNAs were the adult oligodendrocyte regulators miR-
219a-3p
112
CA 03234809 2024-4- 11
WO 2023/069979
PCT/US2022/078344
UR 6-22023 /FR: 161118.03801 &03802
and miR-338-5p (Dugas el at., 2010; Wang et at., 2017) in addition to fetal
progenitor stage
miRNAs miR-9-3p, miR-9-5p (Lau et al., 2008), and miR-17-5p (Budde et al.,
2010).
We next utilized this cohort of miRNAs to predict genes whose expression might
be
expected to be repressed via miRNA upregulation, separately analyzing both the
adult and
fetal GPC pools. To accomplish this, miRNAtap w a s used to query five miRNA
gene
target databases: DIANA (Maragkakis et at., 2011), Miranda (Enright et at.,
2003), PicTar
(Lall et al., 2006), TargetScan (Friedman et al., 2009), and miRDB (Wong and
Wang,
2015). To maximize precision, genes were only considered a target if they
appeared in at
least two databases. Among fetal-enriched miRs, this approach predicted an
average of
36.3 (SD = 24.5) repressed genes per miRNA. In contrast, among adult hGPC-
enriched
miRNAs, an average of 46.4 (SD = 37.8) genes were predicted as targets per
miRNA
(Fig. 30C). Altogether, this identified the potential repression of 48.8% of
adult GPC-
enriched genes via fetal miRNAs, and repression of 39.9% of fetal GPC-enriched
genes by
adult miRNAs.
To assess the functional importance of these miRNA-dependent post-
transcriptional regulatory mechanisms, inventors curated fetal and adult
networks
according to miRNA targeting of functionally-relevant, differentially
expressed genes
(Figs. 30D-E). Proposed upstream adult transcriptional regulators STAT3, E2F6,
and
MAX were predicted to be inhibited via 7 miRNAs in fetal GPCs (Fig. 30D);
these
included the already- validated repression of STAT3 in other cell types by miR-
126b-5p,
miR-106a-5p, miR- 17-5p, miR-130a-3p, and miR-130b-3p (Du et al., 2014a; Jiang
et at.,
2020; Zhang et at., 2020; Zhang et al., 2013; Zhao et at., 2013). In parallel,
a number of
early and mature oligodendrocytic genes were concurrently targeted for
inhibition, all
consistent with maintenance of the progenitor state; these included MBP, UGT8,
CD9,
PLP1, MYRF, and P1MP22 (Goldman and Kuypers, 2015). Importantly, a cohort of
genes
linked to either the induction of senescence or inhibition of proliferation,
or both, were also
predicted to be actively repressed in fetal GPCs. These included RUNX1, RUNX2,
BIN1,
DMTF1/DMP1, CTNNA1, SERPINE1, CDKN1C, PAK1, IF I16, EFEMP 1, MAP3K7,
AHR, OGT, CBX7, and CYLD (Eckers et at., 2016; Elliott et at., 1999; Ferrand
et al.,
2015; Hu et al., 2019; Inoue and Sherr, 1998; Jiang et al., 2017; Kilbey et
al., 2007; Lee
and Zhang, 2016; Li etal., 2015; Maderntzogiou etal., 2018; Mikawa etal.,
2014; Ni etal.,
2017; Wotton et al., 2004; Xin etal., 2004; Zhang and Guo, 2018) Inhibition of
senescence
or activation of proliferation have also been noted by several of the miRNAs
identified here,
113
CA 03234809 2024- 4- 11
WO 2023/069979
PCT/US2022/078344
UR 6-22023 /FR: 161118.03801 &03802
incl tiding miR-17-5p, miR-93 -3p, miR-1260b, miii R- 106a- 5p, miR-767-5p,
miR-130a-3p,
iniR-9-3p, miR-9-5p, and miR-130b-3p (Borgd.orff etal., 2010; Gao etal., 2019;
Meng et al.,
2017; 08Loghlen et al., 2015; Shen etal., 2015; Su etal., 2018; Tai etal.,
2020; Wang et
al., 2020a; Xia et at, 2019; Zhang and Guo, 2018). Together, these data
provide a
complementary mechanism by which fetal hGPCs may maintain their characteristic
progenitor transcriptional state and signature.
Example B7 -- Adult miRNA signaling may repress the proliferative progenitor
state and augur senescence
We next inspected the potential miRNA regulatory network within adult hGPCs
(Fig.
30E). This implicated five miRNAs controlling five identified active fetal
transcriptional
regulators including HDAC2, NFIB, BCLL1A, TEAD2, and IIMGA2, whose silencing
via
miR-4651 has previously been shown to inhibit proliferation (Han et al.,
2020). This
cohort of miRNAs were predicted to operate in parallel to adult
transcriptional
repressors in inhibiting expression of genes involved in maintaining the GPC
progenitor
state including PDGFR A , PTPRZ1, ZBTB18, SOX6, EGFR, and NRXN1.
Furthermore, the adult miRNA environment was predicted to repress numerous
genes
known to induce a proliferative state or to delay senescence, including LMNB1
(Freund et
al., 2012), PATZ1(Cho el al., 2012), GADD45A (Hollander et al., 1999), YAP1
and
TEAD1 (Xie et al., 2013), CDK1 (Diril et al., 2012), TPX2 (Rohrberg, et al.,
2020), S1PR1
(Liu etal., 2019), RRM2 (Aird et al., 2013), CCND2 (Bunt et al., 2010), SGO1
(Murakami-
Tonami etal., 2016), MCM4 and MCM6 (Mason etal., 2004), ZNF423 (Hernandez-
Segura
et al., 2017), PHB (Piper et al., 2002), WLS (Poudel et al., 2020), and ZMAT3
(Kim et al.,
2012). More directly, induction of senescence or inhibition of proliferation
has been linked
to the upregulation of miR-584-5p (Li et al., 2017), miR-193a-5p (Chen et al.,
2016), miR-
548ac (Song etal., 2020), miR-23b-3p (Campos-Viguri etal., 2020), miR-140-3p
(Wang et
a!, 2020b), and miR-330-3p (Wang et al., 2020h). Taken together, these data
implicate
these miRs as active participants in maintenance of the progenitor state in
fetal hGPCs, and
their modulation as a likely mechanism by which adult hGPCs assume their
signatory gene
expression profile.
Example 1118 -- Transcription factor regulation of miRNAs establishes and
consolidates GPC identity
114
CA 03234809 2024-4- 11
WO 2023/069979
PCT/US2022/078344
UR 6-22023 /FR: 161118.03801 &03802
We next sought to predict the upstream regulation of differentially expressed
miRNAs
in fetal and adult GPCs by querying the TransmiR transcription factor miRNA
regulation
database (Tong et al., 2019). This approach predicted regulation of 54 of 56
of age-specific
GPC miRNAs via 66 transcription factors that were similarly determined to be
significantly
differentially expressed between fetal and adult GPCs (Fig. 37A).
Interestingly, the top
four predicted miRNA-regulating TFs were all MYC-associated factors including
MAX,
MYC itself, E2F6, and the fetal enriched MYC associated zinc finger protein,
MAZ,
targeting 36, 33, 30, and 28 unique differentially expressed miRNAs
respectively.
Inspection of proposed relationships in the context of 12 TF candidates (Fig.
28)
indicated a large number of fetal hGPC-enriched miRNAs that were predicted to
be targeted
by both fetal activators and adult repressors, whereas those miRNAs enriched
in adult GPCs
were more uniquely targeted (Fig. 37B). MYC was predicted to drive the
expression of
numerous miRNAs in fetal GPCs, many of which were predicted to be repressed in
adulthood
via E2F6, MAX or both. miR-130a-3p in particular was predicted to be targeted
by MYC,
MAX, and E2F6, in addition to activation via TEAD2. Notably among validated TF-
miRNA interactions in other cell types, the upregulation of the rejuvenating
miR-17-5p by
MYC, and its repression by MAX (Du et al., 2014b; Hackl et al., 2010; Ji et
al., 2011;
O'Donnell et al., 2005), has been reported. Similarly, the parallel activation
of the
proliferative miR-130-3p by MYC or TEAD2 and YAP1 (Shen et al., 2015; Wang et
al.,
2020a; Yang et al., 2013), has been reported, as has the activation of both
arms of miR-9 by
MYC (Ma et al., 2010a)õ which decreases with oligodendrocytic maturity (Lau et
al., 2008).
In adult GPCs, enriched miRNAs predicted to be regulated by the significantly
enriched TF cohort were more likely to be only targeted by an adult activator
of fetal
repressor with only miR-151a-5p and miR- 4687-3p, a predicted inhibitor of
HMGA2, being
targeted in opposition by STAT3 versus BCL11A and EZH2 respectively. Beyond
this,
miR-1268b was predicted to be inhibited by both EZH2 and HDAC2 in parallel.
Notably,
key oligodendrocytic microRNA, miR-219a-2-3p was predicted to remain inhibited
in fetal
GPCs via EZH2, whereas STAT3 likely drives the expression of 7 other miRs
independently. Interestingly, STAT3, whose increased activity has
been linked to
senescence (Kojima et al., 2013), was also predicted to drive the expression
of a cohort of
miRNAs independently associated with the induction of senescence, including
miR- 584-5p,
miR-330-3p, miR-23b-3p, and miR-140-3p.
115
CA 03234809 2024-4- 11
WO 2023/069979
PCT/US2022/078344
UR 6-22023 /FR: 161118.03801 &03802
Through integration of transcriptional and miRNA profiling, pathway enrichment
analyses, and target predictions, inventors propose a model of human GPC aging
whereby
fetal hGPCs maintain progenitor gene expression, activate proliferative
programs, and
prevent senescence, while repressing oligodendrocytic and senescent gene
programs both
transcriptionally, and post-transcriptionally via microRNA. With adult
maturation and
the passage of time as well as of population doublings, hGPCs begin to
upregulate repressors
of these fetal progenitor-linked networks, while also activating programs to
further a
progressively more differentiated and ultimately senescent phenotype.
Example B9 -- Glial Explorer: an interactive database to query human glial
transcriptional expression
As a resource to other researchers, inventors have developed a Shiny app
(Chang et
al.) (Accessible at GlialExplorer.org), that comprises a database describing
human glial gene
expression, including both bulk and scRNA-Sequencing datasets, as covered both
here and in
inventors' previous studies. This includes profiles of healthy human embryonic
stem cell
(hESC)-derived GPCs and astrocytes as well as those from Huntington's Disease
cells
(Osipovitch et at., 2019), healthy induced pluripotent stem cell (iPSC)
derived GPCs and
astrocytes along with those from schizophrenic patients (Windrem et al.,
2017), and
remyelinating or resting fetal-derived GPCs sorted out of immunodeficient
chimeric mice
(Windrem et al., 2020). Briefly, Glial Explorer allows simple querying of gene
abundances (
across all of the aforementioned datasets. Furthermore, abundance of splice
variants can also
be explored. Lastly, scRNA-Seq data can similarly be detailed through the
generation of
feature and violin plots. The intention is that this app and its included
database should enable
interested researchers to quickly survey their genes of interest, and to
interactively assess
their regulation and roles in human glial ontogeny and aging. More detailed
expression
profiling information is hosted at the genomics database available at
ctngol dm anl ab .geni al i scorn.
DISCUSSION
Human glial progenitors first appear in the 2nd trimester of human
development,
after which a pool remains throughout the entirety of life. In early
development and
youth, these progenitors are highly proliferative and self-renewing. Yet their
ability to
divide and replenish lost myelin decreases substantially with age, as well as
in the setting of
antecedent dem y el i n ati on and white matter di seas e Given the
evolutionary divergence
116
CA 03234809 2024-4- 11
WO 2023/069979
PCT/US2022/078344
UR 6-22023 /FR: 161118.03801 &03802
between murine and human glia, it is important to interrogate human glia when
assessing the
basis for this loss of expansion potential, so as to identify the most
therapeutically relevant
targets. As such, inventors adopted a bulk RNA-sequencing strategy of FACS and
MACS
isolated fetal and adult human GPCs, together with scRNA-sequencing of fetal
GPCs
directly isolated from human brain, to more accurately track divergent
transcriptional
changes in the population of interest, while combatting potential off-target
cell-type
contaminants. This provided a set of genes whose expression distinguished
human fetal
GPCs from their aged successors, and which suggested a progressive bias
towards early
and terminal oligodendrocytic differentiation. This observation is in
accordance with
previous rodent GPC gene expression and proteome data noting the
downregulation of
progenitor markers such as CSPG4, PDGFRA, and PTPRZ1, pan passu with the
upregulation of early oligodendrocyte markers such as MBP, CNP, and MOG.
Importantly, these same adult GPCs were found to acquire an expression
signature
indicative of a loss of proliferative competence coupled with upregulation of
an ensemble of
senescence-linked genes
Our analysis predicted that MYC, whose expression was enriched in fetal GPCs,
is a
central regulator of proliferative capacity of human GPCs, through its
transcriptional
regulation of a set of downstream genes and miRNAs that coordinately and
positively
regulate mitotic competence and cell cyclicity. MYC has previously been
identified as
an important modulator of both the epigenetic landscape and proliferation of
murine GPCs,
via the activation of CDK1. Moreover, MYC has recently been extensively
studied as
mitogenic for adult murine GPCs and an inhibitor of their senescence,
functions consistent
with the MYC-regulated targets of the repressive network that inventors have
identified
in human GPCs. Indeed, the model described herein suggests the direct
repression in adult
GPCs not only of MYC, but also of many of its targets as well. Interestingly,
lKZF3 has
been reported to directly suppress MYC in pre-B-cells, limiting their
proliferative ability.
For its part, MAX can complex with MYC to both inhibit its function, and to
alter its
transcriptional targets. Furthermore, MAX and E2F6 can both target MYC binding
sites
competitively, in addition to the E2F sites that E2F6 typically represses.
MYC's down-
regulation has also been reported to follow the upstream activation of AHR and
BIN1, each of
which was upregulated in the adult GPC dataset. MYC was also predicted to
activate an
ensemble of miRNAs in fetal GPCs, many of which were predicted to be counter-
117
CA 03234809 2024-4- 11
WO 2023/069979
PCT/US2022/078344
UR 6-22023 /FR: 161118.03801 &03802
regulated by E2F6 and MAX in adult GPCs. Among these were miR-9 as well as miR-
130a-3p, each of which has been previously linked to delaying senescence.
Interestingly, miR-130a-3p was also predicted to repress another highly
active adult GPC transcriptional activator, STAT3, whose expression is
necessary for glial
development, remyelination, and has been implicated as a driver of senescence.
Indeed,
miRNA-130a-3p repression of STAT3 delays senescence in renal tubular
epithelial cells, as
driven by metformin, a drug similarly shown to enhance remyelination by aged
rat GPCs.
Furthermore, STAT3 expression may increase in GPCs after exposure to
conditioned media
taken from cultures of iPSC-derived neural progenitor cells, generated from
patients with
primary progressive multiple sclerosis. Beyond this, inventors predicted STAT3
activation of
a cohort of miRNAs that included miR-23b-3p, the most highly unregulated miR
in senescent
mesenchymal stem cells.
Further assessment of the miR differential expression data revealed a number
of post-
transcriptional regulatory mechanisms poised to modulate fetal and adult GPC
transcription.
This included the upregulation in adult hGPCs of the well-studied regulators
of
oligodendrocyte maturation, miR-219 and miR-338, consistent with the more
mature
oligodendrocytic transcriptional signature of adult GPCs. In that regard, the
adult GPC-
enriched miRNAs miR-338-5p, miR-219a-2-3p, and miR-584-5p, have all previously
been
reported to be among the most highly upregulated miRs in the white matter of
multiple
sclerosis (MS) patients, compared to healthy controls. Accordingly, those
miRNAs found to
be down-regulated in MS white matter, miR-130a-3p, miR-9-3p, miR-9-5p, were
also down-
regulated in the adult hGPC miRNA panel. Several additional miRNAs, including
miR-17-
Sp and miR-93-3p were also predicted by the analysis here to participate in
maintaining the
progenitor state of fetal GPCs, while miR-584-5p, miR-330-3p, miR-23b-3p, and
miR-140-
3p were predicted to promote senescence in adult GPCs.
The heterogeneity of adult hGPCs has been postulated to increase in the adult
brain in
a region specific manner and as such, future studies incorporating scRNA-
sequencing from
multiple regions, paired with spatial transcriptomics, will be needed to
better understand the
regional geography of normal glial aging, and its relationships with neuronal
activity and
vascular health. The transcriptional correlates to glial aging in the setting
of disease, both
neurodegenerative and dysmyelinating, will then be needed to assess the
interaction of
pathology with normal aging, as well as the response of aging cells to the
broad variety of
disease processes to which they may be exposed. In this regard, it will be
critical to account
118
CA 03234809 2024-4- 11
WO 2023/069979
PCT/US2022/078344
UR 6-22023 /FR: 161118.03801 &03802
for the effects of non-cell autonomous drivers of GPC aging, such as
diminished local
vascular perfusion and astrocytic support, on glial aging and senescence.
Taken together,
given the clear distinctions between young and aged hGPCs, and the extent to
which their
transcriptomes can be regulated via the mechanisms inventors have described,
it now seems a
feasible goal to safely rejuvenate aged human GPCs to a more expansion-
competent and
phenotypically-malleable phenotype, enabling them to more effectively
compensate for the ill
effects of aging and adult white matter disease.
It will be appreciated that variants of the above-disclosed and other features
and
functions, or alternatives thereof, may be combined into many other different
systems or
applications. Various presently unforeseen or unanticipated alternatives,
modifications,
variations, or improvements therein may be subsequently made by those skilled
in the art
which are also intended to be encompassed by the following claims.
The foregoing examples and description of the preferred embodiments should be
taken as illustrating, rather than as limiting the present disclosure as
defined by the claims. As
will be readily appreciated, numerous variations and combinations of the
features set forth
above can be utilized without departing from the present disclosure as set
forth in the claims.
Such variations are not regarded as a departure from the scope of the
disclosure, and all such
variations are intended to be included within the scope of the following
claims. All references
cited herein are incorporated by reference in their entireties.
119
CA 03234809 2024-4- 11