Note : Les descriptions sont présentées dans la langue officielle dans laquelle elles ont été soumises.
1 FIELD OF THE INVENTION
.
2 This invention relates to an improvement of the hot water
3 process for extracting bitumen from tar sand ores. More particularly it
4 relates to monitoring free surfactant concentration in the process water
and using the obtained information to guide adjustment of the process,
6 so as to maximize the production of primary bitumen froth.
7 BACKGROUND OF THE INVENTION
8 Tar sand, also known as oil sand and bituminous sand, is now
9 well recognized as a valuable source of hydrocarbons. There are presently
two large plants producing synthetic crude oil from the tar sands of the
11 Athabasca region of Alberta. In these operations, the tar sands are
12 first mined and the bitumen is then extracted from the ore by a process
13 called the hot water process. The recovered bitumen is subsequently
14 upgraded in a hydrotreating Facility to produce the synthetic crude.
The physical nature of the Athabasca tar sand itself is what
16 makes it amenable to the hot water process. More particularly, the tar
17 sand is composed oF bitumen, water, quartz sand and clays. The minute
18 clay particles are contained in the water. The water forms a Film around
19 each sand grain. And the bitumen or oil is disposed in the interstices
between the water-sheathed grains. Because the bitumen is in the water
21 phase, it can be displaced from the sand grains by a water addition
22 mechanism.
23 The first two steps of the hot water process, referred to as
24 'conditioning' and 'flooding', therefore are designed to aerate the slurry
and disperse or increase the separation of the oil -Flecks away from the
26 sand grains. A subsequent flotation/settling step is then applied to
27 recover the oil and sand as separate products.
1 A "process aid" (commonly NaOH) is usually provided as an
2 additive in the conditioning step. This process aid appears to react
3 with groups associated with the bitumen molecules to form surfactants.
4 In addition, there are naturally occurring surfactants present in discrete
form in the tar sand. These various surfactants play an important role in
6 facilitating successful dispersion and flotation of the oil.
7 The present invention is concerned with managing the process
8 to ensure a favorable surfactant regime in the slurry.
9 The 'hot water process' will now be described in a general
fashion. It is also disclosed in greater detail in the prior art literature
11 and patents~
12 In the first step, 'conditioning', the as-mined tar sand is
13 mixed with hot water (180F) and NaOH in a rotating horizontal drum. Steam
4 is sparged into the drum contents at intervals along its length to ensure
a slurry exit temperature of about 180F. Typically, the amounts of
16 reagents added are in the following proportions:
17 tar sand 3250 tons
18 hot w~ter 610 tons
19 NaOH 4 tons (20% NaOH)
The residence time in -the drum is typically 4 minutes.
21 As previously stated, during conditioning the slurry is
22 aerated in the course of being agitated and the solids and bitumen are
23 dispersed in the aqueous phase.
24 The slurry leaving the drum is screened, to remove oversize
material. The screened slurry is then 'flooded' by diluting it with a
26 large dose of hot water. The flooded product typically comprises:
27 bitumen 7% by weight
28 water 43%
29 solids 50%
The product temperature is typically 160 - 180F.
1 The diluted slurry then is transferred into a thickener-like
2 flotation vessel, referred to as a 'primary separation vessel' ("PSV").
3 This open-topped vessel has a cylindrical upper end and a conical lower end.
4 The slurry is retained for a period of time in the PSV under
quiescent conditions. Typically the retention time is about 45 minutes.
6 In the PSV, most of the sand sinks and is concentrated by
7 the conical bottom to form a sand layer. This sand is discharged through
8 a bottom outlet as an underflow. The discharge is discarded and is referred9 to as 'primary tailings'.
Much of the bitumen becomes attached to air bubbles and rises
11 to form a layer of froth on the surface of the aqueous phase. This froth,
12 referred to as "primary froth", overflows into a launder and is separately
13 recovered.
14 The primary froth typically comprises:
bitumen 66.4% by weight
16 sol ids 8.9%
17 water 24 . 7%
18 Not all of the bitumen is sufficiently buoyant to rise
19 into the primary froth layer. Much of this non-buoyant bitumen, together
with a large part of the clays, forms an aqueous suspension between the
21 sand and froth layers. This suspension is referred to as "middlings".
22 The water phase of the suspension can be referred to as "process water".
23 A stream of middlings is withdrawn from the vessel and is fed24 into sub-aerated flotation cells. In these cells, the middlings are subjected
to vigorous agitation and aeration. Bitumen froth, termed "secondary
26 froth", is produced and recovered. This secondary froth typically comprises:
27 bitumen 23.8% by weight
28 sol ids 17. 5%
29 water 58 . 7%
~ 7 ~ 2 ~
1 It will be noted that the secondary froth is considerably
2 more contaminated with water and solids than the primary froth.
3 Before being forwarded on to the upgrading operation, it is
4 necessary to remove most of the solids and water from the bitumen. This
cleaning procedure is carried out in two stages of centrifugation. How-
6 ever, the secondary froth is not as easy to clean as the primary froth.
7 For this and other reasons, it is highly desirable in the
8 management of the hot water process to maximize the production of
9 primary froth and to minimize the production of secondary froth.
It is well understood in the industry that the tar sand feed
11 varies significantly in nature. These changes in tar sand nature have
12 a dramatic impact on the proportion of the contained bitumen that is re-
3 covered and whether recovered bitumen reports as primary froth or secondary
4 froth. Factors which affect the nature of the tar sand include:
- the relative proportions of bitumen, water, and
16 "fines" (i.e. solids which pass through a 325 mesh
17 screen) in the Feed;
18 - the extent of "weathering" or aging of the ore, which
19 occurs aFter it is mined but before it is processed; and
- the circumstances under which the particular species of
21 tar sand was laid down.
22 Some tar sands are referred to as "rich" - they typically
23 contain 12 - 14% (w/w) bitumen and a relatively low fines content. Others
24 are referred to as "lean" - they typically contain 6 - 9% bitumen and a
relatively high fines content. Sample compositions are given in Table I.
-- 5 --
~27~
1 TABLE I
2 Oil Sand Bitumen Water Solids Fines
3 (~ w/w) (% w/w) (% w/w) (% w/w)
4 rich 14 1 85 14
average 11 3 86 19
6 lean 6 11 83 21
7 Generally stated, rich tar sands process easily, giving a high
8 recovery of relatively clean bitumen. Lean tar sands process poorly,
9 giving a low recovery of relatively dirty bitumen.
In summary then, it is always a prime objective of a hot water
11 process operator to manage ~he process so as to maximize recovery and to
12 ensure that the greatest possible proportion of the bitumen recovered is in
13 the form of primary froth. But his efforts in this direction are often
14 in~erfered with by the variations in the nature of the tar sand feed.
In our U.S. patent, 4,462,892 and in our paper entitled "The
16 influence of natural surfactant concentration on the hot water process for
17 recovering bitumen from the Athabasca oil sands", AOSTRA J. R~search, 1
18 (1984) S, we dls~losQd a process for better managing the
l9 hot water process. In these references, it wa~ d~s-
20 closed:
21 - that there was a connection between free surfactant
22 concentration in the process water and primary froth recovery;
23 - more particularly, it was taught ~hat if one monitored the
24 "free" surfactant concentration in the process water when
a single tar sand feed was processed at different levels
26 of NaOH addition (all other conditions being constant),
27 and if one plotted carboxylate-type free surfactant con-
28 centrations against primary froth recovery, a peak-like
29 curve (referred to as a "processibility curve") was
developed; and
, __ ~
~L2~2~)
1 - that if one repeated this procedure in the same circuit
2 using different tar sand feeds, the various processibility
3 curves developed all yielded their peak at substantially
4 the same free surfactant concentration.
Stated otherwise, primary froth oil recoveries were observed
6 to pass through a distinct maximum as a function of the equilibrium free
7 carboxylate-type surfactant concentration in the process water. And the
8 maximum o;l recoveries were associated with a single valued critical
9 equilibrium free surfactant concentration~ which critical value would hold
for a wide variety of types of oil sand when treated in that particular
11 circuit.
12 tBy "free" surfactant is meant those surfactant moities
13 in solution and not bound up at interfaces. By "extraction circuit"
14 is meant the conditioning drum, PSV and connecting piping.)
Thus, for a given circuit, an operator can establish the
16 critical equilibrium free surfactant concentration ("Ccs ") by making
17 se~eral runs with a single feed at varying NaOH additions; he can then
18 monitor the equilibrium free surfactant concentration (''Ccs'') in the process
19 water for various tar sands fed to the process; and he can adjust the NaOH
addition (as well as other process parameters such as water addition) to
21 bring Ccs to Ccs and thereby maximize primary froth production.
22 The equilibrium free surfactant concentration in a sample
23 of process water can be established by a method described in our paper
24 entitled "A surface-tension method for the determination of anionic sur-
Pactants in hot water processing of Athabasca oil sands", published in
26 Colloids and Surfaces9 11 (1984), 247 - 263.
- 7 -
~L~7~%~
1 The mining of tar sands involves excavating a trench nearly
2 5 km in length and hundreds of feet in depth. The excavating equipment
3 moves along the face of the trench and gradually increases the width of
4 the trench. In the course of making a pass along the trench, many quite
different varieties of tar sand are mined. For the majority of these ores,
6 the process set forth in U.S. Patent 4,462,892 is satisfactory. More
7 particularly, with these ores the quantity of NaOH addition can be adjusted
8 within a reasonably narrow range to bring Ccs equal to Ccs and maximum
9 primary froth production will be attained.
However, it has been found that there are certain pockets of
1l tar sand ore that do not initially appear to be most advantageously
12 processed by practising the process of U.S. Patent 4,462,892. These ores,
3 referred to as 'anomalous ores', have been Found to give very poor primary
4 froth recoveries when processed in accordance with U.S. 4,462,892
An examination of the compositions of these anomalous ores
16 did not give any useful guidance as to what might be done to lmprove bitumen
17 recovery from them. ~hen NaOH addition was varied within the commonly used
18 range for the circuit, little or no improvement was noted.
19 There was therefore a need for an understanding of what was
affecting the process and causing the poor recoveries with respect to these
21 anomalous ores - and there was a further need for a means for overcoming
22 the difficulty and modifying the extraction process to make it work well
23 when treating them.
~7~2~
1 SUMMARY OF THE INVENTION
. .
2 The present invention is based on the following observations
3 and discoveries:
4 (1) that when tar sand is conditioned and diluted, there are
actually two distinct classes of anionic surfactants, of
6 importance to the process, that are likely to be produced7 and to be present in the process water. These are:
8 - a first class of surfactants that appear to originate
g from carboxylate groups; and
- a second class, more polar in nature, that appear to
11 originate from sulfonate groups,
12 (2) that each of these two classes of surfactants has the
~ 13 potential to dominantly influence (relative to the other
14 class) the maximizing of primary froth production by
the hot water process;
16 (3) that it is possible to establish for a circuit the
17 critical equilibrium concentration of free surfactant in
18 the process water for each of the two classes of sur-
19 Factants; and
(4) that it is possible to test to determine which of the
21 two classes of surfactant will first (that is, at
22 lowest process aid addition) dominate when a particular
23 tar sand feed is being processed.
24 With these items in mind, an improvement has been developed
that enables one to operate the hot water process at maximum primary bitumen
26 froth recovery, whether the ore being treated is an anomalous ore (in
27 which case the sulfonate-type surfactants dominate at low process aid
28 addition) or a normal ore (in which case only the carboxylate-type sur-
29 factants dominate~.
- g
1 The improvement involves:
2 - determining a measure of the critical equilibrium free
3 surfactant concentration value for the circuit for the
4 carboxylate-type surfactants (which value is hereafter
referred to as ''Ccs ");
6 - determining a measure of the critical equilibrium free
7 surfactant concentration value for the circuit for the
8 sulfonate-type surfactants (which value is hereafter
9 referred to as ''Css ") ;
- determining for the ore currently being treated whether the
1l carboxylate-type or the sulfonate-type surfactants first
12 predominantly influence the maximum primary froth recovery
13 at low process aid add;tion;
1~ - and then adjusting process aid addition to the hot water
process so as to bring the concentration of the dominating
16 class of surfactants toward the critical concentration
17 thereof.
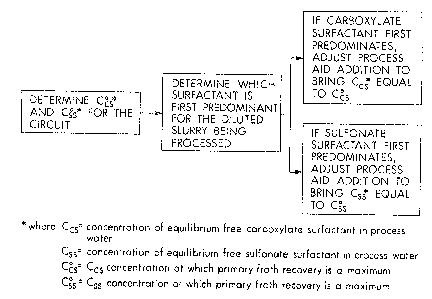
18 DESCRIPTION OF T~IE DRAWINGS
19 Figure 1 is a block diagram showing the steps of the method;
~ Figure 2 is a plot showing a typical surface-tension-monitored
21 CETAB titration curve for a solution containing carboxylate-type or
22 sulfonate-type surfactant;
23 Figure 3 is a plot of a plurality of surfactant/processibility
24 curves developed from data obtained by extracting several 'normal' ores
under the same conditions in a laboratory batch extraction unit ("BEU"),
26 one such ore being the average grade estuarine ore of Tables I and II,
27 the other ore being the marine average ore of said Tables - the critical
28 free carboxylate-type surfactant concentration Ccs is established by
29 the common value at which the peaks of the curves substantially coincide;
-- 10 --
1 Figure 4 is a plot of a plurality of surfactant/processibility
2 curves developed from data obtained by extracting several 'anomalous' ores,3 identified and described in Tables I and II, under the same conditions in the
4 BEU - the critical free sulfonate surfactant concentration Css is
S established by the common value at which the peaks of the curves substantially
6 coincide;
7 Figure 5(a) is a plot showing a typical NaOH/processibility
8 curve for the 'normal' average grade estuarine tar sand ore of Tables I
9 and II, treated in the BEU;
Figure 5(b) is a plot showing the free surfactant concentrations
11 in the process water when the ore used to develop Figure 5(a) was treated
12 at varying NaOH additions - the concentrations of carboxylate-type sur-
3 factants are identified by 's and the concentrations of sulfonate-type
4 surfactants are identified by ~'s - the critical free surfactant concentrations
(Ccs and Css) for the ore when treated in the BEU are shown as the broken
16 lines;
7 Figure 6(a) is a plot showing a typical NaOH/processibility
1~ curve for the 'anomalous' average grade channel margin tar sand ore of
19 Tables I and II, treated in the BEU;
Figure 6(b) is a plot showing the free surfactant concentrations
21 in the process water when the ore used to develop Figure 6(a) was treated
22 at varying NaOH additions - the concentrations of carboxylate-type sur-
23 factants are identified by 's and the concentrations of sulfonate-type
24 surfactants are identified by A'S - the critical free surfactant con-
centrations Ccs and Css ~ for the ore when treated in the BEU , are shown
26 as the broken lines;
27 Figures 7(a) and 7(b) are plots of the same type as those of
28 Figures 6(a) and 6(b) for the same tar sand, but the processing was carried
29 out in the continuous pilot unit;
, ~,%~3Z~
1 Figures 8 through 11 are plots of the same type as those of
2 Figures 6(a) and 6(b) , but showing the effects arising from increasing
3 degrees of ageing.
4 DESCRIPTION OF THE PREFERRED EMBODIMENT
Three separate hot water process circuits of varying size
6 are operated by the present assignee. The largest is a commercial production
7 unit, which operates at a rate of about 13,000 tons/hr. of tar sand. The
8 middle unit is a continuous pilot circuit, which operates at a rate of
9 about 2,270 kg/hr. And the smallest unit is a batch extraction unit (BEU)
which operates on 500 g charges of tar sand.
11 The data underlying the present invention and presented herein12 was generated by use of the BEU, with verification of the BEU results in
13 the pilot unit. The pilot unit has been shown to give hot water process
14 results that conform with the results obtained from the commercial unit.
The BEU and its method of use is described by E. C. Sanford
16 and F. A. Seyer in a paper entitled "Processability of Athabasca tar sand
17 using a batch extraction unit: The role of NaOH", CIM Bulletin, 72 (1979)
18 164. This paper is incorporated herewith by reference. In general, the
19 unit involves a steel pot having agitator and sub-aeration means. The
procedure practised in its use involves:
21 - slurrying 500 g tar sand with 150 g water and the
22 desired amount of NaOH (O to 0.24 wt. % tar sand) at 82C;
23 - stirring with air sparging for 10 minutes (to simulate
2~ 'conditioning'),
- ceasing air sparging and adding 900 g water (to simulate
26 'flooding');
27 - gentle stirring for 10 minutes (to simulate retention and
28 flotation in the PSV);
- 12 -
7q~ 3
1 - collecting primary froth;
2 - stirring with air sparging for 5 minutes (to simulate
3 secondary recovery); and
4 - collecting secondary froth.
S Samples collected from each extraction were assayed for oil,
6 water and solids content by standard methods set forth in the book ~'Syncrude
7 analytical methods for oil sand and bitumen processing", published by the
8 Alberta Oil Sands Technology and Research Authority (August , 1979).
9 The concentrations for both the carboxylate-type and
sulfonate-type surfactants in the process water were determined using the
1l surface-tension method previously mentioned. The process water used for
12 analysis purposes was the aqueous residue from the secondary recovery step
3 in the BEU process.
4 The First class of surfactants appears to have originated
from carboxylate-functional groups or precursors in the oil. The second
16 class appears to have orig;nated from sulfonate-functional groups or
17 precursors in the oil. This classification is based on acid titrations and
18 infra red spectroscopic measurements. The investigation of the detailed
19 chemical nature and structure of the surfactants is presently at a
preliminary stage - the specific chemical composition of these compounds
21 is not important to the present invention.
22 Several oil sands feedstocks nf differing nature were used
23 in the work underlying the invention. The compositions of the feedstocks
24 are set forth below in Table I. Note that a "rich" ore was taken to contain
about 12 - 14% (w/w) bitumen, an "average" ore about 10 - 11% , and a
26 "lean" ore about 6 - 9%.
1 TABLE I
2C positions of Oil Sands Studied
3 0;1 Sand Grade Bitumen Water Solids Fines
4 (deposition ------------- -
type)
(% w/w)
6 Estuarine Average 11.5 4.2 84.2 17.5
7 Channel Margin Average 11.4 3.4 85.6 26.3
8 Marine Average 10.6 2.7 86.8 28.6
9 Marine Lean 8.1 6.0 85.9 20.0
Estuarine #1 Rich 13.2 1.1 85.5 6.2
11 Estuarine #2 Rich 14.0 1.2 84.8 13.9
12 * The fines level is defined as the weight fraction of solids
13 smaller than 44 ~m and is expressed as a percentage of total
14 solids.
As previously statecl, we determined surfactant concentrations
16 (Css and Ccs) using the surface tension method described in the Colloids
17 and Surfaces paper previously identified.
18 In short, this procedure involves measuring surface tension to
19 monitor the course of surfactant titrations in which the total anionic
surfactants are titrated with a known cationic surfactant The cationic
21 is added to tie up the anionic until there are no more free surfactants
22 and the surface tension versus cationic added relationship changes (see
23 Figure 2). By conducting these titrations at low and high pH conditions,
24 the carboxylate and sulphonate surfactants can be distinguished.
More particularly, samples of process water were first
26 centrifuged at 15,000 g , to remove suspended solids. The supernatant
27 solutions were then assayed for surfactants as follows.
- 14 -
i7~2~
1 The titration of a sample was carried out in aqueous solution
2 and monitored by surface tension measurements. A titrant solution of
3 cetyltrimethylammonium bromide ("CETAB"), 99% pure, having a strength of
4 5.00 x 10 3 M, was used. A cell arrangement, as shown in the Colloids
and Surfaces paper, was utilized.
6 Surface tension was measured with a surface tensiometer (Sensa-
7 Dyne Model 5000, Chem-Dyne Research Corp., Madison, WI). This instrument
8 operates on the maximum bubble-pressure principle. A differential pressure
9 is measured for nitrogen gas slowly bubbled through two immersed glass tubes
of different internal radii.
11 A sample aliquot (20 ml) of centrifuged process water was
12 diluted to 50 ml with deionized water and titrated with CETAB in 0.2 ml
3 increments. A time lapse of up to three minutes was allowed between CETAB
4 increments, particularly near the endpoint. For each CETAB increment the
surface tension was measured.
16 This procedure was applied if only a single anionic sur-
17 factant was present or if a mixture of anionic surfactants in a sample
18 was involved.
19 When present in a mixture, the carboxylate-type ("C-type")
and sulfonate-type ("S-type") surfactant concentrations (''Ccs'' and
21 "Css") were determined separately as follows.
22 Only two titrations are required. The sample is first
23 adjusted to pH 3.0 and filtered. One aliquot of the filtrate is titrated
24 to yield Css . A second aliquot is readjusted to its original pH and
titrated to yield (Ccs + Css). The C-type surfactant concentration can
26 then be calculated from equation (1):
27 Ccs (Ccs ~ Css) - Css (1).
,7~
It will be understood that the maximum bubble-pressure
2 technique is a dynamic sur-face-tension method. In order to determine
3 "static" surface tension, it must be ascertained that equilibrium is
4 reached between the bubble surfaces and the solution. In this work, a
bubble rate of 28 seconds per bubble (at each sensor probe) was found
6 to adequately yield equilibrium or static surface-tension values. For
7 purely analytical purposes, relative (dynamic) surface tensions are
8 sufficient and the bubble rate can be increased to speed up the method.
9 The titration curves can take several different forms - however
for purposes of the present invention, the titration curve is normally of
1l one form. The curve shown in Figure 2 was obtained from the titration
12 of sodium laurate alone (that is, the curve is typical oF a solution
13 containin~ only a known carboxylate-type surfactant). Curves obtained from
1~ the titration of process water containing S-type surfactants are similar
in form.
16 It will be notecl that the surface tension decreases as the
17 cationic-anionic compound is formed. The new compouncl is apparently
18 more surface active than is the anionic surfactant. Beyond the equivalence
19 point the surface tension is still lowered, but to a lesser extent, as
free cationic surfactant appears in solution.
21 In the course of the work underlying the present invention,
22 we used plots to develop what are referred to as "processibility curves".
23 More specifically, we subjected a single tar sand feed to batch extractions
24 in the BEU at standard conditions, but at varying NaOH additions. In con-
25 junction with these runs, we monitored primary froth recovery, Ccs and
26 Css . With the resulting data in hand, we plotted NaOH addition against
27 primary froth recovery to yield a NaOH/processibility curve; and we plotted
28 free surfactant concentration against primary froth recovery to yield a
29 surfactant/processibility curve.
-- 16 --
~2 ~
1 In U.S. patent 4,462,892 it was disclosed that, for the
2 'normal' or usual tar sand ore, the NaOH/processibility curve has a peak-3 like form. This is illustra-ted in F;gure 5(a) and supported in the data
4 of Table II, for an average grade estuarine ore. It will be noted that
some NaOH addition (0.04 wt. % oil sand) is required to yield a maximum
6 primary froth recovery of about 97%. At higher additions, recovery drops.7 As further disclosed in U.S. patent ~,462,892, if one runs a
8 number of normal tar sands through a circuit, such as the BEU, at varying9 NaOH additions, and plots C-type surfactant/processibility curves from the
run data, it is found that the curves have their maximum values generally
11 at a common value (referred to as the 'critical' va1ue). This is il-
12 lustrated in Figure 3.
13 However, in the work underlying U.S. patent 4,462,892, only14 those surfactants having an ascertainable effect ôn the primary froth
recovery were monitored. These were only the C-type surfactants, as only
16 normal ores were being worked with. Ores which did not perform in a
17 normal fashion in the commercial plant were not encountered in the work
18 unclerlying U.S. patent 4,~62,892, prior to the present work.
19 In the present case, when an anomalous ore was tested care-fully in both the BEU and pilot unit over a wide range of NaOH additions,
21 it was discovered that the NaOH/processibility curve had two peaks or
22 recovery maxima, with an intervening valley where primary froth recoveries
23 were very poor.
24 This was demonstrated by the processing behaviour of an
average grade channel margin tar sand (Table I). The supporting data
26 for the runs are set forth in Table II. The data from the runs are
27 plotted in the form of NaOH/processibility curves shown in Figure 6(a)
28 for the BEU and Figure 7(a) for the continuous pilot unit.
1 Figures 6(b) and 7(b) show the free C-type and S-type
2 concentrations generated in the process water during said runs at varying
3 NaOH additions.
4 Comparison of Figures 6(b) and 7(b) with Figures 6(a) and
7(a) shows that the first or low NaOH addition recovery peak substantially
6 coincides with Css As this critical value is exceeded, the recovery
7 declines. However, when recovery is down to about 70%, the C-type
8 surfactant concentration begins to rise toward CCs . As the C-type
9 surfactant concentration approaches Ccs ~ a new peak primary froth
recovery is reached.
1l It will be noted that the higher of the two maxima is due
12 to the S-type surfactants and represents a primary froth recovery of
3 about 90%. The second maxima, at a higher NaOH addition, is due to the
14 C-type surfactants and represents a recovery of about 80%. In between
the maxima, at an NaOH addition of 0.04%, the recovery drops as low as 20%.
16 In summary, Figures 6 and 7 inclicate that the two recovery
17 peaks for the anomalous ore correspond indiviclually to the action of the
18 S-type surfactants ancl C-type surfactants respectively.
9 It is to be noted from Figures 6 and 7 that, for the anomalous
ore, the concentration of free C-type surfactants in the process water is
21 zero when the curve is extrapolated to zero NaOH. And the concentration
22 of S-type surfactants in the process water at zero NaOH addition is close
23 to Css .
24 The rules governing the present improvement therefore can
be stated as follows:
26 - the C-type surfactants control primary froth
27 recovery when they are present in solution at
28 concentrations near Ccs ~ no matter what the
29 concentration of S-type surfactants;
- 18 -
~` -
7~
- the S-type surfactants control primary froth
2 recovery when they are present in concentrations
3 near Css ~ but only if the C-type surfactants are
4 either absent or present at very low concentrations;
and
6 - interference resul ts if the S-type surfactants are present
7 at concentrations near Css while the C-type surfactants
8 are present at significant concentrations but sub-
9 stantially less than Ccs .
It is possible to illustrate all these effects for a single
1l tar sand, if 'ageing' is taken into account. Ageing of tar sand refers to
12 changes that occur in tar sand with time after it is mined from the
3 natural deposit. The ageing process in some way reduces the concentration
4 of free C-type surfactants that can be generated from an oil sand with a
given amount o-F added NaOH.
16 In this connection, the processibility of the rich estuarine
7 #2 tar sand (Table I) was followed as it progressed through several
18 arbitrary 'ages'. The process data are given in Table II. Figure 8 shows
19 the processibility of the fresh ore. Here, when no NaOH was added, both
20 surfactant classes appeared at near their respective critical free
21 concentrations. Accordingly, recovery was highest (89%) for the blank
22 extraction~
23 At 'age 1', Figure 9 shows that the free C-type sur-Factant
24 concentrations decreased, while the free S-type surfactant concentrations
25 remained relatively unaffected. It appears that while the S-type sur-
26 factant concentrations are still at about the critical value for a blank
27 extraction, the reduced but still significant concentration of free C-type
28 surfactants causes an interference which results in a primary recovery of
29 only about 75% being obtained.
19
1 Figure 10 shows that at 'age 2' the free C-type surfactant
2 concentrations decreased still further, wh;le the free S-type sur-
3 factant concentrations remained relatively unaffected at the critical
4 value for a blank extraction. In this circumstance, the lower con-
centration of free C-type surfactants was associated with a somewhat
6 restored primary recovery of about 86%. The improvement appears to be
7 caused by less interference of the C-type surfactants with the action
8 of the S-type surfactants. It can also be seen from Figure 10 that
9 at high NaOH addition levels (0.08 wt. % NaOH) primary recovery rose
to a second peak as the free C-type surfactant concentration rose toward
11 its critical level.
12 Figure 11 shows that at 'age 3' the free C-type surfactant
13 concentrations decreased yet further, while the free S-type surfactant
1~ concentrations remained again relatively unaffected at the critical
level for a blank extraction. In this c;rcumstance, the concentration
16 of Free C-type surfactants was zero and hence no interference by C-
7 type surfactants with the action of the S-type surfactants was possible.
18 As a result, a completely restored primary froth recovery of about 90%
19 was obtained.
It will be noted from the (b) plots in Figures 8 through 11
21 that the free S-type surfactant concentrations,as function of NaOH
22 addition, were almost invariant with 'age' of the tar sand. This is
23 in marked contrast to the C-type surfactant concentrations, which
24 decreased with tar sand age.
- 20 -
1 From the processibility behavior established, one can
2 conclude that the S-type surfactants can efficiently operate the process,
3 and there is a critical concentration Css corresponding to maximum
4 primary froth recovery. This parallelism with C-type surfactant behaviourleads to the suggestion that a similar mechanism is operative with the S-
6 type surfactants as for the C-type surfactants. When the free C-type
7 surfactant concentrations are near Ccs ~ primary froth recovery is maxi-
8 mized no matter what the concentration of S-type surfactants. When both
g classes of surfactants can pass through their respective critical con-
centrations, it is found that decreased recovery is obtained between
11 Css and Ccs . Figures 6(a), 7(a) and lO(a) show this. These results
12 indicate some selectivity and interference effects. In the presence of
13 S-type surfactants, the C-type surfactants appear to be preferentially
14 adsorbed at the critical interfaces and mixed adsorption layers are
apparently not effective in promoting bitumen recovery.
- 21 -
~2~%~i~
1TABLE`II
2Oil Recovery and Measured Properties of Process Extracts
3from Batch Extractions of Oil Sands
.
4 Oi 1 Grade NaOH Primary Free Free
Sand Added Oil Carboxylate Su1fonate
6 Recovery SurfactantSurfactant
7Concentration Concentration
8 (Wt. %(%) (10-5 N) (10-5 N
9 Oil
Sand)
11 Es-tuarine Average 0.02 76.~ 9.4 24.4
12 0,04 97,4 11 7 32.0
13 0.06 94.6 15.2 40.6
14 0,08 93,5 18.6 47.9
Channel
16 margin Average 0,00 80.5 0,0 9,9
17 o,ol 90.9 0.3 14.6
18 0.02 71.2 0.0 19.1
19 0.03 85.3 0.1 24.9
0.04 83.2 1.7 29.5
21 0.05 89.2 10.3 44.1
22 0.06 87.4 12.4 45.1
23 0.07 35.9 21.4 59.1
24 Channel
margin
26 ( conti nuou s
27 pi 1 ot
28 process) Average 0.00 40.2 0.0 11.6
29 o.ol 73.7 0.0 18.5
0.02 89.0 0.0 21.4
31 0.04 16.3 3.3 34.0
32 0.05 81.0 8.7 38.0
33 0.07 o.o 19.0 57.0
- 22 -
1 TABLE II (Continued)
-
2 Marine Average 0.04 46.6 4.6 75.1
3 0.0891.0 12.1 86.0
4 0~1260.1 16.2 116.3
0.1664.1 29.8 156.4
6 Marine
7 + added
8 material Lean 0.10 6.3 1.0 160.6
9 0.1332.7 6.3 198.~
0 0.1648.9 10.6 233.5
1l 0.2044.8 - -
12 Estuarine
13 #1 Rich 0.0070.7 3.3 13.7
14 0.0264.0 5.6 16.8
0.0447.3
16 Estuarine
l7 #2
18 Fresh Rich 0.0088.0 10.4 15.3
19 0.00581.9 12.7 17.4
0.0183.7 13.8 17.5
21 0.0268.5 15.1 22.5
22 Age 1 75- 16.4
23 0.005 66.2 8.4 17.9
24 0.0159.6
Age 2 0.0085.5 2.7 14.7
26 0.0185.6 4.1 17.5
27 0.0266.6 5.0 22.5
28 0.0372.6 6.7 25.9
29 0.04 - 7.6 28.2
0.0575.5 8.9 31.1
- 23 -
~L2~
1 TABLE II (Continued)
2 Age 3 - 90-9 13-9
3 0.01 62.2 2.6 17.3
4 0.02 66.8 5.0 20.7
0.025 59.9 - -
6 In a two-peak curve of the type illustrated in Figure 7,
7 it is possible that, for some ores, the second peak (maximum bitumen
8 recovery due to carboxylate surfactant) could be higher than the first
9 peak due to sulfonate. In such cases, it may be advantageous to operate
the extraction process under either carboxylate or sulfonate control.
11 Where the maximum recovery due to carboxylate is markedly higher, the
12 cost of adding alkaline process aid required to reach this maximum may
13 be more than offset by the extra bitumen obtained. It would thus be
14 economically beneficial to ignore the first peak and operate under
carboxylate control.
- 24 -