Note : Les descriptions sont présentées dans la langue officielle dans laquelle elles ont été soumises.
FIBER OPTTO LTP1R I~OTBE A~URENT
A~ OPTT~3TZ~'flOl~ R7l~TEldi
This invention relates to communication
systems for routing and distributing transmission
5 signals and, more particularly, to a fiber optic
transmission system noise measurement and
optimization system.
B~1CICGROLII~iD OP' THE TRdVEI~ITTOP3
Known fiber optic transmission systems have
iQ several inherent disadvantages. For example, known
LED transmitters in transmission systems using
fiber optic links are- constructed to launch the
amount of optical power required for worst case
conditions. Typically, worst case conditions for
15 such optical systems are computed using worst case
receiver sensitivity, worst case LED optical power
output, operation at worst- case temperature and
operation at worst case connector and film loss.
Designing for such worst case conditions results in
2n the launching of excess optical power whenever
conditions on a particular link are not worst case)
which, in turn, results in an excess of dissipated
power by the LED. Operating the LED at such
continued high optical power results in an
25 excessive amount of heat generated and may degrade
LED performance over a period of time (as compared
to operating at lower power levels).
Another disadvantage of known systems is that
they provide little or no information with respect
5 to connector performance in most applications.
Further, knowledge of system expected power margins
is uncertain due to the lack of information
relating to installed connector performance. The
availability of such information is particularly
10 important in an airborne system.
Known systems are, for the most part,
non-linear digital systems. Unlike the invention
described herein, such known systems cannot measure
noise performance in a fiber optic transmission and
15 distribution system and relate such performance to
power margins. This is because the relationship
between noise power and bit error rate changes too
rapidly near the threshold of transmission system
operation. Presently, known systems simply
20 transmit as much power as possible during any
transmission. Maintenance of such systems is
typically done only after a link in the system
fails to operate.
The invention overcomes the disadvantages of
25 prior art devices by providing, for the first time,
_ g _
apparatus which measures system noise performance
and uses this information in one illustrative
embodiment to control the amount of power launched
or transmitted by an LED transmitter. As provided
5 by the invention, an LED or laser transmitter
launches only the amount of optical power required
to maintain an adequate signal-to-noise ratio at
the demodulator (discriminator) output. Reducing
the launched power reduces the power dissipation of
i0 the transmitter and improves its reliability.
Boise measurement results are also used by the
invention to optimize transmission network route
selection, and according to need (based upon
measurements) do maintenance of the fiber optic
15 transmission system only as required. Such
maintenance can frequently be done prior to
complete failure of optical fiber links. That is,
the system employing the invention will transmit at
a power level corresponding to actual conditions
20 present in the system whereas known systems
transmit at much higher power levels corresponding
to "worst case°' power loss calculations.
Optimization of receiver operating conditions
can also be done if an Avalanche Photo Diode (APD)
~5 is used for an optical detector by using noise
CA 02003788 1999-07-21
- 4 -
measurements to optimize APD gain. Conventionally, APD
detectors use temperature compensated drive systems of the
tightly regulated high voltage drive to control and optimize the
avalanche gain of the devices.
SU1~1ARY OF THE INVENTION
In accordance with the present invention there is provided
apparatus for optimizing system performance for use in an FM
transmission and signal distribution system which includes at
least two fiber optic links both having an output and an input,
wherein the transmission and signal distribution system includes
a transmitter, comprising:
(a) means for measuring noise signals coupled to the at
least two fiber optic link outputs;
(b) controlling means coupled to the noise measuring means
including:
(i) means for generating system performance data
proportional to the noise signals measured by the
noise measurement means wherein the performance data
generated includes data pertaining to fiber optic link
loss in the at least two fiber optic links,
(ii) means for comparing data pertaining to fiber
optic link loss in at least two fiber optic links
wherein the comparing means determines the optimum
fiber optic link based on the fiber optic link loss
CA 02003788 1999-07-21
- 4a -
data, and provides a comparison control signal
consistent therewith;
(c) means for storing the generated performance data
including the data pertaining to fiber optic link loss, wherein
the storing means is coupled to the control means; and
(d) means coupled to the control means and responsive to
the comparison control signal for routing signals according to
comparisons of the data pertaining to fiber optic link loss.
In accordance with the present invention there is further
provided apparatus for optimizing system performance for use in
FM transmission and signal distribution system which includes at
least one fiber optic link having an output and an input,
wherein the transmission and signal distribution system includes
a transmitter, comprising:
(a) means for measuring noise signals coupled to the
output of the at least one fiber optic link;
(b) controlling means coupled to the noise measuring
means, including:
(i) means for generating system performance data
proportional to the noise signals measured by the
noise measurement means wherein the performance data
generated includes data pertaining to fiber optic link
loss and wherein the performance data generated
includes data pertaining to transmitter power,
(ii) means for controlling the transmission power
level wherein the transmission power level controlling
CA 02003788 1999-07-21
- 4b -
means provides transmission control signals to the
transmitter and wherein the transmission control
signals are consistent with the generated performance
data; and
(c) means coupled to the controlling means for storing the
generated performance data.
Apparatus for optimizing system performance for use in a
transmission and signal distribution system which includes at
least one fiber optic link having transmission and receiving
means is disclosed. The apparatus includes means for measuring
noise signals in each fiber optic link and means for generating
system performance data corresponding to the noise signals
measured by the noise measurement means.
In one alternate embodiment of the invention, means for
controlling the transmission and signal distribution system is
included wherein the controlling means responds to the generated
performance data.
In yet another alternative embodiment of the invention,
means for routing signals based upon optical path loss is also
included. The apparatus of the invention may further include
means for storing generated performance data and means for
~~~~'o ~~
a
transmitting input signals at variable transmission
power levels as determined by the generated
performance data.
It is one object of the invention to provide
5 apparatus which overcomes the disadvantages in the
prior art by measuring system noise performance in
a transmission and distribution system having fiber
optic links and using such system noise measurement
results to control the amount of optical power
10 launched by the system's transmitter.
It is a further object of the invention to
provide apparatus to improve fault detection
capability in fiber optic link systems by
recognizing the relationship between system noise
ZS performance and fiber optic link loss performance.
It is yet another object of the invention to
provide signal route selection made on the basis of
optical path loss for better transmission of
signals or to enable using lower transmitter power
~0 by selecting the lowest noise links in a system.
It is yet a further object of the invention to
optimize Avalanche Photo Diode Receiver Operating
Conditions by employing noise measurements to
adjust APD gain.
_
It is yet another object of the invention to
provide information related to transmitter power,
fiber optic link loss, and receiver sensitivity by
using noise measurements of a fiber optic link
5 transmission circuit.
It is yet a further object of the invention to
optimize transmitter power so as to prevent
operation of transmitters for worst case conditions
unless the conditions present are in actuality
10 worst case.
Other objects, features and advantages of the
invention will become apparent to those skilled in
the art through reference to the accompanying
claims and drawings wherein like numerals refer to
15 like elements.
B13%EF D~~CR%P'fTOYd OP ~~g PIGURE~
Figure 1 is a graphical plot of random noise
as measured in an FM fiber optic link system with
zero dB of optical attenuation.
20 Figure 2 is a graphical plot of random noise
as measured in an FM fiber optic link with 8 dB of
optical attenuation.
Figure 3 is a graphical plot of random noise
in an FM fiber optic link with 13 dB of optical
25 attenuation.
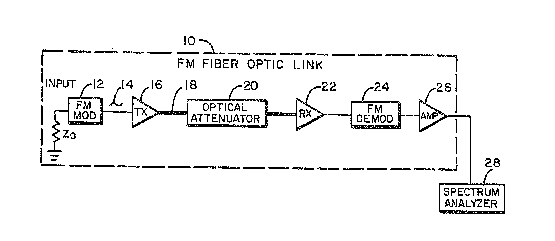
Figure 4 is a block diagram' of one
illustrative example of the invention for measuring
noise in a fiber optic link.
Figure 5 is a block diagram illustrating
5 active noise measurement of a fiber optic link as
employed by the invention.
Figure 6 is a block diagram illustrating one
embodiment of the invention for noise measurement
and control of transmitter power for a fiber optic
10 link.
Figure 7 is a graphical plot of the noise
performance of a conventional FM demodulator.
Figure 8 is a block diagram of an illustrative
example of a hypothetical switched network using
15 the noise measurement system of the invention.
Figure 9 is a block diagram illustrating one
example of an application of the noise measurement
system of the invention for determining noise power
in a fiber optic link.
20 Figure 10 is a block diagram illustrating the
measurement of composite noise of multiple
transmission paths and computation of noise for a
single portion of that mult~.ple transmission path
using the noise measurement system of the
25 invention.
v~~~~'~~~
- g
Figure 11 is a block diagram illustrating one
example of noise measurement for a fiber optic link
in series with a fiber optic link having a
previously measured noise characteristic which is
5 connected to the output of the noise measurement
system of the invention.
Figure 12 is a block diagram of one
illustrative embodiment of the invention showing an
application of the invention wherein the naise
10 performance of separate fiber optic links is
compared.
Figure 13 is a graphical plot of the effect of
fiber optic link loss on measured noise power.
DETAILED DESCRIPTION OF THE PREFE131~ED E3~BODYMENT
15 Before discussing in detail the elements which
comprise the invention, it is important to lay some
foundation for the discussion of the invention by
pointing out some important conventional FM
characteristics which lead to the theoretical basis
20 for the invention. Figure 7 illustrates the
relationship between demodulated output
signal-to-noise (vertical axis) and FM input
carrier-to-noise (C/N) in a conventional FM system
(horizontal axis). The carrier-to-noise ratio for
25 a particular transmission channel is dependent on
~~~a~~~~C.~
- g -
transmitted optical power in the conventional FM
system. As transmitted optical power increases,
carrier-to-noise also increases and the total noise
power measured at the base-band (demodulated)
5 output of the transmission system decreases. For
a particular transmission channel, there exists a
minimum signal-to-noise (S/N) requirement. For
many types of transmission systems (eg.,
television), the input/output signal levels are
10 defined, thus the noise generated on the
transmission channel controls the signal-to-noise
relationship. The requirements fox total noise can
be determined either by measurement at several
frequencies or a-priori knowledge of the output
15 noise power spectrum shape. For example, FM
without pre-emphasis produces an upper triangular
noise power spectrum.
In addition to measuring total noise power,
the shape of the noise power spectrum may also
20 yield significant information. While the high
carrier power condition has a noise floor
determined by the modulation and demodulation
circuitry, the low carrier power condition in a
fiber optic transmission system has a significant
25 noise power contribution from the fiber optic PIN
diode receiver. The receiver has a different shape
noise power spectrum than the modulation and
demodulation system. An example of this shape
change can be seen in Figures 1, 2 and 3 which are
5 examples of actual measured noise power spectrums
as measured by Honeywell Inc., Defense Avionic
Systems Division, Albuquerque, New Mexico. Figures
1, 2 and 3 depict the output noise power spectrum
for different carrier-to-noise conditions. The
10 invention recognizes, for the first time, that this
power spectrum shape change is an important
diagnostic and loop control tool because the noise
spectrum changes more rapidly near the system power
margin limit (i.e., the FM threshold or threshold
15 of "full improvement" of Figure 7).
Referring to Figure 7, one can see that for
the same transmitted carrier power (C/N), different
demodulated signal-to-noise ratio results are
obtained, depending upon the index of demodulation
20 ~ . Tn general, for higher ~ a higher signal
to noise is obtained. ~J also determines the
bandwidth of the FM carrier signal. Thus, it is
possible to trade bandwidth for transmitted power.
This is conventionally done in satellite FM
25 transponders. For a particular index of
~~~ s'~ ~3~
~s
modulation, higher transmitted power yields higher
demodulated signal to noise, or for a given signal
power at the output, less noise is acquired in the
transmission or the signal. Figure 7 shows that at
5 low carrier-to-noise conditions, a small increase
in C/N produces a large increase in S/N. Past a
threshold value, the output noise is linearly
proportional to input carrier power. This
relationship is different than digital systems
10 where a very small change in C/N can produce orders
of magnitude change in output Bit Error Rate (a
measure of digital system noise after clocking of
the data).
The invention recognizes, far the first time
15 with application to a fiber optic link system, that
through measurement of noise one can infer the
power output of the system's transmitters and loss
of the transmission system. The only test signal
required for making those determinations is the
20 noise already present in the system. This is true
because noise power in a fiber optic link is always
random noise and is entirely determined by the
amount of power in the system. It will be random
noise because of tha nature of the noise
25 generators. This is not true for other types of
s~~~~'~~~
_ 12 _
transmission systems, such as coaxial line
transmission systems, because other, non-random,
noise sources can be coupled into the system
through electromagnetic signal coupling.
5 Having described the theoretical basis for the
invention, we now turn to a detailed description of
the embodiment of the invention.
As shown in Figure 6, a system was designed to
measure noise power at the base-band output of an
10 FM optical transmission system. Ths system
comprises a fiber optic link 10 including an FM
modulator 12 which is electrically connected to a
transmitter 16. The transmitter 16 may be
preferably an LED, a laser, or other electro-optic
15 modulating device having variable output power.
Further, the transmitter 16 receives an electrical
signal from the FM modulator 12 and transmits a
light amplitude signal which is equivalent to the
electrical signal received from the FM modulator.
20 The light amplitude signal out of the transmitter
16 is carried by fiber 18 to the input of receiver
22. Receiver 22 converts the light signal to an
equivalent electrical signal and adds gain to make
the electrical signal larger. It is at the input
25 to receiver 22 that the lowest level signal in this
- 13 -
system is found. Receiver 22 also adds most of the
noise to the system. In one embodiment of the
invention constructed by Honeywell Inc., the
transmitter 16 was an 870 nanometer transmitter of
5 Type ODL-50 (and a modified device providing for
variable LED drive) and the receiver was an ODL-50
receiver which is available as a standard part from
AT&T Technologies Company. Those skilled in the
art will recognize that other equivalent components
10 and circuits are available to perform the functions
described herein in a variety of configurations.
This description is meant to serve only as an
illustrative example of one embodiment of the
invention for the purposes of describing the
15 invention.
Still referring to Figure 6 and further
describing the fiber optic link, an FM demodulator
24 receives the electrical signal output from the
receiver 22 and demodulates the signal to recover
20 the input signal plus the noise introduced by the
system. This demodulated signal i~ fed via an
electrical connection to amplifier 26, the last
element in the link, which increases the signal
gain to a more usable level and conditions the
25 signal to have an output impedance which is
- 14
compatible with the tunable bandpass filter 38.
The noise signal emerging from the tunable
bandpass filter has no do information. That is, it
has zero average value regardless of the noise
5 signal power which it contains. Passing this
signal through a detector produces a
uni-directional flow of current whose mean value is
a measure of signal strength. The particular
properties of the output will depend upon the input
10 signal characteristics and the characteristics of
the detector. For a simple square law detector,
sum and difference frequencies arise at the
detector output. The noise power of the signal is
thus distributed spectrally at baseband. To
15 recover a measure of the input signal average
power, a low pass filter is applied to the spectrum
at the detector output. The smaller the bandpass
of the low pass filter, the smaller the
fluctuations in signal output will be and therefore
20 the smaller the uncertainty of the measured average
noise power. Of course, as the bandpass of the low
pass filter decreases, more time is required to
average fluctuations so they have zero value.
Thus, there is a time of measurement consideration
25 in designing a noise measuremewt system.
_
Other information about the particular
characteristics of the recovered noise signal are
also available, but recovering them would require
special (not necessarily low pass) filters.
5 Because fiber optic systems are random noise
limited, we may expect to know apriori the quality
of noise and are mostly interested in the quantity
of noise. The particular question is how accurate
we can make the measurement of average noise power.
10 The accuracy of measuring noise power is
discussed by Ron Bracewell in The Fourier Transform
and Its Applications. Chapter 16. Second Edition
Revised. The accuracy limitation developed by
Bracewell is the ratio of rms noise fluctuation to
1~ the mean of the detected noise signal. This ratio
can be made arbitrarily small by limiting the
bandwidth of the tunable bandpass filter, and the
amount of averaging of the detected output signal
(i.e., the low pass falter bandwidth as best shown
20 in Figure 6).
Tunable bandpass filter 38 may be any
conventional tunable bandpass filter which selects
out those frequencies required for system noise
measurements. A's those sleilled in the art can
25 appreciate, particularly by reference to sample
~s~~~Dr~~~
- 16 -
Figures 1, 2 and 3, those frequencies'which are
desirable depend upon the FM fiber optic
transmission system being employed. Some
frequencies, as shown in Figures 1, 2 and 3 and by
5 comparison thereof, show a more sensitive change in
random noise power than others, resulting in more
sensitive and, therefore, more accurate measurement
of the change in noise. Precisely which frequency
will give the best results depends upon the
10 pre--emphasis and de-emphasis circuits used in a
typical FM system. (These circuits are not shown
but are well known in the art.)
Still referring to Figure 6, the output of the
tunable bandpass filter 38 is fed into the detector
15 and low pass filter block 36. The tunable bandpass
filter determines the bandwidth and center
frequency of the noise power to be measured. The
center frequency of the bandpass filter may be
tuned to a frequency where the index of modulation
a0 is small for maximum sensitivity, or the total
power spectrum of the noise signal can be measured
by iteratively measuring the noise at different
frequencies. The output of the detector and low
pass filter is then fed through an amplifier 34 to
25 an analog-to-digital converter 32. One skilled in
F
-
the art will recognize that the analog-to-digital
converter 32 is not critical to 'the invention
herein but is advantageously employed in this
illustrative example of the inventian as a means to
5 conveniently manipulate system noise performance
information. From the analog-to-digital converter
32, the system performance noise information is fed
to controller 30.
The controller uses the information on the
10 amount of received noise power by comparing it to
a selected value at which the system is designed to
be operated. The amount of noise which is allowed
compared to the amount of noise which is received
allows for optimization of either signal quality
15 (lower noise transmission) or power dissipation in
the emitting device (which corresponds to
reliability and life). Consider, for example, a
system whivh uses this transmission media for the
transmission of digital data as for example is done
20 with a modem over the switched telephone network.
The modem requires a certain bandwidth and signal
to noise in the transmission channel to transmit
with a particular bit error rate (EER). Increasing
'transmitted power beyond what is required to obtain
25 this BER produces a generally useless improvement
_ is
in BER because the BER already represents
essentially perfect transmission. In this
instance, the controller would probably decrease
the transmitted power until it was just sufficient
5 to maintain the transmission noise characteristics
required. In another application, such as the
transmission of video, there may be particular
interest in a lower noise image. In this case, the
improvement which may be obtained from higher power
10 transmission is noticeable but produces diminishing
returns beyond a certain signal to noise. The
controller might pick an intermediate operating
condition so as to obtain better signal quality,
but with improved LED lifetime and reduced power
15 dissipation. Because the output optical power of
LED devices is expotentially related to input
current, there is substantial opportunity for
improvement with small decreases in the amount of
optical power required. Because all fiber optic
20 systems are designed to have some power margin,
this power reduction capability should'be commonly
available.
The controller 30 may be any type of
intelligent controller such as a microcomputer, CPU
25 or custom designed logic circuit. In one
~~~~"~~~
_ lg _
embodiment of the invention, controller 30 also may
optionally include LED drive line 50. In
operation, the LED drive line 50 would control the
power output level of the transmitter based upon
5 noise performance measurements received lay the
controller. In yet another embodiment of the
invention, the controller may also include a high
voltage APD control line 52 for controlling the
output voltage of the receiver 22. As shown in
10 Figure 6, one embodiment of the invention may also
optionally include a memory device 40 for storing
historical noise measurement data. Such a memory
device may be used to track system performance as
well as to provide information on individual links
15 which could be used by an operator desiring to
select, for example, the lowest noise link in a
system of fiber optic links. By checking the
information stored in the memory unit for each
fiber optic link in the system, if one were looking
20 for a link, for example, to put out a low noise
signal at low power, one could check the noise
performance parameters for each link in the system
selecting the link with the best set of parameters.
In operation, the system shown in Figure 6
25 accomplishes the required noise power spectrum
~~~~ ~'~~
measurements by first bandlimiting the output noise
signal from the amplifier 26, then converting it
into voltage which corresponds to the time averaged
noise power in the bandlimited noise signal, which
5 is the output of detector and low pass filter 36.
The voltage corresponds to the noise power in a
particular frequency band with a frequency as
indicated by the power spectrum measurements of an
actual channel, as shown in Figures 1, 2 and 3. As
10 transmitted optical power is increased, the output
voltage will vary as shown in Figure 13, which is
based upon data taken from Figures 1, 2 and 3.
This voltage is digitized and passed to the
controller 30. Tn one embodiment of the invention,
15 the controller 30 may adjust the LED drive current
at the transmitter 16 to increase or decrease the
optical output power to obtain the desired noise
level at the output of the fiber optic link 10.
Since the system will not normally operate at worst
2A case conditions, the optical output power of the
transmitter can be reduced to a level compatible
with the current operating conditions of the fiber
optic link. This reduces the amount of power
required by the transmitter 16.
_
Another feature of the invention's noise
measurement circuit is the ability to determine the
operating power margins of each fiber optic link in
a network of fiber optic links. These operating
5 margins are determined by the optical power needed
to obtain a given signal- to-noise compared to the
optical power available. By recording the results
of noise power measurements in memory for several
fiber optic links at selected time intervals,
10 system operation and maintenance may be enhanced.
Storing the performance of each FoL in a network of
FOLs provides for accumulation of a performance
history that can be correlated to flight conditions
and maintenance actions. Thug, maintenance
15 requirements can be accurately predicted. Where
ineffective maintenance has occurred, the need for
additional effort can be indicated. Also the time
history of performance of the link can help to
indicate the nature of the current problem. For
~0 example, slowly increasing noise might indicate
aging of the LED transmitter whereas an abrupt
change in performance would indicate an external
action upon the system (eg. dirt introduced into a
connector pair during a demating/mating operation).
- 22 -
Another example of controller application is
to improve operating performance by using measured
noise power levels of alternate transmission paths
to select the path which provides the lowest noise
S power. Alternatively, system reliability may be
enhanced by selecting the lower noise path and
reducing launched optical power, therefore,
minimizing LED power dissipation (i.e., junction
temperature). To improve maintenance, links are
1~ prioritized for maintenance according to their
remaining power margins. Thus, a fiber optic link
whose connectors have been contaminated by scoring
or dirt will be flagged automatically for
maintenance because of an increase in LED (or other
Z5 optical driver with modulable power outputs such as
a laser) drive current recyuired to obtain a
constant signal-to-noise ratio.
By measuring noise on transmission links
successively, noise measurements on entire
0 transmission systems can be performed using a noise
measurement system located only in one location.
An illustrative example of this method is shown in
Figures 8 through 12. For example, to compute the
noise power associated with each of the full duplex
a 23 -
.fiber optic links shown in the switched network of
Figure 8, one can proceed as described below.
1. Dieasure the noise for FOL #1 with an LFD
transmitter located at switch 2 and a receiver
5 located at switch 1 by terminating the input of a
voltage controlled oscillator (VCO) and driving FOL
#1 as shown in Figure 9.
2. As shown in Figure 10, a signal may then
be sourced at switch 1 which traverses FOL #1 from
10 switch 1 to switch 2. The signal is then looped
back on the same link. Measured noise in step 1
was on this link and in this direction of
transmission. Next, the total noise is measured as
shown in Figures ZO and as given by the equation:
15 Measured Noise Power = NFOL1L + NFOL1R
where NFOL1L is the noise power in fiber optic link
number 1. when transmitting from switch 2 to switch
1 and NFOL1R is the noise power in fiber optic link
number 1 when transmitting from switch 1 to switch
20 2. When the noise contributed from the link
measured in step 1 is subtracted from the noise
contributed by the link in step 2, the noise of the
link under test is obtained. Those skilled in the
art will appreciate that some apriori knowledge of
25 the noise characteristics of the modulator and
~~~~'~'~~~
demodulator used in this process will enhance
accuracy.
3. FOL #2 can be tested similarly to FOL #1
using Voltage Controlled Oscillators (VCOs) at
5 switch 2 and switch 1 or it can be tested using a
VCO source at switch 1 only by using FOL #1 as a
known noise communications link.
4. Testing FOL #3 requires a VCO at switch 3
as sho~em in Figure 11. The method is similar to
10 measurement of FOL #1 for a transmitter at switch
2 and a receiver at switch 1. The total noise
power measured minus the noise power contributed by
FOL #1 is the noise at FOL #3. The opposite
direction of transmission on FOL #3 is measured
18 similarly to the transmission from switch 1 to
switch 2 on FOL #1 as shown in Figtare 10.
As will be appreciated by those skilled in the
art, the testing of multiple fiber optic links in
a transmission and distribution system from a
20 single test point, shown as 60 in Figures ~ through
11, can be accomplished using the noise measurement
system 62 of the invention, as described above with
reference to Figure 6 and the existing switches in
a typical fiber optic transmission and distribution
25 system.
- as -
In one embodiment of the system, the
controller as shown in Figure 6 may also store the
noise levels associated with each FOL in memory ~0.
As illustrated in Figure 12, storing the noise
5 level in memory enables the system to compare the
noise levels of several fiber optic lengths. In a
system where alternative paths exist for
transmitting a signal, the routing system can
select the FOL with the lowest noise using the
10 stored noise measurement data. Transmission on the
FOLs with the lowest loss will require the lowest
transmitter powers. The controller 30 may also
compare the present noise level of a FOL with a
reference noise level. An increase in noise level
15 above the reference is indicative of link
performance and may be used to determine
maintenance intervals of the FOL. Noise levels may
also be logged in order to determine trends in link
performance for maintenance scheduling.
20 Tn fiber optic links, required transmitter
power is also affected by receiver sensitivity.
When an APD is used far a detector, optimum
avalanche gain is a sensitive function of
temperature. High voltage regulation and set
25 point, being determined mostly by receiver
c~~~n~'~~~
26
temperature and design, affect the system noise.
There is an optimum value of avalanche gain for a
given system and temperature. The optimum value is
selected by controlling the high voltage input.
5 Thus, system noise measurement can be used to set
and regulate avalanche gain in the receiver, as
shown in Figure 6. This can decrease the
regulation requirements of the BPD high voltage
power supply and eliminate the need for sensing
10 receiver temperature or, alternatively,
implementing open loop control of the high voltage
drive as a function of temperature.
Referring now to Figure 12, an alternative
embodiment of a fiber optic transmission and
Z5 distribution system using the noise measurement
system of the invention is shown. The system in
Figure 12 includes an FM fiber optic link 10 as
described above with respect to Figure 6 and a
controller, analog-to-digital converter, amplifier,
20 detector and low pass filter, tunable bandpass
filter and memory as employed by the system shown
in Figure 6. Connected between the output of the
amplifier 26 and the input of the tunable bandpass
filter 38 is.a switch 70 with a first and second
25 input, the first input 72 being connected to the
~~~~'a~c~~.3
output of amplifier 26 and the second' input 74
being connected to the output of a second fiber
optic link 100 which is comprised of the same type
of elements as FOL 10. In such a system, the
5 historic. noise parameters for each fiber optic link
may be stored in the memory 40 and compared in the
controller 30 in order to, for examgle, optimize
the routing of signals through the system at any
given point in time. Note that there is only one
9.0 measurement system for a plurality of fiber optic
links. The illustrative example of an embodiment
of this system as shown in Figure 12 is not limited
to two such fiber optic links but may, as will be
recognized by those skilled in the art, through the
15 use of switches present in a transmission and
distribution system, be configured to adapt to a
plurality of fiber optic links, such as is
exemplified in Figures 8 through 11 as described
above.
20 The test results in Figures 1, 2 and 3 were
obtained using the experimental setup shown in
Figure ~. The circuit of Figure 4 comprises a
fiber optic link 10 as described abo~re with
reference to Figure 6, but, instead of 'the noise
25 measurement apparatus of the invention as employed
~~~.~'~m~~~
_ 28
in Figure 6, a spectrum analyzer 28 is substituted
for that noise measurement apparatus. Also, the
input to the FM modulator is terminated by
impedance Zo which is a very low impedance source
5 having very low noise. The optical attenuator 20
simulates losses in the fiber optic link path such
as the loss from connectors, extra fiber, dirt or
contamination on connectors, irregularities such as
kinks in the fiber and other physical factors which
10 may cause variations in transmission. As explained
above, receiver 22 adds most of the noise to the
system and receives the attenuated signal from the
optical attenuator 20. The demodulator 24 converts
the FM carrier into a base-band signal which, in
15 this example, will be a DC level with the added
noise. The added noise from the system has two
interesting qualities. First of all, it has a
total power. Secondly, the noise of the system has
a power spectral distribution of energy which may
20 be as significant as the amount of noise present in
the system. The noise acts the same as if a test
signal had been introduced into the system in the
sense that one can measure the noise which is
introduced by the optical attenuation present which
25 alters the transmission levels. By using the noise
a~~~~'~~~
as a "test signal", one can draw conclusions about
the transmission system. Figures 1, 2 and 3 show
noise measurements on a laboratory fiber optic
transmission system with different amounts of
5 optical attenuation introduced into the
transmission media. Figure 7 explains the basic
shape of these noise power spectrum measurements
because, at different frequencies, there are
different indices of modulation. At low
1~ frequencies, there are high indices of modulation
signified by ~z. The result of such high indices
of modulation is that with very low power in the
carrier signal, ane can obtain a very high
signal-to-noise ratio. In the measurement of the
15 data for Figures 1, 2 and 3, by the equipment shown
in Figure 4, the spectrum analyzer was set at a
resolution bandwidth of 10 KHz and a video
bandwidth of 1Q Hz, which corresponds to the
tunable bandpass filter and low pass filter,
2Q respectively, used in one embodiment of the
invention as shown in Figure 6. In this particular
experiment, the spectrum analyzer used was an
HP8568B as manufactured by Hewlett Packard
Incorporated, although any conventional spectrum
- 30 -
analyzer may be employed for duplicating the
results of this experiment.
Now referring to Figure 5, another alternative
application for the noise measurement system of the
5 invention is shown. ~ configuration similar to the
configuration shown in Figure 5 may be employed to
do active noise measurement in a fiber optic link.
By sourcing a test signal, for example, from test
signal generator 80 into video switch 82 to
10 transmitter 84 which outputs an optical signal at
an adjustable power level through FOL 86 into pylon
or switch node 88. Switchable loop back 90 may
switch back the signal through ,switch node 88
through FOL 92 and into video switch 82 where it
15 may be routed to noise measurement device 110.
Noise measurement device 110 may be apparatus as
described with respect to Figure 6. The results of
noise measurement device 110 may then be routed
through switch control processor 102 which would
20 operate on the output of noise measurement device
210 to adjust the level of transmission power
output by the transmitter 84.
Through employment of a system such as is
shown in Figure 5, one can change the operating
25 conditions of the FM modulator in a fiber optic
~~~.~'~~~
3g
link and monitor the system noise by introducing a
test signal. At the noise measurement apparatus
110, the test signal could be, fox example,
subtracted out and the noise in the system should
5 remain the same as without the signal. zf there is
a change in the noise level, this would help to
explore a problem in a modulator or demodulator or
to locate a fault in a modulator or demodulator in
the system, for example. Figure 5 is intended to
10 show an illustrative example of such an active
noise measurement system. Those skilled in the art
will readily recognize that many variations of such
an active noise measurement system may be deployed
as, for example, with a plurality of more than two
15 fiber optic links and a plurality of loop back
signals and/or video switches.
This invention has been described herein in
considerable detail in order to comply with the
Patent Statutes and to provide those skilled in the
20 art with the information needed to apply the novel
principles and to construct and use such
specialized components as are required. However,
it is to be understood that the invention can be
carried out by specifically different equipment and
25 devices, and that various modifications, both as to
a~~~~'7~~
the equipment details and operating procedures, can
be accomplished without departing from the scope of
the invention itself.
What is claimed is: