Note : Les descriptions sont présentées dans la langue officielle dans laquelle elles ont été soumises.
~o~o~~~
BCANNIN(3 DENSITOMETER
BACKGROUND OF THE. INVENTION
Field of the Invention.
The invention relates to apparatus and methods associated
with color measurement and analysis technology and, more
particularly, to apparatus and methods for automated color
density measurements of color "control bars" and the like
obtained during a scanning procedure.
Description of Related Art.
It is well known that the term "color" as applied to
electromagnetic radiation represents in part the relative energy
distribution of radiation within the visible spectrum. That is,
light providing a stimulus to the human eye, and having a
particular energy distribution, may be perceived as a
substantially different color than light of another energy
distribution. Concepts relating to the characteristics of color
and light waves are the subject of numerous well-known texts,
such as Princ~les of Color Technology, Meyer; Jr. and Saltzman
(Wiley 1966), and The Measurement of Appearance, Hunter and
Harold (Wiley 2nd Ed. 1987).
In recent years, the capability of maintaining the "quality"
of color has been of significant importance in various
industries, such as, for example, the fields of graphic arts,
photography and color film processing. For purposes of
performing sample testing and other activities in furtherance of
maintaining color quality, it is necessary to first determine an
appropriate means for "measuring" and "describing" color. A
substantial amount of research has been performed during the past
fifty years with respect to appropriate methods and standards for
color measurement and description.
For purposes of describing color, and from a purely
"physical" point of view, the production of color requires three
things: a source of light; an object to be illuminated; and, a
means for perceiving the color of the object. The means for
perceiving the color can be the human eye and brain or,
alternatively, electrical and electromechanical apparatus such as
a photosensitive detector and associated auxiliary devices
utilized for detecting light. In general, it is desirable to
provide a means for measuring color so as to assess the manner in
which an image will appear to a human observer, or the manner in
which an image will perform in a photographic or other type of
reproduction printing operation.
Although human perception and interpretation of color can be
useful, reliance on such perception and interpretation can be
highly subjective. That is, human nature may cause one person's
perception of the color of a particular object to be
substantially different from the perception of another. I
addition, eye fatigue, age and other physiological factors can
influence color perception. Further, visual human perception is
often insufficient for color description. For example, certain
object samples may be visually perceived under one light source
as substantially "matching", and yet may actually have very
different spectral characteristics and may be perceived as "non-
matching" under another light source. In view of the foregoing,
it is desirable to employ color measurement and description
techniques which are objective in nature, and capable of
differentiating among object samples having different color
characteristics.
Various devices have been developed and are widely utilized
to measure and quantitatively describe color characteristics of
object samples. Many of these devices provide measurements
related to the spectral characteristics of the samples.
Described simplistically, when light is directed onto an object
sample to be measured for color, the object may absorb a portion
of the light energy, while correspondingly passing through or
reflecting (if the object is opaque) other portions of the light.
The color characteristics of the object sample will depend in
part on the spectral characteristics of the object. That is, the
effect of an object on light can be described by its spectral
transmittance or reflectance curves (for transparent or
reflective materials, respectively). These spectral
characteristic curves indicate the fraction of the source light
at each wavelength transmitted by or reflected from the
materials. Such curves are a means for describing the effect of
an object on light in a manner similar to the use of a spectral
energy distribution curve for describing the characteristics of a
source of light. Instruments utilized for generating such
spectral characteristics curves are typically referred to as
spectrophotometers.
In accordance with conventional optical physics, it is known
that the proportion of light incident to an object sample and
absorbed by such a sample is independent of the light intensity.
Accordingly, a quantitative indication of the spectral
characteristics of an object sample can be defined as the
"transmittance" or "reflectance" of the sample. That is, the
transmittance of a substantially transparent object can be
defined as the ratio of power transmitted over light power
incident to the sample. Correspondingly, for a reflective object
sample, the reflectance can be defined as the ratio of power
reflected from the object over the incident light power.
For collimated light, these ratios can be expressed in terms
of intensities, rather than power. Furthermore, because of the
-2-
~0401~'~
nature of transmittance/reflectance and the optical
characteristics of the human eye, it is advantageous to express
these ratios in logarithmic form. Accordingly, one parameter
widely used in the field of color technology for obtaining a
quantitative measurement or "figure of merit" is typically
characterized as optical "density." The optical density of an
object sample is typically defined as follows:
Optical Density = D = -logo T or -logo R (Equation 1)
where T represents transmittance of a transparent object and R
represents reflectance of a reflective object. In accordance
with the foregoing, if an object sample absorbed 90% of the light
incident upon the sample, the reflectance would ideally be 10%.
The density of such a sample would then be characterized as
unity. Correspondingly, if 99.9% of the light were absorbed, the
reflectance would be 0.1% and the density would be 3. Similarly,
the density of an "ideal" object reflecting 100% of the light
incident upon the object would be 0.
To provide a relative measurement of color, it is possible
to utilize the principles of optical density, without requiring
measurement or knowledge of the absolute values of total incident
light intensity or reflectance. That is, for example, it is
possible to obtain relative color measurements among a series of
object samples by utilizing a particular geometric configuration
of light, object sample and reflectance or transmittance detector
for each measurement, and standardizing the measurements in some
desired manner.
In brief summary, optical density is a measurement of the
modulation of light or other radiant flux by an object sample,
such as a particular "patch" of a color "control bar"
conventionally employed in the printing and graphic arts
industries. Density measurements provide a means to assess the
manner in which an image will appear to a human observer, or the
way an image will perform in a film processing operation.
Density measurements can be utilized to produce sensitometric
curves to evaluate various printing and reproduction
characteristics, as well as utilization to control various
photographic operations, such as film processing.
For purposes of measuring optical densities, it is well
known to employ a device typically characterized as a
"densitometer." These densitometers are often categorized as
either "reflection" densitometers, employed for optical density
measurements of reflective objects, or are otherwise
characterized as "transmission" densitometers. Transmission
-3-
densitometers are employed for determining spectral
characteristics of various light transmitting materials.
Densitometers are utilized in various industries for
performing a variety of functions. For example, densitometers
can be conveniently employed in printing and graphic arts
applications. Processes associated with these applications will
be described in greater detail in subsequent paragraphs herein.
To assist in describing the principles of densitometer
apparatus, in which certain concepts of the present invention may
be employed, FIG. 1 illustrates a simplified schematic
representation of a known reflection densitometer configuration
1. Densitometer apparatus of the type shown in FIG. 1 are
characterized as reflection densitometers, and utilized to
provide color density measurements of reflection materials as
previously described.
Referring specifically to FIG. 1, and to numerical
references therein, the densitometer apparatus 1 includes a light
source unit 2 having a source light 4. With respect to optical
density measurements in printing, color film processing, and
other industrial fields, various standards have been developed
for densitometer light source illuminants. For example,
densitometer light source standards have previously been
described in terms of a tungsten lamp providing an influx from a
lamp operating at a Planckian distribution of 3000° K. Other
suggested standards have been developed by the American National
Standards Institute ('.'ANSI") and the International Organization
for Standardization ("ISO"). These source light densitometer
standards are typically defined in terms of the spectral energy
distribution of the illuminant. The source light 4 preferably
conforms to an appropriate standard and can, for example,
comprise a filament bulb meeting a standard conventionally known
in the industry as 2856K ANSI. Power for the source light 4 and
other elements of the densitometer apparatus 1 can be provided by
means of conventional rechargeable batteries or, alternatively,
interconnection to AC utility power for many known densitometers.
The source light 4 projects light through a collimating lens
6 which serves to focus the electromagnetic radiation from the
source light 4 into a narrow collimated beam of light rays.
Various types of conventional and well-known collimating lenses
can be employed. The light rays transmitted through the
collimating lens 6 project through an aperture 8. The dimensions
of the aperture 8 will determine the size of the irradiated area
of the object sample under test.
Various standards have been defined for preferable sizes of
the irradiated area. Ideally, the aperture 8 is of a size such
that the irradiance is uniform over the entire irradiated area.
-4-
~040~~~
However, in any physically realizable densitometer arrangement,
such uniform irradiance cannot be achieved. Current standards
suggest that the size of the irradiated area should be such that
irradiance measured at any point within the area is at least 90%
of the maximum value. In addition, however, aperture size is
typically limited to the size of the color bar or color patch
area to be measured, and is also sized so as to reduce stray
light.
The light rays emerging from the aperture 8 (illustrated as
rays 10 in FIG. 1) are projected onto the irradiated area surface
of an object sample 12 under test. The sample 12 may be any of
numerous types of colored reflective materials. For example, in
the printing industry, the sample 12 may be an ink-on-paper
sample comprising a portion of a color bar at the edge of a color
printing sheet. Alternatively, the sample 12 may be a control
strip employed in the color film processing industry.
As the light rays 10 are projected onto the object sample
12, electromagnetic radiation shown as light rays 14 will be
reflected from the sample 12. Standard detection configurations
have been developed, whereby reflected light is detected at a
specific angle relative to the illumination light rays 10
projected normal to the plane of the object sample 12. More
specifically, standards have been developed for detection of
reflected light rays at an angle of 45° to the normal direction
of the light rays 10. This angle of 45° has become a standard
for reflectance measurements, and is considered desirable in that
this configuration will tend to maximize the density range of the
measurements. In addition, however, the 45° differential also
represents somewhat of a relatively normal viewing configuration
of a human observer (i.e. illumination at a 45° angle from the
viewer's line of sight).
For purposes of providing light detection, a spectral filter
apparatus 16 is provided. The filter apparatus 16 can include a
series of filters 18, 20 and 22. The filters 18, 20 and 22 are
employed for purposes of discriminating the red, green and blue
spectral responses, respectively. To more fully explain, red
light is absorbed by a cyan ink, thereby providing a cyan color
appearance to the observer. Correspondingly, green light is
absorbed by a magenta ink, while blue light is absorbed by a
yellow ink. Further, each of the filters will tend to absorb
light energy at frequencies outside of the bandwidth
representative of the particular color hue of the filter. For
example, the red filter 18 for cyan indication will tend to
absorb all light rays, except for those within the spectral
bandwidth corresponding to a red hue. By detecting reflected
light rays only within a particular color hue bandwidth, and
-5-
~o~o~~~
obtaining an optical density measurement with respect to the
same, a "figure of merit" can be obi:ained with respect to the
quality of the object sample coloring associated with that
particular color hue.
It is apparent from the foregoing that the actual
quantitative measurement of color density or color reflectance is
dependent in substantial part on the spectral transmittance
characteristics of the filters. Accordingly, various well-known
standards have been developed with respect to spectral
characteristics of densitometer filters. For example, one
standard for densitometer filters is known as the ANSI status T
color response. The spectral response characteristics of filters
meeting this standard are relatively wide band (in the range of
50-60 namometers (nms) bandwidth) for each of the cyan, magenta
and yellow color hues. Other spectral response characteristic
standards include, for example, what is known as G-response,
which is similar to status T, but is somewhat more sensitive to
respect to yellow hues. An E-response represents a European
response standard.
Although the filters 18, 20 and 22 are illustrated in the
embodiment shown in FIG. 1 as the cyan, magenta and yellow color
shades, other color shades can clearly be employed. These
particular shades are considered somewhat preferable in view of
their relative permanence, and because they comprise the
preferred shades for use in reflection densitometer calibration.
However, it is apparent that different shades of red, green and
blue, or cyan, magenta and yellow, as well as entirely different
colors, can be utilized with the densitometer apparatus 1.
The spectral filters 18, 20 and 22 may not only comprise
various shades of color, but can also be one of a number of
several specific types of spectral response filters. For
example, the filters can comprise a series of conventional
Wratten gelatin filters and infrared glass. However, various
other types of filter arrangements can also be employed.
The spectral filters 18, 20 and 22 are preferably positioned
at a 45° angle relative to the normal direction from the plane of
the object sample 12 under test. In the particular example shown
in FIG. 1, each of these filters is utilized to simultaneously
receive light rays reflected from the object sample 12. Further,
although the particular example illustrated in FIG. 1 may include
a stationary object sample 12 and stationary apparatus 1, the
example embodiment of a densitometer apparatus employing
principles of the invention as described in subsequent paragraphs
herein can comprise a series of stationary object samples (in the
form of a color control bar) with movement of the densitometer
apparatus so as to "scan" the object samples. In this type of
-6-
arrangement, the spectral filter arrangement is continuously
moving during color measurements of the object samples. In other
known densitometers, the spectral filter measurements may be
obtained in sequence, rather than simultaneously, and with or
without relative movement of the object samples and densitometer
apparatus.
As further shown in FIG. 1, the portion of the reflected
light rays 14 passing through the filters 18, 20 and 22 (shown as
light rays 24, 26 and 28, respectively) impinge on receptor
surfaces of photovoltaic sensor cells. The sensor cells are
illustrated in FIG. 1 as sensors 32, 34 and 36 associated with
the spectral filters 18, 20 and 22, respectively. The sensors
32, 34 and 36 can comprise conventional photoelectric elements
adapted to detect light rays emanating through the corresponding
spectral filters. The sensors are further adapted to generate
electrical currents having magnitudes proportional to the
intensities of the sensed light rays. As illustrated in FIG. 1,
electrical current generated by the cyan sensor 32 in response to
the detection of light rays projecting through the filter 18 is
generated on line pair 38. Correspondingly, electrical current
generated by the magenta sensor 34 is applied to the line pair
40, while the electrical current generated by the yellow sensor
36 is applied as output current on line pair 42. Photoelectric
elements suitable for use as sensors 36, 38 and 40 are well-
known in the art, and various types of commercially available
sensors can be employed.
The magnitude of the electrical current on each of the
respective line pairs will be proportional to the intensity of
the reflected light rays which are transmitted through the
corresponding spectral filter. These light rays will have a
spectral distribution corresponding in part to the product of the
spectral reflectance curve of the object sample 12, and the
spectral response curve of the corresponding filter. Accordingly,
for a particular color shade represented by the spectral response
curve of the filter, the magnitude of the electrical current
represents a quantitative measurement of the proportional
reflectance of the object sample 12 within the frequency spectrum
of the color shade.
As further shown in FIG. 1, the sensor current output on
each of the line pairs 38, 40 and 42 can be applied as an input
signal to one of three conventional amplifiers 44, 46 and 48.
The amplifier 44 is responsive to the current output of cyan
sensor 32 on line pair 38, while amplifier 46 is responsive to
the sensor current output from magenta sensor 34 on line pair 40.
Correspondingly, the amplifier 48 is responsive to the sensor
current output from yellow sensor 36 on line pair 42. Each of
~04~~8~
the amplifiers 44, 46 and 48 provides a means for converting low
level output current from the respective sensors on the
corresponding line pairs to voltage level signals on conductors
50, 52 and 54, respectively. The voltage levels of the signals
on their respective conductors are of a magnitude suitable for
subsequent analog-to-digital (A/D) conversion functions. Such
amplifiers are well known in the circuit design art, and are
commercially available with an appropriate volts per ampere
conversion ratio, bandwidth and output voltage range. The
magnitudes of the output voltages on lines 50, 52 and 54 again
represent the intensities of reflected light rays transmitted
through the corresponding spectral filters.
Each of the voltage signal outputs from the amplifiers can
be applied as an input signal to a conventional multiplexes 56.
The multiplexes 56 operates so as to time multiplex the output
signals from each of the amplifiers 44, 46 and 48 onto the
conductive path 58. Timing for operation of the multiplexes 56
can be provided by means of clock signals from master clock 60 on
conductive path 62. During an actual density measurement of an
object sample, the densitometer 1 will utilize a segment of the
resultant multiplexed signal which sequentially represents a
voltage output signal from each of the amplifiers 44, 46 and 48.
The resultant multiplexed signal generated on the conductive
path 58 is applied as an input signal to a conventional A/D
converter 64. The A/D converter 64 comprises a means for
converting the analog multiplexed signal on conductor 58 to a
digital signal for purposes of subsequent processing by central
processing unit (CPU) 66. The A/D converter 64 is preferably
controlled by means of clock pulses applied on conductor 68 from
the master clock 60. The clock pulses operate as "start" pulses
for performance of the A/D conversion. The A/D converter 64 can
be any suitable analog-to-digital circuit well known in the art
and can, for example, comprise 16 binary information bits,
thereby providing a resolution of 65 K levels per input signal.
The digital output signal from the A/D converter 64 can be
applied as a parallel set of binary information bits on
conductive paths 70 to the CPU 66. The CPU 66 can provide
several functions associated with operation of the densitometer
apparatus 1. The CPU 66 can be utilized to perform these
functions by means of digital processing and computer programs.
In addition, the CPU 66 can be under control of clock pulses
generated from the master clock 60 on path 72. However, a number
of the functional operations of CPU 66 could also be provided by
means of discrete hardware components.
In part, the CPU 66 can be utilized to process information
contained in the digital signals from the conductive paths 70.
_g_
2~4~~~~
Certain of this processed information can be generated as output
signals on conductive path 76 and applied as input signals to a
conventional display circuit 78. The display circuit 78 provides
a means for visual display of information to the user, and can be
in form of any one of several well-known and commercially-
available display units. However, in an embodiment of a scanning
densitometer in accordance with the invention as described in
subsequent paragraphs herein, a display unit may not be directly
associated with the densitometer apparatus, but instead color
measurement data may be transmitted from a densitometer-based
processor to another computer system, where the other computer
system includes means for analyzing and/or displaying or printing
data associated with the color measurements.
In addition to the CPU 66 receiving digital information
signals from the conductive paths 70, information signals can
also be manually input and applied to the CPU 66 by means of a
manually-accessible keyboard circuit 80. The user can supply
"adjustments" to color responses and various data parameters by
means of entering information through the keyboard 80. Signals
representative of the manual input from the keyboard 80 can be
applied as digital information signals to the CPU 66 by means of
conductive path 82. Again, however, in an embodiment of a
scanning densitometer in accordance with the invention as
described in subsequent paragraphs herein, a keyboard or similar
data entry device may not be directly associated with the
densitometer-based processor. Instead, data input to the
densitometer apparatus may be provided by data entry devices
associated with separate and/or remote computer systems having a
communications interface with the densitometer apparatus 1.
Concepts associated with providing a communications interface
between a densitometer-based computer and an external or remote
computer system are disclosed in Peterson et al, U.S. Patent No.
4,591,978 issued May 27, 1986.
The previously described concepts of densitometry and
densitometer apparatus in general can be of primary significance
in various industries, including the printing and graphic arts
industries. For example, densitometers conventionally known as
"scanning" densitometers are typically utilized for analysis of
color control bars printed on press sheets so as to analyze the
color printing and reproduction, and ensure maintenance of color
quality. More specifically, known scanning densitometers can
sequentially measure color bar "patches" comprising color data
representative of solids, screened areas, overprints, etc.
Through analysis of these color patches, the densitometers can
typically be utilized to provide specific density data, in
addition to analyzed data such as density differences and the
_g_
~
CA 02040187 1999-09-23
like. Other parameters or quantities which may be obtained
through use of scanning densitometers include dot
percentage/gain, relative print contrast, trappings, grayness,
hue error and various statistical production data. Known and
commercially available scanning densitometer arrangements include
_ apparatus known as the Autosmart"' Densitometer marketed by Cosar
Corporation, the Gretag D732 Densitometer marketed by Gretag
Limited and the Tobias SCR Densitometer marketed by Tobias
Associates, Inc.
The known scanning densitometers typically include
relatively complex and large scanning "heads" comprising the
electronics and similar apparatus required for optically
obtaining color density data. In addition, with a scanning
densitometer, the head is typically mounted in a manner so that
it is movable along a carriage or the like so as to sequentially
obtain color density measurement data from a series of color bar
patches positioned on a stationary print sheet. With many of the
known scanning densitometers, the scanning heads are continuously
in electrical communication with computer processor and memory
configurations so as to transmit parameter data and color
measurement data between the scanning head electronics and a
separate and/or remote computer system. To provide for this
electrical communication, many of the known scanning
densitometers include cabling interconnections between the
scanning head and separate computer-based apparatus.
The electrical cabling required for communication
interconnections between the scanning head and separate computer-
based apparatus can be of substantial weight. Accordingly, to
provide for movement of the scanning head, several known
densitometers require relatively complex track, gearing and motor
control arrangements for providing the scanning head movement in
response to externally initiated commands. The known systems can
require a substantial amount of power in view of their motor-
driven and cabling characteristics. Also, for purposes of
obtaining accurate measurements, many of the known densitometers
utilize vacuum systems or other relatively elaborate "hold down"
arrangements for purposes of clamping the color bar paper along a
flat surface during the measurement cycles. In view of all of
the foregoing requirements, many of the known densitometers are
also relatively expensive.
Summary of the Invention
r
These and other problems of the prior art are overcome or at least
I mitigated in accordance with this invention by means of a densitometer
for measuring color characteristics of an object sample under test
which comprises an autonomously operating densitometer head
-10~
~~4~1~~
movably supported on a transport assembly adjacent the object
sample. The densitometer head is connected to an interface unit,
which provides an interface to a host computer, only when the
head is within a predetermined distance of the interface unit.
The autonomous head includes an optical scanner and is responsive
to a start signal from the interface unit to move along the
transport assembly to generate and store data representative of
color characteristics of the object sample and is further
responsive to an input signal from the interface unit to transfer
stored data to the interface unit. In accordance with one
specific embodiment of the invention, signals are transmitted
between the interface unit and the autonomous head, when
positioned within the predetermined distance of the interface
unit, by means of optical couplers in the interface unit and in
the head. An electrical connector terminal on the autonomous
head and a corresponding terminal on the interface unit provide
electrical contact when the head is positioned adjacent the
interface unit. The head responds to the start signal, received
while positioned within the predetermined distance of the
interface unit, by activating an electric motor which propels the
head along the transport assembly and away from the interface
unit. An internal battery provides the electrical power for the
motor and the head includes a charging circuit for charging the
battery when the head is connected to the interface unit.
Advantageously, in accordance with this invention, a relatively
uncomplicated and inexpensive densitometer is provided which
avoids the use of electrical cabling required in prior art
systems for communications between a stationary computer
interface and a moving head.
In accordance with one aspect of the invention, the
transport assembly comprises a pair of spaced-apart,
substantially parallel transport bars for slidably engaging the
autonomously operating densitometer head and a mechanical linkage
for raising and lowering the transport bars. Advantageously, an
object sample to be tested may be positioned under the transport
bars when in a raised position and the transport bars may be
lowered to provide a clamp to hold the object sample in a flat
position and to bring the densitometer head in close proximity to
the object sample. In one specific embodiment of the invention,
the mechanical linkage for raising and lowering the transport
bars comprises a pair of rotatable shafts, each supporting one of
the transport bars, a lever arm attached at each end of each of
the shafts, and a pair of links interconnecting pairs of lever
arms at opposite ends of the shafts, for concomitantly raising
and lowering opposite ends of the support bars. At least one of
the support bars is provided with a rack having a plurality of
-11-
spaced-apart gear teeth and the motor in the densitometer head is
provided with a pinion gear for engagement with the gear teeth to
provide positive engagement and con:aistent displacement of the
head along the transport assembly for each revolution of the
motor.
In accordance with one aspect of the invention, a limit stop
is disposed along the transport assembly and a limit switch in
the head is operated by engagement with the limit stop. Control
circuitry in the head is responsive to operation of the limit
switch to reverse direction of the motor to cause the head, which
is initially moving away from the interface unit, to return to
the interface unit. The control~circuitry is further responsive
to engagement of an electrical connector on the head with a
corresponding electrical connector on the interface unit to stop
the motor when the head has returned to the interface unit and to
transmit a control signal to the host computer via the interface
unit. The control circuitry is further responsive to a signal
from the host computer to transmit data stored during the
scanning run.
In accordance with one aspect of the invention, the
densitometer head comprises two data memories, one for storing
parameter data which may be used in several scanning operations
to operate on collected data representative of color
characteristics of an object sample under test. Another memory
is provided for storing output data for transmission to a host
computer upon completion of a scanning operation.
Advantageously, the memory for storing parameter data may be a
nonvolatile memory which is not affected by interruptions in
electrical power.
Brief Descriptionof the Drawings
The invention will now be described with respect to the
drawings, in which:
FIG. 1 is a prior art illustration of a partially schematic
block diagram of a densitometer apparatus for measuring color
densities;
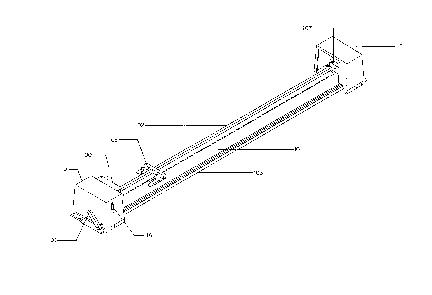
FIG. 2 is a perspective view of a scanning densitometer in
accordance with the invention;
FIG. 3 is a perspective view of the scanning densitometer in
accordance with the invention illustrated in FIG. 2, but showing
greater detail of the docking end and stop apparatus of the
scanning densitometer;
FIG. 4 is an exploded view of the densitometer head of the
scanning densitometer in accordance with the invention shown in
FIGS. 2 and 3;
-12-
20401~rr
FIG. 5 is a partially exploded view of portions of the
optical elements associated with the scanning densitometer in
accordance with the invention illustrated in FIGS. 2-4:
FIG. 6 is a block diagram representation of certain of the
circuitry of the scanning densitometer shown in FIG. 2:
FIG. 7 is a sequence diagram of certain of the functions
performed by the processor apparatus of the scanning densitometer
shown in FIG. 2 in accordance with the inventions and
FIG. 8 is a block diagram illustration of certain of the
charge and power management circuit of the scanning densitometer
shown in FIG. 2.
DESCRIPTION OF THE PREFERRED EMBODIMENT
The principles of the invention are disclosed, by way of
example, in a scanning densitometer as described in subsequent
paragraphs herein and illustrated in FIGS. 2-8. FIG. 2 is a
perspective view of a scanning densitometer for obtaining color
density measurements from colored samples such as color bars
commonly used in color printing. The illustrative arrangement of
FIG. 2 includes a densitometer head 100 and a densitometer head
transport system 101 including a pair of parallel transport bars
102, 103. A sample sheet may be positioned under transport bars
102, 103 and densitometer head 100, which is self-propelled, is
adapted to move over the sheet along transport bars 102, 103 up
to a distance defined by an end limit stop 105, to obtain color
measurement data. Transport bars 102, 103 may be raised and
lowered by means of a link mechanism contained within end
housings 110 and 112 and operated by lever 106, allowing a sample
sheet to be clamped under the bars for measurement purposes.
Housing 110 is positioned at one end of parallel transport bars
102, 103, referred to herein as the "docking end." Housing 112
is disposed at the other end of the parallel transport bars 102,
103 and contains link mechanism 107 shown in partial view in FIG.
2 and explained in greater detail with reference to FIG. 3.
Operation of lever 106 on housing 110 allows transport bars 102
and 103 to be raised for the purpose of inserting a sheet having
a color bar, or the like, to be measured by the densitometer head
100. The housing 110 contains a communication interface for
providing an interface to the densitometer head 100 when it is at
the docking end in the housing 110. A plurality of cable
connectors 115 on housing 11o allow for the provision of
electrical power to the densitometer head 100 and provide a
control and data transfer interface when head 100 is at the
docking end.
FIG. 3 is a more detailed perspective view of the docking
end without the housing cover and of transport bars 102, 103. A
-13-
printed circuit interface board 203 comprises three cable
connectors, 205, 206 and 207, an infrared optical coupler 201
which interfaces with corresponding optical coupler 202, and an
electrical connector 208. When densitometer head 100 is docked
at the docking end, its optical coupler 202 will be aligned with
optical coupler 201, allowing optical signals to be communicated
between the interface board 203 and densitometer head 100.
Optical couplers 201, 202 are standard well-known devices.
Coupler 202 comprises two openings, shown at 204. An optical
receiver is aligned, internal to densitometer head 100, with one
of the two openings 204 for receiving optical signals and
converting the received optical signals to electrical signals for
use by electronic circuitry within the densitometer head 100.
The other of the two openings 204 is aligned with an optical
transmitter, internal to densitometer head 100, which is
responsive to electrical signals from circuitry within the
densitometer head to generate optical output signals. Optical
coupler 201 is similarly provided with two openings (not shown in
the drawing). One of the two openings of optical coupler 201 is
aligned with the receive opening of optical coupler 202 and
includes an optical transmitter responsive to electronic signals
received from conductors on interface circuit board 203 to
generate optical signals to be received by optical coupler 202.
In an analogous fashion, optical coupler 201 has an opening
aligned with the transmit opening of optical coupler 202 and
includes an optical receiver for converting optical signals
received from the densitometer head to electrical signals for
transmission on conductors of interface board 203. Connector 205
provides control input from a foot pedal or other control switch
and is connected via printed circuit connections (not shown in
the drawing) on circuit board 203 to solenoid 220. Connector 206
is similarly connected via printed circuit connections (not shown
in the drawing) on board 203 to optical coupler 201 and is used
for connection to an associated host computer (not shown in a
drawing). Connector 206 may also be connected to solenoid 220
for control of the solenoid from the host computer. Solenoid 220
is mounted on platform 221 attached to plate 216, and at a higher
elevation than base plate 230 of densitometer head 100. A
standard RS 232 data interface may be used for communications
between the densitometer head 100 and the host computer.
Connector 207 is an electrical power connector which is used to
provide electrical power via circuit board 203 and optical
couplers 201 and 202 to a battery charging circuit within the
densitometer head 100.
Use of the densitometer in obtaining color density
measurements involves downloading certain information defining
-14-
2~4~~8~
parameters about the task to be performed, from the host computer
to densitometer head 100, via the RS 232 interface connector 206
and optical couplers 201, 202. A color sheet to be measured is
placed under the transport bars 102, 103 and one end of the
specific area to be examined, for example, the area of the color
bars on a printed sheet, is aligned with a pointer on the
densitometer head 100. The other end of the area to be examined
is aligned with a pointer 212 on the end limit stop 105, and one
side of the area to be examined is aligned with alignment bar
210, which is integral to transport bar 102. Thereafter, the
parallel transport bars, together with the densitometer head 100,
are lowered onto the sheet to be~measured by operation of
solenoid 220. The transport bars clamp the sheet in place to
provide a properly aligned smooth surface for measurement by
densitometer head 100. A signal, sent from the host computer to
the densitometer head 100 via optical connectors 201, 202, causes
an electrical motor internal to the optical densitometer head 100
to be started. The motor is provided with a pinion drive gear
engaging teeth of rack 215 on rail 103, so as to move the
densitometer head 100 in the direction of the end limit stop 105.
The end limit stop 105 is provided with a raised member 213
having an inclined plane 214. A limit switch on the densitometer
head 100 is actuated when coming into contact with the inclined
plane 214, causing the motor to reverse and the reading mechanism
of the densitometer head 100 to be activated. The densitometer
head 100 scans the designated area of the aligned sheet as it
travels in the direction of the docking end. It collects and
stores the color data as it travels, and may perform various
computations. After arrival at the docking end, the densitometer
head sends a signal via optical couplers 201, 202 to the host
computer indicating that the scanning run has been completed.
The computer then sends the necessary commands to the head 100 to
receive collected and/or computed data. Thereafter, the operator
raises the transport system, using the lever 106, so as to remove
the sheet.
The mechanism for raising and lowering parallel transport
bars 102, 103, together with the densitometer head 100, includes
a pair of parallel arms 223, 224 and an interconnecting link 225.
A pair of shafts 226, 227 extend longitudinally from the plate
216 and support the transport bars 102, 103. Arms 223 and 224
are attached to shafts 226 and 227, respectively, for rotational
engagement, and are provided with curved lower terminal ends 233
and 234, respectively, resting on a base plate 235. The
transport bars 102, 103 are shown in a lowered position in FIG.
3. The system may be raised by turning the lever 106 which is
attached for rotational engagement with shaft 227. Rotation of
-15-
shaft 227 in the clockwise direction causes arm 224 to be
likewise rotated, and due to the action of link 225, causes arm
223 to be similarly rotated. Rotation of arms 223, 224 causes
their curved terminal ends 233, 234, respectively, to be forced
against the base plate 235. Base plate 235 is attached to a
vertically extending plate 216, and spacer 211 is utilized to
position arm 224 a predetermined distance from plate 216.
An alignment pin 228, attached to a horizontally extending
bar (not shown in the drawing) interconnecting plate 216, travels
in vertically extending slot 229. When arms 223, 224 are rotated
in the clockwise direction, their curved terminal ends 233, 234
will slide along base plate 235,.,causing shafts 226, 227, and
hence transport bars 102, 103, to be raised. The opposite ends
of transport bars 102, 103 are interconnected by link mechanism
107 contained in housing 112 shown in FIG. 2. The link mechanism
107 comprises a pair of arms corresponding to arms 223, 224
interconnected by a link corresponding to link 225 and resting on
a base plate corresponding to base plate 235. The arms of link
mechanism 107 are similarly attached to shafts 226 and 227 for
rotational engagement. Accordingly, as shaft 227 is rotated, the
ends of transport bars 102, 103 disposed in housing 112 axe
raised and lowered concomitantly with the docking end of the
system.
Arm 224 is provided with a reduced section 239 having an
opening 238. The reduced section 239 is provided with an
inclined plane to facilitate engagement of solenoid pin 232 with
arm 224 in a standard fashion. Solenoid pin 232 moves through
guide 222 for engagement with opening 238. Solenoid 220 is
commonly in the released condition and pin 232 is in an extended
position. As arm 224 is moved in a clockwise direction, pin 232
engages opening 238 in arm 224. The solenoid 220 may be operated
by means of a control signal from control connector 205 or from
host interface connector 206. Operation of solenoid 220 causes
pin 232 to be retracted and disengaged from opening 238, thereby
releasing arm 224 to allow for rotation in the counterclockwise
direction. Arm 224 is biased for counterclockwise rotation by
spring 231. In this manner, support arms 102, 103 are lowered
upon activation of solenoid 220.
End limit stop 105 comprises a horizontal bar 240 extending
in a direction transverse to transport bar 102 and in sliding
engagement with transport bar 102. Bar 240 is attached to an
adjustment plate 241. An adjustment arm 243, rotationally
engaged with plate 241 by means of pivot pin 244 and provided
with knob 245, engages transport bar 102 to force sliding
horizontal bar 240 in frictional engagement with bar 102.
Adjustment arm 243 is attached to spring 248, anchored by pin
-16-
2~~~~~7
249, to force arm 243 against bar 102. Rotation of arm 243 in
the counterclockwise direction releases sliding horizontal bar
240 from frictional engagement with transport bar 102. Further
attached to bar 240 is horizontal plate 246 of which pointer 212
is an integral part. Attached to plate 246 is raised member 213
provided with an inclined plane 214 for engagement with the
densitometer head 100 to define the limit of travel of the head
100.
FIG. 4 is an exploded view of the densitometer head 100
shown in FIGS. 2 and 3. Shown in FIG. 4 is the densitometer
housing 300 in which a number of printed circuit boards 301
through 304 are supported. The circuit boards each contain a
number of electrical components which will be described in
greater detail later herein with reference to FIG. 6. Shown on
circuit board 304 is housing 309 containing optical coupler 202
and electrical connector 208, referred to earlier herein with
respect to FIG. 3. Further shown on circuit board 304 is a limit
switch 314 which, when actuated, serves to reverse the direction
of travel of the densitometer. A switch pin 315 and switch pin
stop 316 cooperate to actuate limit switch 314 when pin 315
engages the inclined plane 214 of the end limit stop 105 depicted
in FIG. 3. A battery 308 is contained within a battery shield
306 within the housing 300 to provide electrical power for motor
325 and electronic circuitry of circuit boards 301 through 304.
Cover 311, together with cover seal 310, form the top cover for
housing 300.
Bottom plate 320 houses the nosepiece 321 containing the
necessary optical elements required for optical scanning, and
described in further detail with respect to FIG. 5. A motor
mounting plate 326 attaches to bottom plate 320 and provides for
the mounting of motor 325, to which pinion gear 327 is attached.
A pointer 330, which attaches to the bottom plate 320, is used
for alignment of an area to be optically measured as described
earlier herein. Pointer 330 extends beyond housing 300 so as to
be clearly visible for aligning the area to be measured with the
pointer. Slides 332, 333 are attached to opposite ends of the
bottom plate 320 and are in sliding engagement with housings 217,
218 when the densitometer head 100 is positioned on the transport
bars 102 and 103. A pressure spring 235 is mounted on the bottom
plate 320 to apply pressure to the area on which color
measurements are to be made, as densitometer head 100 moves along
transport bars 102, 103, propelled by motor 325 by means of
engagement of pinion gear 327 with teeth of rack 215 of transport
bar 103.
It is well known in color technology to measure color
density of, for example a color bar strip of a color printed
-17-
~0~0~~~
sheet, by illuminating such a color bar strip by means of a light
source and sensing reflected light by means of sensors provided
with filters to detect three basic c:olor shades such as cyan,
magenta, and yellow. Color density measurements are made on the
basis of the strength of the refleci:ed light within the band-
width defined by the three selected color shades. It is also
known to sense the intensity of the light source in order to be
able to take into consideration the variations in the intensity
of the light source in making color density measurements. The
l0 optical nose piece assembly 321, shown in exploded view in FIG.
5, contains a light source 344 and a plurality of reflective
light sensors 343 which are provided with filters to detect the
cyan, magenta, and yellow color shades. Side sensors are
provided to measure the intensity of the light source. The light
sensors 343 are mounted on circuit boards 341 and 342, and
electrical analog signals generated by the sensors are
transmitted via pins 349 to one of the circuit boards 301 through
304. Circuit boards 341 and 342, together with sensors 343 and
light source 344, are mounted in an optic housing 345. The optic
housing 345, together with an inner aperture 350, a lens 351, an
outer aperture 352, an inner optical seal 353, infrared glass
354, an outer optic seal 355, and optical shield 340 are retained
in bottom plate 320 and housing extension 348. The nosepiece
assembly 321 and its various component parts are well known in
the industry and are commercially available. Greater detail of
the concepts associated with optics and electronics components
associated with the measurement of color densities is described
in the section entitled "Background of the Invention" with
respect to FIG. 1.
FIG. 6 is a block diagram representation of certain of the
circuitry on circuit boards 301 through 304 of FIG. 4. FIG. 6
shows a plurality of input leads labeled C, M, Y, and S. These
four inputs represent electrical signals from the optical nose
piece 321 defining the cyan, magenta, and yellow light
intensities and a side sensor output representing intensity of
the light source. The C, M, Y, and S signals are each amplified
by means of conventional amplifiers 501 through 504 which amplify
the relatively low level output signals from the respective
sensors to output signals compatible with signal levels used in
multiplex circuit 510. Output signals from amplifiers 501
through 504 are transmitted to multiplex circuit 510 via
conductors 505 through 508, respectively, where the four separate
signals are converted to a serial stream of analog signals and
transmitted via conductor 511 to an analog-to-digital convertor
520. The multiplexed analog signals received from multiplexer
510 are sampled and converted into digital data representative of
-18-
2~40~8~
the analog signals, by means of convertor 520. A serial stream
of digital data bits representing the signals corresponding to
the outputs of the cyan, magenta, and yellow color sensors as
well as the optical source sensor, are transmitted from convertor
520 to a processor 550 by means of conductor 522.
The processor 550, which may be a standard commercially
available microprocessor, such as the Intel 80C196, controls
movement of densitometer head 100 and collects and stores data,
as generally outlined in flow chart form in FIG. 7. As discussed
earlier herein, reading of a color bar strip or the like is
initiated by an operator aligning the area to be read by means of
a pointer 330 on the densitometer head 100, pointer 212, and
alignment bar 210. Thereafter, the operator may notify the host
computer by touching appropriate keys of a keyboard or the like.
The host can actuate solenoid 220, to lower the transport bars
102, 103, together with the densitometer head 100 onto the sheet
of material to be scanned. The densitometer head 100 is
positioned at the docking end prior to the taking of measurements
and optical couplers 201 and 202 will be aligned when head 100 is
in the lowered position, allowing communication between head 100
and the host computer. The host computer, which is connected to
interface board 203 via RS 232 connector 206, may be a system
computer using the densitometer output for feedback control or
the like or may be an AT style computer with a monitor to provide
a stand-alone densitometer system. A host to densitometer
interface such as disclosed in U.S. Patent No. 4,591,978 to S. H.
Peterson et al may be employed in communications between the host
processor and the densitometer head 100.
The host computer may download to the densitometer head 100
certain information such as color bar patch width, color bar
length, and other measurement parameter data. Receiving and
storing parameter data by the densitometer head 100 is indicated
in block 601 of FIG. 7. Such information may, for example, be
stored in an electronically erasable memory 530, directly
connected for read and write access to processor 550. The less
volatile, electronically erasable memory is used for the
parameter data since that data may be useful for an extended
period of time over many runs. After transmission of the
necessary data to densitometer head 100, the host computer
provides a start signal transmitted via optical couplers 201,
202. Receipt of this start signal is indicated in block 603 of
FIG. 7.
Having received the start signal, processor 550 provides a
corresponding indication to motor control 560 via conductor 561,
which in turn provides an appropriate signal to motor 325, as
reflected in block 605 of FIG. 7. This causes the motor 325 to
-19-
CA 02040187 1999-09-23
move the densitometer head 100 along transport bars 102, 103 by engagement
of pinion gear 327 with teeth of rack 215 on transport
bar 103. Motor 325 may be a standard small electric motor. In one preferred
embodiment, the motor propels the head 100 at the rate of four inches per
second. Starting of the motor 325 propels the densitometer head 100 in the
direction of the end limit stop 105, away from the docking end of the
transport system, "breaking" all connection to the host. Consequently, no
further communication takes place between the densitometer head 100 and the
host processor until it returns to the docking end. Accordingly, the
densitometer head 100 operates autonomously during the color measuring
operation.
Densitometer head 100 travels toward stop 105 until switch pin 315 of
the densitometer head 100 engages inclined plane 214. At that point, switch
314 is actuated and sends a signal to processor 550 via conductor 562, as
reflected in block 607 of FIG. 7. Processor 550 transmits a control signal
to motor control 560 via conductor 561 to reverse the direction of motor
325. A corresponding reversing signal is applied to motor 325 from motor
control 560 via conductor 563. The densitometer head 100 is now prepared to
begin reading color data from a color bar strip positioned under transport
bars 102, 103. Accordingly, the analog-to-digital convertor 520 is
initialized and enabled via conductor 524, as indicated in block 609 of
FIG. 7. Processor 550 enables and initializes multiplexer 510 via conductor
512 and convertor 520 via conductor 524 on the basis of the parameter data,
obtained from memory 530 as indicated in block 609 of FIG. 7. Processor 550
receives a tachometer signal from motor control 560 via conductor 561. The
tachometer signal is derived by motor control 560 on the basis of a back
EMF signal obtained from motor 325 via conductor 563. The tachometer signal
is used by processor 550 together with the parameter data, obtained as
indicated in block 609, to process the data received from convertor 520 and
store the processed data in random access memory 555 as indicated in block
610. The parameter data may simply be used to define the manner in which
the data will be stored and later presented to the host processor.
Alternatively, additional data processing functions may be
defined for processor 550 on the basis of the received parameter
data, such as pattern recognition. Pattern recognition algorithms for use
in the computation of color density measurements are known in the art. The
extent of the processing to be done in the densitometer head is clearly a
function of the
2~4~~~~
capabilities of the processor 550 and the programs for the
processor as stored, for example, in program memory 556. Program
memory 556 will include instructions for processor 550 needed to
execute its various functions, such as those outlined in block
diagram form in FIG. 7.
Processor 550 will continue to process the sensor output
data received from the analog digital convertor 520 until
densitometer head 100 has reached the end of its run. As
indicated in block 611 in FIG. 7, a test is made periodically by
processor 550 to determine whether the end of the run has been
reached. The end-of-run is detected when power connector 208,
shown in FIG. 3, makes contact with a corresponding connector
305, shown in FIG. 4, of densitometer head 100. When that
occurs, charge and power management circuit 577 sends an arrival
signal to processor 550 via conductor 579. If the end-of-run has
not yet occurred, the processor 550 will continue to receive and
store digital data from convertor 520. When the end of run has
occurred, processor 550 will disable convertor 520 and
discontinue storing data in memory as indicated in block 613 of
FIG. 7. When the densitometer head 100 has arrived at the
docking end at the end of the run, optical coupler 202 is once
again aligned with optical coupler 201 so that the messages can
be transmitted between densitometer head 101 and the host
computer. An end-of-run message is sent by processor 550 via
optical coupler 202 when the end-of-run signal has been received,
as indicated in block 615 of FIG. 7. Thereafter, processor 550
waits for a request for data from the host computer as indicated
in block 617, and when the request has been received, run data
stored in the random access memory 555 is transmitted via optical
coupler 202, optical coupler 201 and host interface 206 to the
host computer. As indicated earlier, upon completion of a run
the operator may raise the transport bars 102, 103 by operation
of lever 106, remove the sheet that has been measured and insert
a new sheet to repeat the operation.
It will be understood that each of the electronic circuits,
including processor 550, motor 325, and other circuits and
electrical devices require electrical power and certain circuits
require periodic timing pulses. The timing pulses are provided
as needed, by means of a system clock in a well-known fashion,
and need not be described herein. A power supply circuit 575
provides electrical power at various current and voltage levels
to meet the various requirements of the system of densitometer
head 100. The power supply circuit 575 receives electrical power
from battery 576 via conductor 573 when disengaged from the
docking end power connector 208. When densitometer head 100 is
positioned in the docking end, electrical power is provided from
-21-
~04~~8~
power connector 208 to charge and power management circuit 577
via power connector 578 and conductor 579. When densitometer
head 100 is in the docked position, power supply circuit 575
receives its power from the charge and power management circuit
577, which charges battery 576. FIG. 8 is a diagrammatic
representation of the charge and power management circuit of 577.
Circuit 577 comprises a control 812 which is connected to battery
576 by means of conductor 804 to sense the battery voltage level.
When that level is below a certain value, e.g., 6.25 volts, the
control 812 activates a fast-charge circuit 810 which is
connected to conductor 569 from the power connector 578. The
fast-charge circuit 810, upon activation, provides a fast charge
to battery 576 via conductor 568. A thermal sensor 815 is
positioned near battery 576 and provides a signal to control 812
via conductor 805 when the sensor senses a battery temperature in
excess of a predetermined value, e.g., 45°C. When that
temperature is sensed, control 812 disables the fast-charge
circuit 810 and enables a trickle charge circuit 811 to provide a
trickle charge on conductor 568 to battery 576. In this manner,
a high battery charge is maintained within battery 576 to operate
the densitometer head 100 when away from the docking end. The
charge and power management circuit provides power to power
supply 575 via conductor 572 when the densitometer head 100 is in
the docked position. A level reduction circuit 814 is used to
transmit a signal to processor 550 on conductor 579 when the
power connector 578 is in contact with the corresponding power
connector 208 on interface board 203. The level reduction
circuit 814 is connected to conductor 569 from power connector
578 and provides a reduced level signal on conductor 579 to
processor 550, indicating that the docking position has been
reached.
It will be further understood that the embodiments. described
herein are illustrative of the principles of this invention and
that numerous variations thereof may be devised by those skilled
in the art without departing from the spirit and scope of this
invention.
-22-