Note : Les descriptions sont présentées dans la langue officielle dans laquelle elles ont été soumises.
02~ egg ~8
ANALYTICAL METHOD AND DEVICE :FOR
PRECISE ANALYSIS WITH A SIMPLE SENSOR
- BACKGROUND OF THE INVENTION
This invention relates to an analytical method in
which an analyte and a reactant that reacts with said analyte
either directly or indirectly are allowed to react on the
analytical areas of a substrate, with the resulting signals
being detected for qualitative or quantitative analysis of
the analyte, and in which the signals derived from the
reaction on the analytical areas of the substrate are
detected more intensely than those derived from the non-
analytical areas, thereby allowing for higher precision in
the analysis of the analyte. More specifica:Lly, the
invention relates to an analytical method that employs
chemical sensors, biosensors such as enzyme sensors, specific
binding sensors and which enables precise analysis with a
simple sensor configuration by such means as supporting the
analyte on projecting analytical areas of the substrate. The
invention also relates to an analytical method that enables
the fabrication of miniaturized and highly precise
microsensors.
Column chromatography, enzyme-chemical analyses,
immunoassays and other conventional analytical methods that
determine the quantities of target compounds in liquid or
gaseous phase have disadvantages such as the need to use
large sample volumes for analysis, the need for large
- 1 -
02188848
analytical equipment and the prolonged time of analysis.
These problems present a serious obstacle when there is a
need to analyze a large number of samples simultaneously for
a single analyte (i.e., simultaneous analysis of multiple
samples) or when it is necessary to analyze single samples
for a number of different analytical items (i.e.,
simultaneous analysis for multiple items).
Sensor technology has recently seen marked advances
in such applications as chemical sensors, biosensors and
specific binding sensors and active efforts are being made
toward simplified analytical techniques and miniaturized
sensing devices. However, the-results are not completely
satisfactory and technology is yet to be developed that uses
a miniature sensor and which not only enables simultaneous
analysis of multiple samples or simultaneous analysis for
multiple items but also achieves high precision iri these
analyses.
To take one example, S.P. Fodor et a:l. described in
Science, Vol. 251, p. 767-773 (1991) a method in which a
photolithographic technique was combined with photo-sensitive
protective groups to synthesize for analytical use different
sequences of peptides or oligonucleotides in minute multiple
regions (forming a matrix on a two-dimensional plane).
P. Connolly wrote a review article in Trends Biotechnol.,
Vol. 12, p. 123-127 (1994) to describe a phoi~ofabrication
process in which a lift-off technique was usE~d to form
- 2 -
01888 48
patterns of hydrophilic and hydrophobic regions in the
surface of a substrate. Similar surface processing
technologies and analytical methods have been reported by
C.R. Lowe et al. (U.S. Patent 4,562,157), S. Nakamoto et al.
(Sensors. and Actuators, Vol. 13, 165 to 172 (1988), C.S.
Dulcey et al. (Science, Vol. 252, 551 to 554, 1991) and S.K.
Bhatia et al. [Anal. Biochem.,-Vol. 208, 197 to 205 (1993)].
W.T. Muller et al. described in Science, Vol. 268, p.
272-273 (1995) a process in which surface functional groups
in a mono-molecular layer self-associated onto a substrate
were subjected to micro-processing with a scanning probe unit
such that a substance could be-covalently bonded to minute
regions of the substrate.
Surface processing technologies using a scanning
tunnel microscope (STM) were also reported by Y. Utsugi
[NATURE, Vol. 347, 747 to 749 (1990)] and P. Connolly
[Nanotechnology, Vol. 2, 160 to 163 (1991)].
D.J. Pritchard et al. reported in Anal. Chim. Acta.,
Vol. 310, p. 251-256 (1995) a process for the fabrication of
a specific binding sensor for simultaneous analysis for
multiple items, which comprised reacting photo-sensitive
photobiotin with each of two antibodies, with a photomask
being applied to a plurality of avidin-immobilized gold
electrodes on a silicon wafer substrate.
The above-mentioned micro-processing technologies are
all capable of immobilizing different substances onto
- 3 -
02188848
specified regions of a substrate. However, the fabrication
process employed in these technologies includes at least
several steps and hence is complicated. In addition, despite
the need to process minute regions, expensi~re reagents such
as specific binding substances (antibodies) or precious
molecular recognition elements, both of which will determine
the characteristics of individual sensing portions presuppose
a reaction over the entire surface of the substrate, which
makes the conventional technologies not always economical.
What is more, the detecting regions such as electrodes must
be in correct registry with the immobilized regions and,
hence, a highly precise positioning technology is
indispensable to the fabrication of miniature sensors. As a
further problem, electrodes and other detecting portions will
detect not only signals originating from the desired specific
binding but also those which derive from undesired events
such as the surrounding non-specific binding on the same
plane and this makes the conventional technologies unsuitable
for precise analyses.
In performing analyses with sensors :represented by
chemical sensors, biosensors such as enzyme sensors and
specific binding sensors such as immunological sensors, two
functional parts are necessary, i.e., an analyzing part for
supporting analytical reagent components such as chemical
sensitive substances, bio-catalytic substances, molecular
recognition elements and specific binding substances, and a
- 4 -
02~~~~'~8
detecting part for detecting signals that are generated as
the result of participation of the supported substance. For
achieving-better precision in analysis, the precision in the
amount of the substance to be supported in the analyzing part
and the ,precision of signal detection by the detecting part
must both be improved. The precision in the amount of the
substance to be supported in the analyzing part depends on
various factors such as the method of supporting (e.g. in a
free state without being bound chemically, via covalent
bonding, via non-covalent bonding, or via a specific binding
substance), the precision in the quantity of reaction
solution used for supporting, the precision .in the quantity
of the fluid to be spotted and the precision in the
supporting area of the analyzing part. It should
particularly be noted here that if the size of the analyzer
is reduced to enable analysis of trace amount: of samples, it
becomes difficult to guarantee the precision in the volume of
reaction solution or in the supporting area of the analyzing
part. Methods so far adopted to solve these problems
comprise providing minute regions of a substrate with a
substance binding ability by a photolithographic technique
and then bringing the entire surface of the substrate into
contact with the substance to be supported. However, this
approach has several disadvantages; first, the fabrication
process is complicated; second, excess amounts of reagents
have to be supported, which makes the approach uneconomical;
- 5 -
~ ~1 ~ 8'~8
third, there are unavoidable influences of non-specific
adsorption onto regions where the substance of interest
should not be supported or those regions to which the
substance should not bind.
SUMMARY OF THE INVENTION
The present invention has been accomplished under
these circumstances and has as-an object providing an
analytical method which comprises allowing an analyte and a
reactant that reacts with said analyte either directly or
indirectly to react each other on the analytical areas of a
substrate, with the resulting signals being detected for
qualitative or quantitative analysis of the analyte, wherein
the signals derived from the reaction on the analytical areas
of the substrate are detected more intensely than those
derived from the non-analytical areas, thereby enabling
higher precision in the analysis of the analyte.
Another object of the invention is to enable precise
analysis with a simple sensor configuration and thereby
making it easy to produce a miniature and highly precise
microsensor.
Yet another object of the invention i.s to ensure that
simultaneous analysis of multiple samples or simultaneous
analysis for multiple items can be performed with a trace
sample volume.
The present inventors conducted intensive studies to
develop a technique by which the reagent components to be
- 6 -
o~~~s~~~
analyzed were immobilized on minute regions such that they
could be analyzed in a precise manner. As a. result, the
inventors-found the following: when a reactant that would
react with the analyte either directly or indirectly was
immobilized on the analytical areas of a substrate and
allowed to react with the analyte in an externally introduced
sample or when the analyte was immobilized on the analytical
areas of the substrate and allowed to react with an
externally introduced reactant that would react with the
analyte, with the resulting signals being detected to analyze
the analyte, and in the case where a portion provided in a
position opposed to the substrate was closely related to the
supply of the reactant or reaction energy, signals
originating from the reaction on the analytical areas could
be detected intensely in a specific manner by ensuring that
the distance form each analytical area of the substrate to
the opposed portion is shorter than the distance from each of
the non-analytical areas of the substrate to the opposed
portion. The inventors also found that to ensure that the
reaction occurring in the analytical areas would be detected
at specifically high signal intensities, it was effective to
form high and low area, in either the substrate or the
opposed portion or both. The present invention has been
accomplished on the basis of these findings.
Thus, the present invention provides an analytical
method which comprises allowing an analyte and a reactant
~~1~~~~g
that reacts with said analyte either directly or indirectly
to react each other on the analytical areas of a substrate
and detecting signals originating from the reaction, wherein,
at least in a signal detection step, either a signal
generation-related portion that participates in the
generation of said signals or a signal detection portion of
said signals or both are provided in a portion that is
opposed to the substrate and wherein high and low area are
formed in either the substrate or the opposed portion or both
in such a manner that the distance from each analytical area
of the substrate to the opposed portion is shorter than the
distance from each of the non-analytical areas of the
substrate to the opposed portion, whereby signals originating
from said reaction in the analytical areas of: the substrate
will be detected at higher intensities than :signals
originating from the reaction in,the non-analytical areas of
the substrate.
In another aspect, the invention provides a substrate
that has a plurality of projecting analytical. areas formed
thereon and which is useful in conducting they analytical
method described above.
BRIEF DESCRIPTION OF THE DRAWINGS
Figs. lA and 1B illustrate embodiments of the
analytical method of the invention, respectively;
Fig. 2 illustrates another embodiment of the
analytical method of the invention;
_ g _
Fig. 3 illustrates yet another embodiment of the
analytical method of the invention;
Fig. 4A is a top view of the substrate used in
Example 1;
Fig. 4B is a cross section of the same substrate as
in Fig. 4A;
Fig. 5 illustrates the analytical method employed in
Example 1;
Fig. 6 is a diagrammatic representation of the SECM
image of the substrate employed in Example 1;
Fig. 7 is a cross section of the specific binding
substrate used in Example 1; _
Fig. 8A is diagrammatic representation of the SECM
image taken when a hPL-containing sample solution was
analyzed using the specific binding substrate;
Fig. 8B is a graph showing the electric current
profile obtained in the same analysis as in 1?ig. 8A;
Fig. 9A is a diagrammatic representation of the SECM
image taken when a hCG-containing sample solution was
analyzed using the specific binding substrate;
Fig. 9B is a graph showing the electric current
profile obtained in the same analysis as in ~'ig. 9A;
Fig. 10 is a graph showing the reduction current vs
the concentration of hPL in the hPL-containing sample
solution when it was analyzed using the specific binding
substrate;
_ g _
~~'~$$$~$
Fig. 11 is a graph showing the reduction current vs
the concentration of hCG in the hCG-containing sample
solution when it was analyzed using the specific binding
substrate;
Fig. 12 is a diagrammatic representation of the SECM
image taken when an AFP-containing sample solution was
analyzed in Example 2 using a specific binding substrate;
Fig. 13 is a graph showing the relationship between
the CEA concentration and the SECM reduction current;
Fig. 14 is a diagrammatic representation of the SECM
images taken in Comparative Example 1 using .a flat substrate;
and
Fig. 15 is a graph showing the relationship between
the CEA concentration and the SECM reduction current for
Comparative Example 1 in which the flat subsJtrate was used.
EMBODIMENTS OF THE INVENTION
The present invention will now be described in
detail.
The analytical method of the invention is such that
an analyte and a reactant that reacts with said analyte
either directly or indirectly are allowed to react each other
on the analytical areas of a substrate and that signals
originating from the reaction are detected; t:he method
presupposes that, in at least a signal detection step, either
a portion that participates in the generation of said signals
or a signal detection portion of said signals or both are
- 10 -
provided in a portion that is opposed to the substrate. In
the analytical method under consideration, the analyte, as
well as the reactant that reacts with it include various
substances as will be described below in detail. Other
factors ,such as the mechanism by which signals are generated
from the reaction between the analyte and the reactant, the
type of signals, the manner in-which the signal generation-
related portion participates in the generation of signals,
the type of signal detector and the site at which it is
provided are also not subjected to any particular limitations
and can be embodied in various ways as long as the signals
originating from the above-described reaction can be
specifically intensified in accordance with ithe relatively
short distance between the opposed portion and each
analytical area of the substrate.
While various substances can be reacted with the
analyte in the invention, those which react directly with the
analyte include (i) substances that bind dirE~ctly to the
analyte but which themselves will not undergo any chemical
changes, and (ii) substances that bind directly to the
analyte to cause chemical changes in the anal.yte, in
themselves or in other substances.
More specifically, substances of group (i) may be
exemplified by an antibody against the analyt.e if it is an
antigen. In this case, the anti-analyte antibody is capable
of direct binding to the analyte which is an antigen.
- 11 -
021~8~~$
If the analyte is a nucleic acid having a specified
sequence, a poly- or oligonucleotide that hybridizes
complementarily with the DNA or RNA of said nucleic acid, a
specific binding substance to the analyte (to be described
hereinafter), and an enzyme molecule for which the analyte is
an inhibitor may be given as typical examples of the reactant
of group (i). Other examples include ionically bonding
substances having dissociative groups such as a carboxyl
group and an amino group and hydrophobically bonding
substances such as silicone.
Substances of group (ii) may be exemplified by
covalent bond forming or crosslinking substances such as
glutaraldehyde, carbodiimide, N-hydroxysuccinimide (NHS),
disuccinidyl tartrate (DST) and N-succinimidyl-3-(2-
pyridyldithio)propionate (SPDP), as well as substances having
a sulfhydryl group that causes a S-S bond exchange reaction.
Other examples are enzyme molecules for which the analyte is
an enzyme substrate, coenzyme, cofactor, inhibitor and the
like. Take, for example, the case where the analyte is
glucose which is an enzyme substrate; an enzyme such as
glucose oxidase (GOD) binds directly to glucose, forming
D-glucono-6-lactone and hydrogen peroxide in the presence of
oxygen which is another' enzyme substrate.
Substances that react indirectly with the analyte may
also be used in the invention and they cause reactions that
are indirectly associated with the reaction i.n which the
- 12 -
n ~ ~ ~ 8 8'~8
analyte,participates. Such substances include (a) those
which bind indirectly to the analyte via a substance that
binds directly to the analyte, and (b) those which do not
bind to the analyte either directly or indirectly but which
will bind to a substance to which the analyte binds.
Substances of group (a) include a specific binding
substance to a substance that binds directly to the analyte,
as exemplified by an antibody against an anti-analyte
antibody. A more specific example is avidin that binds
specifically to a biotin-labelled anti-analyte antibody.
Substances of group (b) may be exemplified by the
same substance as the analyte or its analogs.. In this case,
an anti-analyte antibody is capable of binding to both the
analyte and the substance of group (b), so the latter will
enter into a reaction in which it competes with the analyte
for the anti-analyte antibody. Another example of substances
of group (b) is an enzyme that catalyzes a reaction linked
with the reaction catalyzed by an enzyme capable of direct
reaction with the analyte. More specifically, consider the
case where the analyte is glucose and the enzyme capable of
direct reaction with.the analyte is GOD; the substance of
group (b) in this case is peroxidase (POD) which acts on the
substrate hydrogen peroxide that is generated. in the GOD-
catalyzed reaction.
In the present invention, the analyte and the
reactant that reacts with the analyte either directly or
- 13 -
~2~~~84g
indirectly as described above are allowed to~ react each other
on the analytical areas of the substrate. F'or this reaction,
either the analyte or the reactant may be preliminarily
supported on the analytical areas of the substrate whereas
the reactant or the analyte is externally brought onto the
analytical areas. In this case, whichever of the analyte and
the reactant may be preliminarily supported on the substrate;
however, in a preferred embodiment, the reactant is
preliminarily supported on the analytical areas of the
substrate and then a sample for quantitative or qualitative
analysis of the analyte is brought onto the analytical areas
such that the reactant is reacted with the analyte; this
provides a practical and useful technique for simultaneous
analysis of multiple samples or simultaneous analysis for
multiple items.
The manner in which the reactant is supported on the
substrate is not limited to any particular embodiments as
long as it is held on the analytical areas in a fashion that
causes the intended reaction. Therefore, if,. as in
simultaneous analysis of multiple samples, sample solutions
or reagent fluids are loaded onto the respective analytical
areas of the substrate by dispensing or suction means such as
a micro-capillary such that the sample solution or reagent
fluid on one analytical area does not communicate with that
on an adjacent analytical area, the reactant can be supported
on the individual analytical areas in such a way that the
- 14 -
g
reactant on one analytical area is isolated from the reactant
on an adjacent analytical area. On the other hand, if, as in
simultaneous analysis for multiple items, aliquots of a
single sample solution are simultaneously distributed among
the analytical areas for performing a plurality of tests, it
is generally preferred to have the reactant immobilized onto
the analytical areas. The immobilization of the reactant may
be effected in various manners including physical adsorption
on the surfaces of the analytical areas and covalent bonding
to an adsorbent on the surfaces of the analytical areas. For
such immobilization, one may advantageously employ those
techniques which are commonly used in specific binding
analyses with the aid of various solid-phase supports such as
glass test tubes, plastic test tubes, porous membranes,
microplates, polystyrene beads, latex particles and magnetic
particles.
Signals are generated in the invention as originating
from the reaction between the analyte and the reactant which
reacts with it either directly or indirectly. Such signals
are those which occur as the result of direct: or indirect
reaction between the analyte and the reactant: and they are
signals variable with the quantity or concentration of the
analyte in a sample. Examples are: signals from an indicator
by which a specific binding substance as the reactant is
labelled to form a labelled specific binding substance that
will participate in signal generation; signals either from a
- 15 -
labelled specific binding substance that binds to the product
of hybridizing reaction or from an intercalated substance,
with the reactant being a specific binding substance of a
polynucleotide sequence that hybridizes with a nucleic acid
such as DNA or RNA; and signals from the product of an enzyme
catalyzed reaction in which the reactant is an enzyme.
The signals under consideration include those
detection signals which the skilled artisan use in various
analytical methods such as enzyme reactions, optical or
electrochemical enzyme sensor methods, various immunological
analyses typified by fluoroimmunoassay, enzyme immunoassay,
chemiluminescence or bioluminescence immunoassay, etc. and
which are known as homogeneous or heterogeneous methods, and
nucleic acid amplification analyses typified by nucleic acid
hybridization quantitation using a labelled antidouble-strand
antibody or a fluorescent intercalator, and Examples of such
signals are color, emitted light such as fluorescence and
electrical amounts such as current and potential. The
mechanisms of signal generation in these various analytical
methods may also be used as preferred cases of the invention.
As in the already-described assay methods, the intensities of
signals generated in the invention depend on the quantity or
concentration of the analyte in samples. Therefore, the
quantity or concentration of the analyte in an unknown
specimen can be determined either qualitatively or
- 16 -
quantitatively from the signal intensities detected with a
suitable detector.
Specific examples of the enzyme generating signals
include oxidoreductase. Examples of the oxidoreductase
include oxidase (e. g., glucose oxidase and cholesterol
oxidase), peroxidase (e.g., horseradish peroxidase), and
dehydrogenases (e. g., diaphorase and glucose-6-phosphate
dehydrogenase).
While various detectors can be used :in the invention
for detecting the above-described signals, a gold electrode
evaporated on the substrate may typically be used if the
signals to be detected are generated by an electrochemical
reaction. Other detectors that can be used include carbon
ink typically formed by screen printing, as well as silver
paste electrodes, carbon fiber electrodes and platinum
electrodes. Such electrodes may covered with resist patterns
or the like in areas that are not desirably Exposed.
These electrodes may be disposed, either on the side
of the substrate where the analytical areas are formed or in
the portion opposed to these areas of the substrate, for use
as a detector of electric current or potential. If desired,
they may also be used as auxiliary electrodes. If the
electrodes are to be provided in the opposed portion, the
distance between the substrate and the electrode may be held
constant by inserting a spacer or the like such that the
substrate is laminated to the electrode in an. opposed
- 17 -
I
relationship with the spacer being interposed between the
two.
As will be described later in the Examples, a probe
electrode comprising a very thin platinum filament may also
be used as a signal detector. In this case, signal detection
is preferably performed with the probe electrode being
actuated by precise motor drive such that it will scan over
the substrate maintaining a constant distance from the
substrate having the analytical areas disposed thereon.
Alternatively, the substrate may be moved relative to the
probe electrode for scanning.
The electrochemical detection method using the probe
electrode is known as scanning electrochemical microscopy
(SECM) and described in such references as C., Lee, Proc.
Natl. Acad. Sci., USA, Vol. 87, p. 1740-1743 (1990), A.J.
Bard et al., Science, Vol. 254, p. 68-74 (1991) and H. Shiku
et al., Anal. Chem., Val. 67, p. 312-317 (1995). The SECM
can advantageously be applied for implementing the analytical
method of the invention.
If the signals to be detected in the inventing are
light produced by fluorescence, chemiluminescence, biolumine-
scence and so forth, photodetectors such as C;CD and
photomultiplier may be used as signal detectors.
The foregoing description of signal detectors is
merely intended as illustrations and should by no means be
taken to imply that the method of signal detection to be
- 18 -
~g
employed in the invention is limited to electrochemical or
optical means. The invention may adopt various methods of
signal detection as long as the high and low areas formed in
either the analytical areas or the reaction-related portion
which is. opposed to the analytical areas ensure that signals
are detected in such a way that specific signals coming form
the analytical areas have a clear difference in intensity
from non-specific signals coming from the areas surrounding
said analytical areas.
The signal generation-related portion employed in the
method of invention includes such sites that, when the
reaction between the analyte and the reactant which reacts
with it either directly or indirectly is allowed to proceed
for generating signals, the supply of a subsi~ance making a
certain contribution to those phenomena or the supply of
energy participating in the generation of said signals is
controlled.
The control of energy supply means that the external
energy required for signal generation or the external energy
for promoting or suppressing signal generation is supplied in
a controlled manner. The energy that participates in signal
generation may be exemplified by optical and thermal energy.
When supplying energy from the signal generation-
related portion, the region of energy supply is preferably
restricted to the area near the surface of th.e signal
generation-related portion such that a sufficient amount of
- 19 -
'~~4~
energy will reach the analytical areas of the substrate but
that the amount of energy reaching the non-analytical areas
is not effective for accelerating the reaction. An example
of the optical energy that can be controlled in terms of its
supply region is evanescent waves which are ;produced on the
surface of a waveguide such as a prism plate or an optical
fiber. Use of the evanescent wave enables detection of a
fluorophore within a thin layer. The use of optical energy
has the added advantage of allowing for surface plasmon
resonance (SPR) analysis utilizing the change in dielectric
constant that occurs on the surface of a wavE~guide having an
evaporated metal coating.
If the evanescent wave is to be used in the
invention, the opposed portion which provides the signal
generation-related portion is composed of a waveguide such as
a plane prism and either the analytical areas or part of the
opposed portion or both. are formed as projecting regions such
that the analytical areas will lie within the region to be
supplied with optical energy whereas the non-analytical areas
will be outside said region. Given these geometric features,
a light collector installed on the side closes to the
substrate or the opposed portion is combined with a detector
such as a photomultiplier or CCD, thereby enabling precise
analysis of the signals that originate from the analytical
areas.
- 20 -
Another example of the energy that can be employed in
the invention and which can be controlled in terms of the
region over which energy is supplied from the signal
generation-related portion is the thermal energy controlled
by a thermal cycler (as used in a DNA amplifier and so
forth). By employing a thermal cycler in the invention, one
can create such conditions that the temperature of the area
near the heat source can be controlled to a specified level
but no effective temperature control can be .achieved to
affect remote regions. On the other hand, nucleic acid
amplifying reactions such as polymerase chaim reaction (PCR)
are caused by temperature circulation with a thermal cycler.
Therefore, if a thermal cycler is to be used in the
invention, one may cause PCR with projecting regions being
formed in such a way that only the analytical areas will lie
within the regions that are subject to the necessary
temperature control. It should be noted herE~ that in order
to increase the temperature difference betweE~n the interior
of each of said regions and its exterior, the substrate may
be maintained at a constant temperature.
An embodiment of the invention using a thermal cycler
will now be described more specifically below. A sequence-
specific nucleotide probe is supported on the analytical
areas and both a sample and any reagents such as primers and
polymerases that are necessary for PCR are inserted between
each analytical area and the opposed portion and, thereafter,
- 21 -
temperature control is applied to the opposed portion by
means of a thermal cycler. If the sample contains a nucleic
acid sequence as the analyte, nucleic acid amplification is
caused as a local phenomenon that is confined to the
analytical areas. If the sample also contains a fluorescence
marker that will intercalate in a double-stranded nucleic
acid or an electrochemically labelled mononucleotide, the
label can be incorporated into the nucleic acid amplification
product. This makes it possible to detect fluorescent or
electrochemical signals by a detector as a function of the
amount of the product of nucleic acid amplifying reaction.
Even if a component such as a nucleic acid probe is supported
in areas other than the projecting analytical areas, no
reaction for nucleic acid amplification will take place
unless the necessary temperature control is performed.
Hence, the intended assay at the analytical <~reas can be
accomplished with high precision.
As already mentioned, the analyte and the reactant
which reacts with the analyte either directly or indirectly
are allowed to react each other on the analyi~ical areas of
the substrate in the present invention and, for this
reaction, either the analyte or the reactant may be
preliminarily supported on the analytical areas of the
substrate whereas the reactant or the analyte is externally
brought onto the analytical areas. Whichever of the analyte
and the reactant is preliminarily supported on the analytical
- 22 -
areas of the substrate, the signal generation-related portion
may participate in signal generation in any manners and one
may use various types of detectors, as well as dispose them
at various sites. Stated more specifically, the signal
generation-related portion may be provided in the portion
opposed to the substrate and the detector provided on the
other side of the substrate. Alternatively, a signal
detection portion rather than the signal generation-related
portion may be provided on the side close to the opposed
portion. If desired, both the signal generation-related
portion and the signal detecting portion may be provided on
the side close to the apposed portion. If the signal
generation-related portion is to be provided in the opposed
portion, it may be of a type that supplies a substance
participating in signal generation or it may be of a type
that supplies energy. These points will now be described in
detail with reference to accompanying drawings.
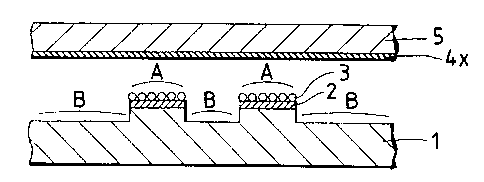
Fig. lA illustrates an embodiment of the analytical
method of the invention. As shown, an insulating substrate 1
such as a silicon wafer, a glass, or a synthetic resin is
provided with high and low areas in the surface. The high
areas or projecting regions of the substrate 1 are provided
with signal detecting electrode portions 2 each having a
conductive layer formed of a semiconductor, metal, carbon
ink, etc. In the embodiment under consideration, the
surfaces of the signal detecting electrode portions 2 formed
- 23 -
in the projecting regions of the insulating substrate 1 serve
as analytical areas A and the recessed regions (low area) of
the substrate 1 serve as non-analytical areas B. Reactant 3
that reacts with the analyte is supported on each of the
signal detecting electrode portions 2 serving as analytical
areas A.
A signal generation-related portion 4x is provided in
a position opposed to the insulating substrate 1. The signal
generation-related portion 4x may take on various forms: it
may comprise a substrate 5 supporting an analytical reagent
that participates in the generation of signals originating
from the reaction between the analyte and the reactant 3; the
signal generation-related portion 4x may function as an
electrode such that an electrode reaction wi:Ll take place in
that portion to generate a substance that participates in the
generation of signals originating from the rE~action between
the analyte and the reactant 3; alternatively, the signal
generation-related portion 4x may be adapted such as to
supply energy that participates in the generation of signals
originating from the reaction between the analyte and the
reactant 3.
The signal detecting electrode portions 2 supporting
the reactant 3 are connected to an external detector such as
a potentiostat and function as electrodes for sensing the
current produced by the oxidation or reduction of the
reactant 3. Such signal detecting electrode portions 2 may
- 24 -
typically be formed by evaporation of metals such as gold or
screen printing of carbon ink and so forth.
The embodiment of analytical method shown in Fig. lA
may typically be practiced in the following manner. First, a
specific, binding substance is supported as the reactant 3 on
the projecting analytical areas A. Then, a sample solution
is reacted with a horseradish peroxidase (HRP) labelled
specific binding substance to form a ternary complex on the
analytical areas A that consists of the binding specific
substance, the analyte and the HRP labelled apecific binding
substance and the amount of the ternary complex depends on
the concentration of the analyte in the sample solution. The
HRP activity of the ternary complex is detected with each
signal detecting electrode portion 2 (which :Functions as a
detection electrode) via direct electron transfer to and from
the HRP or as mediated with an electron mediator. In this
case, hydrogen peroxide which is a substrate for HRP will be
generated in the signal generation-related portion 4x. The
signal generation-related portion 4x may be adapted to
generate hydrogen peroxide by one of the following two
methods: an oxidase such as glucose oxidase /;GOD) is
supported as an analytical reagent component on the portion
4x and glucose as well as dissolved oxygen which are
substrates for GOD are subsequently introduced; or the signal
generation-related portion 4x is allowed to function as an
- 25 -
A21~~
electrode which causes an electrochemical reaction to
generate hydrogen peroxide.
In this setup, signals originating from the HRP
activity in the ternary complex generated in. the analytical
areas A in accordance with the concentration of the analyte
in the sample, namely, the reduction current sensed by the
signal detecting electrodes 2, depends on the diffusion of
the substrate for HRP from the signal generation-related
portion 4x such that the intensity of the signals decreases
as they depart from the portion 4x. Hence, the intensity of
detection signals derived from the analyte supported on the
analytical areas A which are the closer to the signal
generation-related portions 4x will be less affected by such
factors as the non-specific adsorption of HR:P onto
undesirable regions such as the non-analytical areas B,
whereby specific binding analysis can be achieved v~ith high
precision.
In the embodiment shown in Fig. lA, high and low
areas are formed on the surface of the insulating substrate 1
and signal detecting electrode portions 2 are provided in the
high areas such that the surfaces of those portions will
serve as projecting analytical areas A whereas the
surrounding recessed regions serve as non-analytical areas B.
Another embodiment of the invention is shown in Fig. 1B, in
which high and low areas are formed in the signal generation-
related areas 4x such that those parts of the area 4x which
- 26 -
are opposed to the analytical areas A are located the closer
to them than other areas such as non-analytical areas B.
Using the analytical substrate shown in Fig. lA or
1B, one may perform analysis by the following procedure.
First, a. sample containing an unknown concentration of the
analyte and a HRP-labelled anti-analyte antibody are
externally brought onto the analytical areas A having an
anti-analyte antibody supported thereon as the reactant 3,
whereupon a specific binding reaction takes place to form the
aforementioned ternary complex. The sample and the HRP-
labelled anti-analyte antibody may be introduced
simultaneously or separately. _If necessary, a washing
operation may be performed between the introduction of the
sample and that of the HRP-labelled anti-anal_yte antibody or
after the formation of the ternary complex; t:he washing
operation may typically consist of introducing a washing
solution such as a buffer solution containing a surfactant
and discharging the washings.
In the next step, the reagent solution necessary for
signal generation, for example, an electrolyte solution
containing the dissolved oxygen and glucose which are
considered to be necessary when GOD is supported in the
signal generation-related portions) 4x, is introduced
between the substrate 1 and the signal generation-related
portions) 4x, whereupon the marker enzyme HR.P generates a
reduction current, which is detected as a signal by the
- 27 -
i
signal detecting electrode portions 2 as they are supplied
with a reducing potential relative to a counter or reference
electrode, with the liquid junction being formed with the
electrolyte solution. The intensity of the thus detected
signals depends on the amount of HRP in the ternary complex
formed in the analytical areas A as a function of the
concentration of the analyte iri the sample. Therefore, if a
standard response is obtained from the signal intensities for
samples containing the analyte in known concentrations, one
can determine the concentration of the analyite in the sample
of interest.
In the analytical procedure described above, the
specific embodiment for introducing the sample, washing
solution or reagent solution is not limited t-o any particular
manner as long as the introduced sample, washing solution or
reagent solution contacts the analytical areas A of the
substrate 1. In one case, the substrate 1 may be submerged
in the sample or the solutions mentioned above;
alternatively, the sample or the solutions may be injected
into the space between the opposed elements (i.e., the signal
generation-related portions) 4x and the substrate 1) by
suitable means such as a pump or capillarity. It should,
however, be noted that in a case like simultaneous analysis
of multiple samples, the sample, washing solution or reagent
solution is preferably dripped or spotted on specified
- 28 -
I ,
analytical areas A by dispensing means such as a capillary to
be described hereinafter.
It should also be noted that in the analytical
procedure described above, the signal generation-related
portions,(s) 4x need not be opposed to the analytical areas A
at the start of analysis but suffice be opposed to the latter
at the step of signal generation. Therefore, the signal
generation-related portions) 4x or dispensing means may be
motor or otherwise driven to be movable over the substrate 1
in the X-, Y-, Z- or ~-axis, or the sample, washing solution
and reagent solution may be introduced or discharged by a
syringe control mechanism. In_either case, i~he introduction
of the sample, washing solution and reagent solution can be
controlled by suitable means such as an external computer and
the resulting increase in the latitude and precision in
analysis makes an advantageous contribution t:o the
realization of automated analysis.
Fig. 2 illustrates yet another embodiment of the
invention. As shown, an insulating substrate' 1 such as a
silicon wafer or a glass plate is provided with high and low
areas in the surface. The high areas or projecting regions
of the substrate 1 are adapted to support an analytical
reagent component 3 so that those regions will serve as
analytical areas A. The recessed regions surrounding the
analytical areas A serve as non-analytical areas B and
electrode portions 4y for detecting signals e~riginating from
- 29 -
c~'
the analyte are provided in positions that a:re opposed to the
analytical areas A of the substrate 1.
A_specific analytical procedure of implementing the
embodiment shown in Fig. 2 may proceed as follows. First, a
specific binding substance is supported on the analytical
areas A. Then, a sample solution containing the analyte is
reacted with a horseradish peroxidase (HRP)-labelled specific
binding substance to form a ternary complex on the analytical
areas A that consists of the specific binding substance, the
analyte and the HRP-labelled specific binding substance and
the amount of which depends on the concentration of the
analyte in the sample solution. After this specific binding
reaction, the HRP activity in the ternary complex on the
analytical areas A is detected with the signal detecting
electrode portions 4y in the opposed area.
As in the embodiment shown in Fig. 1, hydrogen
peroxide which is a substrate for HRP may be generated
electrochemically or by using an oxidase such. as glucose
oxidase (GOD). If desired, hydrogen peroxide may be
incorporated in the reaction solution. It should also be
noted that an electron mediator between the HRP activity at
the analytical areas A and the opposed areas 4y which
function as detecting electrodes must be contained in the
reaction solution.
In this setup, signals originating from the HRP
activity in the ternary complex generated in the analytical
- 30 -
'i
n
areas A,as a function of the concentration of the analyte in
the sample, for example, values of the reduction current
observed by the signal detecting electrodes, are attenuated
as the distance of diffusion of the electron mediator
increases and, hence, the signal intensity at the signal
detecting electrode portions 4y in the opposed area will
decrease as the distance between the portions 4y and the
analytical area A increases. As a result, t:he signal
representing the HRP activity in the ternary complex formed
on the analytical areas A in the projecting :regions can be
detected in such a way that the adverse effect of HRP
adsorbed nonspecifically onto the regions other than the
analytical areas A, namely, the recessed non-analytical areas
B surrounding the analytical areas A, can be sufficiently
reduced to ensure that specific binding analysis is
accomplished with high precision in the analytical areas A.
In the embodiment shown in Fig. 2, high and low areas
are provided in the insulating substrate 1 such that
projecting analytical areas A are surrounded with recessed
non-analytical areas B. In yet another embodiment of the
invention, high and low areas may be provided in the opposed
area such that those portions of the opposed area which
function as the signal detecting electrode portions 4y are
the closer to the analytical areas A. Alternatively, the
embodiment shown in Fig. 2 may be modified such that each of
the analytical areas A is composed of an electrode and that a
- 31 -
reagent,component participating in signal generation is
supported in the area opposed to the substrate 1.
Fig. 3 shows a further embodiment of the~invention.
As shown, a transparent substrate 1 is provided with high and
low areas. The high areas or projecting regions 2 which
serve as analytical areas A support a reactant 3 such as a
substance capable of specific binding to the analyte. An
area 4z opposed to the substrate 1 is provided with a
waveguide that generates evanescent waves and which thereby
function as a signal generation-related portion that supplies
optical energy. A plurality of CCDs are provided on the back
side of the substrate 1.
Analytical procedure in this embodiment will proceed
as follows. First, a sample containing the analyte and a
fluorophore-labelled anti-analyte antibody ai:e externally
brought onto the analytical areas A so as to form a ternary
complex there. Exemplary fluorophores include fluorescein,
Texas red, phycobiliprotein, etc. In the next step,
evanescent waves are generated from the opposed area 4z.
Depending on the wavelength, refractive index; and the
incident angle of light, the extent of the evanescent waves
is typically no more than about 100 nm. Therefore, in the
embodiment shown in Fig. 3, the analytical areas A need be
separated from the non-analytical areas B by at least 100 nm
in the direction of travel of the evanescent waves so that
those waves will reach the marker fluorophore~ binding to the
- 32 -
surfaces of analytical areas A, which then emits fluorescence
whereas~the waves will not reach the marker fluorophore
binding to the surfaces of non-analytical areas B, with the
result that no fluorescence is emitted. Accordingly, the
fluorescence from the marker fluorophore binding to the
surfaces of analytical areas A can specifically be detected
with the CCDs. -
Fig. 3 shows the case where the signal generation-
related portion for supplying optical energy is provided in
the area opposed to the substrate whereas CCDs are provided
as detectors on the back side of the substrate. The present
invention, however, permits providing a signal detection
portion on the side opposed to the substrate even if energy
is to be supplied from the signal generation--related portion
provided in the area opposed to the substratE~. For example,
the waveguide provided in the area opposed to the substrate
may be so adapted that it not only supplies optical energy
but also guides the fluorescence from the analytical areas
into the detectors. If a thermal cycler is provided in the
area opposed to the substrate, an electrode i.n contact with
the thermal cycler may be provided as a detecaor in the same
opposed area.
While the preferred embodiments of th.e invention have
been described above with particular reference to
accompanying drawings, it should be noted that the analytical
method of the invention is by no means limited to the
- 33 -
t
specified techniques set forth above. The analytical method
which utilizes the HRP activity in a ternary complex as
described_with particular reference to Figs. 1 and 2 (which
is generally called "sandwich" specific binding analysis) is
just one example of the analytical technique that can be
employed in the invention and one can also apply it to
competitive specific binding reactions with advantage. In
addition, the present invention is advantageously applicable
not only to heterogeneous assays that require washing and
separating operations but also to homogeneous assays. The
applicability of the invention is by no means limited to
specific binding analysis and it is also applicable to
chemical sensors and biosensors such as enzyme sensors.
Exemplary chemical sensors include ion-selective
electrodes, gas sensors, solid electrolyte sensors,
semiconductor sensors, humidity sensors, olfactory sensors
and other sensors that are sensitive to chemical species in
samples. These chemical sensors comprise an analyzing part
which supports a substance sensitive to a chE~mical species of
interest and a detecting part composed of a transducer such
as an electrode or photoelectric device, and the chemical
species is detected by sensing with the substance supported
on the analyzing part.
Biosensors typically comprise an analyzing part on
which an organism such as a living tissue, microorganism,
cell or organelle or a biocatalytic substance such as an
- 34 -
enzyme is supported as a molecular recognition element and a
detecting part composed of a transducer such as an electrode
or photoelectric device. Typical biosensors are enzyme
sensors such as a glucose sensor which uses glucose oxidase
(GOD) as. the enzyme.
The specific binding analysis to which the invention
is applicable is in no way limited to the cases shown in
Figs. 1 and 2 and it may be performed in various other
embodiments. Hence, specific binding substances such as
antigens, antibodies and nucleic acids such as
oligonucleotides may be supported on the analyzing part,
which is combined with the detecting part composed of an
electrode or photoelectric device such that a specific
binding reaction associated with the specific binding
substance supported on the analyzing part is detected.
Thus, in the specific binding analysis, the analyte
in a sample is determined qualitatively or quantitatively in
association with at least one specific binding reaction
between the analyte and the substance that specifically binds
to it. There are many known method of the specific binding
analysis, including immunoassays making use of antigen-
antibody reactions, receptor assays using receptors and
nucleic acid probe assays using hybridization of
complementary nucleic acid sequences. Because of their
specificity, these methods are commonly used in clinical
'testing and various other fields.
- 35 -
,Specific examples of the analyte in the specific
binding analysis include various proteins, polypeptides,
glycoproteins, polysaccharides, complex glycolipids and low-
molecular weight compounds that function as ahtibody or
antigen molecules, as well as nucleic acids, effector
molecules, receptor molecules, enzymes and inhibitors. More
specific examples include: tumor markers such as a-
fetoprotein, carcinoembryonic antibody (CEA)" CA125 and CA-
19-9; various proteins such as J32-microglobulin ( j32m) and
ferritin; hormones such as estradiol (E2), human chorionic
gonadotropin (hCG), luteinizing hormone (LH) and human
placental lactogen (hPL); various microorganisms such as
fungi and bacteria, as well as substances produced by the
microorganisms; various virus-related antigens and antibodies
such as HBs antigen, HBs antibody, HBe antigen, HBe antibody,
HBc antibody, HCV antibody and HIV antibody; various
allergens and IgE antibodies specific thereto; narcotic
drugs, medicinal drugs and metabolites thereof, environmental
markers such as pollutants, noxious substances and hazardous
substances; viruses and nucleic acids of disease-related
polynucleotide sequences.
The specific binding substance to be used in specific
binding analysis embraces those substances which specifically
bind to particular substances such as the analyte, namely,
those substances which are capable of entering into reactions
for specific binding to particular substances.
- 36 -
,Therefore, the combination of the an~alyte and the
specific binding substance therefore may be exemplified by
the combination of an antigen and an antibody against it, the
combination of complementary nucleic acid seguences, the
combination of an effector molecule and a receptor molecule,
the combination of an enzyme and an inhibitor; the
combination of an enzyme and a cofactor, the combination of
an enzyme and a substrate, the combination o:E a compound
having a saccharide chain and lectin, the combination of a
certain antibody and an antibody against than antibody, and
the combination of a receptor molecule and an antibody
against it. In these combinations, either substance can be a
specific binding substance for the other substance.
Specific binding substances may be chemically
modified to such an extent that their specific binding
activity is not lost or they may bind with another component
to form a complex substance. Such chemical modification
products and complex substances are also included in the
scope of "specific binding substance" in the invention and
may be exemplified by antibodies or polynucleotides
chemically modified with biotin, as well as antibodies
covalently bonded to avidin. Other examples include
antibody-enzyme or antibody-receptor fused proteins prepared
by gene recombinant technology.
A practical example of sensors for implementing
specific binding analysis is such that the an.alyte in a
- 37 -
liquid sample is subjected to specific binding reaction with
a specific binding substance, thereby forming a distance
profile of a marker from the electrode portion and the value
of an electric current representing the concentration of the
analyte in the liquid sample and which is rate limited by the
diffusion of an electron mediator is measured to determine
the concentration of the analy~e. This method is known as
MEDIA (mediator diffusion-controlled immunoassay) and
described in Unexamined Published Japanese Patent Application
No. 264552/1993 (corresponding to European Patent Publication
No. 0525723A2). This MEDIA method can also be used with
preference in the present invention.
If the above-described analytical method of the
invention is to be practiced in such an embodiment that high
and low areas are provided in the substrate on which the
analyte is supported, the substrate is usefully provided with
a plurality of projecting analytical areas that are
surrounded with recessed non-analytical areas. The substrate
is particularly useful in performing specific: binding
analysis in the invention if a substance capable of specific
binding to the analyte is supported on the projecting
analytical areas.
In such substrates, the surface area of the
projecting analytical areas, their height as measured from
the non-analytical areas, and the distance between adjacent
projecting analytical areas can be determined) as appropriate
- 38 -
for the, type of the analyte and other factors; in a typical
case, the height of the projecting analytical areas as
measured from the non-analytical areas is adjusted to lie
between 0.1 ~m and 1 mm and the distance between adjacent
projecting analytical areas to lie between 2 ~m and 20 mm,
and these dimensions will ensure that not only simultaneous
analysis for multiple items but also simultaneous analysis of
multiple samples can be accomplished with high precision on a
routine basis.
The substrates having high and low areas of the
dimensions described above can be easily fabricated by known
surface processing or treating_techniques such as photo-
lithography, etching, cutting, evaporation, :Lamination and
printing. Therefore, the analytical method of the invention
has the added advantage of allowing for easy manufacture of
an apparatus that is suitable for implementing the method.
The material of the substrate is not particularly
limited as long as the object of the present invention can be
achieved. Examples of the material of the substrate include
silicon, glass, various types of synthetic and natural
resins, ceramics, and the like.
If the method of the invention is to be practiced
with analytical reagents supported in specified regions such
as the analytical areas of the substrate, they are preferably
supported in exact amounts in the specified regions in order
to achieve better precision in analysis and t;he apparatus for
- 39 -
implementing the method of the invention has the advantage of
providing greater tolerance in the amount of the reagent to
be supported and in positional precision as compared to the
conventional apparatus for microanalysis. Stated more
specifically, even if the reaction solution containing the
analytical reagent component is applied not only to the
specified regions where said reagent is to be supported but
also to the surrounding areas, the intensity of signals
originating from the analyte on the analytical areas of the
substrate is greater than that of signals from the
surrounding areas as already mentioned above, so the adverse
effects which may be caused on_the precision of measurement
by an inaccuracy in the amount of the reagent to be supported
and in the position at which it is supported can be reduced
to insignificant levels. Therefore, the analytical apparatus
for implementing the method of the invention can be
fabricated as a high-precision microsensor.
Another advantage of the method of the invention is
that unlike in the prior art case, there is no need to adopt
a method by which analytical reagent components are allowed
to react with the entire surface of the substrate such that
they are supported in specified regions of the substrate
(e. g. regions where binding functional group~~ have been
introduced). This allows the analytical reagent to be
supported on the projecting analytical areas by precise
spotting with a micro-capillary, hence reducing the waste of
- 40 -
the analytical reagent. It should also be noted that when
spotting the analytical reagent by means of a micro-
capillary, the latter can be sensed over the substrate as in
the case of detecting signals with a probe electrode and this
is preferred from the viewpoint of efficiency in the spotting
operation.
Spotting with a micro-capillary offers the further
advantage of enabling the formation of tiny analytical areas
for simultaneous analysis for multiple items or simultaneous
analysis of multiple samples and, hence, the present
invention facilitates the performance of not only
simultaneous analysis for multiple items but also
simultaneous analysis of multiple samples. ~f'o this end,
analytical areas supporting a plurality of different
analytical reagents or a plurality of analytical areas onto
which multiple samples or standard samples (e.g, samples of
known concentrations, positive samples, negative samples and
control samples) are to be spotted must be formed in tiny
regions of the substrate and, according to the present
invention, such analytical areas can be easi7_y formed using a
micro-capillary. In addition, a micro-capil7_ary containing
one reagent can be easily replaced by a micro-capillary
containing another reagent or, alternatively, different
reagents can be easily spotted with a plurality of micro-
capillaries.
- 41 -
,The following examples are provided :for the purpose
of further illustrating the present invention but are in no
way to be-taken as limiting,
Example 1:
Simultaneous Specific Binding Analys_Ls for Multiple
Items, i.e., hCG (Human Chorionic Gonadotropin) and
hPL (Human Placental Lactogen), Using Specific
Binding Substrate
(1) Preparation of solutions
A 10~ HF solution was prepared by diT.uting 46~
hydrofluoric acid (product of Morita Kagaku Kogyo Co., Ltd.)
with distilled water. n-Octadecyltrichlorosilane (product of
Kanto Chemical Co., Inc.) was diluted with benzene (product
of Wako Pure Chemical Industries, Ltd.) to a concentration of
10 mM.
Ferrocenyl methyl alcohol (FMA) was ~;ynthesized by
reducing ferrocenyl aldehyde (Product of Aldrich Chemical
Company, Inc.) by the following procedure. An ethanol
solution (20 mL) of ferrocenyl carboxyaldehyde (product of
Aldrich Chemical Company, Inc.) was mixed with an ethanol
solution (30 mL) containing 0.1 g of NaOH and 1.0 g of NaBH4
and the mixture was refluxed for a day. Thereafter, the
mixture was extracted with chloroform (50 mL) and the solvent
chloroform was evaporated to yield crude FMA, which was
purified by three recrystallizations with n-hexane.
- 42 -
,A mouse monoclonal anti-hCG antibody and a mouse
monoclonal anti-hPL antibody were both available from Mochida
Pharmaceutical Co., Ltd. These antibodies were diluted with
0.1 M phosphate buffer solution (pH, 7.0) to prepare
solutions.
(2) Fabrication of analytical substrate having projecting
analytical areas
An analytical substrate of the geometry shown in Fig.
4 at (a) (top view) and (b) (cross section) was fabricated by
the following procedure. Indicated by 10, the substrate had
two square (50 ~m x 50 um) projecting analytical areas la
within a rectangular (150 um x-300 um) recessed non-
analytical area lb, as well as recessed areas 7 for
positioning said analytical area.
A resist (OFPR-5000, product of Tokyo Ohka Kogyo Co.,
Ltd.) was spin coated onto a substrate (slide glass measuring
76 mm x 26 mm x 0.8 to 1.0 mm, product of Matsunami K.K.).
After prebaking in an oven at 80°C for 30 min, the resist
layer was exposed to a Hg lamp {500 W) for 3 sec through a
contact mask pattern. After immersion in a liquid developer
for 30 sec, thorough washing with water was conducted to
produce a glass substrate having a patterned resist mask.
The substrate was then dipped in the 10~ HF solution for 5
min to etch the unmasked exposed portions of the glass to a
depth of 2 Vim. As a result of this etching process, the
recessed non-analytical area lb and the recessed positioning
- 43 -
~4~
areas 7,were formed in a depth of 2 um, with the projecting
analytical areas la left intact within the recessed non-
analytical area lb. The thus processed substrate was
successively washed with distilled water and methanol to
remove the resist, followed by another washing with distilled
water and drying to produce the analytical substrate 10
having the projecting analytical areas la.
(3) Observation of the analytical substrate with scanning
electrochemical microscope (SECM)
The substrate 10 was observed with a scanning
electrochemical microscope (SECM) not only for checking the
pattern of the projecting analytical areas la formed on
substrate 10 but also for positioning the specific binding
reaction area which was to be carried out on the substrate 10
in the manner to be described hereinafter.
The setup of the observing part of the SECM which was
of a dual electrode type is shown in Fig. 5; the probe 20 was
a micro-probe electrode (comprising a Pt elecarode portion
with a diameter of 5 ~m encased in a glass insulator to give
an overall diameter of 60 Vim) and the counter electrode 21
was an electrode made of Ag-AgCl dipped in saturated
potassium chloride.
The micro-probe electrode was fabricated by the
following procedure. A Pt wire with a diameter of 15 um was
etched in a saturated solution of NaN03 to form a Pt
filament, which was inserted into a soft glass capillary
- 44 -
which, in turn, was fused at 320°C in vacuo to effect glass
coating. The tip of the capillary was ground with a
turntable.(Model EG-6 of Narishige Scientific Instruments
Laboratory) and polished with alumina particles (0.05 Vim) to
yield a micro-probe electrode having a circular cross section
(comprising the Pt electrode portion with a diameter of 5 ~m
encased in the glass insulator-to give an overall diameter of
60 Vim).
Preliminary steps for observation with the SECM of
the setup shown in Fig. 5 were as follows: the substrate 10
having the projecting analytical areas la which was
fabricated as described in (2)_was placed on top of a SECM
stage 22 and an electralyte solution 23 of the composition
set forth below was dripped over the processE~d surface of the
substrate 10 so that the latter was completely wetted with
the electrolyte solution.
Composition of Electro ate Solution for SECM
1.0 mM Ferrocenyl methyl alcohol (P'MA)
0.1 M Potassium chloride
0.1 M Phosphate buffer solution (pH 7.0)
The micro-probe electrode 20 was then. supplied with a
potential of +400 mV vs Ag-AgCl and the distance (d) between
the micro-probe electrode and the substrate 10 was held at 7
~m while SECM observation was performed at a scan speed of
9.8 um/sec.
- 45 -
d~l~~~~r$
Scanning with the micro-probe electrode was effected
on a servo-motor driven automatic XYZ stage (hereunder
referred to as a "motor driven actuator"). .A servomotor
controller (M9103, product of Chuo Seiki K.K.) for
controlling the servomotor to the automatic atage was
controlled with a computer program via a GPIIB bus connection.
The output current was amplified with a current amplifier
(Model 427, product of Keithley Instruments :Inc.) and
converted to a digital signal, which was sent to a computer
25 through a current amplifier 24 for measurement.
The observed SECM image, namely, a two-dimensional
profile of the oxidation current from FMA in the SECM assay
solution, is shown in F'ig. 6. The SECM imagE~ represents the
observed current in terms of dot density and a region having
the higher dot density represents an area producing the
larger intensity of observed current. The substrate 10 had
the analytical areas la projecting from the surface and when
the electrode was scanning over it, the distance between the
electrode and each analytical area was so small that the
supply of the FMA to the electrode was blocked to reduce the
current that could be picked up from the analytical areas, as
clearly shown in Fig. 6. Therefore, on the basis of the SECM
image shown in Fig. 6, one could not only confirm that the
desired projecting analytical areas la and recessed non-
analytical area lb had been formed in the substrate 10 but
- 46 -
also achieve correct positioning for scanning with the micro-
probe electrode.
(4) Fabrication of specific binding substrate
The analytical substrate 10 having the projecting
analytical areas 1 was processed as follows to fabricate a
specific binding substrate suitable for use in specific
binding analysis. First, the substrate 10 was rendered
hydrophobic by immersion for one day in the benzene solution
of n-octadecyltrichlorosilane. After drying, about 17 pL
each of an anti-hCG antibody solution (760 ~g/mL) and an
anti-hPL antibody solution (540 ~g/mL) was spotted on the
respective projecting analytical areas la of the substrate 10
by means of glass capillary pens connected to the motor
driven actuator. The substrate was then left to stand
overnight, dried, and successively washed wii~h an aqueous
solution of 0.1~ Tween 20 (product of Kanto Chemical Co.,
Inc.) and distilled water. Subsequently, then substrate 10
was submerged in an aqueous solution of bovine serum albumin
(10 mg/mL, product of Wako Pure Chemical Industries, Ltd.)
for 2 h to effect blocking, then washed with distilled water.
In this way, both anti-hCG antibody 8 and anti-hPL antibody 9
were immobilized on the projecting analytical areas la of the
substrate 10 and the thus fabricated specific: binding
substrate l0a was used in specific binding analysis as will
be described below. A cross section of the ~~pecific binding
substrate l0a is shown schematically in Fig. 7.
- 47 -
For its storage, the specific binding substrate l0a
was immersed in a 0.1 M phosphate buffer solution (pH 7.0)
and placed under refrigerated conditions.
(5) Simultaneous specific binding analysis :for multiple
items, hCG and hPL, using specific binding substrate
(5-1) Preparation of solutions
A horseradish peroxidase (HRP) labelled mouse
monoclonal anti-hCG antibody and a HRP labelled mouse
monoclonal anti-hPL antibody were both available from Mochida
Pharmaceutical Co., Ltd. In addition, hCG and hPL sample
solutions were prepared by dilution with a 0.1 M phosphate
buffer solution (pH 7.0). _
(5-2) Specific binding reaction
A 5-~L portion of the hCG sample solution (20 IU/mL)
or hPL sample solution (1.0 ~g/mL) was spotted over the
specific binding substrate l0a fabricated in (4), whereby the
projecting analytical areas la and the recessed non-
analytical area lb of the specific binding substrate l0a were
completely wetted with the sample solutions prepared in
(5-1). After washing with distilled water, i:he substrate was
dipped for 20 min in a labelled antibody solution containing
the HRP labelled anti-hCG antibody (20 ~g/mL) and the HRP
labelled anti-hPL antibody (7 ~g/mL) and thereafter washed
with distilled water.
(6) SECM assay of specific binding substrate
- 48 -
,The specific binding substrate l0a which had been
subjected to the specific binding reaction described in (5-2)
was observed by SECM. The method and apparatus used were
generally the same as in the SECM observation of the
analytical substrate 10 which was described .in (3). The only
difference was that the electrolyte solution contained H202
(substrate for HRP) according to the composition set forth
below and that the probe electrode was supplied with +50 mV
vs Ag-AgCl.
Composition of Electrolyte Solution for SECM
1.0 mM Ferocenyl methyl alcohol (FMA)
0.5 mM H20z _
0.1 M Potassium chloride
0.1 M Phosphate buffer solution (pH 7.0)
When specific binding analysis was performed with the
hPL sample solution prepared in (5-1), an SECM image was
obtained as shown in Fig. 8A. When specific binding was
performed with the hCG sample solution, an SECM image was
obtained as shown in Fig. 9A. Current profi7Les through cross
sections of Figs. 8A and 9A as taken on line x-x are shown in
Figs. 8B and 9B, respectively.
In the projecting analytical area la on which the
anti-hCG antibody was immobilized, the enzyme-catalyzed
reduction current originating from the labelled enzyme HRP
was observed only when the substrate was spotted with the hCG
sample solution; on the other hand, in the projecting
- 49 -
analytical area on which the anti-hPL antibody was
immobilized, the enzyme-catalyzed reduction .current
originating from the labelled HRP was observed only when the
substrate was spotted with the hPL sample solution.
Obviously, no cross reaction had occurred between the two
projecting analytical areas, one having immobilized the anti-
hCG antibody 8 and the other having immobilized the anti-hPL
antibody 9, within the tiny recessed non-analytical area lb
of the specific binding substrate 10a.
Similar runs of specific binding analysis were
conducted with the same hPL and hCG sample solutions, except
that the concentrations of hPL_and hCG were varied. The
relationship between the hPL concentrations and the reduction
current picked up from the projecting analytical area is
shown in Fig. 10, and the relationship betweE=n the hCG
concentration and the reduction current picked up from the
projecting analytical area is shown in Fig. :L1. The two
graphs show that the reduction current increased with the
concentration of antigen in each sample soluition. It is
therefore clear that the use of the specific binding
substrate fabricated in accordance with the :Lnvention permits
the analyte in a sample to be analyzed quantitatively in high
precision.
- 50 -
Example 2:
Simultaneous Specific Binding Analysis for Multiple
Items, i.e., CEA (human Carcinoembryonic Antigen) and
AFP (Human Alpha-Fetoprotein), Using Specific Binding
Substrate
(1) Preparation of Solutions
A mouse monoclonal anti-CEA antibody, a mouse
monoclonal anti-AEP antibody, a HRP labelled mouse monoclonal
anti-CEA antibody and a HRP labelled mouse monoclonal anti-
AFP antibody were all available from Mochida Pharmaceutical
Co., Ltd.
Both a CEA and an AFP sample solution were prepared
by dilution with a 0.1 M phosphate buffer solution (pH 7.0).
(2) Preparation of specific binding substrate
An analytical substrate having projecting analytical
areas was fabricated as described in Example 1 under (2).
The substrate was processed as follows to fabricate a
specific binding substrate. First, the analytical substrate
having projecting analytical areas was rendered hydrophobic
by immersion for one day in a benzene solution of
n-octadecyltrichlorosilane. After drying, 20 pL each of an
anti-AFP antibody solution (635 ug/mL) and an anti-CEA
antibody solution (512 ~g/mL) was spotted on the respective
square projecting analytical areas of the substrate by means
of a glass capillary connected to a motor driven actuator.
The substrate was then left to stand overnight, dried and
- 51 -
t
successively washed with an aqueous solution of 0.1~ Tween 20
(product of Kanto Chemical Co., Ltd.) and distilled water.
Subsequently, the substrate was submerged in an aqueous
solution of bovine serum albumin (10 mg/mL, product of Wako
Pure Chemical Industries, Ltd.) for 2 h to effect blocking,
then washed with distilled water. In this way, both the
anti-AFP antibody and anti-CEA antibody were immobilized on
the projecting analytical areas of the substrate and the thus
fabricated specific binding substrate was used in specific
binding analysis as will be described below.
For its storage, the specific binding substrate was
immersed in a 0.1 M phosphate buffer solution (pH 7.0) and
placed under refrigerated conditions.
(3) Specific binding reaction
The specific binding substrate fabricated in (2) was
spotted with 10 uL each of the AFP sample solution (50 ~g/mL)
or varying concentrations of the CEA sample solution (2x10'9,
2x10'8, 2x10'', 2x10'6, 2x10'5 and 2x10'4 g/mL) such that the
projecting analytical areas and the recessed non-analytical
area of the specific binding substrate were completely wetted
with each sample solution for 1 h. After washing with
distilled water, the substrate was dipped for 20 min in a
labelled antibody solution containing the HRP labelled anti-
AFP antibody (3.5 ~g/mi~) and the HRP labelled anti-CEA
antibody (51 ug/mL) and thereafter washed with distilled
water.
- 52 -
(4) SECM assay of specific binding substrate
The specific binding substrate which had been
subjected-to the specific binding reaction described in (3)
was observed with SECM of the same setup as described in
Example 1. The method was the same as described in Example 1
under {3) except that the electrolyte solution contained Hz02
(substrate for HRP) according to the composition set forth
below and that the probe electrode was supplied with +50 mV
vs Ag-AgCl.
Composition of Electrolyte Solution for SECM
1.0 mM Ferocenyl methyl alcohol (FMA)
0.5 mM H202 _
0.1 M Potassium chloride
0.1 M Phosphate buffer solution (pH 7.0)
When specific binding analysis was ps~rformed with the
AFP sample solution prepared in (3), an SECM image was
observed as shown in Fig. 12. When specific binding analysis
was performed with the varying concentrations of CEA sample
solution, the reduction current could be correlated to the
CEA concentration as shown in Fig. 13.
Fig. 12 shows that in the projecting analytical area
on which the anti-AFP antibody was immobilized, the enzyme-
catalyzed reduction current originating from the labelled
enzyme HRP as observed only when the substrate was spotted
with the AFP sample solution. Fig. 13 shows that the
intensity of reduction current varied with the CEA
- 53 -
5q!
concentration. It was accordingly verified that the use of
the specific binding substrate fabricated in accordance with
the invention permits the analyte in a sample to be analyzed
quantitatively with high precision.
Comparative Example 1:
Specific Binding Analysis of CEA Using Specific
Binding Substrate Having No Projecting Analytical
Areas
(1) Preparation of samples
An antibody and a HRP labelled antibody which were of
the same types as used in Example 2 were employed.
Varying concentrations_of CEA sample solution were
prepared by dilution with a 0.1 M phosphate buffer solution
(pH 7.0).
(2) Fabrication of substrate having no projecting analytical
areas
A substrate {sl.ide glass) was rendered hydrophobic
by immersion for 8 h in a benzene solution of
n-octadecyltrichlorosilane at a concentration of 10 mM.
The substrate was then immersed for 2 h in a 0.1 M phosphate
buffer solution (pH 7.0) containing a monoclonal anti-CEA
antibody at a concentration of 500 ug/mL such that the
antibody was immobilized over the entire surface of the slide
glass, which was subsequently washed with distilled water and
dried to fabricate an analytical substrate having no
projecting analytical areas. This substrate having the
- 54 -
antibody immobilized over the entire surface was used as a
comparative specific binding substrate.
(3) Specific binding reaction
The specific binding substrate fabricated in (2) was
spotted with varying concentrations ( 2x10-, 2x10⁻⁶, 5x10⁻⁶ and
1x10'5 g/mL) of CEA sample solution at intervals of 100 ~m by
means of a glass capillary connected to a motor driven
actuator. The resulting area was found by light microscopy
to have a substantially uniform size (with a radius of ca. 20
~m as produced by spotting ca. 17-pL solution). The
substrate spotted with the sample solution was left to stand
overnight, dried and washed with distilled water.
Thereafter, the substrate was dipped for 20 :min in a labelled
antibody solution containing the HRP labelled anti-CEA
antibody {15 ug/mL) and washed with distilled water.
(4) SECM assay of specific binding substrate
The specific binding substrate which had been
subjected to the specific binding reaction described in (3)
was observed with SECM of the same setup as described in
Example 1. The method was the same as described in Example 1
under (3) except that the electrolyte solution contained H20z
(substrate for HRPO) according to the formula set forth below
and that the probe electrode was supplied with +50 mV vs
Ag-AgCl.
- 55 -
Composition of Electrol~rte Solution for SECM;
~1.0 mM Ferrocenyl methyl alcohol (FMA)
0.5 mM HZOZ
0.1 M Potassium chloride
0.1 M Phosphate buffer solution (pH 7.0)
The specific binding analysis which was performed
with the varying concentrations of CEA sample solution
produced SECM images as shown in Fig. 14. The relationship
between the reduction current picked up in SECM and the CEA
concentrate is shown in Fig. 15.
Fig. 14 shows that SECM images originating from the
labelled HRP were observed only in those areas of the
substrate which were spotted with the sample solution. Fig.
shows that the intensity of reduction current varied with
15 the CEA concentration. However, Fig. 14 also shows that the
diameter of SECM images differed with the CEA concentration
and that the individual images were not completely discrete.
The reason would be as follows: in the comparative example,
the micro-probe electrode detected all of the labelled enzyme
activities on the same plane, so that the positions and
boundaries of the individual analytical areas became unclear
and were subject to undesired effects such as errors in the
size of areas where the sample was spotted with a capillary.
It is therefore concluded that the comparative substrate is
not capable of enhancing the precision in analysis.
- 56 -
'~
,As one can see from the foregoing description, the
use of the specific binding substrates having projecting
analytical areas which were fabricated in Examples 1 and 2
permitted more precise analysis to be performed more easily
than the comparative substrate having no projecting
analytical areas, with a particular advantage being such that
simultaneous analysis for items multiple (si:multaneously
analyzing different antibodies on adjacent projecting
analytical areas) can be accomplished with high precision.
In addition, the specific binding substrates fabricated in
Examples 1 and 2 could reduce the amount of .antibody to be
used in analysis since only trace levels of .antibody had to
be immobilized in tiny regions of the substrate.
The analytical method of the present invention is
such that when an analyte and a reactant that reacts with
said analyte either directly or indirectly are allowed to
react each other on the analytical areas of a substrate, with
the resulting signals being detected for qualitative or
quantitative analysis of the analyte, the signals derived
from the substance supported on the analytical areas are
detected more intensely than those derived from the substance
supported on the non-analytical areas and, hence, the analyte
in the sample can be analyzed with high precision.
The method of the invention also enables precise
analysis with a simple sensor configuration. The method has
the added advantage that simultaneous analysis of multiple
- 57 -
samples,or simultaneous analysis for multiple items can be
performed with a trace sample volume.
While the invention has been described in detail and
with reference to specific embodiments thereof, it will be
apparent to one skilled in the art that various changes and
modifications can be made therein without departing from the
spirit and scope thereof.
- 58 -