Note : Les descriptions sont présentées dans la langue officielle dans laquelle elles ont été soumises.
CA 02251365 2001-07-05
TITLE:
3-D GEOLOGTC MODELLING
BACKGROUND OF INVENTION
l 0 1.. FIELD OF INVENTION This invention relates to three-dimensional
geologic modeling and description of subsurface reservoirs of interest.
2. DESCRIPTION OF PRIOR ART
A. Introduction
There has been and still exists a continuing need to evaluate subsurface
reservoirs as to their internal characteristics, size and extent, as well as
their likely
content of hydrocarbons. This has been the case even where there are producing
wells
present in the reservoir. It has been common practice to obtain data about the
reservoir
from well logging instruments moved through existing wells in the reservoir.
Such
well data obtained from the well through well logs of various types typically
represent
2 0 data samples from only a small fraction of a reservoir's volume.
For effective evaluation of a reservoir, knowledge of the actual rock
formation
(lithology or lithofacies) and the contained fluids, as well as the relative
presence or
volume of pore space (or its porosity), is needed. The fact that a reservoir
exhibits
certain lithofacies and porosity at a well provides no assurances that other
areas of the
2 s reservoir have the same characteristics. Geological models of lithofacies
and porosity
that are based solely on well data thus contain large regions that are not
based on actual
sampled data; rather, the data must be estimated from information obtained
from the
closest existing wells.
Three-dimensional seismic surveys provide data samples over most of a
3 o reservoir's volume, including portions unsampled by wells, but they can at
best provide
CA 02251365 1998-09-30
WO 97/38330 PCT/US97/03979
2
only indirect measurements of lithofacies and porosity. Existing seismic
surveying
technology does not offer techniques to measure either of these formation
characteristics
directly.
B. Geologic Modeling
s Geologic modeling of the subsurface (usually three-dimensional, or 3-D} has
been performed for many years by petroleum and mining geologists, engineers,
and
hydrologists. Many descriptive or static 3-D geologic models built for mining
or
petroleum applications have been in the form of a specified three-dimensional
array of
individual model units or blocks (also called cells). An entire set of blocks
has
s o constituted the geologic model and thus represented the subsurface volume
of interest.
Each individual block has represented a specifically allocated portion of the
subsurface,
so the blocks may not overlap or intercut each other. Dimensions of the blocks
are
typically chosen so that the rock properties are relatively homogeneous within
a block,
yet without requiring an excessive number of blocks for the model. Typical
blocks are
15 one foot to one meter in thickness. Most commonly, blocks are square or
rectangular in
plan view and have thickness that is either constant or variable. The
objective of a
geologic modeling process is to assign rock properties to each block in the
geologic
model. This process has commonly used, so far as is known, the following three
data
types:
2 0 1. Rock property data from wells: The well data include such properties as
lithofacies (i.e., facies particularly characterized by rock type) or porosity
(i.e.,
percentage of pore space that a rock contains). In some situations,
lithofacies may be
synonymous with lithology (e.g., limestone, dolomite, sandstone, or shale); in
others,
two rocks may have the same lithology, but actually have been deposited in
different
2 s sedimentary facies. Other variables, such as permeability, digitized well
logs, and ore
grade, have been commonly used. The characteristic of this type of data is
that the
observations constitute strings of information along the borehole.
2. Structural surfaces or horizons in the form of 2-D computer grids or
meshes: Structural surfaces or horizons in the subsurface, which were commonly
3 o modeled by computer grids, limit the top and base of the model and define
the volume
CA 02251365 1998-09-30
WO 97/38330 PCT/US97/03979
3
of rock being modeled. They have also defined the boundaries of zones within
the
model. These grids typically marked stratigraphic surfaces that defined
individual
sequences that comprised the formation interval being modeled. These grids
have been
generated through well-known procedures by one of several commercially
available
software programs.
3. Stratigraphic surfaces in the form of 2-D computer grids or meshes:
These grids defined geologic correlations across a model within each zone;
that is, they
indicated those portions of the model that correlated laterally (block-to-
block, or well-
to-block). These grids may also have been used to define model blocks by
specifying
io the tops and bases of the blocks. If it were desired that orientations and
thicknesses of
blocks follow stratigraphic configurations and relationships (e.g.,
conformable,
truncation, baselap), then these grids would be used to form such blocks.
Stratigraphic surfaces were also used to define the stratigraphic position of
blocks within a zone. For a zone in which beds were deposited parallel to a
flooding
i5 surface, surfaces of constant stratigraphic position would be equidistant
from this
flooding surface. In this case, a group of blocks that were a given thickness
above or
below that surface would have the same relative-Z coordinate, which is the
vertical
distance from the flooding surface to the block. On the other hand, if
deposition were
conformable within a zone, that is, conformable to the zone=s top and base,
surfaces of
2 o constant stratigraphic position were distributed proportionally between
the top and base
of the zone. All blocks that were positioned a fixed percentage of the zone
thickness
above the zone base (or below the zone top) would have the same relative-Z
coordinate.
The geologic modeling process used these three types of data to assign values
of
the rock properties of interest to all blocks within the geologic model. The
assignment
2 5 of a rock property to a block was typically a three-step process known to
practitioners of
geologic modeling:
1. The X-Y position of the block and its Z-coordinate, both in absolute
elevation and relative to stratigraphic surfaces, was determined.
2. Search algorithms were used to determine which data points were in the
3 o neighborhood of the block. Two criteria were important. The data has to be
from a
CA 02251365 1998-09-30
WO 97/38330 PCT/US97/03979
4
portion of the well that was correlative to the block being modeled, and the
data had to
be near in some sense {typically geographic) to the block.
3. The value or rock property that was to be assigned to the block was
calculated using one of several classes of estimation methods, including the
following:
(a) Distance-based methods. These methods were based on simple measures
of distance to the well from the block. Nearest-neighbor or polygonal methods
assigned
to the block the rock property value of the nearest data value. Averaging
methods
interpolated the block property by calculating a weighted average of nearby
data values.
The weight assigned to each data value typically was a function of the inverse
distance
1 o between the data value and the block.
(b) Geostatistical methods. These methods took into account both distance
and spatial continuity of the rock property. The three-dimensional continuity
of a rock
property might be captured by a semi-variogram, which quantified the
variability of the
rock property as a function of separation distance and direction. Common usage
was to
15 use the simpler term variogram, rather than semi-variogram, and that term
is used in the
remainder of the present application. This measure of continuity might be in
the form of
calculated values based on observed data or in the form of special
mathematical
functions. Variogram values could be calculated on observations as follows:
~y(h) = E { Z(x) - Z(x+h) } 2 / 2n,
2 o where 'y is the variogram value, h is a vector indicating separation
distance and direction,
Z(x) is the rock property value at location x, Z(x+h) is the rock property
value at
location x+h, the sum is over all pairs of observations separated by h, and n
is the
number of pairs of values in the sum.
The separation distance could be calculated in any direction. Vertical
separation
2 s distances typically were calculated perpendicular to the ground surface,
but in many
instances, vertical variograms were calculated in teens of depth down a well.
Horizontal variograms were calculated parallel to sea level; more commonly,
horizontal
(or more appropriately, lateral) variograms were calculated following
stratigraphic
surfaces or colrelations. Mathematical functions could be fitted to these
calculated ~y(h)
3 o values observations or the values might be used as calculated.
CA 02251365 1998-09-30
WO 97/38330 PCT/US97/03979
Deterministic geostatistical methods, such as kriging, were averaging methods
that assigned weights to data as a function of distance and the variogram
model.
Probabilistic geostatistical methods, such as sequential Gaussian simulation
and
sequential indicator simulation, produced geologic models that reproduced the
s continuity specified in the variogram model. Since the order in which blocks
were
estimated affected rock property assignment, a 3-D random path typically was
used.
This process could produce a suite of geologic models for the property being
modeled,
with each model being theoretically equi-probable.
Geologic-modeling studies traditionally used seismic data only to define the
z o structural surfaces that limit the top and base of the geologic model.
These traditional
geologic modeling studies have only rarely taken advantage of the rock
property
information contained in seismic data, and those that match seismic traces do
not merge
geologic and geophysical principles. .
C. Seismic Inversion
Seismic inversion techniques have been used to predict the nature of the
subsurface from seismic traces. There have been two primary inversion
strategies:
operator-based inversion, and model-based inversion. Inversion techniques
typically
relied on layer-type models of the subsurface, in contrast to the block models
discussed
above.
2 o Operator-based inversion was the traditional approach to seismic inversion
and
assumed that the seismic-acquisition process transformed the subsurface
geology into a
seismic trace by introducing a seismic pulse into the subsurface. Computer
algorithms
were used to reverse the seismic-acquisition process and produce a model of
the
subsurface geology. The disadvantage of this approach was that seismic
processes
2 s generally could not be reversed with sufficient accuracy to allow
characterization of
subsurface reservoirs.
Model-based inversion did not require reversal of the seismic-acquisition
process. Instead, it required that numerous forward seismic models be
generated until a
reasonable match existed with the observed seismic data. The generation of a
single
3 o forward seismic model was performed by generating a synthetic seismic
trace from a
CA 02251365 1998-09-30
WO 97/38330 PCT/LTS97/03979
6
stacked series of layers. Forward-modeling procedures worked with acoustic
impedance
values (the product of acoustic velocity and bulk density) rather than with
the lithofacies
and porosity values which were used in geologic modeling. This process
involved using
seismic-impedance values to calculate reflection coefficients at the
interfaces between
s layers. Synthetic seismic traces were calculated by convolving the
reflection
coefficients with a specified seismic pulse.
Model-based inversion was performed to invert one-dimensional seismic traces
by iteratively calculating forward seismic models. This approach was also used
to invert
a 2-D seismic line for an initial 2-D model of layers of varying thickness.
Acoustic
i o velocity and bulk density values were assigned at selected control points
within each
layer. Acoustic velocity and density values were interpolated between control
points at
trace locations. The parameters at control points were allowed to vary over
specified
ranges, and synthetic seismic traces were calculated for each change in the
model.
Parameters were varied until synthetic seismic traces were in agreement with
observed
1 s seismic traces. This approach required a good starting model because the
final model is
very close to the starting model.
The use of simulated annealing to estimate the acoustic velocity and bulk
density
of a one-dimensional series of stacked layers was also proposed. Forward
seismic
modeling was used to generate a synthetic seismic trace. Simulated annealing
was
2 o applied in this one-dimensional optimization procedure, one trace at a
time. This
process used only two constraints: the distribution of acoustic velocity and
that of bulk
density. The annealing process began by establishing an initial model with a
series of
layer density and velocity values. These values were systematically perturbed
until a
synthetic seismic trace calculated for the model matched the observed seismic
trace.
2 s Statistics such as correlations and mean-square errors were used to
quantify the
mismatch between the synthetic and observed seismic traces. Perturbations that
improved the match were generally accepted, although some perturbations that
degraded
the match were accepted in order to avoid local minima.
Such an optimization procedure produced a one-dimensional model that was not
3 o constrained by within-trace, vertical correlations for acoustic velocity,
bulk density, or
CA 02251365 1998-09-30
WO 97138330 PCT/US97/03979
7
acoustic impedance. In addition, while the process could be used to invert a 3-
D seismic
cube of traces, each inversion would be performed independently, one trace at
a time,
thereby not taking into account the lateral correlations in properties that
were known to
exist between traces. In contrast to geologic modeling techniques, seismic
inversion
s techniques did not take advantage of available rock property data, such as
lithofacies
and porosity, and their continuity, for the subsurface region of interest.
D. Geologic Modeling That Integrates Seismic Data
A number of recently proposed techniques have attempted to combine geologic
modeling and seismic inversion, thereby attempting to avoid the limitations of
each
io technique. The potential benefits offered are demonstrated by considering a
typical
subsurface model. In a typical geologic modeling study, well data sampled less
than 0.1
percent of the model volume. That well data was the most direct measurement of
the
volume. In other words, more than 99.9 percent of the block properties had to
be
estimated from less direct measurements. For example, where available, 2-D and
3-D
1 s seismic surveys represented an abundant source of less direct measurement
data.
Seismic surveys contained information not only on the surfaces that defined
the
reservoir, but also on properties of the rock that comprise the reservoir. By
integrating
seismic data with well data, it was suggested that one could expand
substantially the
information used to estimate block values.
2 o Sequential approaches to producing geologic models modeled one rock
property
at a time following a specific order. The model of the first rock property
(say,
lithofacies) was used as a guide for producing a model for the second rock
property (say,
porosity), and so on.
A number of approaches to integrating seismically derived lithofacies and
2 s porosity into 3-D geologic models have been proposed. These approaches
indirectly or
directly integrated seismic information with well data in estimating block
values for the
geologic model. However, the approaches have not taken into account detailed
information contained in the seismic trace, and as a result synthetic seismic
traces that
may have been calculated from the resulting geologic model have not been
assured to
3 o match observed seismic traces.
CA 02251365 1998-09-30
WO 97/38330 PCT/US97/03979
8
Methods that indirectly integrated seismic information used a sequential
approach with the seismic data to group the blocks in the model into seismic
facies.
Values for blocks within each seismic facies were estimated separately using
only the
well data contained within that facies. This approach produced block values
for
lithofacies and/or porosity.
Several geostatistical approaches attempted to make more direct use of the
seismic data in the geologic modeling process. These approaches required an
initial
calibration step in which a relation was established between well data and
neighboring
seismic traces. Seismic attributes that characterized the shape of the seismic
trace over a
1 o defined interval were correlated with well data over the same interval.
Linear regression
or discriminant function analysis could be used to develop relations for
predicting rock
properties from seismic attributes. These relations were used to convert
observed
seismic traces to a rock property (e.g., porosity).
Several methods have been developed to integrate well data with these
1 s seismically derived rock properties. A cokriging approach allowed porosity
models to
be generated that honored well data and integrated seismically derived
porosity by
accounting for the covariance relationships between well data and seismic
information.
Variations on cokriging, including Markov-Bayes simulation and collocated
cokriging,
have been developed in order to improve the efficiency of the geologic
modeling
2 o process. These geostatistical approaches treated well data as primary
(hard) data and
seismic information as secondary (soft) information. Geostatistical methods
could also
be used as part of a sequential approach and could be applied to interpreted
facies, one
at a Ume.
Geostatistical methods have also been developed that integrate seismic traces.
2 5 These were a geostatistics-based process for building geologic models that
matched
seismic traces, using the following steps:
First, it was necessary to obtain log-derived impedance at each well and
seismic
impedances for all traces in the seismic survey. Next, an analyst would assign
well data
and seismic-amplitude values to those vertical stacks of blocks nearest the
well and
s o seismic data. The process then continued in the following sequence:
CA 02251365 1998-09-30
WO 97/38330 PCT/US97J03979
9
1. Determine variogram models that characterize the vertical and lateral
continuity of impedance.
2. Select a random X-Y location.
a) Establish a random path through the vertical stack of blocks at this
location.
b) Use sequential Gaussian simulation to estimate the impedance of each
block, using nearby well data and values from previously calculated blocks.
c) Calculate a synthetic seismic trace for this set of block estimates.
d) Repeat this process until a specified number of sets of block estimates
was available.
e) Select the set of block values whose synthetic seismic trace correlated
best with the actual seismic trace. Use these block impedance values as data
for
estimating other block values in neighboring parts of the model.
Continue processing until blocks at all X-Y locations have been estimated.
15 3. Use linear regression to transform impedance values to a single
petrophysical variable such as porosity.
This process produced a reasonable geologic model when a single rock property
was responsible for the impedance values and when impedance values paralleled
stratigraphic surfaces. More commonly, however, impedance values were
dependent on
2 o several rock properties, each with its own degree and direction of
preferred continuity.
Some of these properties, such as lithofacies and porosity, were correlated
parallel to
stratigraphic surfaces. Other properties, such as fluid saturation, were not
correlated
parallel to stratigraphic surfaces. Therefore, this process that estimated
impedance
values rather than rock properties might not produce a model that was
consistent with
2 5 the interpreted geology.
This geostatistics-based process was described for modeling a single zone and
did not address the need to model multiple zones, each with its own
stratigraphic
correlations and impedance continuity. In order to accurately model the
geology using
matches to seismic traces, however, several such zones typically had to be
modeled
3 o simultaneously. In addition, the trace-matching component of this process
required that
CA 02251365 1998-09-30
WO 97/38330 PCT/US97/03979
block values be estimated by following a random path in two dimensions,
simulating
one vertical column of blocks at a time, rather than by following a preferable
3-D
random path. As a result, this approach reproduced vertical impedance
continuity
information better than it reproduced lateral continuity.
SUMMARY OF INVENTION
Briefly, the present invention provides a new and improved process to build 3-
D
geologic models of the earth's subsurface that primarily represent petroleum
reservoirs
and/or aquifers, although it may also be used for other geologic applications.
This
process merges 3-D geologic modeling with forward seismic modeling and,
thereby, is
Zo able to produce geologic models that are consistent with both geologic and
geophysical
principles. The process accounts for geologic information by modeling rock
properties
that are distributed in three dimensions so as to follow stratigraphic
correlations,
account for well data, and honor geologic interpretations. It accounts for
geophysical
information by converting the geologic model to synthetic seismic traces,
accounting for
fluid saturation, and comparing these traces with observed seismic trace data.
The
process perturbs the rock properties in the geologic model until the geologic
model is
consistent with geologic and geophysical data and interpretations.
This process produces 3-D geologic models of reservoirs that are optimized so
as
to match or conform as closely as feasible to geologic constraints on the
distribution of
z o observed lithofacies and porosity from wells in the reservoir, in the
process taking into
account stratigraphic correlations. The geologic models produced with the
present
invention match or also conform as closely as feasible to geophysical
constraints present
in seismic survey data obtained from the reservoir. This is done by
calculating acoustic
velocity and bulk density from the modeled lithofacies and porosity values.
These
2 5 values are used to calculate synthetic seismic traces to show the seismic
response of the
geologic model.
The process of the present invention provides for merging 3-D geologic
modeling with forward seismic modeling to produce geologic models that are
consistent
with both geologic and geophysical information obtained from the subsurface.
CA 02251365 1998-09-30
WO 97138330 PCT/US97/03979
11
The process of the present invention can use several types of data for
building
the geologic model: core- and log-derived lithofacies, porosity, and fluid
saturation data
from wells; seismic data from a 2-D or 3-D seismic survey; interpreted
structural and
stratigraphic surfaces and geological and geophysical criteria defining the
distribution
and relations of rock properties in the geologic model that must be matched or
honored.
The geologic model is a three-dimensional array of model blocks, which is
formed by generating a tentative 3-D geologic model and by assigning
lithofacies and
porosity values to each model block. Synthetic seismic traces are then
generated for
each vertical stack of blocks in the three-dimensional array. This is done in
the
i o following sequence:
Acoustic velocity and bulk density values are generated for every block from
the tentative geologic model based on the assigned lithofacies and porosity
values,
taking into account fluid saturation. Values for seismic impedance at each
block are
then obtained from the acoustic velocity and bulk density values. Reflection
~s coefficients are then calculated at the top and base of each block.
The seismic pulse waveform is convolved with the reflection coefficients. The
convolution results for all such blocks then provide a synthetic 3-D seismic
survey
which may be compared to the observed 2-D or 3-D seismic survey. The
characteristics
of the model can then be compared with the observed and desired geologic and
2 o geophysical criteria for the reservoir.
The comparison is made based on statistics that describe the distribution of
rock
properties within the tentative geologic model and the synthetic seismic
traces relative to
the geologic and geophysical criteria, including each of the following:
a) Geological criteria, e.g., lithofacies proportions, histograms of porosity
by
2 s lithofacies, 3-D measures of lithofacies and porosity continuity. This
match compares
statistics determined from the block values for lithofacies and porosity with
specified
criteria.
b) Geophysical criteria, e.g., amplitudes of observed seismic traces,
statistics
describing shapes of seismic traces, seismic-based properties defined for
intervals within
CA 02251365 1998-09-30
WO 97/38330 PCT/US97/03979
12
each seismic trace. This match compares observed seismic properties with those
calculated from the synthetic seismic traces.
An analyst may then assess the match between the statistics calculated for the
tentative geologic model and the actual geological and geophysical criteria.
If the match
is not within specified limits, appropriate adjustments are made to the
lithofacies and
porosity values in the tentative geologic model, and the modeling process
repeated.
This can be iteratively repeated until the match is within specified limits.
If the match is
within specified limits, an output record of the geologic model (i.e., block
values for
lithofacies, porosity, acoustic velocity, and bulk density) so formed is then
available.
1 o The geologic model so formed represents a realistic version of the
subsurface reservoir
of interest, which can be used to evaluate the need for and location of
additional wells,
for example.
An object of this invention is to develop a process for building 3-D geologic
models or representations of subsurface features that merges geologic modeling
with
i 5 forward seismic modeling.
An object of this invention is to develop a process for building 3-D geologic
models that accounts for geologic data and interpretations and geophysical
data and
interpretations, expressed in the form of criteria.
An object of this invention is to build 3-D geologic models that consist of
three-
2 o dimensional arrays of non-overlapping blocks in which rock properties
(e.g., lithofacies,
porosity) are assigned to the blocks.
An object of this invention is to develop a process for building 3-D geologic
models which begins from a distribution of rock properties, such as
lithofacies and
porosity.
2 5 An object of this invention is to build 3-D geologic models by iteration
on block
values of lithofacies and porosity.
An object of this invention is to wild 3-D geologic models by taking into
account geologic constraints, geophysical constraints, or both.
An object of this invention is to build 3-D geologic models which take into
3 o account the fluid content of the modeled domain.
CA 02251365 1998-09-30
WO 97/38330 PCT/US97/03979
13
An object of this invention is to build 3-D geologic models by simultaneous,
dependent, multivariable iteration.
An object of this invention is to build 3-D geologic models using either
actual
depth or relative stratigraphic coordinates.
An object of this invention is to build 3-D geologic models using multi-
component objective functions.
An object of this invention is to build 3-D geologic models which reproduce
stacking patterns of rock properties in the subsurface by directly integrating
seismic
traces as well as 3-D geologic criteria.
i o An object of this invention is to build 3-D geologic models which account
for
three-dimensional information about rock properties derived from seismic
survey data.
An object of this invention is to build 3-D geologic models for which
synthetic
seismic traces match observed seismic traces.
An object of this invention is to build 3-D geologic models which
is simultaneously account for the differing distributions of geologic or
geophysical data in
two or more zones, or in regions within zones, that comprise the modeled
volume.
An object of this invention is to build geologic models using either zero-
offset or
non-zero offset seismic data and modeling.
The process of geologic modeling according to the present invention has
several
2 o advantages over current geologic modeling approaches that sequentially
model
lithofacies and porosity. It simultaneously builds a geologic model of
lithofacies,
porosity, acoustic velocity, and bulk density. It also uses many geological
and
geophysical constraints to distribute rock properties in three dimensions.
This process of geologic modeling has several advantages over current
2s implementations that are based on impedance calculations in forward seismic
modeling
and model-based inversion. Calculation of seismic impedance and the forward
seismic
modeling used in this process is based on fundamental rock properties that
cause the
seismic response. Lithofacies and porosity, distributed parallel to
stratigraphic surfaces,
are converted to acoustic velocity and bulk density, accounting for fluid
saturation
3 o values, in order to generate the synthetic seismic trace. Other
contributions (e.g., from
CA 02251365 1998-09-30
WO 97/38330 PCT/US97/03979
14
the seismic-acquisition process and subsurface faults) are removed or
mitigated from the
observed seismic traces prior to this step.
The present invention uses geologic constraints on the three-dimensional
continuity of lithofacies and porosity to account for within-trace and between-
trace
s spatial correlations. It also reduces ambiguity in seismic inversion by
simultaneously
optimizing band-limited geophysical constraints within seismic bandwidth and
finer
vertical resolution geologic constraints on the scale of well data. It
produces a 3-D
geologic model in which synthetic seismic traces derived from this model match
observed seismic traces.
to BRIEF DESCRIPTION OF THE DRAWINGS
Fig. 1 is a schematic diagram of a portion of the earth's subsurface
containing a
reservoir of interest.
Fig. 2 is a schematic diagram of a three-dimensional array of seismic survey
data
obtained in the same area of the earth's subsurface as Fig. 1.
15 Fig. 3 is a brief schematic diagram of the processing sequence for geologic
and
geophysical data according to the present invention.
Fig. 4 is a schematic diagram of a representation of the reservoir of interest
in
Fig. 1 obtained by the process of Fig. 3 of the present invention.
Figs. SA and SB are a more detailed illustration of the process of Fig. 3.
2 o DESCRIPTION OF PREFERRED EMBODIMENT
Glossary of Terms
At the outset, and for ease of reference, certain terms used in this detailed
description of the present invention and their meanings as used in this
context are set
forth.
2 s Objective function - A mathematical function that indicates the degree of
agreement or disagreement between characteristics in a tentative geologic
model and the
desired characteristics of an acceptable geologic model. The function
typically is in the
form of a linear combination of calculated values of those components that are
specified
for use. The values of the components combine statistics calculated from the
rock
3 o properties in the model with corresponding user-specked criteria. The
function
CA 02251365 1998-09-30
WO 97/38330 PCT/US97/03979
commonly is defined so as to attain a value of zero for perfect agreement and
a positive
value for non-agreement.
Component - any one of the properties or characteristics in the set of
criteria.
Specifically, a component is represented by one of several terms in the
objective
function.
Criteria - a specified set of rules or constraints describing various
geophysical or
geological properties or characteristics of subsurface areas which must be
achieved for
processing results to be both realistic and accurate. For example, one
criterion may be
that the geologic model consist fifty percent of sandstone.
1 o Forward seismic model - a synthetic seismic trace formed by convolving a
seismic pulse with reflection coefficients obtained from estimated lithofacies
and
estimated porosity.
3-D geologic model - A representation of a portion of the earth's subsurface
that
is created to describe significant features, properties, and characteristics
of the rocks
i5 therein. Typical models are comprised of three-dimensional arrays of non-
intersecting
blocks which en toto fill the entire volume of rock being modeled. Each block
is
assigned values that represent rock properties ( e.g., lithofacies, porosity,
permeability)
in that respective portion of the subsurface. In order to best match geology,
models and
blocks should take into account structural features and stratigraphic
correlations, and
2 o such correlations should be used during the assignment of rock properties
to the blocks.
Tentative geologic model - A 3-D geologic model which may or may not meet
desired characteristics of the final geologic model that is being created. A
tentative
model typically is under consideration at each step in an iterative process
that perturbs
the model through modification of rock properties. It is tentative in the
sense that we
z s will only retain the model if it better matches the desired
characteristics of the final
geologic model.
Seismic model - A numerical model (1-, 2, or 3-D array) of acoustic velocities
and bulk densities associated with blocks in a geologic model or layers in the
subsurface; normally used for the calculation of synthetic seismic traces by
any of
3 o several methods in one, two, or three dimensions.
CA 02251365 1998-09-30
WO 97/38330 PCT/US97/03979
16
Seismic data - Information collected by creating seismic waves with sources of
seismic energy and observing the arnval times and amplitudes of the waves
reflected
from interfaces with contrasting acoustic velocity and/or bulk density or
refracted
through high-velocity intervals. These data are processed using procedures
such as
filtering, removing of multiples, muting, stacking, and migration.
Observed seismic trace - The recorded seismic-reflection record of the
response
of seismic energy after passing through, and being reflected by, rocks in the
subsurface.
The recorded response typically has been processed according to standard
geophysical
methods. Its usual form is a series of pairs of observed values, (T, AMP),
where T
s o represents seismic travel-time, and AMP represents the positive or
negative amplitude
of the waveform at that travel-time.
Synthetic seismic trace - An artificial seismic-reflection record which is
generated numerically from observed or hypothetical rock-property data and an
assumed
seismic pulse. The record may be generated by any of several forward seismic
modeling
15 processes. As with the observed seismic trace, the synthetic seismic trace
is comprised
of pairs of travel-times and amplitudes.
Lithofacies - the physical and organic properties and internal characteristics
of
formation or rock layers.
Porosity - the relative volume of pore space in a formation or rock.
2 o Observed lithofacies - lithofacies values obtained directly or indirectly
from
actual well data.
Observed porosity - porosity values obtained directly or indirectly from
actual
well data.
Estimated lithofacies - lithofacies values assigned to blocks at the outset
of, or
2 s calculated during, the iterative processing steps described below
Estimated porosity - porosity values assigned to blocks at the outset of, or
calculated during, the iterative processing steps described below.
Detailed Description
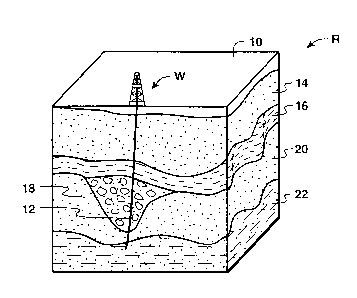
In the drawings, Fig. 1 illustrates schematically a subsurface reservoir R in
an
3 o area of interest beneath a surface 10 which may be the earth's surface or
the surface of
CA 02251365 1998-09-30
WO 97/38330 PCT/US97/03979
17
the sea. The reservoir R usually has been penetrated by one or more wells W,
such as
along a borehole 12, in one or several earth formations, such as those
indicated as
successively deeper layers 14, 16, 18, 20 and 22. After initial wells have
indicated that
the earth in the vicinity of reservoir R is of interest, it is necessary to
evaluate the
s reservoir as to its rock properties and internal characteristics. It is
desirable to obtain a
representation of the reservoir R which is as accurate a representation of
actual
subsurface rock characteristics as possible. Decisions as to where and whether
to drill
additional wells can then be made on information which is as complete and
realistic as
possible.
1 o The representation or image of the reservoir R at the outset at best is an
initial
surmise or estimate of actual earth reservoir features. To the extent that
there are
existing wells in the area, geologic data, typically in the form of
lithofacies and porosity
measures, are obtainable. These can be had from various actual measurements
obtained
by well logging instruments in the borehole 12 or from core samples taken in
the
ss formations adjacent to the borehole 12. From these measurements, either
directly or
indirectly, various geological parameters of interest about the formation in
the vicinity
of the borehole 12 are obtained.
Examples of such parameters of particular interest are the lithofacies and
porosity of the actual reservoir rock materials. Lithofacies at a particular
reservoir
20 location is an actual record of the rock in a particular sedimentary
environment; it
normally includes both physical and organic characters of the rock. These
include the
type of rock, its mineral content, its sedimentary structure, bedding
characteristics, fossil
content, and the like. Porosity of a reservoir rock is a measure of the
relative presence
of pores or openings present per unit volume in the formation rock; typically
these are
z s filled with fluid of some sort.
In Fig. 2 of the drawings, results of a three-dimensional seismic survey in
the
same area beneath the surface 10 are displayed schematically. The seismic
survey data
are records of the response of the subsurface formations in the area to the
travel of
acoustic energy. The energy is emitted from sources and sensed at receivers
arranged
3 0 over the surface 10 during one or more seismic surveys. Recordings or
traces 26 of this
CA 02251365 1998-09-30
WO 97/38330 PCT/US97/03979
18
energy are obtained for a plurality of locations over grid array G across the
surface 10.
As such, the traces 26 indicated are data samples indicative of the response
to seismic
energy of the three-dimensional earth volume beneath the surface 10, including
areas
which are not penetrated by, or near to, the well W shown in Fig. 1 or other
wells.
s However, as has been noted, existing seismic surveying techniques do not
provide the
ability to measure formation nature or content, including characteristics such
as
lithofacies and porosity, directly.
Another important type of information used by this process is interpretive
information derived from analysis of the well and seismic-survey data, as well
as
1 o geological concepts. This information, for example, may be in the form of
variograms,
histograms of lithofacies and porosity, maps of lithofacies percentages or
average
porosity, seismic attributes, and seismically derived lithofacies percentages
and average
porosity. Such data comprise the geologic and geophysical criteria used by
this process.
According to the present invention, the geologic data obtained from wells such
15 as W in Fig. I, seismic survey data of the type illustrated in Fig. 2, and
interpretive
information are processed. The processing according to the present invention
is
preferably performed using a digital computer of suitable computational
capacity in
terms of both speed and data volume. The result is a representation or
geologic model
M (Fig. 4) which more closely and accurately depicts the actual subsurface
2 o characteristics of the reservoir R based on the physical measurements and
interpretations, both geologic and seismic, available from it. The results
obtained are
thus also consistent with actual physical measurements and interpretive
information.
The representation or geologic model M of Fig. 4 is obtained by a process
including an initial data input procedure, indicated schematically at 40 in
Fig. 3 and an
2 s iterative optimization process 50, also shown in Fig. 3. Further features
of the data
input 40 and optimization process 50 of Fig. 3 are set forth in Figs. 5A and
5B.
The process of the present invention builds three-dimensional geologic models
M of the subsurface that primarily represent petroleum reservoirs and/or
aquifers, but
also can be used for other geologic applications. This process produces three-
s o dimensional geologic models M that are optimized so as to match (a) two-
dimensional
CA 02251365 1998-09-30
WO 97/38330 PCT/US97/03979
19
and three-dimensional geologic constraints on the distribution of lithofacies
and
porosity, taking into account stratigraphic correlations, and (b) geophysical
constraints
in the form of observed seismic traces by calculating acoustic velocity and
bulk density
from lithofacies and porosity and calculating the seismic response to the
geologic
model.
This process for merging three-dimensional geologic modeling with forward
seismic modeling produces geologic models that are consistent with geologic
and
geophysical information that describe the subsurface. The initial procedure
shown in
Figure 3 summarizes information used in application of this invention and the
modeling
to process.
This process can use several types of data for building the geologic model:
1. interpreted structural and stratigraphic surfaces obtained from seismic
data, as indicated at step 102;
2. core- and log-derived lithofacies and porosity data, during step 104,
15 obtained from wells such as W;
3. seismic data, like that of Fig. 2, from a two-dimensional or three-
dimensional seismic survey as indicated at step 106; and
4. geological and geophysical criteria defining the distribution and relations
of rock properties in the geologic model that must be matched as indicated at
step 108.
2 o The geologic model M to be formed is initially comprised of an assigned or
specified number of individual model blocks 90 (Fig. 4) in a three-dimensional
array.
The lateral or horizontal two dimensions of the array represent geographic
coordinates
along the surface 10 (Fig. 1 ) and the vertical dimension represents depth
beneath the
surface 10.
2 s The iterative optimization process 50 (Fig. 3) of the present invention
builds a
geologic model and is performed in the following sequence of steps:
1. Generate a tentative three-dimensional geologic model by~assigning
estimated and observed Iithofacies and porosity values to each model block
during a
step 1 I0;
CA 02251365 1998-09-30
WO 97/38330 PCT/US97103979
2. Calculate synthetic seismic traces for each vertical stack of blocks in
step
112, according to the following sequence:
a) Generate acoustic velocity and bulk density from the lithofacies
and porosity at each block in the tentative geologic model, taking into
account its fluid
5 saturarion;
b) Calculate seismic impedance for each block 90;
c) Calculate the reflection coefficients at the top and base of each
block 90; and
d) Convolve a seismic pulse of suitable form with the reflection
z o coefficients so obtained.
3. Calculate during step 114 statistics that describe the distribution of rock
properties within the tentative geologic model and the synthetic seismic
traces relative to
the following geological and geophysical criteria:
a) Geological criteria, e.g., lithofacies percentages, histograms of
1 s porosity by lithofacies, three-dimensional measures of lithofacies and
porosity
continuity. These statistics are determined from the block values of
lithofacies and
porosity.
b) Geophysical criteria, e.g., amplitudes of observed seismic traces,
statistics describing shapes of seismic traces, seismic-based properties
defined for
2 o intervals within each seismic trace.
4. Assess during a decision or comparison step 116 the match between the
statistics calculated for the tentative model and the geological and
geophysical criteria
and observed and synthetic seismic traces:
If the match is not within specified limits:
2 s a) Perturb lithofacies and porosity values in the tentative
geologic model, as indicated at 118 and update the geologic model 111; and
b) Repeat steps 112, 114 and 116.
If the match is within specified limits, output during step I20 a
representation or image of the geologic model (i.e. block values for
lithofacies, porosity,
3 o acoustic velocity, and bulk density) to a file or data display or both.
CA 02251365 1998-09-30
WO 97/38330 PCT/US97/03979
21
Figures SA and SB show in more detail how the process steps of Fig. 3 are
performed according to the present invention, which will typically be
implemented on a
digital computer.
Data Preparation and Initialization
1. An initial step 202 of the process is to form an array of blocks 90 in
three
dimensions that comprise the geologic model M. Blocks may be defined as having
constant dimensions one to another (typically, rectangular in plan view and of
constant
thickness), or they may vary one from another in size and shape. Typical
blocks are
made one foot to one meter thick, and twenty to one-hundred meters laterally.
It is only
to necessary that the non-overlapping blocks jointly describe the total volume
of rock
being modeled. The complete set of blocks should represent all portions of the
subsurface to be modeled, taking into account structural and stratigraphic
features and
correlations. At this stage, each block 90 has been assigned a position and
volume in
the subsurface, but has not been assigned rock properties (i.e., lithofacies
codes or
i5 porosity values). As is discussed further below, the preference that
structural and
stratigraphic features are taken into account leads to a preference to use a
correlative
coordinate system, which is sometimes also referred to as relative-Z
coordinates.
2. Next is step 204, performed to assign lithofacies and porosity observed in
wells such as W to the blocks 90. Observed lithofacies and porosity values
obtained
2 o from wells should be honored in the final geologic model. A preferred mode
of
operation is to assign lithofacies and porosity values directly to those
blocks 90
intersected by wells W. This assignment step involves both (a) determining
which
blocks are intersected by the boreholes 12 of the wells, and (b) placing the
values
observed at each intersected borehole segment into the corresponding blocks.
These
2 s assigned values are left unchanged during model block property value
modification or
perturbation, to be discussed below.
3. A user of the process is then required in step 206 to specify geological
and geophysical criteria or rules for modeling. This invention primarily is
focused on
building a geological model such that synthetic seismic traces generated from
the model
3 o match observed seismic traces. However, seismic-trace criteria alone are
rarely
CA 02251365 1998-09-30
WO 97/38330 PCT/US97/03979
22
adequate to generate a reasonable geologic model. For this reason, the
geologic
modeling process should include several additional geological and geophysical
criteria
that the geologic model must meet. Typical examples of non-trace criteria
include
measures of 3-D spatial continuity (e.g., variograms) of lithofacies and
porosity, maps of
s net/gross ratio, frequency distributions of lithofacies and porosity, and
calibration-
derived seismically based properties computed over seismic-time intervals.
Such
criteria are referred to hereafter as components.
The various components may each be defined in mathematical terms, allowing
comparison of desired values with those calculated from a potential model.
Combining
to components into a mathematical objective function summarizes the overall
match
between the geologic model and the desired criteria or rules. This allows
integration of
numerous types of information and relationships into the model.
Table 1 below lists criteria that have been found useful for geologic
modeling,
although other components may be equally useful.
~s Table 1. Useful Objective-Function Components
Geological components
Lithofacies
~ Two-point variogram (two-lithofacies indicator)
~ Two-point histogram (N lithofacies)
2 0 ~ Multipoint covariance (two-lithofacies indicator)
~ Multipoint histogram (N lithofacies)
~ Lithofacies fractions or percentages
~ Net/gross ratio
~ Maps of lithofacies fraction or percentage
2 s ~ Map of net/gross ratio
~ Vertical profiles of lithofacies fractions or percentages
Porosi (calculations optionally by lithofacies or for entire geologic model)
~ Histograms
~ Maps of average porosity
CA 02251365 1998-09-30
WO 97/38330 PCT/US97/03979
23
~ Vertical profiles of average porosity
~ Two-point porosity variogram
~ Two-point porosity-indicator variogram
Geophysical components
~ Lithofacies percentages or probabilities for intervals within
seismic traces
~ Average porosity for intervals within seismic traces
~ Seismic traces (amplitude)
~ Seismic attributes
i o ~ Map of interval velocity
In step 206, the user specifies values that such criteria are desired to
attain in the
final model. A typical example of a lithofacies-based criterion is the
percentage of each
lithofacies type (e.g., 35% sandstone, 65% shale) to be found in the final
model. An
example of a porosity-based criterion is the histogram of porosity in
sandstone that is
desired in the model. An example of a geophysical criterion is the set of
observed
seismic traces that are to be matched. The criteria may be specified in many
ways,
including numbers, variogram models, frequency distributions, and gridded
maps,
among others. It is also convenient to calculate such information from
separately
created 2-D arrays or 3-D models.
2 o Non-trace components are important even beyond the capability to integrate
various featwes. It is well known by seismic modelers that very thin beds will
have
only small effects on the form of generated synthetic seismic traces, and that
these
contribute to the non-uniqueness of seismic inversions. Observed seismic
traces and
synthetic seismic traces coarsely estimate the vertical variation and values
of lithofacies
2 s and porosity, but do not provide information on the fine vertical scale
typically required
of 3-D geologic models; one cannot expect seismic models alone to provide a
distribution of lithofacies and porosity at a finer resolution than is
provided by the
seismic traces. Accordingly, along with seismic traces, a preferred method of
performance of the present invention requires use of additional objective-
function
CA 02251365 1998-09-30
WO 97/38330 PCT/US97/03979
24
components to constrain the stacking of lithofacies and porosity. For
instance, vertical
variograms of lithofacies and porosity obtained from vertically detailed well
data
constrain fine details within the coarser trace resolution.
In addition, traces are closely spaced laterally, but each synthetic seismic
trace is
calculated independently and therefore carries no direct information regarding
lateral
continuity. Lateral variograms of lithofacies and porosity are useful
components for
controlling lateral continuity. Other useful components in the objective
function include
lithofacies fractions (global or mapped), porosity histograms (by
lithofacies), mapped
average porosity (globally or by lithofacies), and vertical trends in
lithofacies and
io porosity.
An important consideration in defining these criteria is to take into account
stratigraphic correlations. Lateral variograms, for example, should be
calculated to
measure continuity parallel to stratigraphic surfaces, not just at a
horizontal depth. If
structural dip and stratigraphic correlations are not considered, a variogram
calculated
horizontally will cross strata and represent non-correlative rocks. This
concept is
discussed further below regarding perturbation of the model block parameter
values.
Seismic traces are a key element in building the geologic model, and
themselves
constitute a criterion of the objective function. The observed seismic traces
are
associated with corresponding stacks of blocks 90 during step 208. When
seismic traces
2 o are selected, a preferred method is that only one trace be placed into a
stack of blocks. If
blocks are large relative to the spacing between traces, then a subset of the
traces should
be used. The traces nearest the block centers typically are used, but various
selection
criteria may be applied. On the other hand, if no suitable-quality traces
exist for a given
stack of blocks, that stack need not have a trace assigned, and no synthetic
seismic
traces need to be calculated for that stack. Lateral variograms and other
components in
the objective function will carry information into those blocks. For this
reason, traces
from 2-D seismic surveys may also be used with this invention.
4. Step 210 is performed to establish relations so that lithofacies and
porosity can be used to estimate acoustic velocity and bulk density. A single,
lithofacies-
s o independent relation may be used, or separate calibrations may be defined
for each
CA 02251365 1998-09-30
WO 97/38330 PCT/US97/03979
lithofacies; for most cases, a preferred method is to use a separate
calibration for each
lithofacies. A simple method for defining these relations is to establish
straight-line
interpolators, such as is commonly done with log curves in the field of
petrophysics.
Such interpolators relate acoustic velocity of the rock and fluid to porosity
(e.g. Wyllie's
5 equation), and relate rock and fluid density to porosity. Other similar
calibrations also
may be used. Interpolation of bulk density and acoustic velocity for a given
value of
porosity is then a simple matter.
An alternative method of defining these relations is to use bivariate
probability
distributions, say between bulk density and porosity. Here one may use a cross
plot, or a
i o correlation coefficient and an assumed bivariate normal distribution, to
represent the
relations between porosity and density. Similar bivariate relations could be
used
between porosity and velocity. For a given lithofacies and value of porosity,
values of
density and velocity may be obtained by randomly sampling from the appropriate
bivariate distributions.
is Seismic surveys are conducted over rocks that contain various fluids in
differing
amounts (i.e., water, oil, and gas) that affect the seismic response. When
calculating
acoustic velocity and bulk density for a block, lithofacies and porosity alone
may not be
adequate because fluid content can significantly affect bulk density and
acoustic
velocity. It is thus necessary to take into account water, oil, and gas
saturations. The
2 o calculated saturation for a given block is then used with porosity and
other information
to determine the proper values of acoustic velocity and bulk density for
calculating
synthetic seismic traces.
5. During step 212, time-depth conversion is performed on the interpreted
seismic surfaces using standard methods that are known to those skilled in the
art. Any
2 5 location along an interpreted seismic surface is known in seismic time,
and the time-
depth conversion allows a depth to be associated with every such location.
This
knowledge of the time-depth relationships along the gridded surfaces allows us
to
calculate seismic time corresponding to the depth of any block in the geologic
model.
6. Next, it is necessary to estimate or determine the seismic pulse that is
3 o appropriate for this seismic survey during step 214. This process uses the
normal
CA 02251365 1998-09-30
WO 97/38330 PCT/US97/03979
26
procedures known to those skilled in the art of seismic modeling. The pulse
may be
zero-phase or any transform thereof, such as minimum phase or an integrated
pulse.
It is to be noted that steps 210, 212, and 214 may be executed in any order
relative to steps 202 - 208. It is common that steps 210, 212, and 214 may be
executed
first, or that steps 202 - 208 be done in parallel to them.
7. An initial model is prepared during step 216 by assigning estimated
lithofacies and estimated porosity to those blocks not containing well data.
Step 216
fills the blocks 90 with lithofacies codes and porosity values, and may be
done in any
convenient, even arbitrary, way; a random process is typically used. It is not
necessary
i o that the assigned lithofacies and porosities meet any of the geological
and geophysical
constraints that will control the modeling process in the following steps. A
preferred
method is to sample from a desired fraction-distribution of lithofacies, and
to sample
from porosity distributions representing the lithofacies.
Another method of initializing the model is to load a previously generated
model
2s into the blocks. This is convenient if it is desired to change components,
weights, or
desired criteria part way through the model-building process.
8. Steps 218 and 220 are then performed to calculate a synthetic seismic
trace at every vertical stack of blocks 90 in the model. Given the initial
lithofacies and
porosity values for every block 90 in the model and the calibrations developed
in step
2 0 210, one can generate two new properties: acoustic velocity and bulk
density. The
product of acoustic velocity and bulk density in a block 90 defines acoustic
impedance
for that block. From these impedances, one may use well-known procedures to
calculate
reflection coefficients at the top and base of each block 90.
The seismic-modeling step 218, 220 typically is done in terms of seismic time,
z s rather than in depth, so times associated with the blocks are required.
The seismic times
to the top and base of each block 90 may be calculated by first defining a
reference
datum (say, surface 10 or at the top of the model) for which both time and
depth are
known, and then moving vertically through the model and using acoustic
velocities
assigned to each block to calculate the seismic times at the block boundaries.
CA 02251365 1998-09-30
WO 97/38330 PCT/US97/03979
27
Using the impedance and other information, the next step computes a synthetic
seismic trace for each vertical stack of blocks in the geologic model by
convolving the
seismic pulse with the calculated reflection coefficients, as indicated at
220. This
process is known to practitioners of seismic modeling.
Calculation of synthetic seismic traces is subject to seismic edge effects. A
seismic signal at any location depends not only on that location's rock
properties and
fluid content, but also on such properties above and below it. For example, in
the case
of a zero-phase pulse, this dependence extends at least one-half of the length
of the
seismic pulse above and below the location of interest. The synthetic trace-
generation
1 o process thus must account for such effects at the model's top and base.
Several methods
are available to correct for edge effects caused by non-existence of
impedances above
and below the modeled interval.
The simplest method forms a limited number of thick, model-wide layers with
assigned acoustic velocity and bulk density at the top and base of the model.
A more
is comprehensive method defines the 3-D model as containing added blocks at
the top and
base of the model. This second method is preferred unless computational time
is
considered to be significant.
9. Step 222 is then performed to calculate statistics to measure the degree of
agreement of the synthetic seismic traces with the observed seismic traces.
Each
2 0 observed trace consists of a series of time-amplitude pairs, (t, AMPobs).
For each time,
the synthetic trace also provides an amplitude value, AMPsyn. Step 222
compares the
synthetic seismic traces to the observed seismic traces to measure their
degree of
agreement. This may be done by, for example, calculating the root-mean-square
(RMS)
difference (or simply sum-of squares of differences, SSD) between AMPobs and
2 s AMPsyn for all pairs in a trace and over all traces, as follows:
SSD = Es Fn (AMPobs - AMPsyn)2
RMS = (SSD/n)~~
where Es represents the sum over all vertical stacks of blocks for which an
observed
seismic trace occurs, Fn represents the sum over all time points in the
seismic trace for a
CA 02251365 1998-09-30
WO 97/38330 PCT/LTS97/03979
28
given stack of blocks, and n indicates the number of pairs in the sums of SSD;
best
agreement is implied by RMS or SSD values near zero.
RMS is affected by the choice of origin and scale in the variable of interest.
If
RMS or a similar statistic is used to compare the synthetic trace with the
observed
seismic trace, the calculated measure of similarity will depend not just on
the degree of
match, but also on the amplitude gains (that is, relative amplitude scales) of
the two sets
of traces. To make a valid comparison of traces, these gains should be
identical for
both. Standard deviation of amplitude is a convenient measure of gain for this
purpose.
To ensure that the gains are equal, the standard deviation of amplitude in the
synthetic
1 o seismic traces can be forced to match the standard deviation of the
observed seismic
data.
An alternative measure is the correlation coefficient between AMPobs and
AMPsyn, calculated over all pairs of points in the traces; best agreement is
implied if
the correlation coefficient, r, is near 1. In order to match other components
(c.f. step
15 224, below) which attain optimum values at zero, an appropriate statistic
is 1 - rz. The
correlation coefficient is independent of origin and scale, so gain is not a
concern.
10. It is necessary then to calculate statistics to measure the degree of
agreement of non-trace criteria (Steps 224 and 226). Criteria that do not
involve seismic
traces were discussed in step 206 above and are included above in Table 1.
Such
2 o components normally must be employed to constrain the model sufficiently
to produce a
reasonable geologic model. In addition, they provide controls for blocks at a
vertical
resolution finer than that provided by the seismic traces, as well as provide
controls on
lateral and vertical continuity of rock properties. Use of such components
allows
integration of various types of information and relationships into the
geologic model M.
A preferred mode of operation when calculating statistics for these criteria
is to
take into account stratigraphic correlations between blocks in the model. For
instance, if
a bed is dipping, one should not calculate a variogram horizontally from one
block to
adjacent blocks, but instead determine the degree and direction of dip and
select those
3 o blocks that correlate stratigraphically to the block in question. This
process should be
CA 02251365 1998-09-30
WO 97/38330 PCT/US97/03979
29
followed when calculating all such criteria. Computation can be reduced if the
vertical
positions of the blocks are defined (step 202) according to correlative
coordinates (also
called relative-Z coordinates); if so, the blocks are stored in arrays
representing
correlative layers, and all blocks in such a layer are correlative.
Determination of
s correlative layers, either during calculations or for creating relative-Z
coordinates, is
based on computer grids that define stratigraphic correlations.
The modeling process (c.f., step 206) requires that training information
corresponding to the desired components or criteria be provided by the user.
In this
step, component statistics are calculated from the properties in the initial
model during
1 o step 224 and then compared to the desired values in step 226. For example,
consider
percentage of each lithofacies in the model as a criterion; a typical
comparison statistic
for this component might be the sum of squares of the differences between the
model-
wide lithofacies percentages (PCTcaI) in the current geologic model and the
desired
percentage (PCTdes), as
15 COM1 = E, (PCTcaI - PCTdes)2
where COM1 represents this first component selected for building the geologic
model,
and E, is the sum over all modeled lithofacies.
A second example considers the two-point variogram. Here a typical
comparison statistic is the sum of squares of the differences between the
model-wide
2 o variograms (yCal) calculated from the current geologic model and the
desired variogram
values {ydes), as
COM2 = E,, (ycal - ydes)2
where COM2 represents this second component selected for building the geologic
model, and ~h is the sum over all variogram distance and direction vectors.
2 s As a third example, consider porosity histograms; here one might use
COM3 = E, ~,~ (PORcaI - PORdes)2
where PORcaI represents the calculated fraction of porosities from the current
geologic
model in a class of the porosity histogram, PORdes represents the desired
fraction in the
CA 02251365 1998-09-30
WO 97/38330 PCT/US97/03979
histogram class, E, represents the sum over all lithofacies, and E~ represents
the sum
over the histogram classes.
The seismic-traces component is used in the same way as the others; if RMS is
used, then the seismic-traces component may be designated, for instance, as
COM4 =
5 RMS.
11. Step 228 is then performed to compute an objective function. The
specified components are combined into a multivariate objective function,
typically
through a linear combination of the individual components:
OBJ = ~ W; COMi
s o where W; represents a weight assigned to the i-th component, COMi, and the
sum is
over all components being used for building the geologic model. A preferred
method of
defining components of the objective function is to make them non-negative and
to
force them to reach an optimum value (perfect agreement) at zero. If this is
done for all
components, the objective function will have similar properties.
15 A preferred method of defining weights W; associated with each component is
to
let
W; = V; U;
where V; represents a weight that takes into account the variability of the
component
(e.g., inverse of the variance due to changing lithofacies or porosity values)
and U; is a
2 o user-defined, relative weight for the component. Some criteria are known
with greater
certainty or have greater importance than others, and the weighting factors
allow us to
take that into account. It is convenient to rescale the weights W; so that OBJ
= 1.0 for
the initial model.
Optimization Process
2 s The process in this invention requires perturbing the model's rock
properties
until a better match is made to the desired criteria, that is, until the
objective function
attains an optimum value. Any of several optimization processes can be used to
make a
series of perturbations provide a better fit of the model. The required
characteristics of
the optimization process are that properties of the individual blocks can be
mod~ed, an
CA 02251365 1998-09-30
WO 97/38330 PCT/L1S97/03979
31
objective function can be defined to indicate degree of agreement, and
perturbations can
be accepted or rejected.
One embodiment of this invention is to use simulated annealing because of its
ability to avoid entrapment in local minima in the objective-function space.
We also
s find that the maximum a posteriori method is effective as another embodiment
because
it requires fewer trials to find improvements in the objective function. Other
potential
optimization procedures include genetic algorithms, as well as combinations of
algorithms. The description here of the optimization method is in terms of
simulated
annealing because it is well known and easily understood.
12. The perturbation process is performed by randomly selecting a block 90
as indicated by step 230 and tentatively changing its Iithofacies and porosity
as indicated
at step 232. Blocks in which lithofacies and porosity values were assigned
directly
during step 204 are not candidates for selection; these observed values are to
be left
unchanged. For the selected block, a preferred method for perturbation is
randomly
i5 picking a lithofacies according to the desired proportions of each
lithofacies in the
model, and randomly picking a porosity from the distribution of porosities
corresponding to that lithafacies.
13. A tentative synthetic seismic trace for the vertical stack of blocks
containing the perturbed block is then calculated during steps 234 and 236. To
do this,
2 o use is made of the perturbed values of lithofacies and porosity for this
block with the
previously developed calibrations. This is done to generate, during step 234,
new,
tentative values of acoustic velocity, bulk density, and subsequently acoustic
impedance;
then reflection coefficients at the top and base of the block in question are
calculated.
When the model is initialized, the depths and corresponding seismic times to
the
2 s tops and bases of all the blocks are known. As the model is perturbed and
block
lithofacies and porosities change, however, the acoustic velocities associated
with each
block also change. This has the effect of changing the time-depth relation of
that block;
if velocity changes slightly, the block's thickness in seismic time also
changes. The
seismic-modeling process may deal~with this in two possible ways: (a) ignore
the
3 o thickness variation and keep the block dimensions (and time-depth
relation) constant, or
CA 02251365 1998-09-30
WO 97!38330 PCT/US97/03979
32
(b) as each block is perturbed and modified, recalculate the position in time
of that
block's base and those of all deeper blocks.
Step 236 is performed to compute a synthetic seismic trace for the vertical
stack
of blocks that contains the perturbed block. A preferred method of executing
this step
s differs from step 220, in that synthetic seismic traces should not be
calculated for the
entire model. Only a single stack of blocks is affected by perturbing the
values in one
block, so it is adequate to merely calculate that single synthetic seismic
trace.
14. During step 238, the degree of agreement of the tentative synthetic
seismic trace with the observed seismic trace is calculated. The statistic
(e.g., RMS)
1 o used to compare all synthetic traces with the observed traces in step 222
is also
computed here to determine if the tentative change in the perturbed block
leads to a
better match with the observed traces. Because only a single synthetic was
calculated,
computation of the tentative component, COMTi, is simplified. If S = Fn
(AMPobs -
AMPsyn)2 is computed for the given vertical stack of blocks, the tentative
component
s s may be calculated by
COMTi = Es* F,~ (AMPobs - AMPsyn)2 + S
where ES* represents the sum over all vertical stacks of blocks, except that
stack
containing the perturbed block.
15. The process next continues by calculating statistics to measure the degree
2 0 of agreement of non-trace criteria. As in step 224, the other geological
and geophysical
modeling statistics are calculated as shown at step 240 and tentative
components of the
objective function are compared during step 242. As with step 238, these other
criteria
should be defined in such a way that the statistics need not be recomputed
over the
entire model, but only over the portion affected by the perturbed block. In
general, a
z s preferred basis for selecting component statistics is that they can be
updated locally
without need to recompute them over the entire geologic model M.
16. The next process step, 244, calculates a tentative objective function. To
do this, the tentative component statistics for the seismic traces and the
other
components are combined into a tentative objective function, OBJtent = E W;
COMTi,
CA 02251365 1998-09-30
WO 97/38330 PCT/US97/03979
33
where again the sum is over all components, and the COMTi represent the
tentative
values of the components associated with this perturbation. OBJtent measures
the
degree of agreement between properties in the tentative model and the desired
properties.
17. Next in the process is decision step 246, whether to retain or reject the
perturbation. The decision made as to whether the tentative values in the
block are to be
retained or not depends on the value of the newly calculated objective
function. If the
tentative objective OBJtent is nearer the optimum than the current objective
function
OBJ (that is, OBJtent < OBJ) as indicated at 248, then the tentative
perturbation is
1 o retained. In this case, the tentative values of lithafacies, porosity,
bulk density, and
acoustic velocity are stored in the model, and the objective function and
components are
changed to the tentative values as indicated at 252.
On the other hand, if the objective function has increased as indicated at
250, the
values in the block and the objective-function components will be left
unchanged and
2 s processing returns to step 230. However, simulated annealing allows
retaining the
tentative change with a small probability regardless of the objective
function's increase.
This is designed to prevent convergence from being trapped in a Local minimum
in the
objective-function space. Other optimizing methods may not allow increases in
the
objective function.
2 0 18. After completion of step 252, step 254 is performed to determine if
the
model is adequate or complete. If not, control transfers to step 230 to repeat
the
simultaneous, dependent, multivariable iteration by sequentially perturbing
blocks
according to steps 230 through 244 described above. The decision to stop
perturbing is
made if a preassigned number of perturbations has been attempted or if
preassigned
2 s criteria (e.g., minimum acceptable value) on the objective function have
been attained.
19. On satisfactory completion of step 254, the generated model is provided
as an output to a file during step 256. The optimized model of lithofacies,
porosity,
acoustic velocity, and bulk density is now available for analysis, validation,
and for
geological, geophysical, or engineering applications with other software.
Typical uses
3 o include generating displays (e.g., cross sections of lithofacies or
porosity) from the
CA 02251365 1998-09-30
WO 97/38330 PCT/US97/03979
34
model, making geologic calculations, calculating other geological or
petrophysical
variables (e.g., permeability), or as input to reservoir simulation programs.
Another embodiment of the invention is useful for modeling two or more regions
or geological zones of differing geology. It is rare that one set of geologic
and
s geophysical criteria will be appropriate for describing the distribution of
lithofacies and
porosity for all portions of a reservoir. For instance, the reservoir may have
been
divided into geological zones on the basis of changes in lithofacies and/or
porosity and
changes in stratigraphic correlation. Even within a single geological zone,
regions or
groups of blocks may have different characteristic distributions of
properties, depending
so on their particular facies or association of fades. For such cases, non-
trace criteria
should be specified separately for geological zones and for portions of zones.
Three-dimensional templates may be defined to delineate individual portions
(laterally and vertically) of the reservoir. These may take on the form of 3-D
polyhedra,
but a simple concept from computer science -- a masking array -- is a
preferred mode.
1 s The mask may be defined to be an array of codes, each element of the array
corresponding to a block in the model; the code indicates which mask (that is,
which
geological zone or region) contains that block. Because the masks represent
regions
with different properties, an individual set of fitting criteria (desired
values used by the
objective-function components) should be used for each mask. Whenever a given
block
2 o is used in calculation of a fitting statistic, the calculation should be
based on the criteria
associated with that block's masking variable. Each component in the objective
function must then include sums over the masks. For instance, the lithofacies-
percentage component would be extended to
COMi = Em ~, (PCTcaI - PCTdes)2
2 s where Em represents the sum over all masks and the other terms were
defined above.
The total objective function is defined as previously. The synthetic seismic
traces are
calculated independently of masks, although the relations from
lithofacies/porosity to
density/velocity may vary by mask.
Examination of Fig. 4 illustrates schematically results achievable with the
3 o present invention using three geological zones. Lithofacies (sandstone,
shale) and
CA 02251365 1998-09-30
WO 97/38330 PCT/IJS97/03979
porosity values were estimated for blocks that comprised three stratigraphic
intervals or
zones 16', 18', 20' within the reservoir. Constant properties were assigned to
bounding
intervals 14' and 22' to reduce edge effects during calculation of synthetic
seismic traces.
Data from well W, seismic-survey data, and geologic criteria (e.g., average
net-
s to-gross ratio) give each interval a distinctive distribution of reservoir
quality with
predominantly high-porosity sandstones 18', predominantly low-porosity shales
16', and
more variable reservoir-quality rocks 20'. Each stratigraphic interval has
characteristic
vertical and lateral dimensions for sandstones and shales that match geologic
criteria in
the form of variograms. The shales and sandstones are oriented parallel to the
1 o stratigraphic correlation surface 17.
The principal reservoir interval of interest 18' has a clearly defined
sequence of
vertically decreasing reservoir quality, from high-porosity sandstones at the
base to
medium-porosity shaly sandstones near the top. This vertical stacking pattern
of
lithofacies and porosity values is consistent with interpretive geologic
information
i5 provided to the process as geologic criteria and is consistent with
observed seismic
traces. The principal reservoir interval 18' is bounded above by a relatively
homogeneous interval containing model blocks of low-porosity shale 16' which
is
consistent with the observed seismic traces. Interval 20' consists of
alternating beds of
variable reservoir quality, with high-porosity sandstones near the base
grading upward to
2 0 low-porosity shales.
The embodiment of this invention described above is directed to modeling
lithofacies and porosity. However, the invention is equally applicable to a
situation in
which any discrete and related continuous variables are modeled
simultaneously,
although seismic modeling may not be appropriate for certain variables.
Furthermore,
2s other embodiments of the invention exist to model a discrete variable
(e.g., lithofacies)
and two or more additional (continuous or discrete) variables; another example
is to
model lithofacies, porosity, and permeability simultaneously. If permeability
is
modeled, components similar to those used with porosity (e.g., continuity,
histograms),
plus relations between porosity and permeability, should be added; engineering
3 o components (e.g., well-test criteria) may also be used.
CA 02251365 1998-09-30
WO 97/38330 PCT/US97/03979
36
In addition to providing criteria for matching synthetic seismic traces,
seismic
data has other uses, including specification of the nature of the synthetic
seismic traces
that are generated. Zero-offset calculations of synthetic seismic traces is
the most
straightforward embodiment of this invention. However, generation of synthetic
traces
s could be implemented using 3-D ray tracing. This would account for non-zero
offsets
and be applicable to such seismic data as amplitude-versus-offset (AVO) data.
In this
case, AVO-calculated synthetic seismic traces may have to be generated for
additional
stacks of blocks near the perturbed block.
Seismic attributes are used by geophysicists to describe seismic properties in
a
1 o survey. These attributes are calculated from seismic traces, typically
from values within
time windows but also at specified seismic times. An example of such an
attribute is the
mean amplitude value within a portion of a trace. An objective-function
component
may be defined to compare an observed seismic attribute with the same
attribute
calculated from a corresponding synthetic trace, similarly to what is done
with trace
1 s matching.
Information from a seismic survey is used for calibration of seismic
properties to
well data. The typical starting point is definition of intervals in a 3-D
survey. These
intervals may be defined on the basis of seismically correlatable sequences,
inflection
points (for example, see commonly owned, co-pending U. S. patent application
Serial
2 o No. 08/422,021, "Method for Determining Formation Properties from Seismic
Attributes" of C. S. Calvert, et. al.), or other criteria. Calibrations
between well data and
seismic attributes are then used to assign properties (e.g., average porosity)
to each
interval at each shot-point location. These observed, calibration-based
interval
properties are used during the modeling process through comparison to the
current
2 s blocks' calculated values; this requires an additional component in the
objective
function.
The process of geologic modeling according to the present invention has
several
advantages over current geostatistical modeling methods that integrate
seismically
derived rock properties: It directly integrates seismic data into the
estimation of block
3 o properties.
CA 02251365 1998-09-30
WO 97/38330 PCT/US97/03979
37
This process of geologic modeling also has several advantages over current
geostatistical modeling methods that integrate seismic traces:
It accounts for the effect of lithofacies, porosity, and fluid saturation on
seismic
response.
It models lithofacies and porosity using geologic constraints and converts
these
block properties to seismic impedance in order to account for geophysical
constraints.
These steps, followed for each perturbation, permit the application of
separate geologic
constraints on the distribution of lithofacies and on the distribution of
porosity. This
eliminates the ambiguity in continuity of seismic impedance where impedance is
1 o responding to more than one rock property.
It uses optimization techniques that have a limited dependence on the initial
geologic model and that ensure reproduction of vertical and lateral variogram
constraints on the spatial continuity of lithofacies and porosity.
It simultaneously models multiple zones in order to account for complex
stratigraphy and seismic edge effects.
The foregoing disclosure and description of the invention are illustrative and
explanatory thereof, and various changes in the data acquisition and
processing
sequences, the parameters selected and analyzed, as well as the processing
sequences
described, as well as in the details of the process of operation described
above, may be
2 o made without departing from the scope of the present invention.