Note : Les descriptions sont présentées dans la langue officielle dans laquelle elles ont été soumises.
CA 022S796S 1998-12-09
WO 97/47236 PCT/US97/08993
WIDEBAND ~;X I ~NAL PULSE CARDL~C MONITOR
FIELD OF THE INVENTION
The present invention relates to the field of automated noninvasive peripheral vascular
and cardiac output status monitoring based on analysis of vibrational signals with
varying applied external pressure, and more particularly to noninvasive widebancl
external pulse (WEP) monitoring.
BACKGROUND OF THE INVENTION
CONVENTIONAL PRESSURE MONITORING
It is long known that peripheral blood pressure (BP) may be estim~ted using a
sphygn-om~nometer and stethoscope. In this case, when the cuff pressure is between
the systolic and diastolic pressures, a sound, called a Korotkoff sound, is heard. By
dete~ ning the cuffpressure at which sounds are audible through a stethoscope, both
systolic (SP) and diastolic (DP) pressures may be estim~te(l It has been found that the
blood pressures so obtained correlate with various physiologic conditions and have
both diagnostic and prognostic value. However, using standard teçhniques, errors in
blood pressure dete---l;nalion may occur. These errors are especially common when
dçfining diastolic pressure.
In a manual method of measuring a patient's blood pressure in non-invasive manner, a
cuff is applied to an arm of the patient and pumped up to a pressure above the systolic
blood pressure of the patient. The arteries of the patient are thereby pressed together in
an occlll~ing manner. The cuffpressure is then continuously decreased while the
physician or the nurse monitors by means of a stethoscope the start and the end of the
CA 022~796~ 1998-12-09
WO 97/47236 PCT/US97/08993
opening of the arteries in order to determine on the basis of these so-called Korotkoff
sounds: the upper, systolic and the lower, diastolic blood pressure by .~imnlt~neously
reading these values offfrom a manometer.
There are also automatic methods for pe~ ro~ lllh-g this measurement, called
"auscultation techniques". The blood pressure monitors employing this technique are
not deemed reliable, and in fact are subject to errors and artifacts. In addition, often
these techniques produce a result which fails to reveal useful clinical information. One
such device is disclosed in U.S. 5,509,423.
Blood pressure monitors and blood pressure measuring methods, respectively, have
been employed for a number of years in which the so-called oscillometric methods are
utili7e~1~ which employ the oscillations or fluct~l~tions of the walls of the arteries which
occur in synchlonisl.l with the blood pulse. According to the oscillometric techniques,
a cuffis pumped up to a pressure beyond the systolic pressure and is then deflated in
discrete steps. Alternatively, a cuffis inflated in discrete pressure steps up to a
predetermined measure beyond the systolic pressure. There is no universally accepted
scheme for measuring blood pressure using oscillographic methods; however there are
a number of commonalties in the various proprietary techniques.
During each step, where the cuffpressure is held subst~nti~lly constant (to avoid
artifacts), see, e.g., U.S. Pat. Nos. 4,349,034, and 4,074,711 and European Patent
Nos. EP-A-208520, EP-A-353315, and EP-A- 353316, or continuously inflated or
deflated, see, e.g., U.S. Pat. No. 4,625,277 and European Patent Nos. EP-A-249243
_ .
CA 022~796~ 1998-12-09
WO 97/47236 PCT/US97/08993
and EP-A-379996, a pressure sensor detects the oscillations caused by movement of
the arterial walls and superimposed on the cuffpressure. The ~mplit~ldes of these
oscillations are recorded. It is thought by many that the oscillations, at the systolic or
diastolic pressure, re~pe~ ely, have an amplitude value or peak- to-peak value that is
a fixed percentage of the maximum amplitude or m~im-lm peak-to-peak value at mean
pressure. Other criteria for tr~n~l~ting oscillometric waveform data into blood pressure
are known, and employed in the art. Thus, in the oscillometric measuring method the
pressure determined as systolic or diastolic pressure generally is the pressure at which
the amplitude or peak-to-peak value of the oscillations is at a specific cutoff, e.g., a
percentage of the maximum amplitude of the oscillations.
These various oscillographic blood pressure measurements are prone to artifacts.
Typical disturbances superimposed on the pressure signal are movements of the patient
and m-lsc -l~r tremor such as shivering. In addition, there are physiological
peculiarities, insh~ding arrhythmias, such as bigeminy and trigeminy, as well as the
cyclic ch~nr~es of BP due to respiratory variation. In the case of respiratory variations,
these ~.h~nges are real, and may themselves have diagnostic significance.
Oscillometric blood pressure monitors may selectively disregard oscillations, which are
related to artifacts. An artifact in known blood pressure monitors is recognized on the
basis of a criterion derived from the so-called oscillation channel. In oscillometric
blood pressure monitors, the oscillation channel is understood to be a signal channel
obtained on the basis of the so-called pressure channel signal, which con.stitutes the
pressure sensor output, by high-pass filtering. This oscillation channel thus
CA 022~796~ 1998-12-09
WO 97147236 PCT/US97/08993
corresponds to the harmonic waves or oscillations superimposed on the pressure
ch~nnel, dis,egalding the constant component. According to some known systems,
this oscillation channel signal is rejected as having a superimposed artifact when either
the ~cçn-ling slope of an oscillation exceeds a maximum increase value or when, at a
pressure step, the amplitude di~.t;,-ce oftwo adjacent oscillations exceeds a maximum
value or when an envelope criterion is not fulfilled according to which an ~ al;on
is made as to whether two oscillation amplitudes have not become more than double or
less than half between two adjac~n~ steps or when the time interval between two
oscillations varies by more than a specific percentage of the average time interval.
Such a system, however, is not capable of making a distinction between movement
artifact, cardiac arrhythmia or respiratory superimposition. U.S. Patent No. 5,355,890,
incorporated herein by reference, relates to a system for oscillographic blood pressure
measurement, employing pulse extraction techniques.
Because of the susceptibility of the algorithm used in the known oscillometric blood
pressure monitor, both erroneous measurements and unnecessary alarms occur. This is
of significance in particular since such blood pressure monitors are often employed in
operating rooms where a multiplicity of other parameters of a patient must also be
monitored, which may all cause alarrns. Such medical appa~ allls must therefore keep
the number of false alarms as low as possible, however without risking the recognition
of a genuine physiological alarm.
U.S. Patent No. 5,222,020 describes a blood pressure measuring apparatus which is
coupled with an occlusive cuffin order to acquire dynamics on a pulsatile wall motion
CA 022~796~ 1998-12-09
WO 97/47236 PCT/US97/08993
of human artery responding to the occlusive cuffas its pressure is lowered. The
n~ eQus cuffpressure (Pc) is first obtained with a pressure tr~n~d~-cer; then its
value is displayed on a CRT in real time as height variations of a mercury manometer
along with the dynamic palalll~ers describing the pulsatile wall motion. The dynamic
pa,~llc~ers are basically its displ ~~m~nt velocity and acceleration of the motion
generated by blood flow plllcating against the lowering Pc, which reflects the
mechanical cardiac cycle of heart as reported by F. Takeda, et al., in Med. Bio. Eng.
Comput., Vol. 29, Supplement Part 1, 1991 which is hereby incorporated by lererence.
See, M. Borow et al., Am. Heart J., Vol. 103, 1982; U.S. Pat. Nos. 4,718,428,
4,796,184, and 4,793,360.
U.S. Patent No. 5,178,154, incorporated herein by reference, relates to an impedance
plethysmographic method ~1tili7.ing peak aligned ensemble averaging. U. S. Patent Nos.
5,379,774 and 5,297,556, incorporated herein by reference, relate to impedance
plethysmographs which measure arterial elasticity by changes in arterial volume. U.S.
Patent No. 5,331,968 relates to an inductive plethysmographic tr~n~dllcer.
U.S. Patent Nos. 5,409,009 and 5,391,190 relate to implanted impedance
plethysmography devices for use in association with pacemakers. U.S. Patent No.
5,188,106 relates to an implanted ultrasound transducer for measuring cardiac output
and controlling a pacern~ker. U.S. Patent Nos. 5,496,361 and 5,480,412 relate to
cardiac wall accelerometers for control of a pace~k~r.
U.S. Patent No. 5,370,122 relates to a cardiac monitoring device.
,
CA 022~796~ 1998-12-09
WO 97/47236 PCT/US97/08993
DEVICES THAT MEASURE PVR
There are a number of available devices that non-invasively measure Cardiac Output
(CO). They use a variety of technologies. Each of these technologies determines
pelil)hcl~l vascular re~ietance as a function of a determined flow and pressure.
Thermodilution is an invasive procedure that carries a risk of mortality and is
expensive. See, U.S. Patent No. 5,241,966, incorporated herein by refelence.
Transthoracic Impedance monitors are difficult to use and do not provide accurate
h~,lnalion. On the other hand, they are noninvasive and carry no risk. U.S. Patent
No. 5,309,917 relates to a system for impedance plethysmography, a teçhniqlle for
noninvasive cardiac monitoring. Echocardiography is also noninvasive, but is
expensive, relatively inaccurate and requires a skilled technician.
U.S. Patent No. 5,390,679, incorporated herein by reference, relates to a cardiac
output determining device which senses an arterial pressure waveforrn and compares
the sensed waveform to a plurality of stored waveforms representative of known
states.
U.S. Patent No. 5,265,615, incorporated herein by reference, relates to a method for
measuring systemic vascular resistance based on an analysis of pressure waveforms
incl~ldin~ a first dichrotic notch.
U. S . Patent No. 5,211,177, incorporated herein by reference, relates to a non-invasive
vascular impedance measurement system using a modified Windkessel model of the
arterial system.
CA 022~796~ 1998-12-09
WO 97/47236 PCT/US97/08993
WIDEBAND EXTERNAL PULSE MONITORING
When using the standard ~llsc ~It~tory BP measurement technique, only a very small
percentage (appro~lllately 10%) of the energy recorded is within the audible range.
Thus, the majority of the energy is dissipated as low frequency signals. These signals
can be detected using applupliate wideband tran~d~lcers. Surprisingly, when using such
tr~n~ducers, signals can be recorded when the BP cuffis inflated above SP.
Description of WEP signal
When a bolus of blood is ejected from the left ventricle, by a heart beat, a (pulse) wave
of energy is created which travels from the heart to the periphery of the arterial system.
When the energy wave comes up against a barrier (in this case where the arteries
become very tiny arterioles), the wave is reflected back into the circulation, traveling
from the periphery back towards the heart and great vessels. The majority of the
energy in the pulse wave reflection is in the low frequency range. Both forward and
backward waves can be recorded using a wideband low frequency transducer placed
over the brachial artery.
Wideband external pulse (WEP) recording is based on the ability of a pressure sensor
to record inaudible frequencies (down to .1 Hz) during blood pressure cuffdeflation.
Three distinct components ofthe WEP signal can be detected, called Kl, K2 and K3.
TheKI Signal
With cuffpressure above SP (at a point when no Korotkoffsounds are audible), a low
frequency signal (Kl) is present. For each individual, Kl has a characteristic shape
.
CA 022~796~ 1998-12-09
WO 97/47236 PCT/US97/08993
generally consisting of 2 systolic peaks and 2 troughs. The second trough represents
the separation ofthe systolic and diastolic portions of Kl. The early peak represents
the energy generated by the contraction of the heart as the pulse wave travels from the
heart toward the periphery. The early systolic Kl pattern is determined by ventricular
ejection (stroke volume) and large artery stiffness.
The second (late) systolic Kl peak represents a measure of arterial pulse wave
reflection. Wave reflection in the arterial system occurs from arterial te~ inalions i.e.
the arteriolar bed. Peripheral vascular resistance is a measure of the degree of
contraction of the arteriolar bed. Since the level of vasoconstriction of the arteriolar
bed is the major factor for both peripheral vascular resistance ("PVR") and the
intensity of pulse wave reflection, the K1 pattern varies with measure peripheral
vascular resiet~n-~.e. Other factors, such as age (i.e. arterial stiffneee) may be involved in
the baseline Kl pattern, but acute changes are due to changes in PVR.
Kl Analysis - Description of KlR
Three vectors are defined from baseline: the initial peak (Yl), the subsequent trough
(Y2), and the second systolic peak (Y3), as shown in Figs. 9A and 9B. Fig. 9A shows
a typical Kl pattern of a young person with norrnal blood pressure, while Fig. 9B
shows a typical Kl pattern of an elderly hypertensive patient.
These patterns (Kl pattern) are reproducible in individuals, tend to change with age,
yet have been found to vary in di~-enl physiological states. Analysis of these waves
has led to a derivative called the Kl Ratio and the related KlR.
CA 022~796~ 1998-12-09
WO 97/47236 PCTtUS97/08993
A K1 Ratio is c~ ted by:
K1 Ratio = (Yl - Y2) / Y3
KlR = ln (Kl Ratio)
Thus, KlR is the natural log ofthe K1 Ratio.
It has been demonetrated that this ratio ~le~lines with age, but more importantly, can
change many-fold in a particular individual depending upon the state of vasodilatation.
Thus, the concept has been developed that changes in KlR (and the Kl Ratio) are due
to changes in reflectance of waves in the circulation. As such, KlR can be used as a
direct measure of both the physical properties of large arteries and the degree of
peripheral vasomotor tone.
The K2 Signal
K2 appears at SP and disappears at diastolic pressure, which appl o~ill,ately
corresponds to the audible Korotkoff sound. The appearance/disappearance property
of K2 is the basis for an objective and more accurate method for measuring blood
pressure, called K2 analysis. A legitimate Korotkoff sound cannot be present without
the visual presence of K2.
K2 Analysis
The K2 analysis technique using Wideband External Pulse (WEP) recording correlates
better with the intraarterial blood pressure than the auscultatory technique. Blank, S.
et al., Circulation, 77:1297-130~,1988. See also, Blank, Seymour G., "The Korotkoff
.. . . . .
CA 022~796~ 1998-12-09
WO 97/47236 PCT/US97/08993
Signal and its Relationship to the Arterial Pressure Pulse", Ph.D. Thesis, Cornell
University (1987) (U~ 8810638), expressly incorporated herein by reference.
The presentation of WEP data in more than one dimension has been the subject of
some study. Denby, L. et al., "Analysis of the Wideband External Pulse: An
application of Graphical Methods", Statistics in Medicine, 13 :275-291,1994.
There are situations in which the ~l.L~c~-ltatory technique has acknowledged difficulty.
These include the presence of ~usc~-lt~tory gaps, pl egnancy, and narrow pulse
pressures.
WEP measurements have been proposed to assist in the interpretation of peripheral
blood pressure measutemelll~ in the presence of auscultatory gaps. Blank, S. et al.,
"Characterization of Ausc~-lt~tory Gaps With Wideband External Pulse Recording",
Hypertension, 17(2):225-233, 1991.
In pregnancy and narrow pulse pressures, WEP measurements have been used as a
validation standard with which to evaluate the auscultatory technique. Blank, S. et al.,
"How should diastolic blood pressure be defined during pregnancy?", Hypertension,
24:234-240,1994. Blank, S. et al., "Isolated elevation of diastolic blood pressure: real
or artif~ctu~l?" Hypertension, 26.383-389, 199~. WEP has also been employed to
assess underdeveloped K2 (ausc~lt~tory gaps) with respect to vascular sfiffi~ess and
atherosclerosis. See, Cavallini et al., "Association ofthe Ausc~llt~tory gap with
Vascular Disease in Hypertensive Patients", Ann. Intern. Med. 124:877-883 (1996).
. .
CA 022~796~ 1998-12-09
WO 97/47236 PCT/US97/08993
The K3 Signal
K3 appears with cuffpressure between SP and DP and continues to be present below
DP. K3 resembles the intraarterial pressure waveform. Thus, when calibrated
according to K2 analysis (i.e. SP and DP), direct dete,n,ina1ions of mean arterial
pressure and noninvasive dp/dt measul e"~e"1~ can be made.
Measurement of Mean Arterial Pressure from WEP Recording
The determination of mean arterial pressure is traditionally based on the formula:
MAP = Diastolic Pressure (DP) + k x (SP - DP)
where k represents a form factor which is generally ~csumed to be 1/3. In actuality, k
depends on the shape of the intraarterial pressure pulse, and can vary from 0.2 to 0.5.
Thus, significant errors can occur when calcul~ting MAP in the traditional manner
(from SP, DP and k factor).
Using WEP Recording, DP and SP can be accurately determined using K2 Analysis.
Since K3 closely resembles the intraarterial pulse, and can be calibrated according to
analysis of K2, MAP can be directly measured from the area under the curve. Analysis
of K3 can yield an accurate measure of the k factor mentioned above.
Physiological Studies Relating K1 Ratio to Peripheral Vascular Resistance
In 12 elderly patients, immediately prior to undergoing major joint replacement
surgery, measurements of Kl Ratio (and KIR), cardiac output (CO), peripheral
vascular resistance (PVR) and other hemodynamic variables were concurrently
measured during 5 dil~erenl physiological states. These included infusions of
CA 022~796~ 1998-12-09
WO 97/47236 PCT/US97/08993
epinephrine (E) and norepinephrine (NE) both before and following epidural blockade.
The results of this study were published in 1994 ("Comparison of Changes in Kl ratio
and Systemic Vascular Reeict~nce following Epidural ~nesth~sia as indices of
Vasodilatation~', ASRA Annual Meeting 1994, p. 69).
Assessment of Cardiac Contractility Using WEP Recording
A measure of cardiac contractility can be determined noninvasively by determining the
rate of rise of a calibrated K3 signal using the so-called dp/dt concept. Similarly, a
measure of cardiac contractility may be derived from the upstroke of a calibrated K1
pattern.
Systems for Measurement of Wideband External Pulse
According to the prior art, the system designed to measure wideband external pulse
(WEP) acoustic emissions employs high precision, large dynamic range foil electret
microphone with a linear high impedance electrometer.
Various piezoelectric materials are known, which are able to convert vibrations or
movements into electrical impulses. These may include polyvinylidene fluoride
polymers, e.g., Kynar~, or polylactic acid. See, U.S. Patent No. 5,298,602. AT&T
provides a type of wideband Foil Electret Sensor, with no significant change in
sensitivity under a pressure range of at least 0 to 250 mm Hg, with sensitivity over its
entire surface and a flat (-3dB) bandwidth of from below 0.1 Hz to above 2000 Hz.
CA 022~796~ 1998-12-09
WO 97/47236 PCT/US97/08993
Therefore, such a Foil Electret microphone may be used as a wideb~nd acoustic
tr~n~d~lcer in an appa~al~Js to obtain the wideb~nd external pulse, connected to a high
impedance (109 Q) amplifier, such as a Keithly electrometer (Model 600B) (Keithly
Instr!lm~nt~, Cleveland OH) and then to a direct current amplifier model DCV-20 of an
Electronic for Medicine/Honeywell model VR6 physiologic lecoldh-g system
(Electronics for Medicine, Pleasantville, N.Y.) .
The known device inchldes an inflatable cuff for encircling the arm and receiving
vibrational signals over the brachial artery. The cuff pressure may be controlled by a
Hokanson E-10 cuffinflator (Hokanson, Issaquah WA) and the pressure may be
manually read with a mercury column or a Gould-Stratham P23 ID or T4812 AD-R
(Gould- Stratham, Oxnard, CA) pressure tr~nsd~lcer connected to the physiologic
recording system through a PDV-20 amplifier. The deflation rate of the Hokanson unit
is m~m~lly set to about 2-4 mm Hg./sec.
The wideb~nd acoustic data may be analyzed with a computer system, such as a DEC
LSI 11/23 computer, sampling at 400 samples per second with 12 bit resolution. An
IBM PC/AT or equivalent may also be used, sampling a 12 bit analog to digital
converter at 500 samples per second, using CODAS (Dataq, Akron OH) data
acquisition software.
Other Tr~n~ducPr Systems
An electret transducer array, as disclosed in U.S. Pat. 5,388,163, incorporated herein
by reference, may be constructed of an electret foil and a backplate. The electret foil is
~ ~ . . .....
CA 022S796S 1998-12-09
WO 97/47236 PCT/US97108993
flexible, having two layers, a metal (such as al~-minllm) layer and a synthetic polymer
(such as PTFE Teflon~) layer. The metal layer may be, e.g., two thousand Angstroms
thick, while the polymer layer may be, e.g., between 2-100 microns thick. The polymer
layer is given a permanent charge, to form an electret, to a predetermined value at,
e.g., -300 volts, by conventional techniques. A positive compen~ating charge is
induced in the backplate and the metal foil layer.
The electret element is ~it~l~ted to be sensitive to the acoustic waves traveling in the
tissue. Thus, a mounting is provided which provides a vibration-free reference. Thus,
any piezoelectric activity in the electret element is presumed due to relevant acoustic
waves and not artifact. Thus, the tr~n~ cer is used to detect vibrations from the
brachial artery through skin and tissue. A backplate may be formed of a sintered or
porous material to allow air flow behind the element while providing structural rigidity.
Multiple segment~ of an electret transducer array may be formed by the selective
removal of the metal layer from the electret foil to achieve tr~n~d~lcers of any desired
shape, size, and location. Selective removal of portions of the metal foil layer for the
purpose of forming segments may be accomplished by etching or dissolving the metal
using a chemical reagent, such as a solution sodium hydroxide or ferric chloride, or
otherwise in known manner with a variety of chemical and/or photoetching treatments.
Alternatively, segm~.nt.s may be defined on the foil prior to charging and mounting on
the backplate. This may be done by selectively met~li7.-ng the polymer layer to form a
foil. Selective met~li7~tion may be performed by conventional metal deposition
CA 022~796~ 1998-12-09
WO 97/47236 PCT/US97tO8993
techniques (e.g., m~ing evaporationj sputtering, etc.) to form se~,,..e~l s of any
desired size, shape, and location. A continuous electrode foil having a polyrner layer
selectively charged (with either or both polarities) in defined locations may also be
used.
Electrical leads are coupled to each individual electrode se~ Also provided is an
electrical lead, coupled to the backplate, which may serve as a common lead for the
tr~n.~clucers of the array. The electrical leads for the segments may also be formed as
conductive traces on the surface of the electret element, preferably electrically
in~ ted from the surface. By means of these leads, electrical signals produced by each
tr~nqducer in response to incident acoustic signals may be accessed for amplification
and other processing.
An alternative piezoelectric tr~ncducer may be used as a hydrophone, as disclosed in
U.S. Pat. No. 5,339,290. Typical suitable polymers include PVDF, but the copolymer
P(VDF-TrFE) is p, e~l l ed because of its flexibility with regard to the poling process
that is conventionally employed in defining a piezoelectrically strong active area. For
exarnple, the active area may be provided at the center of the piezoelectric membrane,
which may be a single-sheet type or bil~min~te. U.S. Patent No. 5,365,937 relates to a
piezoelectric tr~n~d-lcer for receiving heart sounds. U.S. Patent Nos. 5,337,752 and
5,301,679 relate to systems for the analysis of body sounds.
As disclosed in U.S. Pat. 5,363,344, a tr~niducer may be forrned of a material called
C-TAPE by C-TAPE Developments, Ltd., 3050 S. W. 14th Place, Boynton Beach,
_, . . . . . .
CA 022~796~ 1998-12-09
WO 97/47236 PCT/US97/08993
16
Fla. 33435. This material is the subject of U.S. Pat. No. 4,389,580, hereby
incorporated by I ererellce.
Therefore, the prior art discloses systems capable of obtaining wideban-l external pulse
("WEP") signals under laboratory conditions, and further discloses studies analyzing
data so obtained to determine blood pressure. The prior art acknowledges the richness
of the information included in the WEP signals, but does not teach or suggest how this
hlrolll.a~ion may be extracted and employed to determine the cardiac status of an
individual patient, other than blood pressure, and further does not disclose automated
instruments for obtaining and analyzing the WEP data. Therefore, the prior research
of the present inventor remains in~.cessible in a clinical setting.
CA 022~796~ 1998-12-09
WO 97/47236 PCTIUS97/08993
SUMMARY OF THE INVENTION
The present inventor has therefore sought to implement systems and methods to obtain
reliable WEP data from patients in a clinical, office or home setting, and to analyze this
data to produce not only reliable blood pressure ("BP") re-~in~, but also cardiac
output ("CO") and peripheral vascular re~ist~nce (L'PVR7) dete--ni-l&lions.
The WEP data may also be analyzed to produce composite indicators of diagnostic or
prognostic implication, which need not be directly related to traditional cardiovascular
status determinations. Further, because the WEP data is multidimensional, it may be
presented in a variety of ways to easily convey the complex h~r~ .alion.
In analyzing the WEP data, the K1, K2 and K3 data from the WEP tr~n.~ducçr are
analyzed to yield significant information. However, an instrument may also include
additional tr~n~d~lcPrs for detecting other physiological parameters, which may be
analyzed and presented separately or employed to provide improved indication of
cardiovascular status.
CARDIOVASCULAR STATUS CALCULATIONS
Most of the energy generated under a blood pressure (BP) cuff contains frequencies
below the audible range. In conjunction with a sphygmomanometer, a pressure sensor
system having sensitivity down to 0.1 Hz, i.e., -3 dB sensitivity, produces a
reproducible graphic pattern called the wideband external pulse (WEP). Three
particular components of the WEP have been identified having particular significance,
called Kl, K2 and K3. The K1 signal is recorded with cuffpressure above systolic
CA 022S796s 1998-12-09
WO 97/47236 PCT/US97/08993
18
pressure, i.e., where no Korotkoffsounds are heard. The K1 signal generally exhibits
three peaks of varying amplitude separated by two troughs. The second trough
separates the systolic and diastolic portions of the cardiac cycle. The shape of the K1
is believed to be related to the physical propel lies of the arterial system. K2 appears
and disappears at systolic pressure (SP) and diastolic pressure (DP) respectively. The
appearance/disappearance propel Iy of the K2 may be used to accurately measure BP.
The K3 resembles an intraarterial (peripheral) waveform, which can be calibrated with
the K2 analysis to allow accurate mean arterial pressure and dp/dt determination.
According to the present invention, the waveform derived from the wideband external
pulse sensor may be analyzed and changes in cardiac output and stroke volume for a
given patient may be derived. Thus, a non-invasive monitor may be provided to
determine cardiac and circulatory status of a patient. It has been found that by
~sses~ing the K1 ratio, PVR and changes in PVR can be assessed (see infra). By
concurrently determining blood pressure by analysis of K2 and analyzing the K3
waveform, the mean arterial pressure (MAP) may be accurately determined, and CO
may be derived according to the formula CO=MAP / PVR, or to obtain results in liters
per minute, CO=80(MAP)/PVR in commonly expressed units. The various
cardiovascular factors may be updated frequently, e.g., every 1-2 mimltes. Since the
K1, K2 and K3 waveforms are measurable from an external cuff, the need for invasive
procedures or multiple instruments is eliminated. It is noted that full, unabridged cuff
inflation/deflation cycles may not be necessary under certain circ.-m~t~nces, so that
rapid measurements of CO may be obtained, from truncated measurement cycles.
CA 022~796~ 1998-12-09
WO 97/47236 PCTtUS97/08993
19
The heart rate ("HR") can also be easily determined by WEP recording. Consequently,
stroke volume ("SV") of a heartbeat can be calculated by the CO divided by ~:
SV = COtHR.
The inventors hereof have found that, for a given individual, the shape of the Kl
pattern, as expressed by the Kl ratio, is related to biometric factors and PVR, over a
wide range of arterial pressures with varying hemodynamic conditions, i.e., changes in
CO and vasomotor tone. Thus, for each patient, the In (Kl ratio) is very closely
correlated with PVR over the entire range of conditions. Since MAP (K2 and K3
analysis) and PVR (Kl analysis) are independently ~sess~ble, CO may be computed
each time a measurement is made, e.g., a full cycle of cuffinflation/deflation. Thus, for
an individual patient, relative changes in cardiovascular status may be monitored by
non-invasive means, and once calibrated, absolute indications of cardiovascular status
may be ~ ssed
There is no established "gold standard" for the measurement of arterial stiffness.
Population cross sectional data demonstrates that the Kl ratio and KlR are seen as
strongly correlated to dilrel elll measures of arterial stiffness. In regression analysis,
when age is inch~tled in the analysis, arterial slilr,.ess drops out as an independent
factor, suggesting that the resting Kl pattern may reflect arterial structural changes
associated with the aging process. The monitor according to the present invention, by
directly measuring arterial compliance, can therefore be used to assess degenerative
ç~es of large arteries (inclu-ling the aging process).
~ . , -- .... . .
CA 022~796~ 1998-12-09
WO 97147236 PCT/US97/08993
The Pe~iph~lal vascular recist~nce is a known metric which, when multiplied by cardiac
output, yields the mean arterial pressure. On the other hand, there are broader
concepts which relate to the relationship of blood pressure and flow, which also
depend on the size and status of the m~mm~l being evaluated. Thus, by analyzing
biometric factors in addition to WEP data, the standard metrics may be calculated. On
the other hand, it may also be valuable to evaluate the standard metrics such as PVR,
CO and MAP in view of biometric differences. For example, a m~mm~l with a larger
body mass would be expected to have a larger cardiac output and therefore lower
peripheral vascular resistance. Therefore, in order to include such biometric
considerations, the concepts are referred to herein as peripheral vascular impedance
value (L'PVI"), indicating this more complex relationship. One specific PVI
repl es~ alion, known in the study of cardiovascular status, is the PVRI, or the
peripheral vascular resi~t~nce indexed for body surface area.
The size of the vascular tree of a given m~mm~l tends to be correlated to its body
surface area; therefore, the larger the surface area1 the greater the amount of peripheral
tissue, and the greater the vascular tree supplying that tissue. It is hypothesized by the
present inventors that the effects of the peripheral v~ccul~t-lre on the K1 signal varies
dependent on the size of the vascular tree. Thus, it is believed by the present inventors
that the PVR c~lcul~tion may be norrnalized for this effect by reference to body surface
area.
There is thus believed to be a physiological basis for a relationship between KlR
(In[KI ratio]), and PVRI. When a pressure pulse is generated by the heart, it creates a
CA 022~796~ 1998-12-09
WO 97/47236 PCT/US97/08993
(pulse) wave of energy which travels from the heart to the periphery of the arterial
system. When the energy wave comes up against a barrier (in this case where the
arteries become very tiny arterioles), the wave is reflected back into the circulation,
traveling from the periphery back towards the heart and great vessels. The majority of
the energy in the pulse wave reflection is in the low frequency range. This energy
signal can be recorded using a wideband low frequency tr~neduc~r placed over the
brachial artery as WEP data, providing there is no blood flowing through it. The
brachial artery is occluded by a pressure cuff(inflated above systolic pressure). Thus,
this is a biological signal whose physiological significance has been hitherto
unrecognized.
The present invention thel erore includes the detection of these low frequency signals
for:
analysis of a derivative ofthe Kl waveform - KlR;
measurement of PVRI (and PVR) from its relationship to KlR;
measurement of MAP from K2 and K3 analysis;
calculation of cardiac output from MAP and PVR;
derivation of a measure of arterial compliance by knowing PVR and the
slope of the decay from K3; and
measurement of cardiac contractility from the upslope of K 1 or K3 .
Thelerule, accordh~g to the present invention, significant cardiac status may be
calculated by relatively simple analysis o~the WEP data. The present invention
CA 022~796~ 1998-12-09
WO 97t47236 PCT/US97/08993
therefore provides a system and method for obtaining and analyzing the WEP data to
determine cardiovascular status.
As stated above, in 12 elderly patients undergoing major joint repl~cçm~nt surgery,
measul~;me,lls of Kl Ratio (KlR), CO, PVR and other hemodynamic variables were
concurrently measured during 5 di~eren~ physiological states, ins1u~1ing infusions of
epinephrine (E) and norepinephrine (NE) both before and following epidural blockade.
See, "Comparison of Changes in Kl ratio and Systemic Vascular Resistance following
Epidural ~nesthesi~ as indices of Vasodilatation", ASRA Annual Meeting 1994, p. 69.
Reanalysis of this data by the present inventors, relating the KIR (In [K1 Ratio]) to
peripheral vascular resistance index (PVRI) demonstrated a tight relationship (r=0.96).
The determined relationship between KlR and PVRI, which is PVR indexed to body
surface area, Is:
KlR= .004 x (PVRI) + 3.217
or
PVRI = (3.217 - KlR) x H 250
From these equations, when KlR = 0, PVRI = 714 dyne sec cm~5 m~2. Furthermore, for
every change of KlR of 1, PVRI changes by 250 ur~its. Thus, with the above formula
and correction for body surface area, K1 analysis can be used to directly and
noninvasively measure PVR. As stated above, once PVR is determined, CO can be
derived using measurements of MAP using the forrnula CO = MAP/PVR, or CO
(L/min.) = 80(MAP)/PVR.
CA 022~796~ 1998-12-09
WO 97/47236 PCT/US97/08993
23
These specific m~th~m~tir.~l relationships between KlR and PVRI were derived from a
relatively homogeneous patient population of elderly patients undergoing total joint
arthroplasty. The relationship is first order linear, and has a high correlation coefficient
(r=0.96), verifying the physiological significance of the relationship. Nevertheless it is
possible that the exact mqthem~tic~l relationship between KlR and PVRI may vary in
certain populations, e.g., obstetric patients or neonates. Further, it may be found that,
under certain circ~mct~ncec, a dilrerenl biometric compensation is necess~ry to
deterrnine PVR. Therefore, for each subpopulation, the relation of KlR and PVI may
be determined, with the algorithm selected based on the patient subpopulation
identification as necess~ry. It is also noted that in particular instances, the K1 signal
may be analyzed in a more sophisticated manner, to determine characteristics of the
arterial system.
Arterial Compliance can be derived using a first order Windkessel model of the
circulation by measuring the downslope of the K3 signal. The time constant of the
exponential downslope equals (PVR) x H (Arterial Compliance). Since we can
determine the downslope directly from K3, and the PVR from KlR, we can compute
Arterial Compliance:
C = ~C3/PVR
- Arterial compliance measured noninvasively by WEP recording may provide hitherto
unobtainable information on degenerative diseases of large vessels such as
atherosclerosis, calcification of great vessels, and hardening of the arteries from aging
and hypertension.
CA 022~796~ 1998-12-09
WO 97147236 PCT/US97/08993
24
Likewise, cardiac contractility may be deterrnined by analyzing the Kl or K3 upslope.
Furtherrnore, because of the richness of the data obtained by WEP analysis, the
presenlalion need not be limited to known parameters, and in fact the WEP system
accol dh~, to the present invention may be used to generate composite indices with
prognostic or diagnostic significance. Further, while the inventors hereof have found
that standard cardiovascular indices may be determined by relatively simple analyses,
more complex analyses of the WEP data may be conducted, using algorithms, neural
networks or the like to produce known or new relationships between the WEP data
and prognostic or diagnostic measures. Further, while the simple calculations
generally required to obtain cardiovascular status are often sufficient, exceptions, if
any, to these calculation forrns may be identified and corrected to improve reliability.
Neural networks are known processing systems for determining the solution to
problems which are very difficult to handle by means of conventional logic systems, or
where the logic or algorithm is complex or not well understood. Neural networks are
generally programmed by "training" with data sets, rather than by explicit definition of
their expected behavior. While conventional methods require complex algorithms,
which explicitly forrnulate the relationship between input variables, neural nets "learn"
the relationship between the variables. For each neural net, the connections andlor
w~ighting of connections must be provided so that for a given input pattern the neural
net generates an appropriate output pattern. See, D.E. Rumelhart et al., "Learning
Internal Representations by Error Propagation", in D.E. Rumelhart & J.L. McClelland
(Eds.), Parallel Distributed Processing: Explorations in the Microstructure of
Cognition (Vol. 1), pp. 318- 362, MIT Press, 1986, Cambridge, Mass. See also, U.S.
Pat. No. 5,253,329, incorporated herein by reference. Neural Network methods may
CA 022~796~ 1998-12-09
WO 97t47236 PCT/US97/08993
be combined with fuzzy logic techniques in order to provide expert input into the
processor operation. See U.S. Patent Nos. 5,448,681 and 5,446,826, incorporated
herein by reference.
Thel erore, given the richness of the cardiovascular status hlro~ alion contained within
the WEP signal, a neural network may be trained to ~Csori~te WEP signal patterns and
prognostic or diagnostic information. For example, a large series of persons may be
subjected to WEP surveillance along with traditional medical care. Data is retained
inclu~in~ raw or processed WEP signals, as well as details of other clinically significant
parameters, diagnoses and outcomes. After a large amount of data is obtained, it is
used to design and train a neural network to relate the WEP signal data with the
diagnoses and outcomes which were deterrnined for each patient. Other clinical data
may also be included in the analysis, design and training. The trained neural network
may then be able to receive WEP signal data and possibly other information and output
information predicting diagnosis or outcome. Where this prediction has a low error,
e.g., root mean square error over the training data set or an identifiable subpopulation
thereof, the neural network may then be employed as a diagnostic or prognostic tool.
TRANSDUCER
A variety of tr~n~rlucer types may be used in the present invention. For example, one
version may use a more expensive transducer which would be non disposable.
Alternately, cheaper tr~n~duc~rs for simpler monitors may be used. Finally, a version
may include a disposable cufffor use in patient care en-~non",~nls where infection
control is an issue e.g. intensive care, emergency room, neonatal units. The disposable
CA 022~796s 1998-12-09
W O 97t47236 PCT~US97/08993
26
version may also include a separate sensor which is secured over the brachial artery
with an adhesive. Once placed, this would also f~ilit~te comparison of repeated
çstim~tions with ch~n~ing physiological states and make it easier for nursing staff to
oversee.
The preferred wideband acoustic transducer according to the present invention has an
acoustic sensitivity over the range 0.5-500 Hz, and more plefel~bly at least 0.1-5000
Hz, under application of a range of 0-300 mm Hg applied pressure. Further, the effect
of pressure is preferably predictable and repeatable under a range of environmçnt~l and
applied con-litiQn~. Therefore, it is appal-el" that the lower range of sensitivity extends
well below the normal audible range, and further that normally compensated audio
componentry is generally insufficient, having a -3dB lower cutoffof around 20 Hz.
Normal pressure trAn~d~lc~rs, on the other hand, have the low frequency sensitivity, but
may fall short on the upper end, and are not generally sensitive enough or configured
properly to accurately receive the WEP acoustic signal. It has been found that electret
tr~n~ducers, known in the art, are suitable as wideband acoustic transducers under the
pressure cuff. However, prior tr~nsdllcers were laboratory instruments, having high
cost and limited availability. Further, when the tr~ned~.c~r is integrated into a system,
external compensation may be applied to allow use of tr~n~ducers which have low
selectivity, being sensitive to a number of environmental factors, in addition to acoustic
vibrations.
A low cost system may therefore be implemented using a met~li7ed Kynar~ sheet
tr~n~ducçr (ELF Atochem/AMP Sensors). Kynar~) is a polyvinylidene fluoride
CA 022~796~ 1998-12-09
W O 97/47236 PCTrUS97/08993
(PVDF) homopolymer or copolymer, formed as a sheet. This sheet has a high
dielectric strength of about 30 V/mil, and is highly piezoelectric. A met~li7ed 22 mil
Kynar~ sheet has a source impedance of about I ol3 Q per square, thus requiring a
relatively high h,.pedance amplifier for linear wideb~n~l operation. Alternatively7 the
electret trancducer may be integrated with a charge b~l~n~.ing amplifier, providing a
direct pulse modulated output from the tr~n.cd~lcP.r system.
Another alternative tr~ncducer system that may be used is the "acoustic contact
sensor" ARC model 701010, available from Apollo Research Corporation, Depew NY.
This device can easily be modified to achieve the required low frequency response (0.1
Hz) of, e.g., the 'Lpulse pressure tr~nsducer" ARC model 701012, while having a
housing suitable for situation under a pressure cuff.
It is ple~lled to localize the sensitive area ofthe tr~n~ducer over the brachial artery at
the distal edge of the cuff, to m~int~in a high signal to noise ratio and reduce artifacts.
Therefore, one aspect of the invention involves simplifying the pl~celnçnt of the WEP
tr~n~d~cer over the brachial artery. This may be done in a number of ways. First, the
WEP signal may be obtained during manual placement, seeking the maximum signal
amplitude, presumably when the tr~n.cduc~r is over the artery. Alternately, a
multisegm~.nted tr~nsducer is provided which is placed generally over the artery, so
that the segm-ont or segmentc which have the maximum signal amplitude or otherwise
determined to have optimal pl~cem~nt may be used in subsequent analysis.
By seg,.,~ g the wideband external pulse transducer, a number of advantages may
accrue. First, by localizing an active segment or segmentc over the artery of interest,
CA 022~796~ 1998-12-09
WO 97/47236 PCT/US97/08993
28
generally the brachial artery, the signal to noise ratio of the signal will be increased.
Further, various artifacts may be minimi7ed in relation to the signal of interest.
Tr~n~clucer se~,,.. l~ Iocated distal from the artery of interest may be used as control
se~m.o,nte, allowing compensation of characteristics of the active se~ A
seg1nented electrode system may also allow phase dirrelel.liation of tissue or vessel
acoustic conduction, and allow implernent~tion of a phased array tran~d~cer. The
output of the phased array may be processed in known manner to detect the location
and nature of a signal source, and to dirrel ellliate various signal sources, allowing
effective filtering.
In one embodiment, the metal foil layer of the electret foil is provided as a plurality of
discontinuous segment~. These se~ments define the shape, size, and location of the
active areas of individual electret transducer elements in the array. Data from a number
of such se~m~nts may be obtained. This allows, for example, segm~nt~tion of the
transducer into regions, one or more of which may be used to measure the arterial
pulse, and optionally allowing one or more regions as compensation segm~nts to
identify and compensate for artifacts, en~d~o~ nl~l factors and interference.
Like the individual segments defining tr~n.ccJucer shapes, the array itself may be formed
of any size and shape. So, for example, the present invention may provide a single
planar tr~n~ducer, or a multiple transducer array curved to fit a three-dimensional
contour. The known foil electret transducer includes a stiff support member. A film
tr~n~duc~r according to the present invention also preferably includes a stiff support,
or may be provided as a flexible member under the pressure cuff in such configuration
CA 022~796~ 1998-12-09
WO 97/47236 PCT/US97/08993
29
to retain low frequency sensitivity and relative isolation from changes in output due to
changes in cuff pressure.
By employing a low cost polymer film tr~ncducer with approp,iate electronics for
conditioning and compç~ g the high impedance signal, a mass produced device is
possible. In addition, by employing a met~li7ed polymer film tr~n~ducer, the
transducer may be well integrated into the device, i.e., the cuffstructure. This may
therefore be used as an alternative to the higher cost electret tr~ncducçr
Unlike well col"pensa~ed sensors, raw PVDF films are both piezoelectric and
pyroelectric, requiring temperature compensation for accurate long terrn output.
However, if the temperature induced changes occur on a timescale much larger than
acoustic emissions, then these may be separated by time filtering, or time filtering in
conjunction with a temperature compensation circuit. It is noted that, in the present
system, two effects may induce thermoelectric effects. First, the pulsatile arterial blood
flow may produce cyclic temperature variations. Since the cuffintermittently occludes
blood flow, the cuff inflation may induce thermal variations in the output of the
tr~n.cd~cer. However, these signals will generally be small, and even if significant, may
be generally filtered from the true acousto-electric signal, e.g., by a model based filter
implemented in the processing computer.
Electret materials, such as Kynar~ (PVDF), may also be responsive to acceleration,
vibration, flexion, and other environm~nt~l influences. In order to ~limin~te these
unwanted influçnces from the desired measured variable, the system may compensate
CA 022~796~ 1998-12-09
WO 97147236 PCTIUS97/08993
through measured or estim~ted effects of the confounding infl~lçnce5, and/or filtering
ofthe signal to selectively ll~nsnlll the desired portion ofthe output ofthe tr~n~d~lcer.
For e,~anlple, a tel"pel ~LIlre sensor may be provided for telllp~;l alure colllpensalion of
the entire tran~ducer or portions thereof. Likewise, artifacts due to movement, muscle
contractions, or "crinkling" of the tran~d-lcer during cuff pressure ~ es may be
compPn~ted by a tr~ncduccr which is not subject to, or less subject to, the acoustic
excitation, such as a transducer segment which is distal from the brachial artery but
otherwise subject to a similar environment. A simult~neous ECG and/or respiratory
status input may be used to provide synchronization for a time-based analysis, or
synch~ oni~dlion may be based on arterial pressure pulses.
The PVDF sheet tr~n~d~lcer may be provided with a segmented electrode pattern by
etching an Alllmin~lm met~li7~tion with ferric chloride solution. A segmented electrode
may be advantageously used to increase the signal to noise ratio by localizing the
active portion of the acoustic sensor over the source of acoustic emissions, and
optionally by providing compensation ~egmpnts
ELECTRONICS
High impedance electrometer amplifiers, e.g., low femptoamp range input currents,
may be formed with JFET input stages, with input protection to prevent overload.
These amplifiers may produce noise, especially at low frequencies. For example, the
Analog Devices (Nor~vood, MA) AD549 amplifier has an input current of around 60
fA. Preferably, a single operational amplifier is provided per segment of the tr~n~(lucer.
The outputs of the amplifiers may then be multiplexed and digiti7ed and analyzed by a
CA 022~796~ 1998-12-09
WO 97147236 PCTIUS97/08993
microco~nrllter system. Alternatively, in order to reduce costs in a multiple segmçtlt
tr~n.cd~1cçr, discrete JFETs may be provided to buffer the input from each segmlont of
the tr~n~dllcer The JFET circuit outputs may then be multiplexed, ~ ti7ed and input
to a rnicrocomputer system for analysis. CMOS ele~ u~ ler arnplifiers are also
available, such as the National Semiconductor LMC6001 amplifier.
Suitable analog to digital converters are available from a number or sources. For high
resolution, which may simplify interface circuitry, Analog Devices AD1382, AD138S,
AD676, A:D677, AD776, AD1876, AD7701, AD7703, AD7872/7872, AD7882,
AD7884/7885, AD7715 or AD7716, National Semiconductor ADC16071 or
ADC16471 devices may be used. For systems with lower resolution, 12 bit integrated
data acqui~ition system devices, e.g., National Semiconductor ADC12L03X,
ADC1213X, LM1243X, LM1245X, or Analog Device AD7858, AD7874 may be
used.
Microprocessors having integral 10-bit (or greater) resolution analog to digital
converters may also be used, inclu~ing the Microchip PIC16C74 (8 bit ADC), Siemens
80C167, Philips 89CE558 microcontroller (10 bit ADC), Hitachi H8S2653 (10 bit
ADC). Of course, other microcûntrollers with internal or external, preferably 10-bit or
greater resolution ADC's may also be used. Where resolutiûn is in~deqll~t~ a
subla. gh~g design employing a digital-to-analog converter in the system is used to
effectively extend resolution and compensate for drift and low frequency changes. A
DC accurate switched capacitor high pass filte! with a cutoff frequency below the
lower frequency limit of the transd~lcçr, e.g., less than 0. ~ Hz, may also be used to
CA 022~796~ 1998-12-09
WO 97/47236 PCT/US97/08993
cG~,~pensd~e for offset and low frequency effects to "~ ;" the signal within an
optimal range.
DSP systems, such as the Texas Instruments TLC320AC02 or TLC320AD58C and
TMS320C3X, TMS320C5X or other digital signal processor and con.l)alible analog
interface devices may also be employed to process the WEP signal, especially where
complex algolilhll.s are executed. However, such devices are not considered generally
necess~ry to perform simple Kl, K2 and K3 analyses, but may be advantageous for
complex neural network c~lc~ tions.
While the WEP signal may be analyzed using a 8-10 bit analog to digital converter
("ADC") and an 8 bit microcomputer, the availability of cost-effective powerful system
components makes their use preferable. The computer is therefore preferably an 8-32
bit microcomputer, interfaced with a 8- 18 bit delta-sigma analog to digital converter
having a sampling rate of in excess of about 4800 ~Iz, and a low frequency cutoff of
below 0.2 Hz. The microcomputer may include DSP elem~.nts or be interfaced with a
DSP for signal analysis, e.g., Texas Instruments 320CXX, Motorola ~60XX, or
Analog Devices ADSP-21XX.
On the other hand, as an outpatient monitoring device, the preferred system inr.ludes a
highly integrated 8 or 16 bit microcomputer having an integral 8-10 bit ADC, with
inputs receiving conditioned signals from the cuff pressure transducer and WEP
tr~neduc~r~ as well as status inputs from the deflation valve and inflation pump motor.
Keypad input and LCD output may also be provided. In addition, an audio interface,
CA 022~796~ 1998-12-09
WO 97/47236 PCTIUS97/08993
such as a piezoelectric ~lemçnt may be used as an çnl-n~ or or data output interface,
and may also be used as an input device for limited voice co.. ~n-ls or in the manner
of an acoustic remote control. An infrared or telephone modem device may also be
jnc~ ded
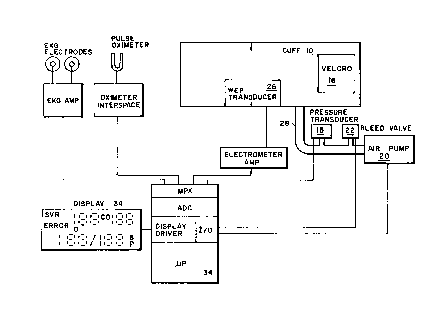
Cl lFF MECHANISM
The blood pressure measurement apparatus for automatic non-invasive monitoring of a
patient's blood pressure comprises a pressure cuff applied to an arm of the patient, a
pump for infl~ting cuff, e.g., to a predetermined pressure, a pressure sensor for
producing a pressure signal indicative of the pressure within the cuff, a valve system,
e.g., driven by a microprocessor, for stepwise or continuous control of the pressure
applied to a limb by the cuffand preferably for ensuring that between sequential
hea"l,eals, the cuffpressure differs by a small amount.
Such m~.h~nismi are standard and well known. The WEP of the present system is
provided under the distal edge of the cuff and adjacent to an artery, generally the
brachial artery.
A disposable cuff, for infection control or in situations where return of the cuff may be
delayed or unlikely, may be formed of a plastic or rubber film or a reinforced film. For
example, a polyurethane film bladder with fabric lamination may be employed. The
tr~n.ccl~lcer may be affixed to the cuff, or separately located on the brachial artery by
adhesive. The cuff may be provided with a single or multiple tube connection to the
pump, relief valve and pressure transducer, which are preferably reusable.
. ...
CA 022~796~ 1998-12-09
WO 97/47236 PCT/US97/08993
34
SIGNAL PROCESSING AND ANALYSIS
In order to analyze the tr~n~d~cer output signal(s), characteristics of the signal in both
the time and frequency ll~n.,ro~n domains are relevant. These analyses may be
conducted in a number of ways. For ~-a~nl)le, a frequency domain ll~nsru.lll, e.g.,
DCT or Fourier lr~srolln may be employed, which may advantageously be used in
conjunction with a filtering algolillJIll to filter various artifacts, such as muscle tremor
and contraction indllced output, which will show significant power in the range of
about 6-10 Hz. Other types of artifacts and baseline drift due to cuffpressure deflation
may also be filtered in this manner, or optimal filters applied based on predetermined
models ofthe expected or known artifacts. This same frequency-domain llan~rolll,ed
signal may also be used for processing the signal, e.g., K2 analysis, to determine events
of relevance in the analysis proper. After filtering, an inverse Fourier transform may be
employed to reconstruct the filtered time domain signal for aspects of the analysis, as
n~Cç~c~ry.
The filter may be adaptive, using e.g., fuzzy rules to identify and filter artifacts in the
tran~d~cer output, based on their relative timing in the pulse waveform, vibrational
characteristics and st~ti-ctic~l parameters. By employing fuzzy logic paradigms, an
expert defines preprogrammed rules which characterize set inclusion for multiple
criteria, while allowing versatility and the ability to handle real data.
In order to pclrO~Ill analysis ofthe pulse pressure waveforms, it is necess~ry that a
series of puise pressure waveforms be acquired by the wideband external pulse
tr~n~ducer over a range of cuff pressures. Through signal analysis or external gating,
CA 022~796~ 1998-12-09
WO 97/47236 PCT/US97/08993
such as by myocardial electrical synchronization (EKG), the be~innine of each pulse
pressure waveform is determined, and the pulse analyzed. Above systolic pressure,
each pulse is analyzed for Kl analysis, useful for analysis of arterial system pl opel lies,
e.g., PVR. At cuffpressures between systolic and diastolic pressures, K2 analysis is
used to accurately delel~l~ine intraarterial pressures. At cuffpressures below diastolic
pressures, K3 analysis is used to determine mean arterial pressure, dp/dt and arterial
compliance. The Cardiac output and stroke volume may then be determined.
A computer receives data from the wideband external pulse tr~ncducer through an
amplifier, signal conditioning electronics as necessary, and an analog-to-digital
converter. Other physiological parameters may also be multiplexed and input through
the data acquisition system for use by the microprocessor. These ~ iti7ed signals may
be analyzed in the time domain, frequency domain, through wavelet transforms and/or
in other signal I epl eselllalion spaces. Because a large number of pulse waveforms are
acquired in the course of a single cardiac output measurement, it is preferable that
waveforms be analyzed to extract significant pa~l.elers frequently, rather than storing
all data and waiting until one or more full cuff inflation/deflation cycles are completed.
These significant parameters include systolic pressure, diastolic pressure, pulse-
pressure waveform characteristics, and the Kl Ratio.
n~ a pulse rate at about 60, desired accuracy of about 2 mm Hg (or ~5% FS for
CO measurements), for blood pressure determinations over a range of 50-250 mm Hg,
about 0.5 minlltes and 32k data samples stored in memory are required, without data
complession or real time analysis. With real time signal analysis and intellig,ont cuff
cycling, the full cuffinflation/deflation cycle and the data storage requirelllt;lll~ may be
CA 022~796~ 1998-12-09
WO 97t47236 PCT/US97/08993
further reduced, respccLi~ely, f~cilit~tin~ delayed processing. It is preferred to perforrn
some degree of processing during sample acquisition. In addition to potentially
redu~ing cycle time and data storage requirc;~ s, such analysis potelllially allows a
reading affected by a detected artifact to be repeated. In particular, the K1 and K3
signals may be obtained at any pressure above systolic and below diastolic pressure
respectively, and thelc;ro~e there is no need to obtain a full complement of readings at a
full range of pressures. These signals may be statistically processed in order to
improve the quality of the data.
DEVICE CONTROL
In order to perform the analysis of Kl, the cuffis inflated to a level above systolic
pressure, so that no Korotkoff sounds are evident. The actual pressure is not critical,
but should not be so high as to cause pain or tissue damage, and therefore may be
adaptively applied at a level of between about I S0-300 mm Hg, based on a determined
or predicted margin above systolic pressure, e.g., 20-30 mm Hg above systolic
pressure.
For example, during cuff inflation, Korotkoff sounds may be heard up to an inflation
pressure of 135 mm Hg. In order to ensure an adequate margin for securing a K1
signal, the cuff is inflated to about 20 mm Hg over the estimated systolic pressure, or
to about 155 mm Hg. The cuffis held at this pressure with no inflation or deflation,
for a series of beats while the signal is analyzed for the presence of artifacts. If it is
likely that the data is ~In~llit~ble, an alarrn condition is indicated to the operator of the
device, and that portion of the data is ignored. The device may also continue to seek
CA 022~796~ 1998-12-09
WO 97147236 PCT/US97/08993
clean data for a limited period, although the cuff should be periodically defl~ted in
order to prevent tissue icr.hçrni~ and colllpal Llllent syndrome.
After the cuffis inflated and Kl data obtained, the cuffis then slowly dçfl~te.i, either
contin~oucly or stepwise, so that the cuff pressure çh~-ges between about 1-3 mm Hg
between each sUccee~ive heal lbea~. When the cuff pressure drops below systolic
pressure, Korotkoffsounds are heard. A portion ofthe wideband external pulse signal
may be analyzed for both K1 and K2 as the cuffpressure drops.
Between systolic and diastolic pressures, the wideband external pulse data is analyzed
for K2, which is somewhat related to Korotkoff sound analysis, but does not rely on
audibility of the sounds. Rather, the K2 analysis determines the blood pressure
COI I ~sl,onding to systole and diastole by analyzing the available data for characteristic
corresponding signals, which, of course, include the audible signals received by the
WI~P tr~nc~ cer~ Due to this broader data base, a more accurate acseccment of
systolic and diastolic blood pressures is possible, with reduced subjective infl~lçnce.
The K2 is characterized by a high frequency signal which appears, with cuff deflation,
at systolic pressure and disappears at diastolic pressure. A computing system, e.g., a
microcomputer, is provided to analyze the WEP signal for signal pattern characteristics
in conjunction with a cuffpressure, and produces a set of BP re~.lingc, which may vary
due to r~s~h~lion, functional changes, or medical intervention. While the WEP is
known for determining BP based on K2 analysis, the present invention provides an
automated system having improved ease of use and pelrcllllance. K2 analysis may
also provide other clinical inforrnation, e.g., relating to a~c~ltatory gaps. See,
~ . .
CA 022~796~ 1998-12-09
WO 97/47236 PCTIUS97/08993
38
al., L'Association ofthe ~-lscl-lt~tory gap with Vascular Disease in Hypertensive
Patients", Ann. Intern. Med. 124:~77-883 (1996), incorporated herein by ~efele. ce.
Below the determined diastolic pressure, the K3 signal appears, which is a low
frequency signal resembling the intraarterial pulse waveform. Obviously, components
of this signal will repeat at the pulse rate, and further components will have a
filn~mPnt~l frequency at the lesph~lion rate. Therefore, the low frequency response
of the WEP tran~dl~cçr is particularly important in the analysis of this aspect of the
WEP signal. A sensor system may be employed with a suitable composite frequency
response across the required range, but in many cases, a single tr~n~d~1cer provides a
simpler and more inexpensive solution. Since the K2 signal reveals the absolute
pressures of systole and diastole, the K3 signal may be calibrated. Mean arterial
pressure, dp/dt and arterial compliance can then be determined.
While the K1 ratio is norrnally indicative of PVRI, e.g., by the formula:
KIR = 004 x (PVRI) + 3.217
In certain in~t~ncec, a more complex or alternate analysis may be prerelled. For
example, population subsets for which the above formula is somewhat inaccurate may
be idP.ntified Therefore, while the formula may be generally applicable, alternate
analyses may be employed, e.g., by means of a lookup table, curve fitting algorithm or
neural network. A neural network analysis may be used to extend the K1 ratio analysis
described above to the other aspects of the K1 signal, and indeed to other available
data, which may include telllpel~lure, heart rate, EKG analysis, K2 analysis, K3
analysis, blood gas levels (preferably determined non-invasively, such as
CA 022~796~ 1998-12-09
WO 97/47236 PCT/US97/08993
39
analysis, blood gas levels (preferably determined non-invasively, such as
tr~n~Cut~neol~c di~.~,nlial specLIophotometry), lesp;lato.y rate, subject's medical
history, and other factors.
Thus, to analyze the WEP signal, the WEP tr~n~d~lcer receives an acoustic signal,
which is subject to electronic and digital signal filtering. Sçlected pala...G~ers are then
analyzed, e.g., the heights ofthe first and second major peaks ofthe K1 waveform, as
well as the height of the intervening troughj the time delay between the peaks and
troughs of the Kl waveform, the first derivative of the Kl waveform at selected
timepoints, as well as the subjectns age, body surface area, the blood pressure as
determined by K2 analysis, and parameters extracted from the K3 waveform. The BP,
CO, PVR are then deterrnined and output.
MULTITRANSDUCER SYSTEMS
An EKG interface to the system may be provided, and full vector cardiogram data may
also be provided as an input to the system. This provides the possibility for integrated
analysis, and also provides data by which to trigger an exception processing routine if
an irregular heartbeat occurs during wideb~n~ external pulse analysis. Another
alternative is to integrate the WEP monitor with a pulse oximeter. The WEP monitor
may also be interfaced with a thoracic stethoscope or other tr~n.cduGer may be used to
detect ~ lion, for correction of analysis or synchronization of data acquisition.
It ls thus envisioned that WEP monitors may be used either as a stand alone monitor or
in colllbh~alion with other monitors. These other monitors may include a combination
CA 022~796~ 1998-12-09
WO 97/47236 PCT/US97/08993
fetal heart rate monitors; uterine contraction monitors, and co~,~prehensi~e monitors, as
a module and integrated into patient data acquisition systems e.g. Spacelabs, Hewlett
Packard, Siem~n~ or Datex units. Since the WEP monitor has a cuffand specific
WEP tr~n~ducçr, devices may be formed in a number of sizes, such as neonatal,
pediatric, adult, extra large and geriatric. For each subpopulation, it may be necess~ry
to provide a set of calibration coefficients, especially neonatal and pediatric.
U.S. Patent Nos. 5,511,553, 5,307,818, 4,981,141, incorporated herein by reference
relate to multiple physiological parameter monitoring devices. The present WEP
analysis system may be advantageously integrated with such devices.
CLINICAL RELEVANCE
Monitoring Blood Pressure in Hypertensive Patients
In hypertensive patients, often systolic and diastolic pressure data alone is used to
select treatment modality. However, with use of the WEP instrument according to the
present invention, the additional knowledge of PVR will aid in diagnosis and choice of
medication. For example, if the PVR is high, a vasodilator would be ideal. If the
cardiac output was high and the PVR only slightly elevated, a beta blocker or calcium
channel blocker may be approp.iate. In hypertensives, monitoring the compliance of
the arteries would help assess the long term benefit of treatment. Thus, the present
technology becomes an invaluable adjunct to the isolated measurement of BP.
., _ , . . . ..
CA 022~796~ l998-l2-09
WO 97/47236 PCT/US97/08993
41
Home measurement of BP
It is beco~l,ing increasingly clear that measurement of BP by patients at home is a
better way of ide,llirying those patients who are truly hypertensive as opposed to those
palie.lls with so-called "white coat hypertension", a psychosomatic stress reaction to
the traditional blood pressure measurement process. Home measurement of BP is also
a better means of tracking BP and identifying a need for changes in medication. There
are several limitations to this approach: Firstly, many patients have trouble taking their
BP as they have trouble identifying the Korotkoff sounds and the measurements can be
subjective. In addition, this technique does not provide for electronic recording and so
the information cannot be entered in centralized data bases.
The present system therefore addresses this problem by automating the BP
measurement process, as well as obtaining other data, such as CO, MAP and PVR.
Home measurement of BP will be improved for the following reasons: Firstly, accurate
measurements will be obtained and they are not subject to the errors of patient
intel yrelalion~ Secondly, the information will be obtained electronically and so has the
potential to be l~n~ led and entered into regional data bases via modems, etc.
Finally, the added information provided by changes in PVR, CO, and dp/dt, etc. may
provide physicians with additional information nece~.C~ry to manage BP on a more
rational basis. Management of BP in a home setting interfaced to national or regional
centers may enable adju~tmçnt of treatment without regular visits to individual
physicians, with res.llting significant cost savings.
.
CA 022~796~ 1998-12-09
WO 97/47236 PCT/US97/08993
42
Therefore, one embodiment of the invention includes a memory for storing a plurality
of sets of re. ling~, optionally with the capacity to store raw data relating to putative
artifacts or aberrant heartbeats. A telecommunication interface is provided, such as a
300-28.8K baud telephone modem, e.g., a v.34 modem PCMCIA (PC Card) interface
device. Periodically, the device is connected to a telephone line, where it dials into a
telecommunication center, and identifies and authenticates itself. The device then
uploads the stored information, which includes the cardiovascular data, and optional
exception data. If other monitors are integrated, such as EKG, pulse oximeter,
pacçm~ker activity, or the like, the data from these may also be uploaded. After
uploading, the data may be processed, and information downloaded to the user
through the device. For example, a change in pharmaceutical prescription may be
ordered, e.g., a change in dose or frequency. It is pl~rel~d that such prescription
changes be analyzed and authorized by a licensed medical professional, so the
telecommunication center may be staffed with trained individuals who verify any
proposed automated changes, and possibly confer with the patient, as necessary,
during the same telecommunication session with a voice over data or digital
~imlllt~neous voice and data (DSVD) modem.
Global ~se~m~nt of the Cardiovascular System
A free st~nrling monitor providing heart rate (HR), BP, PVR, stroke volume (SV),
CO, dp/dt and vascular compliance may be used as a screening device for cardiac
health. As such, it may be broadly used during routine history and physical
tions by doctors or for ~sescing health risk by insurance companies. The free
st~n-ling monitor may, in addition, be used to assess cardiovascular health in a variety
CA 022~796~ 1998-12-09
WO 97/47236 PCT/US97/08993
43
of cardiovascular di~ ç~, such as ~çssing the efficacy of lre~ nl of heart failure
or monitoring tre~tment with cholesterol lowering agents, etc.
Obstetrics
Measurement of BP is routine in obstetrics in large part to assess the onset of
preec~ sia. Preecl~.,psia is a microangiopathy characterized by an increased PVR.
WEP monitoring will be able to assess the onset of pree~ mpsi~ early and thus can be
a more accurate monitor than current modalities. See, Blank et al., "Systemic Vascular
Tone in Normotensive and Hypertensive Pregn~ncies: Sequential ~sess,-.~ ,vith a
New Noninvasive Technique", Hypertension in Pregnancy 12(2):224 (1993).
Thereîore, WEP recording as a part of home monitoring for obstetric patients could
diagnose the onset of preec.l~m~sia one or two weeks earlier than otherwise, allowing
earlier tre~tment. The health care and economic implications of this are significant.
In labor, BP is measured repeatedly for a number of reasons, inclu-ling assessment of
pree~l~.,.psia. With aorto-caval co,l,pression, cardiac output can decline but BP may
still be preserved. WEP will be a more accurate monitor of circulatory status in
obstetrics by detecting reduction of CO enabling optimal positioning of the mother.
WEP monitoring may also be interfaced with fetal heart rate monitoring to provide an
improved obstetric monitor.
Use in Hospitals Intensive Care, Emergency Room, and Operating Room
Environments
Currently, patients in intensive care type settings may have blood pressure, cardiac
output, stroke volume and heart rate measured by a variety of noninvasive or invasive
CA 022~796~ 1998-12-09
WO 97/47236 PCT/US97/08993
means. These technologies may be expensive and/or potentially dangerous to patients.
For example, pulmonary artery c~thetçrs are associated with sub~la,llial risks in~.lurling
infection. Arterial pressure is often measured with arterial catheters. See, U.S. Patent
No. 5,509,424. Usually, these monitors are integrated with a variety of other modules
into an integrated unit, such as BP, EKG, other pressures, pulse o~ y, cardiac
output, temperature, etc. WEP monitoring may ~sçnti~lly replace existing BP
monitoring. WEP monitoring provides a more accurate measure of SP, DP and MAP
than existing noninvasive BP monitors. It also provides additional data (CO, SV, PVR,
arterial compliance, and dp/dt). The WEP monitor may therefore be incorporated into
existing monitors as a module, or as a separate instrument.
A~e.ssm~nt of Action of Medication
Many medications affect the circulation, causing symptoms of f~inting nausea and
7in~ss, Others may alter the PVR without affecting symptoms. Others may depress
cardiac output. WEP can be used to monitor drug treatment and therefore may be used
in clinical trials of drugs, to determine potential side effects as well as in the field where
drugs are known to cause acute cardiovascular effects.
Monitor of Blood Loss or Dehydration
When blood is lost or dehydration occurs, the physiological response in humans is to
constrict the arterioles (increase PVR) to m~int~in the BP. With conventional
monitors, physicians cannot detect this early physiological response. With ~NEP, the
increase in PVR will be measurable, so that appropriate ~ ...ç~l can be given early
.
CA 022~796~ 1998-12-09
WO 97/47236 PCT/US97/08993
4~i
before shock occurs. For this reason, WEP will be a valuable monitor in emergency
rooms, ambulances, operating rooms, post surgical care units and in obstetrics.
The monitoring of dehydration will also be useful for pediatric care, where vomiting
and dia"l,ea are common and serious problems, and also in settings of fluid loss in hot
environ~ s e.g. sporting events, work environments, hypertherrnia in summer, etc.
The system and method according to the present invention may be used in any
In~ l, although the details of the relations between the WEP signal and the
cardiovascular function may vary. Thus, various animal research may be condllcted
using the present system and method, with the results then applied, e.g., to assist in the
diagnosis or prognostic analysis of human disease.
Aid for Diagnosis of Acutely Ill Patient
The diagnosis of patients acutely ill with blood loss, sepsis, myocardial infarction,
peritonitis, heart failure or pulmonary embolism may be aided using WEP monitoring
by d~fining the relative disturbances in MAP, CO, PVR and HR.
Options for Pl ese"lalion of Physiological Data
Because of the variety of data types, a versatile data presenlal;on system may be useful
for the intel~relation of the observed data. The data can be presented as:
1. actual values determined, e.g., heart rate, SP, DP, MAP, dp/dt, KlR,
upslope of Kl, upslope of K3, time constant of decay of K3 .
2. Derived values - PVRI, PVR, CO, SV, arterial co-~.pliallce.
3. waveforms of Kl, K2 and K3 can be displayed on a screen.
.
CA 022~796~ 1998-12-09
WO 97/47236 PCTIUS97/08993
46
4. waveforms of Kl, K2 and K3 can be printed out.
5. the data can be manipulated to aid in intt:l~retalion, e.g.:
a) ~t qnges in compliance can be related to expected c~l~ne~.c with age
b) cardiac output can be reported as higher or lower than expected
c) an inter-relationship between CO and PVRI can be developed to
dictin~lich between volume depletion, early sepsis or a non~,ecirlc hyperdynamic state.
d) incorporation of dp/dt into this data may help identify the role of
cardiac dysfunction in certain clinical settings. For example, it may be difficult to
~lictin~ich between cardiac depression and volume depletion in patients who have
decreased CO in association with high PVR. WEP recording may f~c.ilit~te the
distinction.
e) construct 3-D plot of CO vs. PVR vs. dp/dt to visually aid in
tli~gnocic of changes.
OBJECTS OF THE INVENTION
It is therefore an object of the present invention to provide a system for assessing
cardiovascular status non-invasively comprising an external peripheral pressure cuff, a
wideband external pulse tr~ncduc~r, and a computing device for computing a
peripheral vascular resict~nce.
It is a further object of the present invention to provide a method for estim~tin~ a K1
ratio comprising the steps of measuring a pressure waveform of a peripheral artery
with blood flow occ.luderl, measuring a difference in amplitude between a first major
systolic peak and first major systolic trough, measuring an amplitude of a second major
CA 022~796~ 1998-12-09
WO 97147236 PCT/US97tO8993
systolic peak and dete, .,f,n",g a ratio of a di~erence between said first major peak and
said first major trough and said second major peak.
Another object of the present invention is to compute a peripheral vascular reci~t~nee
based on a determined K1 ratio. A still further object according to the present
invention is to compute a PVRI as a first order function of a KlR.
It is another object according to the present invention to provide a noninvasive cardiac
monitoring system comprising a brachial artery cuff, a pressure control system for said
cuff, a wideband acoustic tr~n~-luc~r for measuring wideband acoustic emissions from
the brachial artery, and a system for analyzing an output from the wideband acoustic
transducer to produce data indicative of cardiac status.
It is a still further object according to the present invention to provide a met~li7ed
electro-acoustically sensitive polymer film as a wideband acoustic tr~nsd~lcer for a
cardiac status ev~lu~ting device.
By providing a low cost polymer film wideband acoustic external pulse transducer in
conjunction with standard automated sphygmomanometer pneumatic controls, a
system having enh~nced functionality may be provided in cost effective manner.
For a full underst~n-lin~ of the present invention, reference should now be made to the
following detailed description of the preferred embodiments of the invention as
illustrated in the accompanying drawings.
CA 022~796~ 1998-12-09
WO 97/47236 PCTIIJS97108993
48
BRIEF DESCRIPTION OF THE DRAWINGS
The detailed description of the pl t;rell ed embodiments will be described with respect to
the drawings, in which:
Fig. 1 is a tracing of a Kl signal;
Fig. 2 is a tracing of a K2 signal;
Fig. 3 is a tracing of a K3 signal;
Fig. 4 is a block diagram of an electronic circuit according to the present
invention;
Fig. SA is a perspective view of a brachial sphygmomanometer cuffhaving a
wideband external pressure tr~ncd~lcer according to the present invention;
Fig. SB is an exp}oded view of a wideband external pulse tr~ncd~lcer;
Fig. 6 is a top view of a segmented wideband external pulse transducer
according to the present invention;
Fig. 7 is a block diagram of an electronic circuit employing the segmented
wideband external pulse transducer of Fig. 6;
Fig. 8 iS a flow diagram of a system for evaluating cardiac status using a
pressure cuff and wideband external pulse tr~mcducer according to the present
invention; and
Figs. 9A and 9B are comparative graphs of typical K1 patterns of young
normotensive individuals and elderly hypertensive patients, respectively.
CA 022~796~ 1998-12-09
WO 97/47236 PCT/US97/08993
49
DETAILED DESCRIPTION OF THE PREFERRED
EMBODIMENTS OF THE INVENTION
The prerer.ed embodiments and the best mode for practi~ing the present invention will
now be described with rer~,ence to the Figures. Identical elements in the various
figures have been ~.~si~ned the same reference numerals.
Referring now to Figs. 1-3, tracings of K I, K2 and K3 signals are shown, in both time
domain and frequency domain, respectively. As can be seen, the Kl signal of Fig. 1
has a complex shape in both time and frequency domains, with a number of major
peaks and troughs. Fig. 2 shows three different K2 waveforms, corresponding to Pc =
SP, Pc < SP and Pc = DP, in both time domain and frequency domains. As noted in
the time domain representations, a small trough (notch) is evident in the signal. The
frequency domain representation reveals a rather evident high frequency peak,
corresponding to this small trough in the time domain. Fig. 3 shows the K3 waveform,
which is relatively smooth in the time domain with most of its energy at lower
frequencies in the frequency domain representation.
EXAMPI,E 1
Fig. 4 shows a schçm~tic block diagram of an instrument incorporating the features of
the present invention. A pressure cuff 10 for placement over the brachial artery 12 is
provided having an inflatable bladder 14, Velcro~ fastening system 16, a pressure
tr~n~ducer 18 and pump 20/bleed system 22. Between the skin 24 and cuff 10 is placed
a wideband external pulse transducer 26 (at the distal end of the cuff) formed from a
foil electret sensor (AT&T Bell Laboratories).
CA 022~796~ 1998-12-09
WO 97/47236 PCT/US97108993
Alternately, as shown in Figs. SA and 5B, a tr~n~d~lcer may be formed from a
pi~ electric elen~ent 50 mollnted on a brass disk 52, with a surface electrode 54. The
brass disk 52 is in turn mounted on a support 56, which tends to isolate the
piezoelectric element 50 from the varying pressure of the cuff 10 and from vibrations.
A probe 58 displaces the piezoelectric element 50 due to variations in arterial pressure
in the artery 12.
The al)para~ls, as shown in Fig. 4, comprises a cuff 10 with embedded tubes which
may be wrapped around the brachial artery 12 in the arm 13. Connected to the cuff 10
are pressurizing pump 20 and bleed system 22 to inflate and deflate the cuff 10 through
the tube 28. A pressure transducer 18 is connected to the cuff 10 for detecting the
cuffs pressure as it is inflated and defl~ted and for communicating the pressure data as
an electrical signal to a microcontroller 32. Some pulse pressure data, such as the
occurrence of Korotkoff sounds, may also be obtained from the cuff pressure
transducer 1 8.
The operation ofthe measuring appa.~ s is coordinated by a microcontroller 32 which
controls the pressurizing unit, an air pump 20, and the bleeding valve unit 22, a
restricted flow solenoid valve. With the cuff 10 inflated to a pressure Pc by air pump
20, the artery 12 is squeezed by the cuffs pressure Pc. The pressure Pc in the cuff 10 is
then cl~fl~ted at nearly a constant bleeding rate through the bleeding valve unit 22. The
wideband external pulse tr~n~ducer 26 is held under the distal portion of the cuff 10,
pro~l,lale to the brachial artery 12. This wideband external pulse transducer 26 is
mounted to provide a relatively vibration free reference, so that the wideband
CA 022~796~ 1998-12-09
WO 97/47236 PCT/US97/08993
tr~n~ducer 26 output signal from the arterial system is easily analyzed. The pressure
fl--ct~tion ofthe p~lC~ting blood flow starts to stretch the arterial wall which in turn
causes a pressure fluctu~tion which is sensed by the wideb~n-l external pressure
tr~nsduc~r 26.
The signal from wideband external pulse transducer 26 is coupled to an LMC6001
elecl- u-neLer amplifier, for amplification and ~ligiti7ed by a 16 bit delta-sigma analog-
to-digital converter (ADC). The output of the ADC is received by a microcontroller
32, which performs signal filtering and analysis.
The analyzed data is output though a visual display device 34 and a serial data port.
EXAMPLE 2
In order to oplinfize the signal-to-noise ratio and reduce artifacts, a multi-segmented
wideband external pulse tr~n~clucer 60 is provided as shown in Fig. 6. The
multi~eem~nted tr~ncduc~r is formed of a metalized polyvinylidene fluoride (PVDF)
film 62, met~li7ed with ~lnminllnn on both sides and etched with ferric chloride to form
a segmented pattern 64 having strips approximately 0.25" wide and 1.5" long on one
side. After met~li7~tion and connectorization, the transducer 60 may be conformally
coated with an environment~l sealant.
As shown in Fig. 7, a set of multiplexers is provided to feed buffered and amplified
outputs from di~rerenl se~m~nts strips. These multiple segments and multiplexers are
provided to compensate for, in~er alia, anatomical variations and difficulties in
CA 022~796~ 1998-12-09
WO 97/47236 PCT/US97/08993
52
ensuring correct plAce~nt ofthe tr~n~dllc~r over the brachial artery. After pl~cem~nt
of the WEP and cuff over the artery, an optimal set of tr~n~ducers is determined based
on an analysis of the WEP tran~ducer output. While one s~g.~ l may be optimal for
receiving the brachial artery vibrations, another segm~nt may be a useful control for
colllpçll.c~ g the output of the transducer segment.
The multiplexed electrometer amplifiers are fed to a ~iigiti7~r circuit and the digitized
information processed by a microcomputer. The microcomputer controls the
multiplexer and processes the signals to select the single or two adj~çent tr~n~ducer
segnlellls which are best aligned to the brachial artery, based on the signal amplitude
and freedom from interference. Outputs from these ~egm~nts are selected through the
multiplexer and ~ligiti7ed for processing by the microcomputer. The control segm~nt
may also read by the microcomputer.
The system shown in Fig. 7, for obtaining data from a multi-segmented wideband
external pulse transducer 60 includes signal conditioning electronics 72, which include
high impedance amplifiers for each segment and a multiplexer 74 for selectively
interfacing an amplified signal with an analog to digital converter 76. A
microprocessor 78 receives the cli~iti7ed signals. The microprocessor controls the
pump inflation and deflation through an interface 86, as described in example 1, and
also receives a signal from a cuff pressure transducer 88 through the multiplexer 74.
The system includes an input from a keyboard 84 or keypad, and outputs to a display
82 and serial port 80.
CA 022~796~ 1998-12-09
WO 97147236 PCT/US97108993
Advantageously, additional inputs are provided to the system, such as pulse oximetry
~8 and EKG 90 data, which are received by the microcomputer 78 through a data
acquisition module 92.
The cuffpressure may be measured with, for example, a Sensym BP01 Blood Pressure
Sensor (Sensym Inc., Milpitas, CA). This pressure sensor is provided in
communication with the bladder of the pressure cuff, and has a pressure measurement
range of about 0-300 mm Hg. The pressure signals are passed through a fluid, e.g.,
gas or liquid, to the pressure tran~ducer. 8-12 bit analog to digital conversion of
pressure sensor output is sufficient, with a sampling rate preferably of at least about 2
samples per second. The samples may be time-averaged to reduce noise effects,
especially pulsation from the inflation pump. The samples may also be measured
synchronously with an external event, such as pulse, inflation pump action. Or
deflation valve action. The output of the analog to digital converter is processed by
the microcomputer.
The computing system may be, for example, an IBM PC compatible system having an
80486, Pentium (P5 or 80586 class) or P6 (Pentium Pro) processor. A data
acqui~ition board having high impedance signal conditioning and high resolution
analog to digital conversion is provided as an ISA board, for example, a
CyberResearch PZO 614 with a PZO TC10 Piezoelectric Signal Conditioning Module
(10 sec. TC) and a PZO lM 1 megabyte memory module (CyberResearch, Inc.
Branford CT). Various software products may be used to perform the cuff
inflation/deflation control and data analysis, inclu~ing SnapMaster(TM), Labtech
CA 022~796~ 1998-12-09
WO 97/47236 PCT/US97/08993
Notebook for Windows v. 8.0 Control, or DASyLab+. The computer includes an
SVGA display, keyboard, 2.0 GByte hard drive, 32 MBytes RAM, and runs Windows
(Windows for Workgroups 3.1 1, Windows NT or Windows 95) opel~ling System.
As shown in Fig. 8, a microcomputer first controls rapid inflation of the cuff 102 with
an air pump. During inflation 102, the systolic blood pressure is estim~ted 104 This
may be determined by K2 analysis from the WEP tr~ncd~lcer or Korotkoff sound
analysis from the pressure transducer. Cuff inflation proceeds to a pressure about 20-
30 mm Hg above systolic pressure 106, as determined by the cuffpressure tr~ncd~lcçr,
and at least to a point where blood flow is occluded, so that no Korotkoff sounds are
evident. At this point, the cuffbladder is sealed, and a K1 signal analyzed 108. This
signal is preferably analyzed in real time, and for sufficient period to measure an
accurate and repeatable Kl ratio 122, as determined by the difference between the first
major systolic peak and the first major systolic trough divided by the second major
systolic peak. The Kl ratio is measured over a number of beats 108, with aberrant
pulse waveforms elimin~ted and normal pulse waveforms subjected to st~tictiç~l
processing. The Kl data is acquired, for example, for a period of 5 to 6 seconds or 4
to 8 heartbeats.
The microcomputer then completes the analysis of the Kl data using an algorithm,
which for example is a first order linear equation relating KlR and PVRI, peripheral
vascular recict~nce indexed to body surface area. Alternately, the rnicrocomputer may
employ a lookup table, polynomial algorithm, more complex algorithm, artificial
intelligence, fuzzy logic (semantic variable analysis) and/or neural network.
.
CA 022s796s 1998-12-09
WO 97147236 PCT/US97/08993
For CA ,~1-, a neural network may be trained to associate clinical data, e.g.,
di~ ostic or prognostic data obtained from a population of .,.~ ls, e.g., patients,
with WEP data. Thus, once trained, a set of inputs may be provided which will
produce an output of one or more presumptive diagnoses or prognoses. In this
manner, it is not necess~ y to ~ ly define or understand the l ~lalionships between
WEP data and clinical ~ignific~nce.
The cuffis then deflated 110 by opening the solenoid pressure bleed valve, such that
the pressure drops at a rate which drops approximately 2-3 mm Hg. per heartbeat.
The bleed may be at a fixed rate, through a restricted orifice, or through a
propo, lionally controlled valve. When the cuff pressure is defl~ted to systolic
pressure, a high frequency signal component is generated, i.e. K2, which is detected
1 12. As the cuff deGlines below diastolic pressure, the high frequency signal
component disappeal~ 114.
Below diastolic pressure, the wideb~n(l external pulse is measured, and a K3 pulse
waveform determined 1 l 6. The peak of the K3 waveform is calibrated as systolic
pressure, and the trough calibrated as the diastolic pressure 118, so that the mean
arterial pressure (MAP) is determined 120.
The body surface area (or surrogate measurements) of the subject are derived or
entered, e.g., via a keypad, and used to calculate peripheral vascular resistance 128
from the Kl ratio 122, through use of an algorithm by the microcomputer. This value
may be entered prior to any BP determination, or as a correction factor after
.
CA 022~796~ 1998-12-09
WO 97/47236 PCT/US97/08993
56
measurenlel.ls are obtained. The cardiac output is then c~lc~ ted 130 based on the
PVR and MAP. Arterial comrli~nce may also be determined from the slope of the K3
signal 132. Other data may be entered, e.g., age, and used for additional c~lcltl~ti~ ns.
As stated above, specific pre~unlplive diagnoses or EKG analyses may also be input to
assist in the WEP analysis, altho~l~h it is plere,-ed that these added factors be
optionally analyzed, so that these potential subjective biases are not integral to the
basic cardiovascular status analysis.
In the case of long term monitoring of a subject, the absolute cardiac output may be
less important in determining ch~np~es in cardiac status than changes in the Kl, K2 and
K3 waveforms themselves, or other derivative analyses. These changes may be
monitored by standard logical analysis, neural networks or fuzzy logic systems, and
need not be processed specifically to define cardiac output or systemic vascular
resistance. Por example, a neural network may be trained with data defining clinically
significant changes of patients monitored with both invasive cardiac monitors and
WEP monitors. An instrument so programmed (trained) may be useful for continuous
monitoring of chronically ill pati~nts, e.g., analyses taken every 5 mimlteC instead of
requiring an invasive cardiac monitor.
According to a preîe.,ed embodiment, the Kl signal is analyzed in the time-amplitude
domain. The pressure amplitude ofthe first major peak, which corresponds to the
initial systolic rise in pressure, is measured. The pressure amplitude of the first major
trough, after the first major peak, is then subtracted from the amplitude of the first
major peak. The pressure amplitude of the second major peak is then measured. The
CA 022~796~ 1998-12-09
WO 97/47236 PCTIUS97/08993
ratio of the two values is then dele"l~ned. The natural logarithm of this dimensionless
ratio is then determined to yield a value referred to as the "KIR", which has been
found to have a relatively linear relationship to pe,iphelal vascular resistance index:
KlR= .004 x (PVRI) + 3.217.
The KlR and blood pressure are then used to estim~te the cardiac output. The WEP
system may be internally standardized using invasive cardiac output measurements of
the same patient, where such data is available.
Because the WEP tr~n~ducer is proximate to a single artery, from which it normally
extrapolates systemic conditions throughout the o,ganisl.l, data relating to local
conditions within the eAIlelllily may also be obtained. For example, local blood flow
and arterial comrli~nce may be determined.
EXAMPLE 3
A self-contained microcomputer board is provided for system control, data analysis
and output. This board preferably includes a motor driver for an air pump for infl~ting
the cu~, an electronically controllable bleed valve for defl~ting the cuff, a Sensym
BPOI external blood pressure tran~ducer for measuring the cuffpressure, an
elecl-u",eler amplifier for interfacing the wideband external pulse tr~n~ducer, e.g., a
National Semiconductor LMC6001 (or other suitable LMC6XX or LMC6XXX series
amplifier) or Analog Devices AD549. The inputs of the pressure transducer and
wideband external pulse tr~ncclucer may be further subjected to band limiting filtering.
A National Semiconductor LM12458 Data Acquisition System (12 bit plus sign)
CA 022~796~ 1998-12-09
WO 97/47236 PCT/US97/08993
device is provided for analog interfacing to the WEP tr~ns~leer, pressure tr~n.cduc~r,
and the other tr~n~ c~rs.
During cuffinflation, an ~lltom~tic amplitude calibration routine is be used to linearize
the wideb~n(l external pulse tr~n~ducer system for changes in output due to load
pressure. Thel ero.e, as cuffpressure varies at subdiastolic pressure or supersystolic
pressures, the cuffpressure versus output amplitude function is characterized and the
results used to compensate other readings. This calibration step allows the ùse of
nonlinear transducer elements and those configurations which produce output
variations with changes in loading pressure.
A simple 2 lead (plus ground) EKG data input is provided to the data acquisition
system, and processed in conjunction with the cardiac output data. The EKG data is
used for syl.chrolfization of WEP processing and the detection of aberrant heartbeats,
for possible exception processing.
A peripheral pulse oximeter probe, e.g., a photoelectric finger probe, is also provided
as an input to the microprocessor, used as a failsafe device to prevent peripheral
ischemia due to pressure cuff operation. A thoracic stethoscope or other transducer
may be used to detect respiratory activity, for correction of analysis or synchronization
of data acquisition.
It should be understood that the data acquired by the various sensors may be analyzed
in various manners to produce clinically useful data, and that therefore the wideband
CA 022s796s 1998-12-09
WO 97/47236 PCT/US97/08993
59
external pulse transdllcer system may form the basis of many difr~re.ll types of
instruments, especi~lly of noninvasive types.
Having illustrated and described the principles of the invention in a prefel l~d
embodim~nt, it should be app&,enl to those skilled in the art that the invention can be
modified in arr~ngemçnt and detail without departing from such principles. For
example, discrete or integrated components of various types may be employed for the
various parts of the apl)al~ s, as is known to those of skill in the art. Features of the
invention shown in software may also be implemented in hardware.