Note : Les descriptions sont présentées dans la langue officielle dans laquelle elles ont été soumises.
CA 02339922 2001-O1-19
WO 00/09983 PCT/IL99100421
DEVICE AND METHOD FOR NON-INVASIVELY -
MEASURING AND DETERMINING MOISTURE CONTENT
AND DENSITY OF LOOSE AND PACKAGED TOBACCO
FIELD AND BACKGROUND OF THE INVENTION
The present invention relates to a device and method fir measuring and
determining
moisture content and density of tobacco and tobacco products" and in
particular for non-
invasively measuring and determining moisture content and density of loose and
packaged
tobacco.
Tobacco plants are cultivated for the main purpose of obtaining tobacco leaves
which are
used as the principle raw material in manufacturing a diversity of tobacco
containing end .
products. Raw tobacco leaves are bundled, transported and stored in a variety
of forms before
being used in manufacturing processes. Tobacco manufacturing processes
typically involve
multiple procedures, including initial processing of loose or packaged raw
tobacco leaves, and
I S then using the processed tobacco leaves in formation of various tobacco
containing end
products. Tobacco end products are also packaged, stored, an<i transported
with respect to
distribution and sale throughout the tobacco consuming marketplace.
Hereinafter, the term 'tobacco' refers to any form of either raw or processed
tobacco
plants, raw or processed tobacco leaves, including tobacco leaves freshly
picked from a tobacco
24 plant or dried tobacco leaves, green or other color, and includuzg
processed tobacco leaves as an
ingredient in tobacco containing end products such as cigarettes, cigars, pipe
tobacco, pouch
tobacco, chewing tobacco, etc.. Moreover, either raw or processed tobacco may
be considered in
either a loose or a packaged form, where packaged form of tobacco includes,
but is not limited
to, tobacco in loosely bound piles, bales, modules, bags, cases, cartons, or
boxes. Hereinafter,
25 the term 'bale' refers to any structure in which tobacco material. is
present in pressed layers and
tied with ties wrapped around the structure, and includes, but is not limited
to, farmer bales, in
which tobacco leaves are bound with ties alone; a case, in which tobacco
leaves are placed in
crates with wooden or cardboard sides; a hogshead, in which the case has a
substantially
cylindrical shape; and an oriental bale. Hereinafter, the term 'module' refers
to any structure of
30 bound tobacco material, including bales and cases.
Within the sequence encampassing obtaining raw tobacco leaves to supplying the
marketplace with tobacco end products, several procedures are dependent upon
the moisture
content and/or density of tobacco, in either loose or packaged form. If
moisture content is too
CA 02339922 2001-O1-19
WO 00109983 PCT/IL99100421
high. for example, physicochemical properties and cl~aracteriatics of tobacco
tend to change,
possibly resulting in decomposition during transportation and storage, even
before the tobacco is
used in a manufacturing process. If the moisture content is too low,
processing and use of
tobacco may be problematic. Density of packaged tobacco, related to moisture
content of -
tobacco, for example, can be used as a'quality control parameter with respect
to tobacco
packaging processes, either involving packaging some form of raw tobacco prior
to
manufacturing tobacco end products, or for packaging tobacco end products
prior to distribution
and sale in the marketplace.
Tobacco is typically stored in large bales before being; processed for
manufacturing
tobacco end products. Chemical composition of stored tobae:co can alter as a
result of various
reactions involving compounds found in tobacco. Some of these reactions can
produce
chemicals which are particularly harmful to people who smoke, while other
products are
detrimental to the taste and shelf life of tobacco products. Indeed, the
relevant regulatory
authority in each country, such as the FDA (Food and Drug Administration) for
the United
States of America, frequently requests maximum levels of the harmful chemical
compounds. If
the concentration of one or more of these components exceedis this limit, the
regulatory authority
may not permit the tobacco product to be sold within the country. The rate and
extent of these
reactions may be altered by the moisture content of the tobacco. Therefore,
the tobacco industry
must process the tobacco within a relatively narrow range of :moisture values,
in order to comply
with these regulations and in order to maintain the quality of the tobacco.
Thus, clearly the
concentration of these components within the tobacco must be monitored, and if
possible the
tobacco must be processed substantially before such components increase to
potentially harmful
levels.
Since rate and extent of tobacco alteration are influenced by moisture content
of tobacco,
it is desirable to measurement moisture content of tobacco, in order to
optimally store and
process tobacco. Unfortunately, currently available methods for measurement of
moisture
content of tobacco involve the removal of samples from tobacco bales, followed
by separate, off
site, determination of moisture content of the tobacco samples. Such sampling
can be very
inaccurate, since moisture content of the tobacco may vary widely throughout
the bale, in
addition to varying from bale to bale; thereby yielding misleading results.
Measurement of
moisture content of loose tobacco leaves is also important, yea is also
difficult to determine by
of#=site sampling of small portions of tobacco material. Preferably, bulk
volumes of tobacco
material would be measured as tobacco leaves pass through a silo, for example
on a conveyor
2
CA 02339922 2001-O1-19
WO 00109983 PCT/IL99/00421
belt, rather than by separate sampling of the material. Thus, currently
available methods for
measuring the moisture content of both tobacco bales and bulLk volumes of
loose leaves have
significant drawbacks.
A far more useful method for determining the moisture content of tobacco would
involve .
the measurement of the moisture content throughout the bale.,, such that a
more accurate moisture
measurement could be made. Such a method would also prei:erably preserve the
tobacco
material, such that the tobacco would not be destroyed during the process of
measuring the
moisture content. Furthermore, regulation of the moisture content would enable
control in levels
of the various chemical compounds produced as a result of th.e previously
described chemical
processes. Thus, an accurate determination of moisture content of tobacco is
necessary for
proper storage and manufacture of tobacco products.
In addition to influencing measurement of moisture content of raw or
processed, loose or
packaged tobacco, measuring density of packaged, raw or processed, tobacco can
be very useful
for monitoring and quality control of the internal structure of such packaged
tobacco. Packaged
tobacco may contain foreign components and/or non-uniforrn.ities which can
affect both the
accuracy of measuring moisture content and downstream processing of tobacco. A
practical
example of a non-uniformity in internal structure of packaged tobacco is, at a
cigarette or cigar
manufacturing facility, where a crate contains an off spec number of cigarette
or cigar cartons,
and similarly, where a carton contains an off spec number of cigarette or
cigar packs. Ideally, a
non-invasive, non-damaging method and device would be used for measuring
density and
determining internal structure of such packaged tobacco, wiW out physically or
chemically
altering the tobacco or the tobacco packaging. Unfortunately, such a device
and method are
currently not available.
There is thus a widely recognized need for, and it would be highly
advantageous to have,
a device and method for non-invasively measuring and determining moisture
content and density
of raw or processed, loose or packaged, tobacco.
SUMMARY OF THE INVENTION
According to the present invention there is provided a method of determining a
moisture
content of tobacco material, the method comprising the steps of {a)
transmitting a plurality of
microwaves substantially through at least a portion of the maiserial, such
that the microwaves are
transmitted microwaves; (b) receiving the transmitted microvc~aves such that
the microwaves are
3
CA 02339922 2001-O1-19
W O 00109983 PCT/IL99/00421
received microwaves; (c) determining an attenuation from the received
microwaves; (d) using at
least one empirical factor selected from the group consisting of weight of the
rilaterial,
temperature of the material, structure of the material and type of the tobacco
material to correct
the attenuation, producing a corrected attenuation; and (e) calculating the
moisture content of the-
tobacco material from the corrected attenuation. Preferably, the step of
determining the
attenuation further comprises the step of determining a phase; shift from the
received
microwaves.
According to preferred embodiments of the present invention, the step of
determining the
attenuation further comprises the step of; (l) repeating steps (a) to (c) for
at Ieast a portion of the
material on the bale, such that a plurality of phase shifts and a plurality of
attenuations are
obtained, and such that a plurality of corrected phase shifts are produced
according to the
plurality of phase shifts.
Preferably, the method further comprises the step of: (ii) determining a
density of the
material from the phase shifts; and (iii) calculating a final moisture content
of the material from
1 S the density and from the raw moisture content.
Alternatively and preferably, the material features an internal structure and
an irregularity
of the density of the internal structure is calculated by comparing one of the
plurality of phase
shifts to a previous value of the phase shifts, such that the irrc;gularity is
detected if one of the
plurality of phase shifts differs from the previous value. More preferably,
the irregularity of the
density of the internal structure indicates that the material has been
processed unevenly, which
can result in problems during the process of fermentation due. to uneven
moisture content of the
material, thereby affecting the overall quality of the tobacco.
According to other preferred embodiments of the present invention, a first
phase shift is
determined for microwave radiation of a first frequency Fl, aJnd a second
phase shift is
determined for microwave radiation of a second frequency F2~, the first phase
shift being
corrected to form a first measured phase shift according to thc; equation:
~Ph(Fz) - ~Ph(Fc)
PhF~ = F,
F2 - F~
wherein PhF~ is the measured phase shift for the first frequency F,; and
dPh(F~) and dPh(F~ are
the phase shifts for F~ and F2; and wherein a first corrected phase shift is
formed according to the
following steps:
(l) PhF~ l 360 = X t ; and
(ii) (mod( X ~) * 360) + OPh(F~) = P~,ue ;
4
CA 02339922 2001-O1-19
WO 00/09983 PCT/IL99/00421
such that P"."~ is the first corrected phase shift. Preferably, the moisture
content is
determined according to a ratio of the attenuation and the corrected phase
shift.
More preferably, an empirical curve of a relation between the ratio and the
moisture
content is provided, such that the moisture content is determined according to
the ratio by using
the empirical curve.
Preferably, the tobacco material is contained in a module.
More preferably, the at Least one empirical factor is a plurality of empirical
factors
selected from the group consisting of weight of the module, type of the
material, structure of the
module, location of the module relative to the plurality of microwaves and
temperature, and the
factors are stored in a database.
Most preferably, the corrected attenuations and the phase shifts are further
corrected by
removing attenuations and phase shifts produced after the plurality of
microwaves passes
through an edge of the module, such that a first portion of the plurality of
microwaves passes
through the portion of the module and a second portion of the plurality of
microwaves
substantially does not pass through the portion of the module.
Preferably, the step of determining the density includes detecting a defect in
the material,
the defect being selected from the group consisting of irregular moisture
distribution within an
interior of the material and presence of a foreign body inside the material.
According to another embodiment of the present invention, there is provided a
method
for determining a moisture content of tobacco material, the method comprising
the steps of (a)
transmitting a plurality of microwaves substantially through apt least a
portion of the material,
such that the microwaves are transmitted microwaves; (b) receiving the
transmitted microwaves
such that the microwaves are received microwaves; (c) deternlining an
attenuation from the
received microwaves; (d) determining a phase shift from the received
microwaves; and (e)
calculating the moisture content of the tobacco material from a ratio of the
attenuation and the
phase shift.
Preferably, the step of calculating the moisture content further comprises the
steps of (i)
providing an empirical curve of a relation between the ratio a~ld the moisture
content; and (ii)
determining the moisture content according to the ratio by using the empirical
curve:
More preferably, the step of determining the attenuation further comprises the
step of (i)
using at least one empirical factor selected from the group consisting of
weight of the material,
temperature of the material, structure of the material and type of the tobacco
material to correct
the attenuation, producing a corrected attenuation.
5
CA 02339922 2001-O1-19 .
w0 00/09983 PCT/IL99/00421
Most preferably, the step of detei7~oining the phase shift further comprises
the steps of: (r )
determining a first phase shift for microwave radiation of a first frequency
F,; (ii) detern~ining a
second phase shift for microwave radiation of a second frequency Fz; and (iii)
correcting the first
phase shift to form a first corrected-phase shift according to the equation:
PhF, _ ~Ph(Fz) - OPh(Fi) F~
Fz - F~
wherein PhFI is the corrected phase shift for the first frequency F~; and
dPh(F~) and dPh(F~ are
the phase shi$s for Fl and F2.
According to yet another embodiment of the present invention, there is
provided a
method for determining a moisture content of tobacco material, the method
comprising the steps
_ of (a) transmitting a plurality of microwaves of a plurality oiP frequencies
substantially through a
portion of the material, the microwaves of each of the plurality of
frequencies being transmitted
sequentially such that the microwaves are transmitted microwaves of a
particular frequency; (b)
receiving the transmitted microwaves of the particular frequency such that the
microwaves are
received microwaves of the particular frequency and such that the transmitted
microwaves from
the plurality of frequencies are received; (c) determining an attenuation from
the received
microwaves of each of the particular frequencies, such that a plurality of
attenuations is
determined; {d) determining a phase shift from the received microwaves of each
of the particular
frequencies, such that a plurality of phase shifts is determined; (e)
correcting each of the plurality
of phase shifts according to the plurality of phase shifts, such that first
phase shift is determined
for microwave radiation of a first frequency Fj, and a second phase shift is
determined for
microwave radiation of a second frequency F2, the first phase. shift being
corrected to form a first
corrected phase shift according to the equation:
OPh{Fz) - ~Ph(F~) F~
PhF~ _
Fz - F~
wherein PhF~ is the corrected phase shift for the f rst frequency Fl; and
dPh(F,) and
dPh(F~ are the phase shifts for FI and Fz; and (f) determining the moisture
content according to
a ratio of the corrected phase shift and the attenuation.
According to still another embodiment of the present invention, there is
provided a
method of analyzing packaged tobacco to determine an iinternal structure of
the packaged
tobacco, the method comprising the steps of: (a) performing a calibration
procedure on a
plurality of calibration samples of the packaged tobacco to determine a
plurality of target types,
the calibration procedure including a step of transmitting microwaves through
at least a portion
6
CA 02339922 2001-O1-19
WO 00/09983 PCT/IL99100421
of each of tl~e plurality of calibration samples; {b) transmitting a plurality
of microwaves
substantially to at least a portion of the packaged tobacco , such that the
microwaves are
transmitted microwaves; (c) receiving the transmitted microwaves such that the
microwaves are
received microwaves, the received microwaves include reflected microwaves; (d)
determining a
S plurality of attenuations from the received microwaves; (e) determining a
plurality of phase
shifts from the received microwaves; (f) calculating a plurality of at least
one of a moisture value
and a density value of the package of the packaged tobacco :from at least one
of the plurality of
the attenuations and the plurality of the phase shifts; and (g) analyzing the
plurality of the
moisture and the density values to determine at least one target in the
packaged tobacco,
according to the target types determined from the calibration procedure, the
at least one target
showing at least a portion of the internal structure of the packaged tobacco.
According to yet another embodiment of the presc,nt invention, there is
provided a
method of analyzing packaged tobacco to detect a presence of at least one
characteristic selected
from the group consisting of a foreign component and a non-uniformity of the
material, by
transmitting microwaves through at least a portion of the packaged tobacco,
the method
comprising the steps of: (a) performing a calibration procedure on a plurality
of calibration
samples of the packaged tobacco to determine a plurality of target types, the
calibration
procedure including a step of transmitting microwaves through at least a
portion of each of the
plurality of calibration samples; (b) acquiring a plurality of at least one of
a moisture value and a
density value of the packaged tobacco by analyzing the microwaves transmitted
through the
packaged tobacco, the microwaves include reflected microwaves ; and (c)
analyzing the plurality
of values to detect at least one potential target, according to the target
types from the calibration
procedure.
BRIEF DESCRIPTION OF THE DRAWINGS
The invention is herein described, by way of example only, with reference to
the
accompanying drawings, wherein:
FIGS. IA and 1B are illustrative examples of modules whose moisture can be
measured by
the present invention;
FIG. 2 is a block diagram illustrating one embodiment of the present
invention;
FIG. 3 shows an example of a calibration curve used for calculating the
moisture content of
the module according to the present invention;
FIGS. 4A and 4B show a phase region curve of a preferred embodiment of the
present
7
CA 02339922 2001-O1-19
WO 00109983 PCT/IL99/00421
invention;
FIGS. SA-SF illustrate the relationship between the direction of the
electrical field of the
source beam relative to the module and the attenuation and ph2ise shift of the
antenna signal;
FIG. 6 illustrates a truck for conveying the device of Figure 2;
FIGS. 7A-7C illustrate another embodiment of the present invention;
FIG. 8 illustrates the behavior of the antenna signal of the embodiment of
Figures 7A and
7B;
FIG. 9 is a flow chart of the method of calculating the moisture content of
the tobacco
material;
FIG. 10 is a flow chart of another method for calculating the moisture content
of the
tobacco material;
FIGS. 11A-11D show illustrative experimental results, using the method of the
present
invention;
FIG. 12 shows a second exemplary embodiment of a device which can be used with
the
method of the present invention;
FIGS. 13A-13B show flowcharts of another preferred and exemplary method
according
to the present invention for detecting the presence of foreign components
and/or non-
uniformities in the package of tobacco;
FIG. 14 shows the target classification process according to the present
invention from
Figures 13A-B in more detail;
FIG. 15 shows actual empirical data for the detection of a non-uniformity in
the internal
structure of a bale of tobacco;
FIGS. 16A-16C show other moisture content and/or density classifiable patterns
recognizable in bales of tobacco;
FIG. I7 illustrates density related detection and pattern recognition of
tobacco objects
missing from a carton having a known number of discrete tobacco objects; and
FIG. 18 illustrates applicability of pattern recognition data processing of
microwave
measurements involving acquisition of both transmitted and reflected microwave
signals.
DESCRIPTION OF THE PREFERRED EMBODIMENTS
The present invention is of a device and method for non-invasively measuring
and
determining moisture content and density of loose or packaged tobacco. The
tobacco may be in
any form of either raw or processed tobacco plants, tobacco leaves, including
tobacco leaves
8
CA 02339922 2002-02-25
freshly picked from a tobacco plant or dried tobacco leaves, green or other
color, and including
processed tobacco leaves as an ingredient in tobacco containing end products
such as cigarettes,
cigars, pipe tobacco, pouch tobacco, chewing tobacco, etc.. Moreover, either
raw or processed
tobacco may be in either a loose or a packaged form, where packaged form of
tobacco includes,
but is not limited to, tobacco in loosely bound piles, bales, modules, bags,
cases, cartons, or
boxes.
The present invention is based on subjecting any of the above described forms
of tobacco
to microwave radiation, where the microwave radiation is of variable
frequency. Typically, a
microwave radiation source is located on one side of the tobacco, such as the
tobacco bale, and
an antenna is located on the opposite side of the bale. The radiation source
beam is transmitted
through a portion of the bale and is received by the receiving antenna, which
then produces a
signal. Microwave signal parameters such as attenuation and phase shift are
used to measure
and determine moisture content of that portion of the bale, mass uniformity of
the bale, and
density of the bale. A method for performing such moisture and density
measurements is
disclosed in U.S. Patent No. 5,621,330. Additional aspects of such a method
are also disclosed
in U.S. Patent Nos. 5,845,529 and 6,025,724. In addition, the methods and
devices described
herein can also be used to measure the moisture content of a bulk volume of
loose tobacco
leaves, for example as these leaves travel through a silo.
Based on measurement and determination of density of packaged tobacco,
internal
structure of packaged tobacco is analyzed to detect the presence of any
foreign components
and/or non-uniformities, as well as to confirm the presence of tobacco
material throughout the
package.
Raw data of the microwave measurements, including attenuation and phase shift,
are
used for determination of moisture content and density, values of which are
ultimately translated
into useful information relating to characteristics and internal structure of
tobacco. Calibration
measurements are also performed on standard, well characterized, calibration
samples of various
forms of tobacco, according to the actual application involving raw or
processed, loose or
packaged tobacco, for the purpose of comparing to microwave measurements of
actual tobacco
samples. Results of calibration measurements are correlated with respect to
selected known
features of tobacco samples. Results of calibration data correlations are
furthdr classified
according to distinct and recognizable patterns. Classified patterns are, in
turn, very useful for
interpreting raw data obtained from microwave measurements of actual tobacco
samples, in
9
CA 02339922 2002-02-25
order to detect and identify pre-determined features pertinent to monitoring
or quality control of
a tobacco related manufacturing process.
In the present invention, raw data are analyzed, in part, by using pattern
detection,
classification, and/or decision algorithms. Examples of specific pattern
detection, classification,
and/or decision algorithms suitable for data analysis in the method of the
present invention are
fully described in U.S. Patent No. 5,880,830, issued to Schechter, and in U.S.
Patent No.
6,091,843, and references cited therein. Preferably, in the present invention,
data analysis is
based on acquiring pairs of attenuations and phase shifts by passing
microwaves at a plurality of
frequencies through a package of tobacco featuring foreign matter or objects,
collectively termed
'foreign components' and/or non-uniformities. This unique method enables
achievement of high
levels of accuracy and precision in detection and classification of the
sample, in general, and of
foreign components and/or non-uniformities, in particular.
The principles and operation of a device and a method according to the present
invention
may be better understood with reference to the drawings and the accompanying
description.
Referring now to the drawings, Figures 1 A and 1 B are illustrative examples
of modules
whose moisture can be measured by the present invention. Figure 1A shows a
module 10 which
is a bale of tobacco 12. Bale 12 consists of pressed layers of tobacco
material 14, optionally
held together with at least one tie bar 16. Tie bar 16 can be made of plastic
or metal. For the
purposes of measuring the moisture content of bale 12, bale 12 can be divided
into at least one,
and preferably a plurality, of areas 17. Each area 17 includes at least one
measurement point 18,
and preferably a plurality of measurement points 18. At each measurement point
18, the
moisture content of that portion of bale 12 is determined (see Figure 2
below).
Figure 1 B illustrates a module 10 which is a case of tobacco 20, for example
used for
storing tobacco. Case 20 does not have defined layers, unlike bale 12.
However, case 20 can
also be divided into at least one, and preferably a plurality, of areas 22.
Furthermore, each area
22 can also be subdivided into at least one, and preferably a plurality, of
measurement points 24.
At each measurement point 24, the moisture content of that portion of case 20
is determined (see
Figure 2 below).
For illustrative purposes only, description of the device and method of the
present
invention is limited to measurement of moisture content and density of
'tobacco leaves in
modules such as bales, it being understood that this is not meant to be
limiting in any way.
These moisture and density measurements can be performed on tobacco leaves in
substantially
CA 02339922 2001-O1-19
WO 00/099$3 PCT/IL99/00421
any structure, including bulk volumes of loose leaves. The type of structure
of the tobacco
material depends partly upon the stage of the processing of the tobacco.
Briefly, tobacco leaves
are loose, bulk volumes of material after being harvested anc! threshed.
Tobacco leaves are then
bound into bales, after which the primary processing is performed. The primary
processing stage -
includes cutting the tobacco. The cut tobacco is typically stored in some type
of case, such as a
wooden box. The secondary processing stage is then performed, in which tobacco
products such
as cigarettes are manufactured. Thus, the method of the present invention can
be used for the
measurement of moisture content of tobacco, and for measurement of density of
packaged
tobacco, in substantially any stage of the processing, although specific
reference is made herein
to modules and bales.
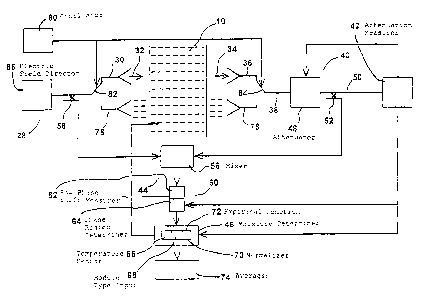
Figure 2 shows a device according to one embodiment of the present invention.
Device
26 includes a microwave radiation source 28, shown on one side of module I0.
Microwave
radiation source 28 preferably includes at least one source antenna 30 for
transmitting a source
beam 32. Source beam 32 is directed through module 10, and passes out of
module 10 as an exit
beam 34. While traveling through module 10, source beam 32 may also be
reflected by
packaging material which reflects microwave radiation. Such packaging material
could include
a metal, for example, aluminum wrapping used for assisting i:n maintaining
freshness of tobacco.
Thus, an exit beam 34 includes microwaves transmitted through the tobacco
material in addition
to any reflected microwaves exiting module 10. Exit beam 34 is received by at
least one
receiving antenna 36. Receiving antenna 36 is located on a substantially
opposing side of
module 10 relative to source antenna 30.
After receiving antenna 36 has received exit beam 34, receiving antenna 36
produces an
antenna signal 38. Antenna signal 38 then goes to an attenuation unit 40.
Attenuation unit 40
includes an attenuation measurer 42, which measures the attenuation of antenna
signal 38. As
source beam 32 passes through module 10, source beam 32 is attenuated. The
extent of this
attenuation is determined by the elementary mass, which is the mass of the
material of module
10 encountered by source beam 32, and by the moisture content of the material
of module 10
encountered by source beam 32. Thus, attenuation measurer ~42 is actually
measuring the extent
to which source beam 32 is attenuated by passing through module 10.
At least a part of antenna signal 38 also goes to a phase shift determiner 44,
which
determines the phase shift of antenna signal 38. This phase shift is actually
the phase shift of
source beam 32 passing through module 10, so that the phase shift is the
difference between the
phase of source beam 32 and the phase of exit beam 34. The attenuation and the
phase shift are
11
CA 02339922 2001-O1-19
WO 00/099$3 PCT/IL99/00421
determined according to the following equations:
A=8. G8 a1
I being length of module 10, a being the attenuation factor for module 10.
P =~~- /.~c~l
,Qand ~3o being phase factors for module 10 and air, respectively.
The attenuation and the phase shift of antenna signal 38 are then used by a
moisture
determiner 46 to determine the moisture content of module 1Ø
Moisture determiner 46 uses the following equations to determine the moisture
content of
module 10. In these equations, A is attenuation, P is phase shift, W is
moisture content, and M is
the elementary-mass of module 10. Equations 1 and 2 are integrated to produce
equations 3 and
4. The moisture content, W, is then calculated.
dA = ~ d W + ~2 d~a
dP= ~dW+~ dm
aA o''A
A= ~W+~m
P=~W+~rn
A number of optional features can be added to device. 26 in order to increase
the accuracy
of moisture measurements. Preferably, attenuation unit 4l0 includes an .
attenuator 48. The
function of attenuator 48 is to attenuate antenna signal 38, so that antenna
signal 38 becomes an
attenuated antenna signal 50. A coupler 52 then splits attenuated antenna
signal 38 into two
portions. A first portion of attenuated antenna signal 50 gc>es to phase shift
determiner 44. A
second portion of attenuated antenna signal 50 preferably goes to attenuation
measurer 42.
Attenuation measurer 42 preferably determines the difference between the
amplitude of
attenuated antenna signal 50 and the amplitude of a constant reference signal
54. The difference
between these two amplitudes determines the extent to which attenuator 48
attenuates antenna
signal 38, so that the attenuation of antenna signal 38 is kept substantially
constant. Such
constancy is required for the proper operation of phase shift determiner 44
(see below}.
As noted abave, phase shift determiner 44 determines the difference, or phase
shift,
12
CA 02339922 2001-O1-19
WO 00/09983 PCTIIL99/00421
between the phase of source beam 32 and tl~e phase of exit beam 34: Phase-
shift determiner 44
preferably includes a mixer 56, which outputs a signal which is proportional
to the phase shift _
between source beam 32 and exit beam 34, as represented by antenna signal 38.
In order for
mixer 56 to receive a portion of source beam 32, microwave radiation source 28
preferably.
includes a second coupler 58, for splitting source beam 32 into two portions.
A first portion of
source beam 32 is directed through module IO as described. above. A second
portion of source
beam 32 is directed to mixer 56.
Phase shift determiner 44 preferably also includes a signal phase shift
measurer 60.
Signal phase shift measurer 60 measures the phase shift befiween source beam
32 and exit beam
34 from the signal output by mixer 56. In order to obtain the most accurate
moisture content
measurements, phase shift measurer 60 can optionally include a number of
features designed to
compensate for inaccuracies in the measurement of the phase shift. These
features include a raw
phase shift measurer 62, which determines the raw phase sh ft. Next, a phase
region determiner
64 determines the phase region of the raw phase shift from the attenuation of
antenna signal 38
and produces a corrected phase shift. As measured directly from source beam 32
and exit beam
34, as represented by antenna signal 38, the phase shift can only vary from 0
to 2~ However,
the correct phase actually lies between 2~'n-1) and 2~n, whdch can be from 0
to 2~c; but which
could also be from 4~c to 6~c, for example. Thus, the phase; region, or the
value of n, must be
determined. Such a determination is made using an empiri<;al phase region
curve, as shown in
Figure 4 below, which relates the attenuation of antenna signal 38 to the
phase region. The
correct phase shift is then given to moisture determiner 46.
In order for the phase shift measurement to be accurate, the attenuation of
antenna signal
38 must be kept substantially constant. Otherwise, the comparison between
source beam 32 and
antenna signal 38 will be artificially altered by the attenuation of antenna
signal 38.
As noted above, once the phase shift and the attenuation have been measured,
moisture
determiner 46 determines the moisture content of module 10. Moisture
determiner 46 preferably
includes a temperature sensor b6 for measuring the temperature of module I0.
The type of
module 10 is preferably input into moisture determiner 46 by a module type
input 68. The type
of module 10 is determined by the type of tobacco material in module 10, and
by the form of
module 10: for example, bale I2 or case 20. Finally, moisture determiner 46
preferably includes
a normalizer 70. Normalizer 70 preferably includes an empirical function 72.
Empirical
function 72 determines the moisture content of module 10 from the temperature
and type of
module 10, and from the attenuation and phase shift calculated above.
13
CA 02339922 2001-O1-19
WO 00/09983 PCT/IL99/00421
The above description has treated the measurement of the moisture cement of
module I O
as though a single moisture measurement was made. However, preferably a
plurality of such .
measurements are made and averaged by an averager 74. As described in Figure
l, bale 12 can
be divided into preferably a plurality of areas I7. Each area 17 is preferably
subdivided into a
plurality of measurement points 18. At each measurement point I8, the moisture
content of that
portion of bale 12 is determined according to the above; description, so that
a plurality of
measurements are made and averaged by averager 74. A similar argument can be
made for case
20, areas 22 and measurement points 24. These averaged measurements axe then
preferably
compared to a calibration curve, of the type shown in Figure 3, in order to
obtain the moisture
content of module 10. Optionally, in order to facilitate such multiple
measurements, device 26
can include a conveyor, such as a conveyor belt (not shown I or a truck (not
shown, see Figure 6}
to convey bale IZ between microwave radiation source 28 a~ld receiving antenna
36.
Optionally, microwave radiation source 28 can also include a second source
antenna 76.
Also optionally, device 26 can also include a second receiving antenna 78.
Optionally, an
oscillator 80 controls a first switch 82 and a second switch 84. These
optional features are used
to measure the moisture content of module 10 in two parts when module 10 is
too tall for a
single measurement. First, oscillator 80 flips first switch 82 so that first
source antenna 30
directs source beam 32, and second switch 84 so that first receiving antenna
36 produces antenna
signal 38. This particular configuration is shown in Figure 2, and is used to
measure the
moisture content of the lower portion of module 10. Next, oscillator 80 flips
first switch 82 so
that second source antenna 78 directs source beam 32. Oscillator 80 also flips
second switch 84
so that second receiving antenna 78 produces antenna signal 38. Now, the
moisture content of
the upper portion of module 10 is measured.
Microwave radiation source 28 can also optionally include a number of features
which
are designed to maximize the sensitivity of moisture content measurements, by
manipulating the
direction of the electric field density of source beam 32 (see also Figures SA-
SF). Microwave
radiation source 28 can include an electric field director 86. Electric field
director 86 determines
a direction of the electric field density of source beam 32 relative to module
10, such that the
direction of the electric field density partially determines the magnitude of
attenuation and
magnitude of the phase shift. If module 10 has layers 14 (not shown),
substantially the
maximum attenuation and substantially the maximum phase shift of antenna
signal 38 is
obtained when the electric field density is substantially perpendicular to
layers 14 (not shown) of
module 10. When the electric field density is substantially parallel to layers
14 (not shown} of
14
CA 02339922 2001-O1-19
WO 00/09983 PCT/IL99100421
module 10, substantially the minimum attenuation and the minimum phase shift
of antenna
signal 38 is obtained. Even if module 10 does not have layers 14, changing the
direction of the
electric field density will still alter the attenuation and phase shift'of
antenna signal 38, according
to the orientation of the material being measured relative to the electric
field density. Electric
field director 86 determines the direction of the electric field density
according to feedback from
attenuation measurer 42. Thus, if the attenuation of antenna signal 38 is low,
electric feld
director 86 can change the direction of the electric field density in order to
compensate. Clearly,
this has obvious advantages in maximizing the sensitivity and accuracy of
moisture content and
density measurements.
Figure 3 shows an illustrative example of a calibration curve 88, showing the
relationship
between attenuation, in dB, on the Y-axis, and moisture content, as a
percentage, on the X-axis.
Each calibration curve 88 is empirically determined for each type of module 10
(for example
bale or case), and for each type of tobacco material. The moisture content of
module 10 is then
determined from calibration curve 88. A more complete description of these
curves and their
derivation can be found in "Theoretical and Experimental Investigation of
Microwave Moisture
Measurement of Materials" by A. Greenwald, FAN, Uzbekistan, 1982.
Figure 4A shows a graph of a phase regit~n curve 90 as mentioned above. Phase
region
curve 90 is an empirical curve of the attenuation of antenna signal 38 on the
X-axis, and the
phase region on the Y-axis. As an example, if the attenuation is equal to At,
phase region curve
90 shows that the phase region lies between 0 and 2p. Different phase region
curves must be
determined for each material and type of module 10.
In order to use this curve, the attenuation and phase shift of antenna signal
38 are
preferably measured as module 10 is conveyed between source antenna 30 and
receiving antenna
36: For example, a first measurement could be made before the leading edge of
module 10 enters
the region between source antenna 30 and receiving antenna 36, a second
measurement could be
made as the leading edge of module 10 enters that region,, and a third
measurement could be
made when module 10 is aligned between source antenna 30 and receiving antenna
36. The
relationship between these multiple measurements and the phase region is shown
in Figure 4B.
At the top is a diagram of module IO being conveyed betwc;en source antenna 30
and receiving
antenna 36. At the bottom is a graph of the relationship bE;tween the
increasing attenuation as
module 10 becomes aligned between source antenna 30 and receiving antenna 36,
and the phase
shift, which is based upon empirical phase region curve 9t? of Figure 4A. As
the phase shift
cycles between 0-2~ while module 10 is conveyed between source antenna 30 and
receiving
CA 02339922 2001-O1-19
WO 00/09983 PCT/IL99/00421
antenna 36, the number of cycles can be counted and the phase region can be
determined.
Figures 5A-5F illustrate the relationship between the direction of the
electric field density
of the source beam relative to the module and the attenuation and phase shift
of the antenna
signal. Figure 5A shows an electric field density 92 and a magnetic field
density 94. Electric
field density 92 is perpendicular to layers 14 of module I0. In Figure 5B,
electric field density
92 has been rotated by about 45 degrees. In Figure SC, electric field density
92 has been rotated
by about 90 degrees, relative to Figure 5A. Now electric fiend density 92 is
parallel to layers I4
of module 10. Figures 5D-5F show the effect of these shifts in the direction
of electric field
density 92 on attenuation 96 and phase shift 98 of antervna signal 38. In
Figure 5D, both
attenuation 96 and phase shift 98 of antenna signal 38 are at substantially a
minimum level,
because electric field density 92 is perpendicular to layers I4~, as. shown in
Figure 5A. In Figure
5E, both attenuation 96 and phase shift 98 of antenna signal 38 have
increased, due to the
rotation of electric field density 92 as shown in Figure 5B. Finally, in
Figure 5F, both
attenuation 96 and phase shift 98 of antenna signal 38 are at substantially a
maximum level,
because electric field density 92 is parallel to layers 14, as shown in Figure
5C.
Optionally, device 26 can be mounted on a truck 100, as shown in Figure 6.
Microwave
radiation source 28 and receiving antenna 36 are both mounted on truck 100.
Truck 100 then
moves past module 10, so that module 10 passes between microwave radiation
source 28 and
receiving antenna 36. In this manner, a plurality of moisture measurements of
module 10 can be
made and averaged, as described above.
Figures ?A-7C illustrate another exemplary and preferred embodiment of the
present
invention. Figure 7A is a schematic illustration of another preferred
embodiment of device 26,
similar to the one shown in Figure 2, except that receiving antenna 36 is
preferably a circularly
polarized antenna. Furthermore, a conveyor 102, such as a. conveyor belt,
moves module 10,
shown here as bale 12, between source of microwave radiation 28 and receiving
antenna 36; such
that source beam 32 passes through a portion of bale I2, and exits bale 12 as
an exit beam 34.
Since conveyor 102 is moving module 10, source beam 3~2 can pass through a
plurality of
portions of bale 12. Thus, if there are i such portions along; bale 12, i
moisture measurements
can be made. Exit beam 34 is received by receiving antenna :36, which then
produces an antenna
signa138.
In this embodiment, antenna signal 38 is then examined by a bale alignment
determiner
104. Bale alignment determiner 104 then determines the alignment of bale 12
relative to source
beam 32 and receiving antenna 36. Bale alignment deterrniner 104 includes a
leading edge
16
CA 02339922 2001-O1-19
WO 00/09983 PCTlIL99/0042I
transition determiner 106, an interval tuner 108 and a training edge
transitibn determiner 110.
Leading edge transition determiner 106 detects when a leading edge of bale 12
has passed -
radiation source 28; and produces a leading edge transition signal. Interval
timer 108 receives
the leading edge transition signal and produces an alignment signal, such that
alignment signal is
produced when bale 12 is correctly aligned between microwave radiation source
28 and
receiving antenna 36. Trailing edge transition determiner I llO determines
when the trailing edge
of bale 12 passes~microwave radiation source 28, and produces a trailing edge
transition signal.
A moisture determiner I12 then determines the moisture content of bale I2 from
the
alignment signal. Moisture determiner 112 includes a background moisture
content measurer
114, which measures the background moisture content of antenna signal 38 after
receiving the
trailing edge transition signal. This background moisture content includes
both the ambient
moisture content, from source beam 32 passing through the air,,and artifacts
caused by device 26
itself, such as misalignment of source beaam 32 relative to 'bale I2 and
movement of receiving
antenna 36 from the correct position relative to bale 12. Moisture determiner
l I2 also includes a
filter 116 for producing a corrected signal by removing the; background
moisture content from
the alignment signal.
Preferably, moisture determiner 1I2 also includes a tie bar suppressor 118. If
source
beam 32 contacts a tie bar 16 as source beam 32 goes through bale 12, antenna
signal 38 can be
affected, potentially resulting in an incorrect moisture me~~surement. Tie bar
suppressor I18
removes any such effects from the corrected signal, and produces a further
corrected signal.
Preferably, this corrected signal then goes to a normalizes 12,0. Normalizes
120 compensates for
effects caused by temperature, mass and length of bale 12, tlms normalizing
the corrected signal.
Such normalization is performed by the following equations:
W; = the ith moisture measurement in the channel,
Wo = the nominal mass of the bale » 250 Kg,
W~ = the actual measured mass of the bale,
T° = the base temperature of the tobacco material (35°C)
and
T~ = the temperature of the tobacco material in the current slice,
a = empirical factor compensating for the temperature of the material,
it may be shown that:
W j- To-T~+Wr
a
17
CA 02339922 2001-O1-19
WO 00/09983 PCT/IL99100421
W.~.;' - W.,.
W
Wo
W~~;' = W3~;
YY
W .Y~' = W .r~ F(size, shape)
The function of (size, shape) is an empirically determined function for
compensating for
the size and shape of the tobacco material, for example as a .bale.
Finally, the normalized signal preferably goes to a mean moisture unit 122,
which
determines the moisture content of bale I2. Preferably, mean moisture unit I22
averages the
moisture content of bale 12 over all i measurements of i portions of bale 12.
Receiving antenna 36 can optionally include an amplitude determiner I24 and an
attenuation determiner 126. Amplitude determiner 124 determines an amplitude
of exit beam
34. Attenuation determiner I26 then produces an attf,nuated signal, by
determining an
attenuation of exit beam 34 from the amplitude of exit beam 34. The attenuated
antenna signal is
then processed in a similar fashion as antenna signal 38.
In the preferred embodiment shown in Figure 7B, source beam 32 is circularly
polarized,
and exit beam 34 has two mutually orthogonal components., One of these
components is in the
direction of the X-axis, and one component is in the direction of the Y-axis.
For convenience,
Figure 7C shows a partial illustration of device 26 according to Figure 7B,
with X-, Y- and Z
axes illustrated.
Referring back to Figure 7B, each component is received by one of two linearly
polarized
microwave receiving antennas 128 and 130, respectively. Each mutually
orthogonal component
is separately processed, similar to the above description in Figure 7A, so
that there are two bale
alignment determiners 104 and 132. Moisture determiner I12 has two filters 116
and 134 for
removing the background moisture component and producin3; a corrected signal.
Preferably, two
digital samplers 136 and I38 then produce a digitized signal from each
component of the
corrected signal. There is also preferably a component moisture computer 140
which then
computes a moisture content of each mutually orthogonal component of the
digitized signal.
Preferably, moisture determiner 112 also has a ratio determination unit 142
for
determining a ratio of each of the moisture contents produced by component
moisture computer
140, according to the following equations:
W~,,~~., .--- Wu cos,~3+ W;y sin.~3
18
CA 02339922 2001-O1-19
WO 00/09983 PCTIIL99/00421
Wfl'sm,er.., - W11' ~JI~~+ WIIW~~S~
K - W~.r _
Wa,.
where:
W; - measured moisture content in the X direction
for the i'h area,
x(meas)
S W - measured moisture content in the Y d:irectian
l for the i'h area
y(meas) s
W; - maximum moisture content of the i'h ~~rea in
the X-direction,
x
W; - maximum moisture content of the l j' ~~rea in
the Y-direction,
y
- the angle of inclination of the layers to the
X-direction,
K - the ratio of the maximum moisture values in the
X and Y directions,
and
a; - the measured ratio W; ( ) : W;y~m~~
x meas
A cornparator 144 then compares the ratio with the predetermined constant K,
which is
obtained when layers in bale 12 are substantially parallel. I:f the ratio is
substantially equal to K,
a parallel layer moisture determiner 146 determines the moisture content of
bale 12. Otherwise,
l 5 a non-parallel layer moisture determiner 148 determines th,e moisture
content of bale 12 when
the ratio is substantially not equal to the predetermined constant K:
Non-parallel layer moisture determiner 148 preferabl!.y determines the
moisture content of
bale 12 by using an empirical function
W = Wy + 3.2 x 10⁻²
K
where W is the moisture content of the signal; Wy is the moisture content of
one of the mutually
orthogonal components which passed through bale 12 in a, direction normal to
layers, y is the
ratio, and K is the predetermined constant.
Figure 8 illustrates the behavior of the antenna signal of the embodiment of
Figures 7A
and 7B. Antenna signal 38 starts at a generally low background level 150 which
climbs to an
initial higher level 152 at a time To when bale 12 (not shown) enters the
region between
microwave radiation source 28 (not shown) and receiving antenna 36 (not
shown): Antenna
signal 38 then reaches a first extraneous peak 154 during tune interval Tj,
due to edge transition
effects caused by the leading edge of bale 12 passing betvreen microwave
radiation source 28
{not shown) and receiving antenna 36 (not shown). During this time, a first
portion of source
beam 32 passes through bale 12 (not shown), and a second portion does not,
causing these edge
19
CA 02339922 2001-O1-19
WO 00109983 PCT/IL99/00421
transition effects.
Once bale 12 (not shown} is correctly aligned between microwave radiation
source 28
(not shown) and receiving antenna 36 (not shown), for example as in Figures 7A
and 7B,
antenna signal 38 goes to a steady level 156 during time interval TZ and
remains substantially .
constant during this time interval, except for fluctuations due to local
inequalities in the moisture
content and structure of bale 12. During time interval T2, the alignment
signal is produced, and
all moisture measurements of bale 12 are made. At time T'3, the trailing edge
of bale 12 (not
shown) starts.to move past microwave radiation source 28 (not shown) and
receiving antenna 36
(not shown), causing a second extraneous peak 158, again due to edge
transition effects caused
by the trailing edge of bale I2.
Figure 9 is a block diagram of an exemplary method for determining the
moisture content
of tobacco according to the present invention. The method of the present
invention can be used
with any of the embodiments of the device as described herein, as well as with
any of the
described methods for performing the calculations of the moisture content of
the tobacco
material.
In step one, a first portion of the module of tobacco moves between a source
of
microwave radiation and a receiving antenna. In step two, once the bale is
correctly aligned
between the source of microwave radiation and the receiving ~~ntenna, the
alignment signal is
produced. In step three, at least one, and preferably a pluralit;r, of
moisture measurements are
made substantially as described for Figures 2-7, 9 or 10. More preferably, in
step three the effect
of the tobacco material itself is removed from the measured moisture content
in order to more
accurately determine the moisture content of the material. Mc>st preferably,
such an effect is
determined empirically, as described in greater detail below.
In step four, the manufacturing process of the tobacco product; such as
cigarettes, pouch
tobacco or chewing tobacco, is preferably adjusted according to the moisture
content of the
material. For example, if the moisture content of the tobacco material is
above a pre-determined
level, preferably the stored tobacco is processed more quickly;, such that the
period of storage is
reduced. Alternatively and preferably, the manufacturing process is adjusted
according to the
moisture content of the tobacco material such that the finished tobacco
product has a moisture
content within a pre-determined, acceptable range, which is approximately 12-
18% for loose
leaves, and 11-13% for processed tobacco.
Figure 10 shows a flow chart of the calculations for determining the moisture
content and
density as relating to internal structure of the tobacco module, particularly
fox hales of tobacco.
CA 02339922 2001-O1-19
W0 00/099$3 PCT/IL99/00421
The attenuation is used to determine the raw moisture content of the material,
while the phase
shift is used to determine density of the material. Both the attenuation and
the phase shift are
preferably used in combination with empirically determined correction factors
to calculate final
values of moisture content and density of the material.
S The first step in the flow chart is the scanning of the nnaterial, which can
6e performed
using the device essentially as described in any of the embodiiments above.
The material is
scanned by transmitting a plurality of microwaves through the bale so that
they pass through the
bale and are received on the other side. From this scanning sl;ep, the phase
shift and the
attenuation are calculated, as shown in step 2. The flow chart; now branches
into two parts. The
right branch shows the steps used in calculating the raw moisture content of
the material, while
the left branch shows the steps for the determination of density of the
material. For clarity, steps
in the right (moisture content) branch will have the letter "a" appended;
e.g., "3a", "4a", etc.
Steps in the left (internal structure) branch will have the letter "b"
appended; e.g., "3b", "4b", etc.
Following the right branch, in step 3a an algorithm is 'used to filter the
data points
1 S obtained for the attenuation. Each time a measurement of the attenuation
is made as described
above in Figure 2, a data point is obtained. These data points must be
filtered, since otherwise
artefactual data could be obtained.
Once the data has been filtered, the attenuation is corrected for the effect
of the weight of
the material and the bale, as shown in step 4a. This correction is preferably
performed by
compensating the attenuation with the ratio of a standard weil;ht to the
actual weight; for
example by multiplication when the material is tobacco, and produces a weight-
corrected
attenuation value. Next, in step Sa, the weight-corrected attenuation value is
preferably
corrected for temperature, to produce a temperature-corrected attenuation
value. The correction
is performed by adding the weight-corrected attenuation value; to the factor
all - TslTe), where
Ts is the standard temperature, and Te is the measured temperature of the
material, in order to
produce the temperature-corrected attenuation value. The temperature of the
material is
preferably measured by inserting a temperature probe into the bale, for
example. The value of a
is empirically determined according to the type of material. hZore preferably,
the temperature is
substantially continuously monitored by the temperature sensor, so that each
measurement of the
attenuation can be corrected with the temperature value taken as the
transmission of microwaves
was made. The temperature-corrected attenuation value thus is compensated for
the effect of
measurements at different temperatures.
In step 6a, the complete set of all temperature-corrected attenuation values
from a single
21
CA 02339922 2001-O1-19
WO OOI09983 PCT/IL99/0042I
slice of material is used to calculate a raw moisture value for that slice.
This calculation is
performed according to a function which can be a linear integration of all the
temperature-
corrected attenuation values or else a polynomial, depending upon such
empirical factors as the
type of tobacco material being measured, the shape and structure of the bale
itself. In any case,
these empirical factors are included in the calculation, so that their effects
an the measurement
can be compensated for. For example, these factors include but are not limited
to the type of
tobacco leaf, and the form of the tobacco such as loose leaves or a type of
bale.
This raw moisture value will be used in the determination of the final
moisture value for
the slice of material. However, the final moisture value cannot be determined
without knowing
the density of material, which is calculated as shown in the left branch of
the flow chart.
Turning back now to the left branch, which includes steps for calculating the
density of
the tobacco material, the density is calculated from the phase ;shift, in
accordance with empirical
information from a database. The empirical information includes the type of
tobacco material
and the structure of the bale itself.
Additionally, the database preferably contains "fuzzy descriptors" which are
used to find
the correct phase region and to determine the proper relationship between
measured phase shift
values and calculated density values. These "fuzzy descriptors" are obtained
by collecting phase
shift data from an analysis of test modules of tobacco having known features,
and then
comparing the calculated density values with the true, known density values of
the test module.
From this analysis of the test module, the proper correlation between the
measured phase shift
values and the calculated density values can be determined. Since this
correlation depends both
upon the structure of the test module, and upon the type of tobacco material
or materials from
which the test module is constructed, such an analysis must bc; performed for
substantially every
structure of module and type of tobacco material in order to olbtain these
empirically based
carrelations.
In step 4b, any deviation of the measured density of the slice of material
from the
previous measurement of the density of the previous slice is determined. Such
deviations are
important because they reveal potential foreign components and/or ran-
uniformities in the
internal structure of the tobacco material.
In step Sb, the true density of material is calculated in one of two different
ways,
depending upon deviations in the calculated density when comparisons are made
between two or
more slices. In the first method, the deviation in the calculated densities
between a plurality of
slices is relatively small, such that a single density value can be used for
all subsequent
22
CA 02339922 2001-O1-19
WO UI)/099$3 PCT/IL99/00421
calculations. Alternatively, the deviation between the calculated densities of
a plurality of slices
is relatively large, such that a plurality of density values, and preferably
all density values, are
used for the subsequent calculations.
Finally, in step 7, the true density value or values, andl the raw moisture
value, which is
calculated in step 6a, are combined to determine the true moisture value. The
equation for
calculating the true moisture value includes both the true density and any
deviations in the
calculated density within the slice, as well as an empirically dletermined
correlation factor. The
correlation factor depends upon the type of tobacco material and the
structural features of the
module of material, which are empirically determined from calibration samples
of tobacco . In
addition, preferably substantially continuous feedback of previously acquired
moisture
measurements is also correlated with the current moisture measurement as a
correction function.
The true moisture value is then output, far example by displaying on a display
unit which could
include a video screen, or by other devices for displaying the information.
Preferably, any
deviations in density relating to internal structure of the material which
were found by
comparison of the measured phase shifts are also displayed, since such
information is very useful
to a manufacturer of tobacco products.
Figures 11A-11D show various types of moisture measurements for tobacco which
were
performed according to the present invention. Figure 1 1A is ;a graph of the
true moisture content
as a weight percentage (x-axis) against the ratio of the measured attenuation
to the measured
phase, which represents density (y-axis). Six types of tobacco were measured
(burley and flue
cured, with lower, middle and upper stalk for each) in various structures. The
density varied
from I55 kg to 300 kg per cubic meter. As shown, a very good correlation was
obtained
between the true moisture content and the measured attenuation and phase
ratio. The standard
deviation was only 0.4% of the true moisture content. Thus, t:he method of the
present invention
was clearly able to accurately measure the moisture content o:f the tobacco.
Figure 11B shows the results of the phase shift measurements alone (y-axis)
against the
true moisture content of the material for the measurements described for
Figure 1 1A. As can be
seen, without any correction for the density deviation or correlation with the
attenuation, the
values of phase shift are not as correlated with the true moisture content.
The spread of the phase
shift values compared to the true moisture content is caused by the
significant deviations of the
density of the material, which included packages of tobacco. Similarly, for
Figure 11 C, the
measured attenuation values (in dB) alone were also spread when correlated
with the true
moisture content, again caused by the density deviation of the packages of
tobacco. The
23
CA 02339922 2001-O1-19
WO 00109983 PCTIIL99/00421
standard deviation was 1.1 % of the true moisture content, higher tha~r the
0.4% deviation
obtained when the measured phase shift and attenuation values were correlated
as shown in
Figure 11 A. Clearly determination of moisture content of tobacco material
using both measured
phase shift and attenuation data, according to the method of the present
invention, results in
measured moisture content being much~more closely correlated to the true
moisture content of
the material.
Figure 11 D shows the measured amplitude or phase of the tobacco material,
performed
according to the method of the present invention (y-axis) for .each data point
obtained (x-axis).
The measurements were performed with two frequencies of microwaves, F1 and Fi,
in which F,
> F2. The device and method of operation are described with regard to Figure
12 below.
Briefly, both the attenuation and phase shift are determined a~t the two
frequencies of microwave
radiation, as shown. A table of the measured values is given below.
24
CA 02339922 2001-O1-19
WO bb/09983 PCT/IL99/00421
Table of measured values -
Data paint ~ Attenuation Phase shift
Data Region F, = 3.24
GHz .
1 13.62 34.77
2 13.62 34.83
3 13.b2 34.73
4 13.62 34.64
13:62 34.77
6 13.62 34.86
7 13.62 34.7
8 13.62 34.77
9 13.62 34.86
13.62 34.73
Data Region FZ = 3.45
GHz
11 13.88 115.69..___-
12 13.87 115.53
13 13.88 115.63
14 13.88 115.63
13.87 115.53
16 13.$8 115.53
17 13.87 115.59
These values are then used to calculate the moisture content of the material,
by first
correcting the phase shift according to the following equation:
OPh(Fz) - 41'h(Fi) F~
5 PhF~ _
Fz - F~
For this equation, Fl is the first frequency and Fl is the second frequency;
PhFI is the measured
phase shift for the first frequency Fl; and dPh(F~) and dPh(F~j are the phase
shifts for F~ and
F2, respectively. Taking exemplary values from the above Table, the equation
was solved as
follows:
115.6 - 34.7 3.24 =1248
10 Ph~~ =
3.45 - 3.24
Next, the true phase shift was determined as follows.
CA 02339922 2001-O1-19
WO 00/09983 PCT/IL99/00421
Phr.,l360=X~
(mod(X~) * 360) + OPIa(F~) = P«"~
Briefly; first, the measured phase shift PhF, (1248 degrees) was divided by
360 to obtain 3.47
(X~). The modulo of 3:47 was taken to obtain 3, and which v~ras then
multiplied by 360 to get
1080, after which d Ph(F,) was added to obtain the true phase shift (P~",e},
or 1114 degrees.
A(dB)lPh(degrees) = 13.62 dB / 1114 degrees = 0.012. From the previous graph
of the ratio of
the attenuation to the phase shift (Figure 1 1A), the ratio value of 0.012
yielded a moisture
content of 11.2 percent.
Figure 12 shows a schematic diagram of another preferred embodiW ent of the
present
invention, in which the system described previously has been adjusted to
permit transmission of
more than one frequency of microwave radiation. It should be noted that this
preferred
embodiment can be used to determine the moisture content ojP tobacco material
having
substantially any structure as encompassed by the term "module", including
bales, bales and/or
any other bulk of tobacco material. Thus, a module can have a substantially
irregular structure
with variable density.
A multiple-frequency system 160 has a multiple-frequency transmitter 170 for
sequentially transmitting microwave radiation at a plurality o:P frequencies.
The frequency to be
transmitted is selected by a frequency controller 172. Transmitter 170 then
causes a transmitting
antenna 172 to transmit microwave radiation at the desired frequency. The
transmitted
microwave radiation then passes and/or is reflected through a module or bale
of material (not
shown) and is received by a receiving antenna 174. Receiving antenna 174 sends
a signal to a
signal receiver 176: Signal receiver I76 is preferably a heterodyne receiver.
Substantially
simultaneously, a reference signal is sent from transmitter 170 to a reference
receiver 178, which
is also preferably a heterodyne receiver. Signal receiver 176 sends a
measurement signal (labeled
as "LF. 1 ") to a detector 180, while reference receiver 178 sends a reference
signal (labeled as
"LF. 2") to detector 180. Detector 180 uses the reference signal to determine
the correct
attenuation of the measurement signal, and then passes both signals to a phase
detector 182,
which determines the correct phase shift for the measurement signal.
The gross phase shift difference between two phase shifts measured after
microwave
radiation of two different frequencies has been transmitted thr~augh the
material can be described
as follows.
D P(gross) = F2/(FZ-F ~ ) * (P2 - P ~ )
The final phase shift difference is:
26
CA 02339922 2001-O1-19
WO 00/09983 PCT/IL99/00421
D P (final) = Pi + Pg mod (zn)
Thus, the gross phase shift difference is obtained by sequentially
transmitting microwave
radiation of at least two different frequencies, and "hopping" or alternating
at least between these
two frequencies at each point in the material.
The equations which describe the phase shift and attenuation are as follows.
1. ~,=C/F;1= (wave length of radiation); s'= (dielectric constant of matezzal)
2~t
2. P1= ~~ l;
'
2~~
3. P2= X22 h
z~~
4. P;= KFz; PZ= KF2; K= C h pz_p2= O p ~ K(Fz_Fz)~
5. P;= Ph~t~ (F~); PZ= Plz~c> (Fa)~
'
P,-P2
b. K= F~ - Fz ; ~1>F2)
7. Pg= (phase including n~term) = K~ F; (l is 1 or 2)
P~_P2
8. Corrected Phase-shift = (Pg- n~c) + 2 ; h= (pg- h~>0)
Note that F is the frequency of the microwave radiation; l is the length of
the beam path
as it passes through the material of the module; s' is the dielectric constant
of the bulk of
material; Pl is the phase deviation for microwave radiation at frequency Fl;
P2 is the phase
deviation for microwave radiation at frequency F2; K (FI-F~ is i:he difference
between the phase
deviation of the radiation at frequencies F, and Fz; P,,~t~ is the true phase
shift, such that the
measured phase shift, P,, is a function of the true phase shift and of the
frequency F;, for
example; Pg is the gross phase shift difference; and n is the largf;st number
which satisfies
z~
CA 02339922 2001-O1-19
WO 00/09983 PCTIIL99/00421
equation 8 such that Pg - n~ris greater than 0.
Although these equations both describe the corrected phase shift and can be
used for its
calculation, the refinements of the calculations must be done according to
empirically observed
properties of the material itself and effects of the surrounding environment.
In step 1, a plurality
of frequencies of microwave radiation are~sequentially transmitted through the
material in a
module. In step 2, the attenuation and the corrected phase shift are
calculated for the plurality of
frequencies of microwave radiation.
In step 3, an algorithm is performed to filter noise from the calculated
values of the
attenuation and the corrected phase shift. The attenuation for a frequency Fl;
can be described as
I O Az; = aIAJ; + b1. Similarly, the phase shift is P;2=a2P,; + b1. Note that
Al; and Pl; are the
attenuation and phase shift values obtained from the previously measured
frequency Fl;. The
values for al, a2, b~ and b2 are taken from a database, depending; upon the
particular application
and type of material. For example, one set of values would be required for
tobacco in a bale,
while another set of values would be required for a loose pile of tobacco
leaves. These values
are empirically determined based upon empirical measurements of the material
concerned. This
calculation to filter noise is preferably performed upon all calculated values
of the attenuation
and the corrected phase shift. In addition, the value of each of tlhe
plurality of frequencies is
used for these calculations, since the attenuation and phase shift values are
also dependent upon
the frequency of the microwave radiation.
Preferably, any'edge' measurements, or measurements o~f microwave radiation
transmitted through or reflected by an edge of material are eliminated from
any subsequent
calculations since these measurements are considered extraneous. The
determination of whether
a particular measurement is an 'edge' measurement can be made in a number of
ways. For
example, the location of the module relative to the beam can be determined,
such that when an
edge of the module is about to be impinged by the microwave beam, a signal can
be sent to the
attenuation and phase shift determiners. Alternatively and preferably, the
measurement of the
attenuation can be plotted, and any extraneously high peaks or low troughs of
attenuation can be
eliminated, for example by removing any values which are more than two or
three standard
deviations from the average attenuation. Thus, any extraneous 'edge'
measurements are
preferably eliminated at this stage of the analysis.
In step 4, density and moisture content of tobacco material are calculated
from the
plurality of filtered attenuation and filtered phase shift values, preferably
from all of these
values. The moisture content of the material is determined frorr~ the
following equation:
28
CA 02339922 2001-O1-19
WO 00/09983 PCT/IL99/00421
Ii~~" _ ~ Ww rr
in which r; is the correlation factor described previously. The .term W; is a
function of the
attenuation A2 and the phase shift P2 as determined in step 3, as well as of-
the type and structure -
of material. The correlation factor is obtained from a databa:>e of these
values, determined from
empirical observation.
Values of material density are then calculated from a. statistical function of
the sum of
the phase shift values, again taken from the database. This function depends
upon the
characteristics of the material being analyzed, as for the calculation to
filter noise described for
step 3. Also, the density is a function of both P2 as determinE;d in step 3,
and the type and
structure of the material. Thus, the necessary information is taken from a
database of empirically
determined information.
Preferably, at this stage any defects in the material arf; detected by
examining the
densities collected for a portion of the material. The defect could include an
irregular moisture
distribution within the interior of the material, such as an unusually high
moisture content within
the material, and the presence of a foreign component and/or non-uniformity
inside the tobacco
material, for example.
In step 5, temperature of the material is preferably compensated for during
determination
of maisture content and density, if necessary. Again, the necessity for step 5
is determined at
least partially according to empirical observations.
In step 6, moisture content and density of the material are output, for
example to a
display on a computer screen or by printing onto paper.
The advantages of determining moisture content and density of each point in a
material at
more than one frequency of microwave radiation are as follovvs. First,
measuring the attenuation
and phase shift at one point in the material but with more than one frequency
permits averaging
of the values to obtain a more accurate result. Second, the change in the
attenuation is linear, so
that alterations in the attenuation due to the measurement at different
frequencies can be easily
calculated. Any remaining differences are then removed by averaging. Third, a
good range of
frequencies for any particular type or form of material can be selected,
rather than relying upon a
single frequency. Finally, measurements at the chosen range of frequencies
also enable the true
phase shift to be determined.
The third point, the ability to choose a good range of frequencies fox a
particular type or
form of material, is particularly important for mixed materials,, or materials
containing more than
29
CA 02339922 2001-O1-19
WO 00/09983 PCT/IL99100421
one type of substance. For example, tobacco leaves are often mixed with
umze'eded raw material
components such as stems, which affect the measured moisture content of the
tobacco leaves
themselves. Additionally, this mixture of different types of materials with
different properties
causes harmonics to appear in the transmitted microwaves. however, the true
phase shift can be
determined from a linear portion of the~curve of phase shift plotted against
frequency. Thus,
using a plurality of frequencies can simplify the determination of the phase
shift for mixed
materials.
Optionally and preferably, a frequency range of microwave radiation can be
chosen
which minimizes reflection of radiation by the material and maximizes
transmission of
microwave radiation through the material. More preferably, ;a range of
suitable frequencies is
chosen from a database before microwave measurements are made. The choice of a
particular
range is empirically based on such factors as the type of material and the
structure of material.
Therefore, tobacco in a bale would require a different range o~f frequencies
than loose tobacco
leaves, for example. During real-time acquisition of microwave measurements,
the frequency
range can also be selected to reduce or eliminate normal levels of background
noise caused by
environmental effects and possible interference. An example of such
interference could be a
cellular phone. Preferably, more than one frequency range is examined before
selecting a
particular range in which to make the measurements, in order to reduce or
eliminate this
problem.
In addition, preferably adjustments are made to the selected range of
frequencies, such
that more measurements are made within a smaller range of firequencies which
gives the best
results. Thus, adjustments to the frequency range rnade'on the fly' enable the
most sensitive and
accurate measurements to be made.
According to still another preferred embodiment .of the present invention;
there is
provided a method for determining the internal structure of a package of
material, such as
tobacco for example, from at least one of the moisture and density
measurements from the
received microwaves, or a combination thereof. For the purposes of description
only, the
following example focuses on the analysis of the structure of a package of
tobacco, it being
understood that this is only an illustrative example and is not intended to be
limiting in any way.
Preferably, each portion of the package of tobacco is analyzed by passing
between the
transmitting and receiving antennas, as previously dE;scribed. More
preferably, such
measurements are performed using microwaves at a plurality of frequencies, in
order to obtain a
set of measured results for each portion of the package of tobacco. The output
of the microwave
CA 02339922 2001-O1-19
WO 00/09983 PCT/IL99/00421
data acquisition is, for each portion of the package through which microwaves
are transmitted, a
set of at least one of measured moisture and density values, and more
preferably a combination
of both values, each measured value obtained from microwaves at a different
frequency. Each
measured value is then processed in order to obtain an indication of the
differential between the -
moisture content and/or density of that portion and the xnoisture content
and/or density of
surrounding portions.
Typically, each moisture and/or density differential corresponds to at least a
portion of a
foreign object and/or foreign matter (collectively referred to as a 'foreign
component'), or a lack
of uniformity of the material itself, such as a non-uniform~,ity of the
moisture content and/or
density of the material, all of which are collectively referred 'to herein as
a 'targef. For example,
a lack of uniformity of the material itself could be caused by excessively
high moisture content,
an air pocket, or more loosely packaged material, in a localized portion of
the package of
material.
Each target is classified as belonging to one of a standard set of moisture
content and
I 5 density types. For each target, the location and relative size of the
target is obtained by scanning
along at least one axis, and more preferably by scanning along at least two
axes, and most
preferably by scanning along three axes of the portion of packaged material.
Obtaining values
from measurements along a plurality of axes is preferred for greater accuracy
and precision, and
in order to reduce the number of falsely identified moisture ,content and/or
density variations in
the material. These values are mapped separately for each target class as
described in greater
detail below. The array of mapped values constitutes a collective descriptor
vector for all the
targets. A relationship is provided that relates the descriptor vector to a
size vector of the target,
where size refers to, for example, an area occupied by the foreign object or
volume, and/or area
of the non-uniformity per unit volume and/or area of the package of tobacco,
depending upon the
number of axes along which measurements are taken. Thiis relationship is used
to infer the
relative area and/or volume of the foreign components and/or non-uniformities
from the
descriptor vector.
The set of standard density types, and the relationship between descriptor and
size
vectors of the targets are obtained by a calibration procedure. A set of
standard calibration
samples of known eornpositions, moisture contents, and densities is provided.
These calibration
samples may be different collections of tobacco leaves mixed with foreign
components and/or
having non-uniformities of various sizes, as well as of various moisture
contents and densities.
For each calibration sample, one or more sets of pairs of moisture content
and/or density values
31
CA 02339922 2001-O1-19
WO 00109983 PCT/IL99/0042I
at different frequencies of microwaves are acquired. These pairs of values are
compared to
standard values for tobacco leaves alone. Locations within the collections of
mixed tobacco
leaves and foreign components with measured moisture content and/or density
differential values
which exceed the threshold are grouped into calibration targets. For each
calibration target,
values of size parameters such as area or volume axe calculated. Values of the
size parameters
and of the moisture content and/or density parameters are classified by
cluster analysis to obtain
the standard target types.,
The calibration samples are analyzed by a prior art method, if necessary, to
obtain a set of
patterns for detecting various features. These features are computed with the
moisture content
IO andlor density parameters by standard computational methods, for example by
training a neural
net.
The output of the training of a neural net is a trained neural net whose
inputs are
descriptor {moisture content and/or density) vectors and size; (area and/or
volume) vectors, and
whose outputs are patterns of features which may be considered.desirable or
undesirable to have
I S in the packaged material. The neural network is trained 1>y using the
calibration descriptor
vectors and calibration size vectors as a training set. The desiired
relationship between descriptor
vectors and size vectors, and hence the pattern of'good' or'bad' features then
is the trained neural
network. See, for example, P. Yu. V. Anastassopoulos and A. N.
Venetsanopoulos, "Pattern
classification and recognition based on morphology and neural networks", Can.
.l. Elect. and
20 Comp. Eng., Vol. 17 No. 2 (1992) pp. 58-59 and the reference, therein.
A preferred embodiment of the calibration and t<~rget detection procedure is
now
described with regard to the flowchart shown in Figures 13~A-13B. The
calibration and target
detection procedure includes two loops, one over N calit~ration samples and
one loop for
detecting targets in actual packages of material. In the first lnop, at least
one measured value of
25 moisture content and density, and preferably both, of the calibration
samples are acquired, and
the database target types are determined. In the second loop, actual packages
of material are
examined and targets are identified within these packages.
Referring to Figure 13A, in the first loop, moisture content and/or density
values are
acquired as previously described, according to any of the embodiments given
above; as shown in
30 step 1. Preferably, these values are obtained from determination of
multiple vectors as described
above; resulting from transmission of microwaves along apt least one axis of
the packaged
material.
After a pre-determined number of relevant moisture content and/or density
values of a
32
CA 02339922 2001-O1-19
WO 00109983 PCTIIL99I00421
pre-determined number of samples has been collected, targets are detected ire
step 2. Values of
moisture content and/or density parameters of each target are computed, and
the database target
types are obtained by applying cluster analysis to the resulting set of
moisture content and/or
density parameter values, as shown in step 3. These database target types are
used to define .
target classes, thereby enabling classification of targets in calibration
samples, according to these
classes in step 4. Calibration samples are also analyzed according to standard
techniques in
order to determine actual moisture content and/or density values in -step S.
Alternatively, known
values of moisture content and/or density could be assigned to calibration
samples of known
compositions, prepared by varying amounts of tobacco leaves and different
foreign objects
and/or foreign matter. Known moisture content and/or density values are then
compared to
measured moisture content and/or density values in step Ei. The trained neural
net or other
pattern detection algorithm is then applied for detecting patterns in step 7,
and for assigning
these patterns to categories such as "problematic", "good" and so forth.
Refernng to Figure 13B, in step 1 of the second 1<>op, for detecting targets
in actual
I5 packages of material, again moisture and/or density values are acquired for
the package. In step
2, the initial target detection is performed with empirically determined
values obtained from a
database as shown, in order to determine possible features of interest in each
target.
In step 3, the potential targets axe classified according; to a clustering
algorithm, by using
the measurement vectors for the moisture content and/or density values in a
linear statistical
analysis. Preferably, multiple vectors and/or multiple microwave frequencies
are used for
mapping these targets, in order to reduce the possibility fir false target
identification. The
multiple vectors are obtained if microwaves are transmitted through the
material along a
plurality of axes, such that the moisture content and/or density values are
calculated for a
plurality of vectors.
In step 4, fuzzy logic andlor classical statistical analysis are used for
final determination
of targets in an actual sample of packaged material .
Figure I4 shows the target classification process (step 3) included in Figures
13A-I3B in
more detail. In step 1 of the target classification process, for each target,
features of interest are
determined. For example, various features appearing in graphical plots of the
measurements,
such as maximum peak, minimum peak; standard deviation between peaks, apparent
size of the
target (dimensions for which are determined according to the number of vectors
for which
measurements are obtained), width of a peak, and overall number of peaks, are
selectively
detected for each potential target.
33
CA 02339922 2002-02-25
In step 2, the target type is determined by examining all of the features in
order to place
the target within a particular class. In step 3, pattern recognition is
performed by using methods
of pattern classification and recognition. In practice, for example, during a
manufacturing
process involving packaged material, a pattern may be classified in relation
to a quality control
problem associated with the packaged material, such as an air pocket (area of
non-uniformity
within the packaged material), absence or surplus of one or more objects in a
package required
to have a specified number of discrete objects, or an area of unacceptably
high moisture content.
In step 4, one or more targets in an actual sample are recognized and
identified according to the
classified patterns.
It should be noted that although this procedure is described with regard to
moisture
content and density values, which are obtained from attenuation and phase
shift measurements, a
similar procedure could be performed using frequency shift and/or changes in
microwave
resonator quality.
Figures 15 - 18 are examples of actual scenarios of application of the device
and method
I S of the present invention. In each scenario, there is a commonly occurring
problem related to
moisture content and/or density of some form of tobacco material. Pattern
detection,
classification, and recognition are applied to the microwave measurements
performed on each
tobacco material, in order to identify and characterize the problem. This
information is very
useful as quality control feedback for improving a manufacturing process
involving tobacco
material.
In Figure 15, moisture content and density values are determined for multiple
portions of
a tobacco bale, preferably several hundred of such portions. When the ratio of
moisture content
to density (y-axis) is plotted as a function of a linear dimension of the bale
(x-axis), a 'blip'
(shown in circle) in the curve clearly indicates the presence of a non-
uniformity of the material.
Figures 16A-16C show other classifiable patterns of internal structure
recognizable in
tobacco bales. Again, moisture content and/or density, or a ratio thereof, is
plotted against a
linear dimension of the bale. Peak characteristics such as size, shape, number
and so forth, are
determined as previously described. Figure 16A shows a classifiable pattern of
an area having
3Q excessively high moisture, Figure 16B shows a classifiable pattern for a
poorly pressed area of
material and Figure 16C shows a classifiable pattern for an air pocket.
Figure 17 illustrates detection of one or more objects or units missing from a
box or
34
CA 02339922 2001-O1-19
WO 00/09983 PCT/IL99100421
carton required to have a specified number of discrete objects or units. As a
practical example, a
cigarette manufacturing process involves packaging a pre-determined specified
number of
cigarette packages into each of several larger cartons. Part of quality
control of such a
manufacturing process could include monitoring the number of cigarette
packages placed into
S each carton along an assembly line. Package Profile (A) shows a plot of a
package density
parameter as a function of carton sample or carton number along a cigarette
carton packaging
line. This plot is representative of all samples or cigarette cartons being
full according to a given
packaging specification. In Packaging Profile (B), focusing on a noticeable
decrease in the
package density parameter, there is detection of a 'carton" at an identifiable
location in the
packaging line, missing one or more cigarette packages.
Figure 18 illustrates applicability of pattern recognition data processing of
microwave
measurements involving acquisition of both transmitted (T'U) and reflected
(RU) microwave
signals. Reflection of part of the microwave radiation transmitted into
packaged tobacco occurs,
for example, when analyzing cigarette end products such as cigarette cartons
featuring individual
1 S packages of cigarettes, where each package of cigarettes includes an
aluminum foil wrapper.
Due to the nature of interaction between the microwave radiation and the
aluminum wrapper, at
least part of the initially transmitted microwave radiation is rE;flected out
of the cigarette package
and received by the receiving antennae, while the remainirng part of the
initially transmitted
microwave radiation passes through the cigarette package and is also received
by the receiving
antennae. The signals obtained from the received, reflected microwave
radiation as the material
is scanned by transmitting the microwave radiation, are used to build a
reflection vector. The
reflection vector is optionally used for pattern recognition a~ad target
detection, substantially as ,
previously described for density measurements. The device and method of the
present invention
are applicable to other instances where a metal or other microwave radiation
reflecting material
2S is present in a sample ofpackaged tobacco.
While the invention has been described with respect to a limited number of
embodiments, it will be appreciated that many variations, modifications and
other applications of
the invention may be made.
3S