Note : Les descriptions sont présentées dans la langue officielle dans laquelle elles ont été soumises.
CA 02347117 2001-04-19
WO 00/23063 PCT/US99/24611-
Methods for Inhibiting Diabetic Complications
10
BACKGROUND OF THE INVENTION
The instant invention is in the field of Advanced Glycation End-products
(AGEs),
their formation, detection, identification, inhibition, and inhibitors
thereof.
2o Protein Aging and Advanced Glycosylation End products
Nonenzymatic glycation by glucose and other reducing sugars is an important
post-
translational modification of proteins that has been increasingly implicated
in diverse
pathologies. Irreversible nonenzymatic glycation and crosslinking through a
slow,
glucose-induced process may mediate many of the complications associated with
diabetes.
Chronic hyperglycemia associated with diabetes can cause chronic tissue damage
which
can lead to complications such as retinopathy, nephropathy, and
atherosclerotic disease.
(Cohen and Ziyadeh, 1996, J. Amer. Soc. Nephrol. 7:183-190). It has been shown
that the
resulting chronic tissue damage associated with long-term diabetes mellitus
arise in part
from in situ immune complex formation by accumulated immunoglobulins and/or
antigens
bound to long-lived structural proteins that have undergone Advanced
Glycosylation End-
product (AGE) formation, via non-enzymatic glycosylation (Brownlee et al.,
1983, J. Exp.
Med. 158:1739-1744). The primary protein target is thought to be extra-
cellular matrix
CA 02347117 2001-04-19
WO 00/23063 PCT/US99/24611
associated collagen. Nonenzymatic glycation of proteins, lipids, and nucleic
acids may
play an important role in the natural processes of aging. Recently protein
advanced
glycation has been associated with 13-amyloid deposits and formation of
neurofibrillary
tangles in Alzheimer disease, and possibly other neurodegenerative diseases
involving
amyloidosis (Colaco and Harrington, 1994, NeuroReport 5: 859-861). Glycated
proteins
have also been shown to be toxic, antigenic, and capable of triggering
cellular injury
responses after uptake by specific cellular receptors (see for example,
Vlassara, Bucala &
Striker, 1994, Lab. Invest. 70:138-151; Vlassara et al., 1994, PNAS(USA)
91:11704-
11708; Daniels & Hauser, 1992, Diabetes 41:1415-1421; Brownlee, 1994, Diabetes
l0 43:836-841; Cohen et al., 1994, Kidney Int. 45:1673-1679; Brett et al.,
1993, Am. J. Path.
143:1699-1712; and Yan et al., 1994, PNAS(USA) 91:7787-7791).
The appearance of brown pigments during the cooking of food is a universally
recognized phenomenon, the chemistry of which was first described by Maillard
in 1912,
and which has subsequently led to research into the concept of protein aging.
It is known
that stored and heat-treated foods undergo nonenzymatic browning that is
characterized by
crosslinked proteins which decreases their bioavailibility. It was found that
this Maillard
reaction occurred in vivo as well, when it was found that a glucose was
attached via an
Amadori rearrangement to the amino-terminal of the oc-chain of hemoglobin.
The instant disclosure teaches previously unknown, and unpredicted mechanism
of
2o formation of post-Amadori advanced glycation end products (Maillard
products; AGEs)
and methods for identifying and characterizing effective inhibitors of post-
Amadori AGE
formation. The instant disclosure demonstrates the unique isolation and
kinetic
characterization of a reactive protein intermediate competent in forming post-
Amadori
AGES, and for the first time teaching methods which allow for the specific
elucidation and
rapid quantitative kinetic study of "late" stages of the protein glycation
reaction.
In contrast to such "late" AGE formation, the "early" steps of the glycation
reaction have been relatively well characterized and identified for several
proteins
(Harding, 1985, Adv. Protein Chem. 37:248-334; Monnier & Baynes eds., 1989,
The
Maillard Reaction in Aging, Diabetes, and Nutrition (Alan R. Liss, New York);
Finot et
al., 1990, eds. The Maillard Reaction in Food Processing, Human Nutrition and
Physiology (Birkhauser Verlag, Basel)). Glycation reactions are known to be
initiated by
reversible Schiff base (aldimine or ketimine) addition reactions with lysine
side-chain s-
2
CA 02347117 2001-04-19
WO 00/23063 PCTNS99/24611
amino and terminal a-amino groups, followed by essentially irreversible
Amadori
rearrangements to yield ketoamine products e.g. 1-amino-I-deoxy-ketoses from
the
reaction of aldoses (Baynes et al., 1989, in The Maillard Reaction in A ig-g
Diabetes, and
Nutrition, ed. Monnier and Baynes, {Alan R. Liss, New York, pp 43-67).
Typically,
sugars initially react in their open-chain (not the predominant pyranose and
furanose
structures) aldehydo or keto forms with lysine side chain s-amino and terminal
a-amino
groups through reversible Schiff base condensation (Scheme I). The resulting
aldimine or
ketimine products then undergo Amadori rearrangements to give ketoamine
Amadori
products, i.e. 1-amino-1-deoxy-ketoses from the reaction of aldoses (Means &
Chang,
l0 1982, Diabetes 31, Suppl. 3:1-4; Harding, 1985, Adv. Protein Cherri. 37:248-
334). These
Amadori products then undergo, over a period of weeks and months, slow and
irreversible
Maillard "browning" reactions, forming fluorescent and other products via
rearrangement,
dehydration, oxidative fragmentation, and cross-linking reactions. These post-
Amadori
reactions, (slow Maillard "browning" reactions), lead to poorly characterized
Advanced
Glycation End-products (AGES).
As with Amadori and other glycation intermediaries, free glucose itself can
undergo oxidative reactions that lead to the production of peroxide and highly
reactive
fragments like the dicarbonyls glyoxal and glycoaldehyde. Thus the elucidation
of the
mechanism of formation of a variety of AGES has been extremely complex since
most in
2o vitro studies have been carried out at extremely high sugar concentrations.
In contrast to the relatively well characterized formation of these "early"
products,
there has been a clear lack of understanding of the mechanisms of forming the
"late"
Maillard products produced in post-Amadori reactions, because of their
heterogeneity,
long reaction times, and complexity. The lack of detailed information about
the chemistry
of the "late" Maillard reaction stimulated research to identify fluorescent
AGE
chromophores derived from the reaction of glucose with amino groups of
polypeptides.
One such chromophore, 2-(2-furoyl)-4(5)-(2-furanyl)-1H imidazole (FFI) was
identified
after nonenzymatic browning of bovine serum albumin and polylysine with
glucose, and
postulated to be representative of the chromophore present in the intact
polypeptides.
(Pongor et al., 1984, PNAS(USA) 81:2684-2688). Later studies established FFI
to be an
artifact formed during acid hydrolysis for analysis.
A series of U.S. Patents have issued in the area of inhibition of protein
3
CA 02347117 2004-08-16
glycosylation and cross-linking of protein sugar amines based upon the premise
that the
mechanism of such glycosylation and cross-linking occurs via saturated
glycosylation and
subsequent cross-linking of protein sugar amines via a single basic, and
repeating reaction.
These patents include U.S. Patents 4,665,192; 5,017,696; 4,758,853; 4,908,446;
4,983,604; 5,140,048; 5,130,337; 5,262,152; 5,130,324; 5,272,165; 5,221,683;
5,258,381;
5,106,877; 5,128,360; 5,100,919; 5,254,593; 5,137,916; 5,272,176; 5,175,192;
5,218,001;
5,238,963; 5,358,960; 5,318,982; and 5,334,617.
The focus of these U.S. Patents, are a method for inhibition of AGE formation
to focused on the carbonyl moiety of the early glycosylation Amadori product,
and in
particular the most effective inhibition demonstrated teaches the use of
exogenously
administered aminoguanidine. The effectiveness of aminoguanidine as an
inhibitor of
AGE formation is currently being tested in clinical trials.
Inhibition of AGE formation has utility in the areas of, for example, food
spoilage,
animal protein aging, and personal hygiene such as combating the browning of
teeth.
Some notable, though quantitatively minor, advanced glycation end-products are
pentosidine and NE -carboxymethyllysine (Sell and Monnier, 1989, d. Biol.
Chern.
264:21597-21602; Ahmed et al., 1986, J. Biol. Chem. 26I:4889-4894).
The Amadori intermediary product and subsequent post-Amadori AGE formation,
2o as taught by the instant invention, is not fully inhibited by reaction with
aminoguanidine.
Thus, the formation of post-Amadori AGEs as taught by the instant disclosure
occurs via
an important and unique reaction pathway that has not been previously shown,
or even
previously been possible to demonstrate in isolation. It is a highly desirable
goal to have
an efficient and effective method for identifying and characterizing effective
post
Amadori AGE inhibitors of this "late" reaction. By providing efficient
screening methods
and model systems, combinatorial chemistry can be employed to screen candidate
compounds effectively, and thereby greatly reducing time, cost, and effort in
the eventual
validation of inhibitor compounds. It would be very useful to have in vivo
methods for
modeling and studying the effects of post-Amadori AGE formation which would
then
allow for the efficient characterization of effective inhibitors.
Inhibitory compounds that are biodegradeble and/or naturally metabolized are
more desirable for use as therapeutics than highly reactive compounds which
may have
4
CA 02347117 2001-04-19
WO 00/23063 PCT/US99/24611-
toxic side effects, such as aminoguanidine.
SUMMARY OF THE INVENTION
In accordance with the present invention, a stable post-Amadori advanced
glycation end-product (AGE) precursor has been identified which can then be
used to
rapidly complete the post-Amadori conversion into post-Amadori AGEs. This
stable
product is a presumed sugar saturated Amadori/Schiff base product produced by
the
further reaction of the early stage protein/sugar Amadori product with more
sugar. In a
preferred embodiment, this post-Amadori/Schiff base intermediary has been
generated by
1 o the reaction of target protein with ribose sugar.
The instant invention provides for a method of generating stable protein-sugar
AGE formation intermediary precursors via a novel method of high sugar
inhibition. In a
preferred embodiment the sugar used is ribose.
The instant invention provides for a method for identifying an effective
inhibitor of
the formation of late Maillard products comprising: generating stable protein-
sugar post-
Amadori advanced glycation end-product intermediates by incubating a protein
with sugar
at a sufficient concentration and for sufficient length of time to generate
stable post-
Amadori AGE intermediates; contacting said stable protein-sugar post-Amadori
advanced
glycation end-product intermediates with an inhibitor candidate; identifying
effective
2o inhibition by monitoring the formation of post-Amadori AGEs after release
of the stable
protein-sugar post-Amadori advanced glycation end-product intermediates from
sugar
induced equilibrium. Appropriate sugars include, and are not limited to
ribose, lyxose,
xylose, and arabinose. It is believed that certain conditions will also allow
for use of
glucose and other sugars. In a preferred embodiment the sugar used is ribose.
The instant invention teaches that an effective inhibitor of post-Amadori AGE
formation via "late" reactions can be identified and characterized by the
ability to inhibit
the formation of post-Amadori AGE endproducts in an assay comprising;
generating
stable protein-sugar post-Amadori advanced glycation end-product intermediates
by
incubating a protein with sugar at a sufficient concentration and for
sufficient length of
time to generate stable post-Amadori AGE intermediates; contacting said stable
protein-
sugar post-Amadori advanced glycation end-product intermediates with an
inhibitor
candidate; identifying effective inhibition by monitoring the formation of
post-Amadori
5
CA 02347117 2001-04-19
WO 00/23063 PCT/US99/24611
AGES after release of the stable protein-sugar post-Amadori advanced glycation
end-
product intermediates from sugar induced equilibrium. In a preferred
embodiment the
assay uses ribose.
Thus the methods of the instant invention allow for the rapid screening of
candidate post-Amadori AGE formation inhibitors for effectiveness, greatly
reducing the
cost and amount of work required for the development of effective small
molecule
inhibitors of post-Amadori AGE formation. The instant invention teaches that
effective
inhibitors of post-Amadori "late" reactions of AGE formation include
derivatives of
vitamin B6 and vitamin Bl, in the preferred embodiment the specific species
being
1o pyridoxamine and thiamine pyrophosphate.
The instant invention teaches new methods for rapidly inducing diabetes like
pathologies in rats comprising administering ribose to the subject animal.
Further provided
for is the use of identified inhibitors pyridoxamine and thiamine
pyrophosphate in vivo to
inhibit post-Amadori AGE induced pathologies.
The present invention encompasses compounds for use in the inhibition of AGE
formation and post-Amadori AGE pathologies, and pharmaceutical compositions
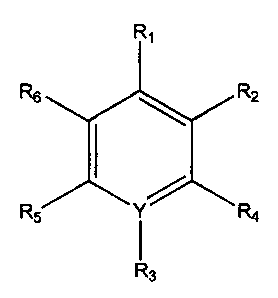
R,
R2
Y
R3
containing such compounds of the general formula:
Formula I
wherein R, is CHZNH2, CHZSH, COOH, CHzCH2NH2, CHZCHzSH, or CHZCOOH;
RZ is OH, SH or NH2;
Y is N or C, such that when Y is N R3 is nothing, and when Y is C, R3 is NOZ
or another
electron withdrawing group; and salts thereof.
The present invention also encompasses compounds of the general formula
6
CA 02347117 2001-04-19
WO 00/23063 PCT/US99/24611
Formula II
R,
Rs R2
Rs r R4
R3
wherein R1 is CH2NH2, CH2SH, COOH, CH2CHZNH2, CH2CH2SH, or CHZCOOH;
R2 and R6 is H, OH, SH, NHZ, C 1-18 alkyl, alkoxy or alkene;
R4 and RS are H, C 1-18 alkyl, alkoxy or alkene;
Y is N or C, such that when Y is N R3 is nothing, and when Y is C, R3 is N02
or another
electron withdrawing group, and salts thereof.
In a preferred embodiment at least one of R4, RS and R6 are H.
1o
In addition, the instant invention also envisions compounds of the formulas
HOt- CH~NH~
HO
CH2NH2 and
The compounds of the present invention can embody one or more electron
withdrawing groups, such as and not limited to NH2, -NHR, -NR2, -OH, -OCH3, -
OCR,
and -NH-COCH3 where R is C t-6 alkyl.
The instant invention encompasses pharmaceutical compositions which comprise
one or more of the compounds of the present invention, or salts thereof, in a
suitable
2o carrier. The instant invention encompasses methods for administering
pharmaceuticals of
the present invention for therapeutic intervention of pathologies which are
related to AGE
7
CA 02347117 2001-04-19
WO 00/23063 PCT/US99/24611
formation in vivo. In one preferred embodiment of the present invention the
AGE related
pathology to be treated is related to diabetic nephropathy.
The instant invention also teaches methods to treat or prevent diabetes
associated
hyperlipidemia, cellular redox imbalances, hypercholesterolemia,
hypertriglyceridemia,
s and atherosclerosis, comprising administering the compounds of the invention
to a
mammal in need thereof.
BRIEF DESCRIPTION OF THE DRAWINGS
1o Figure 1 is a series of graphs depicting the effect of vitamin B6
derivatives on
AGE formation in bovine serum albumin (BSA). Figure 1A Pyridoxamine (PM);
Figure
1 B pyridoxal phosphate (PLP); Figure 1 C pyridoxal (PL); Figure 1 D
pyridoxine (PN).
Figure 2 is a series of graphs depicting the effect of vitamin B 1 derivatives
and
aminoguanidine (AG) on AGE formation in bovine serum albumin. Figure 2A
Thiamine
15 pyrophosphate (TPP); Figure 2B thiamine monophosphate (TP); Figure 2C
thiamine (T);
Figure 2D aminoguanidine (AG).
Figure 3 is a series of graphs depicting the effect of vitamin B( derivatives
on
AGE formation in human methemoglobin (Hb). Figure 3A Pyridoxamine (PM); Figure
3B
pyridoxal phosphate (PLP); Figure 3C pyridoxal (PL); Figure 3D pyridoxine
(PN).
20 Figure 4 is a series of graphs depicting the effect of vitamin B 1
derivatives and
aminoguanidine (AG) on AGE formation in human methemoglobin. Figure 2A
Thiamine
pyrophosphate (TPP); Figure 2B thiamine monophosphate (TP); Figure 2C thiamine
(T);
Figure 2D aminoguanidine (AG).
Figure 5 is a bar graph comparison of the inhibition of the glycation of
25 ribonuclease A by thiamine pyrophosphate (TPP), pyridoxamine (PM) and
aminoguanidine (AG).
Figure 6A is a graph of the kinetics of glycation of RNase A ( 10 mg/mL) by
ribose
as monitored by ELISA. Figure 6B is a graph showing the dependence of
reciprocal half
times on ribose concentration at pH 7.5.
3o Figure 7 are two graphs showing a comparison of uninterrupted and
interrupted
glycation of RNase by glucose (7B) and ribose (7A), as detected by ELISA.
Figure 8 are two graphs showing kinetics of pentosidine fluorescence
(arbitrary
8
CA 02347117 2001-04-19
WO 00/23063 PCT/US99/24611
units) increase during uninterrupted and interrupted ribose glycation of
RNase. Figure 8A
Uninterrupted glycation in the presence of O.US M ribose. Figure 8B
Interrupted glycation
after 8 and 24 hours of incubation.
Figure 9 is a graph which shows the kinetics of reactive intermediate buildup.
Figure 10 are graphs of Post-Amadori inhibition of AGE formation by ribose.
Figure 10A graphs data where aliquots were diluted into inhibitor containing
buffers at
time 0. Figure IOB graphs data where samples were interrupted at 24h, and then
diluted
into inhibitor containing buffers.
Figure 11 is a graph showing dependence of the initial rate of formation of
1o antigenic AGE on pH following interruption of glycation.
Figure 12 are two graphs showing the effect of pH jump on ELISA detected AGE
formation after interrupted glycation. Interrupted samples left 12 days at
37°C in pH 5.0
buffer produced substantial AGEs (33%; Figure 12 B) when pH was changed to
7.5, as
compared to the normal control sample not exposed to low pH (Figure 12 A).
Figure 13 is a series of graphs depicting the effect of vitamin B6 derivatives
on
AGE formation during uninterrupted glycation of ribonuclease A (RNase A) by
ribose.
Figure 13A Pyridoxamine (PM); Figure 13B pyridoxal-5'-phosphate (PLP); Figure
13C
pyridoxal (PL); Figure 13D pyridoxine (PN).
Figure 14 is a series of graphs depicting the effect of vitamin B 1
derivatives and
aminoguanidine (AG) on AGE formation during uninterrupted glycation of
ribonuclease A
(RNase A) by ribose. Figure 14A Thiamine pyrophosphate (TPP); Figure 14B
thiamine
monophosphate (TP); Figure 14C thiamine (T); Figure 14D arninoguanidine (AG).
Figure 15 is a series of graphs depicting the effect of vitamin B6 derivatives
on
AGE formation during uninterrupted glycation of bovine serum albumin (BSA) by
ribose.
Figure I SA Pyridoxamine (PM); Figure 15B pyridoxal-5'-phosphate (PLP); Figure
I SC
pyridoxal (PL); Figure 15D pyridoxine (PN).
Figure 16 is a series of graphs depicting the effect of vitamin B I
derivatives and
aminoguanidine (AG) on AGE formation during uninterrupted glycation of bovine
serum
albumin (BSA) by ribose. Figure 16A Thiamine pyrophosphate (TPP); Figure 16B
thiamine monophosphate (TP); Figure 16C thiamine (T); Figure 16D
aminoguanidine
(AG).
Figure 17 is a series of graphs depicting the effect of vitamin B6 derivatives
on
9
CA 02347117 2001-04-19
WO 00/23063 PCT/US99/24611,
AGE formation during uninterrupted glycation of human methemoglobin (Hb) by
ribose.
Figure 17A Pyridoxamine (PM); Figure 17B pyridoxal-S'-phosphate {PLP); Figure
17C
pyridoxai (PL); Figure 17D pyridoxine (PN).
Figure 18 is a series of graphs depicting the effect of vitamin B6 derivatives
on
post-Amadori AGE formation after interrupted glycation by ribose. Figure 18A
BSA and
Pyridoxamine (PM); Figure 18B BSA and pyridoxal-5'-phosphate (PLP); Figure 18C
BSA and pyridoxal (PL); Figure 18D RNase and pyridoxamine (PM).
Figure 19 are graphs depicting the effect of thiamine pyrophosphate on post-
Amadori AGE formation after interrupted glycation by ribose. Figure 19A RNase,
Figure
19B BSA.
Figure 20 are graphs depicting the effect of aminoguanidine on post-Amadori
AGE
formation after interrupted glycation by ribose. Figure 20A RNase, Figure 20B
BSA.
Figure 21 is a graph depicting the effect of N-a c etyl-L-lysine on post-
Amadori
AGE formation after interrupted glycation by ribose.
1 s Figure 22 are bar graphs showing a comparison of post-Amadori inhibition
of
AGE formation by thiamine pyrophosphate (TPP), pyridoxamine (PM) and
aminoguanidine (AG) after interrupted glycation of RNase (Figure 22A) and BSA
(Figure
22B) by ribose.
Figure 23 is a bar graph showing the effects of Ribose treatment in vivo alone
on
rat tail-cuff blood pressure. Treatment was with 0.05 M, 0.30 M, and 1 M
Ribose (R)
injected for l, 2 or 8 Days (D).
Figure 24 is a bar graph showing the effects of Ribose treatment in vivo alone
on
rat creatinine clearance (Clearance per 100 g Body Weight). Treatment was with
0.05 M,
0.30 M, and 1 M Ribose (R) injected for 1, 2 or 8 Days (D).
Figure 2S is a bar graph showing the effects of Ribose treatment in vivo alone
on
rat Albuminuria (Albumin effusion rate). Treatment was with 0.30 M, and 1 M
Ribose (R)
injected for 1, 2 or 8 Days (D).
Figure 26 is a bar graph showing the effects of inhibitor treatment in vivo,
with or
without ribose, on rat tail-cuff blood pressure. Treatment groups were: 25
mglkg body
weight aminoguanidine (AG); 25 or 2S0 mg/kg body weight Pyridoxamine (P); 250
mg/kg
body weight Thiamine pyrophosphate (T), or with 1 M Ribose (R).
Figure 27 is a bar graph showing the effects of inhibitor treatment in vivo,
with or
CA 02347117 2001-04-19
WO 00/23063 PCT/US99/24611
without ribose, on rat creatinine clearance (Clearance per 100 g body weight).
Treatment
groups were: 25 mg/kg body weight aminoguanidine (AG); 25 or 250 mg/kg body
weight
Pyridoxamine (P); 250 mg/kg body weight Thiamine pyrophosphate (T), or with 1
M
Ribose (R).
Figure 28 is a bar graph showing the effects of inhibitor treatment in vivo
without
ribose, and ribose alone on rat Albuminuria (Albumin effusion rate). Treatment
groups
were: 25 mg/kg body weight aminoguanidine (AG); 250 mg/kg body weight
Pyridoxamine (P); 250 mg/kg body weight Thiamine pyrophosphate (T), or
treatment with
1 M Ribose (R) for 8 days (D). Control group had no treatment.
to Figure 29 is a bar graph showing the effects of inhibitor treatment in
vivo, with 1
M ribose , on rat Albuminuria (Albumin effusion rate). Treatment groups were:
25 mg/kg
body weight aminoguanidine (AG); 25 and 250 mg/kg body weight Pyridoxamine
(P); 250
mg/kg body weight Thiamine pyrophosphate (T), or treatment with 1 M Ribose (R)
for 8
days (D) alone. Control group had no treatment.
Figure 30A depicts Scheme 1 showing a diagram of AGE formation from protein.
Figure 30B depicts Scheme 2, a chemical structure of aminoguanidine. Figure
30C depicts
Scheme 3, chemical structures for thiamine, thiamine-5'-phosphate, and
thiamine
pyrophosphate. Figure 30D depicts Scheme 4, chemical structures of pyridoxine,
pyridoxamine, pyridoxal-5'-phosphate, and pyridoxal. Figure 30E depicts Scheme
S,
2o kinetics representation of AGE formation. Figure 30F depicts Scheme 6,
kinetics
representation of AGE formation and intermediate formation.
Figure 31 shows a 125 MHz C-13 NMR Resonance spectrum of Riobonuclease
Amadori Intermediate prepared by 24 HR reaction with 99% [2-C13]Ribose.
Figure 32 are graphs which show AGE intermediary formation using the pentoses
2s Xylose, Lyxose, Arabinose and Ribose.
Figure 33 is a graph showing the results of glomeruli staining at pH 2.5 with
Alcian blue.
Figure 34 is a graph showing the results of glomeruli staining at pH 1.0 with
Alcian blue.
3o Figure 35 is a graph showing the results of immunofluroescent glomeruli
staining
for RSA.
Figure 36 is a graph showing the results of immunofluroescent glomeruli
staining
11
CA 02347117 2001-04-19
WO 00/23063 PCT/US99/24611
for Heparan Sulfate Proteoglycan Core protein.
Figure 37 is a graph showing the results of immunofluroescent glomeruli
staining
for Heparan Sulfate Proteoglycan side-chain.
Figure 38 is a graph showing the results of analysis of glomeruli sections for
average glomerular volume.
Figure 39. Effect of AG and PM on development of nephropathy in STZ-diabetic
rats. Urine (24-hour samples) and blood were collected at 4-week intervals for
measurement of albuminuria {A) and plasma creatinine (B). Data are expressed
as mean t
SEM for non-diabetic control (~), non-diabetic control + PM (~), untreated
diabetic (O),
to diabetic + PM (0), and diabetic + AG (O) groups. Proteinuria (C) was
measured in a 24-
hour collection at the end of the experiment (28 weeks of diabetes).
Statistical summaries,
determined by the Mann-Whitney Rank Sum Test: all diabetic groups vs. non-
diabetic
controls in A, B & C, p < 0.001. (A, albuminuria): D-PM vs. D, p < 0.0001; D-
AG vs. D,
p = 0.05; D-PM vs. D-AG, p < 0.01. (B, creatininemia): D-PM vs. D, p < 0.0001;
D-AG
vs. D, p < 0.05; D-PM vs. D-AG, p = 0.02. (C, proteinuria): D-PM vs. D, p <
0.001; D-
AG vs. D, p < 0.01; D-PM vs. D-AG, NS.
Figure 40. Effect of ACi and PM on dyslipidemia in STZ-diabetic rats. Plasma
obtained at the end of the experiment (28 weeks) was analyzed for triglyceride
(A), total
cholesterol (B), free fatty acids (C) and glycerol (D). Data are mean ~ SD for
non-diabetic
2o control (~), non-diabetic control + PM (~), untreated diabetic group (O),
diabetic + PM
group (~), and diabetic + AG group (O). Statistical analysis was performed by
the Mann-
Whitney Rank Sum test: all diabetic groups vs. non-diabetic controls in A, B,
C & D, p <
0.001. (A): D-PM vs. D, p = 0.0001; D-AG vs. D, p < 0.05; D-PM vs. D-AG, p <
0.01.
(B): D-PM vs. D: D-AG vs. D, NS; D-PM vs. D-AG, p < 0.01. (C): D-PM vs. D, p =
0.002; D-AG vs. D, p < 0.001; D-PM vs. D-AG, NS. (D): D vs. C, p < 0.0001; D-
PM vs.
D, p < 0.0001; D-AG vs. D, p < 0.0001; D-PM vs. D-AG, NS.
Figure 41. Effect of AG and PM on redox imbalances in STZ-diabetic rats.
Plasma obtained at the end of the experiment (28 weeks) was analyzed for
lactate (A) and
pyruvate (B) concentrations. Their ratio of lactate / pyruvate, an index of
redox status, is
3o shown in frame (C). Symbols are defined in legend to Fig. 2. Statistical
analysis was
performed by the Mann-Whitney Rank Sum test. (C, lactate/pyruvate): D vs. C, p
<
0.0001; D-PM vs. D, p < 0. 001; D-AG vs. D, p = 0. 002; D-PM vs D-AG, p <
0.01.
12
CA 02347117 2004-08-16
Figure 42. Correlations between AGES in skin collagen and biochemical and
physiological parameters. Correlation are shown between CML and plasma
triglycerides
(A), urinary albumin and plasma triglyceride concentrations (B), and CML and
urinary
albumin concentration (C). Statistical analysis was performed by Pearson
Product
Moment calculations. Symbols are defined in legend to Fig. 2. Correlation
coefficients
and p-values are summarized in Table 3.
DETAILED DESCRIPTION
Animal Models for Protein Aging
to Alloxan induced diabetic Lewis rats have been used as a model for protein
aging to
demonstrate the in vivo effectiveness of inhibitors of AGE formation. The
correlation
being demonstrated is between inhibition of late diabetes related pathology
and effective
inhibition of AGE formation (Brownlee, Cerami, and Vlassara, 1988, New Eng. J.
Med
318(20):1315-1321). Streptozotocin induction of diabetes in Lewis rats, New
Zealand
IS White rabbits with induced diabetes, and genetically diabetic BB/Worcester
rats have also
been utilized, as described in, for example, U.S. Patent 5,334,617,
A major problem with these rriodel systems is the long time period required to
demonstrate AGE related injury, and thus to test compounds for AGE inhibition.
For
example, 16 weeks of treatment was required for the rat studies described in
U.S. Patent
2o 5,334,617, and 12 weeks for the rabbit studies. Thus it would be highly
desirable and
useful to have a model system for AGE related diabetic pathology that will
manifest in a
shorter time period, allowing for more efEcient and expeditious determination
of AGE
related injury and the effectiveness of inhibitors of post-Amadori AGE
formation.
25 Antibodies to AGES
An important tool for studying AGE formation is the use of polyclonal and
monoclonal antibodies that are specific for AGES elicited by the reaction of
several sugars
with a variety of target proteins. The antibodies are screened for resultant
specificity for
AGEs that is independent of the nature of the protein component of the AGE
(Nakayama
30 et al., 1989, Biochem. Biophys. Res. Comm. 162: 740-745; Nakayama et al.,
1991, ,T.
Immunol. Methods 140: 119-125; Horiuchi et al., 1991, J. Biol. Chem. 266: 7329-
7332;
Araki et al., 1992, J. Biol. Chem. 267: 10211-10214; Makita et al., 1992, J.
Biol. Chem.
13
CA 02347117 2001-04-19
WO 00/23063 PCT/US99/24611,
2b7: 5133-5138). Such antibodies have been used to monitor AGE formation in
vivo and
in vitro.
Thiamine - Vitamin BI
The first member of the Vitamin B complex to be identified, thiamine is
practically
devoid of pharmacodynamic actions when given in usual therapeutic doses; and
even large
doses were not known to have any effects. Thiamine pyrophosphate is the
physiologically
active form of thiamine, and it functions mainly in carbohydrate metabolism as
a
coenzyme in the decarboxylation of a-keto acids. Tablets of thiamine
hydrochloride are
1o available in amounts ranging from 5 to 500 mg each. Thiamine hydrochloride
injection
solutions are available which contain 100 to 200 mg/ml.
For treating thiamine deficiency, intravenous doses of as high as 100 mg/L of
parenteral fluid are commonly used, with the typical dose of 50 to 100 mg
being
administered. GI absorption of thiamine is believed to be limited to 8 to 15
mg per day,
but may be exceed by oral administration in divided doses with food.
Repeated administration of glucose may precipitate thiamine deficiency in
under
nourished patients, and this has been noted during the correction of
hyperglycemia.
Surprisingly, the instant invention has found, as shown by in vitro testing,
that
administration of thiamine pyrophosphate at levels above what is normally
found in the
human body or administered for dietary therapy, is an effective inhibitor of
post-Amadori
antigenic AGE formation, and that this inhibition is more complete than that
possible by
the administration of aminoguanidine.
Pyridoxine - Vitamin B6
Vitamin B6 is typically available in the form of pyridoxine hydrochloride in
over-
the-counter preparations available from many sources. For example Beach
pharmaceuticals Beelith Tablets contain 25 mg of pyridoxine hydrochloride that
is
equivalent to 20 mg of B6, other preparations include Marlyn Heath Care Marlyn
Formula
50 which contain 1 mg of pyridoxine HCl and Marlyn Formula SO Mega Forte which
3o contains 6 mg of pyridoxine HCI, Wyeth-Ayerst Stuart Prenatal~ tablets
which contain
2.6 mg pyridoxine HCI, J&J-Merck Corp. Stuart Formula~ tablets contain 2 mg of
pyridoxine HCI, and the CIBA Consumer Sunkist Children's chewable
multivitamins
14
CA 02347117 2001-04-19
WO OOI23063 PCT/US99/24611
which contain 1.05 mg of pyridoxine HCI, 150% of the U.S. RDA for children 2
to 4 years
of age, and 53% of the U.S. RDA for children over 4 years of age and adults.
(Physician's
Desk Reference for nonprescription drugs, 14th edition (Medical Economics Data
Production Co., Montvale, N.J., 1993).
There are three related forms of pyridoxine, which differ in the nature of the
substitution on the carbon atom in position 4 of the pyridine nucleus:
pyridoxine is a
primary alcohol, pyridoxal is the corresponding aldehyde, and pyridoxamine
contains an
aminomethyl group at this position. Each of these three forms can be utilized
by
mammals after conversion by the liver into pyridoxal-5'-phosphate, the active
form of the
1o vitamin. It has long been believed that these three forms are equivalent in
biological
properties, and have been treated as equivalent forms of vitamin Bb by the
art. The
Council on Pharmacy and Chemistry has assigned the name pyridoxine to the
vitamin.
The most active antimetabolite to pyridoxine is 4-deoxypyridoxine, for which
the
antimetabolite activity has been attributed to the formation in vivo of 4-
deoxypyridoxine-
5-phosphate, a competitive inhibitor of several pyridoxal phosphate-dependent
enzymes.
The pharmacological actions of pyridoxine are limited, as it elicits no
outstanding
pharrnacodynamic actions after either oral or intravenous administration, and
it has low
acute toxicity, being water soluble. It has been suggested that neurotoxicity
may develop
after prolonged ingestion of as little as 200 mg of pyridoxine per day.
Physiologically, as
2o a coenzyme, pyridoxine phosphate is involved in several metabolic
transformations of
amino acids including decarboxylation, transamination, and racemization, as
well as in
enzymatic steps in the metabolism of sulfur-containing and hydroxy-amino
acids. In the
case of transamination, pyridoxal phosphate is aminated to pyridoxamine
phosphate by the
donor amino acid, and the bound pyridoxamine phosphate is then deaminated to
pyridoxal
phosphate by the acceptor oe-keto acid. Thus vitamin B complex is known to be
a
necessary dietary supplement involved in specific breakdown of amino acids.
For a
general review of the vitamin B complex see The Pharmacological Basis of
Therapeutics,
8th edition, ed. Gilman, Rall, Nies, and Taylor (Pergamon Press, New York,
1990, pp.
1293-4; pp. 1523-1540).
3o Surprisingly, the instant invention has discovered that effective dosages
of the
metabolically transitory pyridoxal amine form of vitamin B6 (pyridoxamine), at
levels
above what is normally found in the human body, is an effective inhibitor of
post-Amadori
CA 02347117 2001-04-19
WO 00/23063 PCT/US99/24611
antigenic AGE formation, and that this inhibition may be more complete than
that possible
by the administration of aminoguanidine.
Formation of Stable AmadorilSchiff base Intermediary
The typical study of the reaction of a protein with glucose to form AGES has
been
by ELISA using antibodies directed towards antigenic AGEs, and the detection
of the
production of an acid-stable fluorescent AGE, pentosidine, by HPLC following
acid
hydrolysis. Glycation of target proteins {i.e. BSA or RNase A) with glucose
and ribose
were compared by monitoring ELISA reactivity of polyclonal rabbit anti-Glucose-
AGE-
to RNase and anti-Glucose-AGE-BSA antibodies. The antigen was generated by
reacting 1
M glucose with RNase for 60 days and BSA for 90 days. The antibodies (R618 and
8479)
were screened and showed reactivity with only AGEs and not the protein, except
for the
carrier immunogen BSA.
Example 1
Thiamine Pyrophosphate and Pyridoxamine Inhibit the Formation of Antigenic
Advanced Glycation End-Products from Glucose: Comparison with Aminoguanidine
Some B6 vitamers, especially pyridoxal phosphate (PLP), have been previously
proposed to act as "competitive inhibitors" of early glycation, since as
aldehydes they
themselves can form Schiff bases adducts with protein amino groups (Khatami et
al.,
1988, Life Sciences 43:1725-1731) and thus limit the amount of amines
available for
glucose attachment. However, effectiveness in limiting initial sugar
attachment is not a
predictor of inhibition of the conversion of any Amadori products formed to
AGES. The
instant invention describes inhibitors of "late" glycation reactions as
indicated by their
effects on the in vitro formation of antigenic AGES (Booth et al., 1996,
Biochem. Biophys.
Res. Com. 220:113-119).
Chemicals Bovine pancreatic ribonuclease A (RNase) was chromatographically
pure,
aggregate-free grade from Worthington Biochemicals. Bovine Serum albumin (BSA;
3o fraction V, fatty-acid free), human methemoglobin {Hb), D-glucose,
pyridoxine,
pyridoxal, pyridoxal S'phosphate, pyridoxamine, thiamine, thiamine
monophosphate,
thiamine pyrophosphate, and goat alkaline phosphatase-conjugated anti-rabbit
IgG were
16
CA 02347117 2001-04-19
WO OO/Z3063 PCT/US99/24611
all from Sigma Chemicals. Aminoguanidine hydrochloride was purchased from
Aldrich
Chemicals.
Uninterrupted Glycation with Glucose Bovine serum albumin, ribonuclease A, and
human hemoglobin were incubated with glucose at 37°C; in 0.4 M sodium
phosphate
buffer of pH 7.5 containing 0.02% sodium azide. The protein, glucose (at 1.0
M), and
prospective inhibitors (at 0.5, 3, 1 S and 50 mM) were introduced into the
incubation
mixture simultaneously. Solutions were kept in the dark in capped tubes.
Aliquots were
taken and immediately frozen until analyzed by ELISA at the conclusion of the
reaction.
1o The incubations were for 3 weeks (Hb) or 6 weeks (RNase, BSA).
Preparation of polyclonal antibodies to AGE proteins
Immunogen preparation followed earlier protocols (Nakayama et al., 1989,
Biochem. Biophys. Res. Comm. 162:740-745; Horiuchi et al., 1991, J. Biol.
Chem.
266:7329-7332; Makita et al., 1992, J. Biol. Chem. 267:5133-5138). Briefly,
immunogen
was prepared by glycation of BSA (R479 antibodies) or RNase (R618 antibodies)
at 1.6 g
protein in 15 ml for 60-90 days using 1.5 M glucose in 0.4 M sodium phosphate
buffer of
pH 7.5 containing 0.05% sodium azide at pH 7.4 and 37°C. New Zealand
white rabbit
males of 8-12 weeks were immunized by subcutaneous administration of a 1 ml
solution
containing 1 mg/rnl of glycated protein in Freund's adjuvant. The primary
injection used
the complete adjuvant and three boosters were made at three week intervals
with Freund's
incomplete adjuvant. Rabbits were bled three weeks after the last booster. The
serum was
collected by centrifugation of clotted whole blood. The antibodies are AGE-
specific, being
unreactive with either native proteins (except for the carrier) or with
Amadori
intermediates. The polyclonal anti-AGE antibodies have proven to be a
sensitive and
valuable analytical tool for the study of "late" AGE formation in vitro and in
vivo. The
nature of the dominant antigenic AGE epitope or hapten remains in doubt,
although
recently it has been proposed that the protein glycoxidation product
carboxymethyl lysine
(CML) may be a dominant antigen of some antibodies (Reddy et al., 1995,
Biochem.
34:10872-10878). Earlier studies have failed to reveal ELISA reactivity with
model CmL
compounds (Makita et al., 1992, .I. Biol. Chem. 267:5133-5138).
17
CA 02347117 2004-08-16
ELISA detection ofAGEproducts The general method of Engvall (1981, Methods
Enzymol. 70:419-439) was used to perform the ELISA. Typically, glycated
protein
samples were diluted to approximately 1.5 ug/ml in 0.1 M sodium carbonate
buffer of pH
9.5 to 9.7. The protein was coated overnight at room temperature onto 96-well
polystyrene
s plates by pippetting 200 u1 of the protein solution in each well (0.3
ug/well). After coating,
the protein was washed from the wells with a saline solution containing 0.05%
Tweeii 20.
The wells were then blocked with 200 u1 of 1 % casein in carbonate buffer for
2 h at 37°C
followed by washing. Rabbit anti-AGE antibodies were diluted at a titer of
about 1:3s0 in
incubation buffer, and incubated for 1 h at 37°C, followed by washing.
In order to
to minimize background readings, antibodies 8479 used to detect glycated RNase
were
raised against glycated BSA, and antibodies 8618 used to detect glycated BSA
and
glycated Hb were raised against glycated RNase. An alkaline phosphatase-
conjugated
antibody to rabbit IgG was then added as the secondary antibody at a titer of
1:2000 or
1:2500 (depending on lot) and incubated for 1 h at 37°C, followed by
washing. The p-
15 nitrophenylphosphate substrate solution was then added (200 ul/well) to the
plates, with
the absorbance of the released p-nitrophenolate being monitored at 410 nm with
a
Dynatech MR 4000 microplate reader.
Controls containing unmodified protein were routinely included, and their
readings
were subtracted, the corrections usually being negligible. The validity of the
use of the
2o ELISA method in quantitatively studying the kinetics of AGE formation
depends on the
linearity of the assay (Kemeny & Challacombe, 1988, ELISA and Other Solid
Phase
Immunoassays, John Wiley & Sons, Chichester, U.K.). Control experiments were
carried
out, for example, demonstrating that the Linear range for RNase is below a
coating
concentration of about 0.2-0.3 mg/well.
2s
Results
Figure 1 A-D are graphs which show the effect of vitamin B6 derivatives on
post-
Amadori AGE formation in bovine serum albumin glycated with glucose. BSA (10
mg/ml) was incubated with 1.0 M glucose in the presence and absence of the
various
30 indicated derivative in 0.4 M sodium phosphate buffer of pH 7.5 at
37°C for 6 weeks.
Aliquots were assayed by ELISA using 8618 anti-AGE antibodies. Concentrations
of the
inhibitors were 3, I 5 and 50 mM. Inhibitors used in Figures ( 1 A)
Pyridoxamine (PM);
18
CA 02347117 2001-04-19
WO 00/23063 PCTNS99/24611
(1B) pyridoxal phosphate (PLP); (1C) pyridoxal (PL); (1D) pyridoxine (PN).
Figure 1 (control curves) demonstrates that reaction of BSA with 1.0 M glucose
is
slow and incomplete after 40 days, even at the high sugar concentration used
to accelerate
the reaction. The simultaneous inclusion of different concentrations of
various B6
S vitamers markedly affects the formation of antigenic AGEs. (Figure lA-D)
Pyridoxamine
and pyridoxal phosphate strongly suppressed antigenic AGE formation at even
the lowest
concentrations tested, while pyridoxal was effective above 1 S mM. Pyridoxine
was
slightly effective at the highest concentrations tested.
Figure 2 A-D are graphs which show the effect of vitamin B 1 derivatives and
1o aminoguanidine (AG) on AGE formation in bovine serum albumin. BSA (10
mg/ml) was
incubated with 1.0 M glucose in the presence and absence of the various
indicated
derivative in 0.4 M sodium phosphate buffer of pH 7.S at 37°C for 6
weeks. Aliquots were
assayed by ELISA using 8618 anti-AGE antibodies. Concentrations of the
inhibitors were
3, 1 S and SO mM. Inhibitors used in Figures (2A) Thiamine pyrophosphate
(TPP); (2B)
15 thiamine monophosphate (TP); (2C) thiamine (T); (2D) aminoguanidine (AG).
Of the various B 1 vitamers similarly tested (Figure 2A-D), thiamine
pyrophosphate
was effective at all concentrations tested (Figure 2C), whereas thiamine and
thiamine
monophosphate were not inhibitory. Most significantly it is remarkable to note
the
decrease in the final levels of AGES formed observed with thiamine
pyrophosphate,
20 pyridoxal phosphate and pyridoxamine. Aminoguanidine (Figure 2D) produced
some
inhibition of AGE formation in BSA, but less so than the above compounds.
Similar
studies were carried out with human methemaglobin and bovine ribonuclease A.
Figure 3 A-D are graphs which show the effect of vitamin B( derivatives on AGE
formation in human methemoglobin. Hb ( 1 mg/ml) was incubated with 1.0 M
glucose in
2s the presence and absence of the various indicated derivative in 0.4 M
sodium phosphate
buffer of pH 7.S at 37°C for 3 weeks. Aliquots were assayed by ELISA
using 8618 anti-
AGE antibodies. Concentrations of the inhibitors were O.S, 3, 1 S and SO mM.
Inhibitors
used in Figures (3A) Pyridoxamine (PM); (3B) pyridoxal phosphate (PLP); (3C)
pyridoxal
(PL); (3D) pyridoxine (PN).
3o It had been previously reported that Hb of a diabetic patient contains a
component
that binds to anti-AGE antibodies, and it was proposed that this glycated Hb
(termed Hb-
AGE, not to be confused with HbAlc) could be useful in measuring long-term
exposure to
19
CA 02347117 2001-04-19
WO 00/23063 PCT/US99/24611
glucose. The in vitf-o incubation of Hb with glucose produces antigenic AGEs
at an
apparently faster rate than observed with BSA. Nevertheless, the different B6
(Figure 3A-
D) and B I (Figure 4A-C) vitamers exhibited the same inhibition trends in Hb,
with
pyridoxamine and thiamine pyrophosphate being the most effective inhibitors in
each of
their respective families. Significantly, in Hb, aminoguanidine only inhibited
the rate of
AGE formation, and not the final levels of AGE formed (Figure 4D).
With RNase the rate of antigenic AGE formation by glucose was intermediate
between that of Hb and BSA, but the extent of inhibition within each vitamer
series was
maintained. Again pyridoxamine and thiamine pyrophosphate were more effective
that
to aminoguanidine (Figure 5).
Figure 4 A-D are graphs which show the effect of vitamin B I derivatives and
aminoguanidine (AG) on AGE formation in human methemoglobin. Hb ( I mg/ml) was
incubated with 1.0 M glucose in the presence and absence of the various
indicated
derivative in 0.4 M sodium phosphate buffer of pH 7.5 at 37°C for 3
weeks. Aliquots were
assayed by ELISA using 8618 anti-AGE antibodies. Concentrations of the
inhibitors were
0.5, 3, 15 and 50 mM. Inhibitors used in Figures (4A) Thiamine pyrophosphate
(TPP);
(4B) thiamine monophosphate (TP); (4C) thiamine (T); (4D) aminoguanidine (AG).
Figure S is a bar graph which shows a comparison of the inhibition of the
glycation
of ribonuclease A by thiamine pyrophosphate (TPP), pyridoxamine (PM) and
aminoguanidine (AG). RNase (1 mg/ml) was incubated with 1.0 M glucose (glc) in
the
presence and absence of the various indicated derivative in 0.4 M sodium
phosphate buffer
of pH 7.5 at 37°C for 6 weeks. Aliquots were assayed by ELISA using
8479 anti-AGE
antibodies. The indicated percent inhibition was computed from ELISA readings
in the
absence and presence of the inhibitors at the 6 week time point.
Concentrations of the
inhibitors were 0.5, 3, 15 and 50 mM.
Discussion
These results demonstrate that certain derivatives of B I and Bg vitamins are
capable of inhibiting "late" AGE formation. Some of these vitamers
successfully inhibited
3o the final levels of AGE produced, in contrast to aminoguanidine, suggesting
that they have
greater interactions with Amadori or post-Arnadori precursors to antigenic
AGES. The
Amadori and post-Amadori intermediates represent a crucial juncture where the
CA 02347117 2001-04-19
WO 00/23063 PCTNS99/24611
"classical" pathway of nonenzymatic glycation begins to become essentially
irreversible
(Scheme I). In earlier inhibition studies "glycation" was usually measured
either as Schiff
base formed (after reduction with labeled cyanoborohydride) or as Amadori
product
formed (after acid precipitation using labeled sugar). Such assays do not
yield information
s on inhibition of post-Amadori conversion steps to "late" AGE products, since
such steps
lead to no change in the amount of labeled sugar that is attached to the
proteins. Other
"glycation" assays have relied on the sugar-induced increase of non-specific
protein
fluorescence, but this can also be induced by dicarbonyl oxidative fragments
of free sugar,
such as glycoaldehyde or glyoxal (Hunt et al., 1988, Biochem. 256:205-212),
l0 independently of Amadori product formation.
In the case of pyridoxal (PL) and pyridoxal phosphate (PLP), the data support
the
simple mechanism of inhibition involving competitive Schiff base condensation
of these
aldehydes with protein amino groups at glycation sites. Due to internal
hemiacetal
formation in pyridoxal but not pyridoxal phosphate, stronger inhibition of
post-Amadori
15 AGE formation by PLP is expected by this competitive mechanism. This indeed
is
observed in the data (Figure 1B, 1C, Figure 3B, 3C). The inhibition by
pyridoxamine is
necessarily different, as pyridoxamine lacks an aldehyde group. However,
pyridoxamine is
a candidate amine potentially capable of forming a Schiff base linkage with
the carbonyls
of open-chain sugars, with dicarbonyl fragments, with Amadori products, or
with post-
20 Amadori intermediates. The mechanism of inhibition of B 1 compounds is not
obvious. All
the forms contain an amino functionality, so that the marked efficiency of
only the
pyrophosphate form suggests an important requirement for a strong negative
charge.
A significant unexpected observation is that the extent of inhibition by
aminoguanidine, and some of the other compounds, is considerably less at late
stages of
25 the reaction, than during the early initial phase. This suggests a
different mechanism of
action than that of pyridoxamine and thiamine pyrophosphate, suggesting that
the
therapeutic potential of these compounds will be enhanced by co-administration
with
aminoguanidine.
30 Example 2
Kinetics of Non-enzymatic glycation: Paradoxical Inhibition by Ribose and
Facile
Isolation of Protein Intermediate for Rapid Post-Amadori AGE Formation
21
CA 02347117 2001-04-19
WO 00/23063 PCT/US99I24b11
While high concentrations of glucose are used to cause the non-enzymatic
glycation of proteins, paradoxically, it was found that ribose at high
concentrations is
inhibitory to post-Amadori AGE formation in ribonuclease by acting on the post-
Amadori
"late" stages of the glycation reaction. This unexpectedly inhibitory effect
suggests that
the "early" reactive intermediates, presumably Amadori products, can be
accumulated
with little formation of "late" post-Amadori AGE products (AGES; Maillard
products).
Investigation into this phenomenon has demonstrated: ( 1 ) ability to define
conditions for
the kinetic isolation of Amadori (or post-Amadori) glycated intermediate(s);
(2) the ability
study the fast kinetics of buildup of such an intermediate; (3) the ability to
study the
to surprisingly rapid kinetics of conversion of such intermediates to AGE
products in the
absence of free or reversibly bound sugar; (4) the ability to use these
intermediates to
study and characterize inhibition of post-Amadori steps of AGE formation thus
providing
a novel system to investigate the mechanism of reaction and the efficacy of
potential
agents that could block AGE formation; and (5) with this knowledge it is also
further
possible to use 13C NMR to study the reactive intermediates and monitor their
conversion
to various candidate AGES (Khalifah et al., 1996, Biochemistry 35(15):4645-
4654).
Chemicals and Materials As in Example 1 above.
Preparation of polyclonal antibodies to AGES
As in Example 1 above.
ELISA detection of AGE products As in Example 1 above.
Amino Acid Analysis Amino acid analyses were carried out at the Biotechnology
Support Facility of the Kansas University Medical Center. Analyses were
performed after
hydrolysis of glycated protein (reduced with sodium cyanoborohydride) with 6 N
HCl at
110°C for 18-24 h. Phenyl isothiocyanate was used for derivatization,
and PTH derivatives
were analyzed by reverse-phase HPLC on an Applied Biosystems amino acid
analyzer
(420A derivatizer, 130A separation system, 920A data analysis system).
Pentosidine Reverse-Phase HPLCAnalysis Pentosidine production in RNase was
22
CA 02347117 2001-04-19
WO 00/23063 PCTNS99/24611
quantitated by HPLC (Sell & Monnier, 1989, J. Biol. Chem. 264:21597-21602;
Odetti et
al., 1992, Diabetes 41:153-159). Ribose-modified protein samples were
hydrolyzed in 6 N
HCl for 18 h at 100°C and then dried in a Speed Vac. The samples were
then redissolved,
and aliquots were taken into 0.1 % trifluoroacetic acid and analyzed by HPLC
on a
Shimadzu system using a Vydac C-18 column equilibrated with 0.1% TFA. A
gradient of
0-6% acetonitrile (0.1 % in TFA) was run in 30 min at a flow rate of about 1
ml/min.
Pentosidine was detected by 335 nm excitation/385 nm emission fluorescence,
and its
elution time was determined by running a synthesized standard. Due to the
extremely
small levels of pentosidine expected (Grandhee & Monnier, 1991, J Biol. Chem.
l0 266:11649-11653; Dyer et al., 1991, J. Biol. Chem. 266:11654-11660), no
attempt was
made to quantitate the absolute concentrations. Only relative concentrations
were
determined from peak areas.
Glycation Modifications Modification with ribose or glucose was generally
done at 37°C in 0.4 M phosphate buffer of pH 7.5 containing 0.02%
sodium azide. The
high buffer concentration was always used with 0.5 M ribose modifications. The
solutions
were kept in capped tubes and opened only to remove timed aliquots that were
immediately frozen for later carrying out the various analyses. "Interrupted
glycation"
experiments were carried out by first incubating protein with the ribose at
37°C for 8 or 24
2o h, followed by immediate and extensive dialysis against frequent cold
buffer changes at
4°C. The samples were then reincubated by quickly warming to
37°C in the absence of
external ribose. Aliquots were taken and frozen at various intervals for later
analysis. Due
to the low molecular weight of RNase, protein concentrations were remeasured
after
dialysis even when low molecular weight cut-off dialysis tubing was used. An
alternative
procedure was also devised (see below) in which interruption was achieved by
simple 100-
fold dilution from reaction mixtures containing 0.5 M ribose. Protein
concentrations were
estimated from UV spectra. The difference in molar extinction between the peak
(278 nm)
and trough (250 nm) was used for RNase concentration determinations in order
to
compensate for the general increase in UV absorbance that accompanies
glycation. Time-
dependent UV-difference spectral studies were carried out to characterize the
glycation
contributions of the UV spectrum.
23
CA 02347117 2001-04-19
WO 00/23063 PCT/US99/24611
Data Analysis and Numerical Simulations of Kinetics Kinetic data were
routinely fit
to monoexponential or biexponential functions using nonlinear least-squares
methods. The
kinetic mechanisms of Schemes 5-6 have been examined by numerical simulations
of the
differential equations of the reaction. Both simulations and fitting to
observed kinetics data
were carried out with the SCIENTIST 2.0 software package (Micromath, Inc.).
Determination of apparent half times (Figure 6B) from kinetic data fit to two-
exponential
functions (Figure 6A) was carried out with the "solve" function of MathCAD 4.0
software
(MathSoft, Inc.).
to RESULTS
Comparison of Glycation by Glucose and Ribose
The reaction of RNase A with ribose and glucose has been followed primarily
with
ELISA assays, using 8479 rabbit AGE-specific antibodies developed against
glucose-
modified BSA. To a lesser extent, the production of pentosidine, the only
known acid-
stable fluorescent AGE, was quantiated by HPLC following acid hydrolysis.
Preliminary
studies using 0.05 M ribose at 37°C showed that the rate of antigenic
AGE formation
appears to be modestly increased (roughly 2-3 fold as measured by the apparent
half time)
as the pH is increased from 5.0 to 7.5, with an apparent small induction
period at the
beginning of the kinetics in all cases. The glycation of RNase with 0.05 M
ribose at pH 7.5
(half time near 6.5 days) appears to be almost an order of magnitude faster
than that of
glycation with 1.0 M glucose (half time in excess of 30 days; see Figure 7B,
solid line).
The latter kinetics also displayed a small induction period but incomplete
leveling off even
after 60 days, making it difficult to estimate a true half time.
When the dependence of the kinetics on ribose concentration was examined at pH
7.5, a most unexpected result was obtained. The rate of reaction initially
increased with
increasing ribose concentration, but at concentrations above 0.15 M the rate
of reaction
leveled off and then significantly decreased (Figure 6A). A plot of the
dependence of the
reciprocal half time on the concentration of ribose (Figure 6B) shows that
high ribose
concentrations are paradoxically inhibitory to post-Amadori antigenic AGE
formation.
This unusual but consistent effect was found to be independent of changes in
the
concentration of either buffer (2-fold) or RNase ( 10-fold), and it was not
changed by
affinity purification of the 8479 antibody on a column of immobilized AGE-
RNase. It is
24
CA 02347117 2004-08-16
also not due to effects of ribose on the ELISA assay itself. The measured
inhibitory effect
by ribose on post-Amadori AGE formation is not likely due to ribose
interference with
antibody recognition of the AGE antigenic sites on protein in the ELISA assay.
Prior to
the first contact with the primary anti-AGE antibody on the ELISA plates,
glycated protein
has been diluted over 1000-fold, washed extensively with Tweeri 20 after
adsorption, and
blocked with a 1 % casein coating followed by further washing with Tween 20.
Kinetics of Formation ojpost Amadori Antigenic AGES by "Interrupted Glycation
"
In view of the small induction period seen, an attempt was made to determine
to whether there was some accumulation during the reaction, of an early
precursor such as an
Amadori intermediate, capable of producing the ELISA-detectable post-Amadori
antigenic
AGES. RNase was glycated at pH 7.5 and 37°C with a high ribose
concentration of 0.5 M,
and the reaction was interrupted after 24 h by immediate cooling to 4°C
and dialysis
against several changes of cold buffer over a period of 24 h to remove free
and reversibly
bound (Schiff base) ribose. Such a ribose-free sample was then rapidly warmed
to 37°C
without re-adding any ribose, and was sampled for post-Amadori AGE formation
over
several days. The AGE antigen production of this 24 h "interrupted glycation"
sample is
shown by the dashed line and open triangles in Figure 7A, the time spent in
the cold
dialysis is not included. An uninterrupted control (solid line and filled
circles) is also
2o shown for comparison. Dramatically different kinetics of post-Amadori
antigenic AGE
formation are evident in the two samples. The kinetics of AGE antigen
production of the
ribose-free interrupted sample now show (1) monoexponential kinetics with no
induction
period, (2) a greatly enhanced rate of antigenic AGE formation, with
remarkable half
times of the order of 10 h, and (3) production of levels of antigen comparable
to those seen
in long incubations in the continued presence of ribose (see Figure 6A).
Equally
significant, the data also demonstrate that negligible AGE antigen was formed
during the
cold dialysis period, as shown by the small difference between the open
triangle and filled
circle points at time 1 day in Figure 7A. Very little, if any, AGE was formed
by the
"interruption" procedure itself. These observations show that a fully
competent isolatable
3o intermediate or precursor to antigenic AGE has been generated during the 24
h contact
with ribose prior to the removal of the free and reversibly bound sugar.
Samples interrupted after only 8 h produced a final amount of AGE antigen that
CA 02347117 2001-04-19
WO 00/23063 PCT/US99/24611
was about 72% of the 24 h interrupted sample. Samples of RNase glycated with
only 0.05
M ribose and interrupted at 8 h by cold dialysis and reincubation at
37°C revealed less
than 5% production of ELISA-reactive antigen after 9 days. Interruption at 24
h, however,
produced a rapid rise of ELISA antigen (similar to Figure 7A) to a level
roughly 50% of
that produced in the uninterrupted presence of 0.05 M ribose.
The same general interruption effects were also seen with other proteins (BSA
and
Hemoglobin). Except for a somewhat different absolute value of the rate
constants, and the
amount of antigenic AGEs formed during the 24 h 0.5 M ribose incubation, the
same
dramatic increase in the rate of AGE antigen formation was observed after
removal of 0.5
to M ribose.
Glycation is much slower with glucose than with ribose (note the difference in
time
scales between Figure 7A and Figure 7B). However, unlike the case with ribose,
interruption after 3 days of glycation by 1.0 M glucose produced negligible
buildup of
precursor to ELISA-reactive AGE antigens (Figure 7B, dashed curve).
Kinetics of Pentosidine Formation
The samples subjected to ELISA testing were also assayed for the production of
pentosidine, an acid-stable AGE. The content of pentosidine was measured for
the same
RNase samples analyzed for antibody reactivity by ELISA. Glycation by ribose
in 0.4 M
2o phosphate buffer at pH 7.5 produced pentosidine in RNase A that was
quantitated by
fluroescence after acid hydrolysis. Figure 8A shows that under uninterrupted
conditions,
0.05 M ribose produces a progressive increase in pentosidine. However, when
glycation is
carried out under "interrupted" conditions using 0.5 M ribose, a dramatic
increase in the
rate of pentosidine formation is seen immediately after removal of excess
ribose (Figure
8B), which is similar to, but slightly more rapid than, the kinetics of the
appearance of
antigenic AGES (Figure 7A). A greater amount of pentosidine was also produced
with 24
h interruption as compared with 8 h. Reproducible differences between the
kinetics of
formation of pentosidine and antigenic AGEs can also be noted. A significant
amount of
pentosidine is formed during the 24 h incubation and also during the cold
dialysis,
3o resulting in a jump of the dashed vertical line in Figure 8B. Our
observations thus
demonstrate that a pentosidine precursor accumulates during ribose glycation
that can
rapidly produce pentosidine after ribose removal (cf. Odetti et al., 1992,
Diabetes 41:153-
26
CA 02347117 2001-04-19
WO 00/23063 PCT/US99/24611
159).
Rate of Buildup of the Reactive Intermediates)
The "interrupted glycation" experiments described above demonstrate that a
precursor or precursors to both post-Amadori antigenic AGES and pentosidine
can be
accumulated during glycation with ribose. The kinetics of formation of this
intermediate
can be independently followed and quantitated by a variation of the
experiments described
above. The amount of intermediate generated in RNase at different contact
times with
ribose can be assayed by the maximal extent to which it can produce antigenic
AGE after
l0 interruption. At variable times after initiating glycation, the free and
reversibly-bound
ribose is removed by dialysis in the cold or by rapid dilution (see below).
Sufficient time
(5 days, which represents several half lives according to Figure 7A) is then
allowed after
warming to 37°C for maximal development of post-Amadori antigenic AGES.
The ELISA
readings 5 days after each interruption point, representing maximal AGE
development,
would then be proportional to the intermediate concentration present at the
time of
interruption.
Figure 9 shows such an experiment where the kinetics of intermediate buildup
are
measured for RNase A in the presence of 0.5 M ribose (solid symbols and
curve). For
comparison, the amount of AGE present before ribose removal at each
interruption point
2o is also shown (open symbols and dashed lines). As expected (cf. Figure 7A),
little AGE is
formed prior to removal (or dilution) of ribose, so that ELISA readings after
the 5 day
secondary incubation periods are mostly a measure of AGE formed after ribose
removal.
The results in Figure 9 show that the rate of buildup of intermediate in 0.5 M
ribose is
exponential and very fast, with a half time of about 3.3 h. This is about 3-
fold more rapid
than the observed rate of conversion of the intermediate to antigenic AGEs
after
interruption (open symbols and dashed curve Figure 7A).
In these experiments the removal of ribose at each interruption time was
achieved
by 100-fold dilution, and not by dialysis. Simple dilution reduced the
concentration of
ribose from 0.05 M to 0.005 M. It was independently determined (Figure 6A)
that little
AGE is produced in this time scale with the residual 5 mM ribose. This
dilution approach
was primarily dictated by the need for quantitative point-to-point accuracy.
Such accuracy
would not have been achieved by the dialysis procedure that would be carried
out
27
CA 02347117 2001-04-19
WO 00/23063 PCTNS99/24611
independently for each sample at each interruption point. Our results show
that dilution
was equivalent to dialysis.
A separate control experiment (see Figure 10 below) demonstrated that the
instantaneous 100-fold dilution gave nearly identical results to the dialysis
procedure.
These control experiments demonstrate that the reversible ribose-protein
binding (Schiff
base) equilibrium is quite rapid on this time scale. This is consistent with
data of Bunn and
Higgins (1981, Science 213: 222-224) that indicated that the half time of
Schiff base
formation with 0.5 M ribose should be on the order of a few minutes. The 100-
fold rapid
dilution method to reduce ribose is a valid method where quantitative accuracy
is essential
and cannot be achieved by multiple dialysis of many samples.
Direct Inhibition of Post-Amadori AGE Formation from the Intermediate by
Ribose and
Glucose
The increase in the rate of AGE formation after interruption and sugar
dilution
suggests, but does not prove, that high concentrations of ribose are
inhibiting the reaction
at or beyond the first "stable" intermediate, presumably the Amadori
derivative (boxed in
Scheme I). A test of this was then carried out by studying the effect of
directly adding
ribose, on the post-Amadori reaction. RNase was first incubated for 24 h in
0.5 M ribose
in order to prepare the intermediate. Two protocols were then earned out to
measure
possible inhibition of the post-Amadori formation of antigenic AGEs by
different
concentrations of ribose. In the first experiment, the 24 h ribated sample was
simply
diluted 100-fold into solutions containing varying final concentrations of
ribose ranging
from 0.005 M to 0.505 M (Figure 10A). The rate and extent of AGE formation are
clearly
seen to be diminished by increasing ribose concentrations. Significantly, up
to the highest
concentration of 0.5 M ribose, the kinetics appear exponential and do not show
the
induction period that occurs with uninterrupted glycation (Figures 6A and 7A)
in high
ribose concentrations.
A second experiment (Figure 10B) was also conducted in which the 24 h
interrupted sample was extensively dialyzed in the cold to release free and
reversibly
3o bound ribose as well as any inhibitory products that may have formed during
the 24 h
incubation with ribose. Following this, aliquots were diluted 100-fold into
varying
concentrations of freshly made ribose, and the formation of antigenic AGE
products was
28
CA 02347117 2001-04-19
WO 00/23063 PCT/US99/24611
monitored as above. There results were nearly identical to the experiment of
Figure 10A
where the dialysis step was omitted. In both cases, the rate and extent of AGE
formation
were diminished by increasing concentrations of ribose, and the kinetics
appeared
exponential with no induction period.
s The question of whether glucose or other sugars can also inhibit the
formation of
AGES from the reactive intermediate obtained by interrupted glycation in 0.5 M
ribose
was also investigated. The effects of glucose at concentrations of 1.0-2.0 M
were tested
(data not shown). Glucose was clearly not as inhibitory as ribose. When the 24
h ribose
interrupted sample was diluted 100-fold into these glucose solutions, the
amount of
1o antigenic AGE formed was diminished by about 30%, but there was little
decrease in the
apparent rate constant. Again, the kinetics appeared exponential.
Effect of pH on Post-Amadori Kinetics of AGE Formation
'The interrupted glycation method was used to investigate the pH dependence of
the
15 post-Amadori kinetics of AGE formation from the reactive intermediate. In
these
experiments, RNase A was first reacted for 24 h with 0.5 M ribose at pH 7.5 to
generate
the reactive intermediate. The kinetics of the decay of the intermediate to
AGEs were then
measured by ELISA. Figure 11 shows that an extremely wide pH range of 5.0-9.5
was
achievable when the kinetics were measured by initial rates. A remarkable bell-
shaped
2o dependence was observed, showing that the kinetics of antigenic AGEs
formation are
decreased at both acidic and alkaline pH ranges, with an optimum near pH 8.
A single "pH jump" experiment was also carried out on the pH 5.0 sample
studied
above which had the slowest rate of antigenic AGE formation. After 12 days at
37°C in
pH 5.0 buffer, the pH was adjusted quickly to 7.5, and antigenic AGE formation
was
25 monitored by ELISA. Within experimental error, the sample showed identical
kinetics
(same first order rate constant) of AGE formation to interrupted glycation
samples that had
been studied directly at pH 7.5 (Figure 12). In this experiment, the relative
amounts of
antigenic AGE could not be directly compared on the same ELISA plate, but the
pH-
jumped sample appeared to have formed substantial though somehow diminished
levels of
3o antigenic AGES. These results demonstrate that intermediate can be prepared
free of AGE
and stored at pH 5 for later studies of conversion to AGEs.
29
CA 02347117 2001-04-19
WO 00/23063 PCT/US99/24611
Inhibition of Post-Amadori AGE formation by Aminoguanidine
The efficacy of aminoguanidine was tested by this interrupted glycation
method,
i.e., by testing its effect on post-Amadori formation of antigenic AGEs after
removal of
excess and reversibly bound ribose. Figure 20A demonstrates that
aminoguanidine has
modest effects on blocking the formation of antigenic AGEs in RNase under
these
conditions, with little inhibition below 50 mM. Approximately 50% inhibition
is achieved
only at or above 100-250 mM. Note again that in these experiments, the protein
was
exposed to aminoguanidine only after interruption and removal of free and
reversibly
bound ribose. Comparable results were also obtained with the interrupted
glycation of
1o BSA (Figure 20B).
Amino acid analysis of Interrupted Glycation Samples
Amino acid analysis was carried out on RNase after 24 h contact with 0.5 M
ribose
(undialyzed), after extensive dialysis of the 24 h glycated sample, and after
5 days of
incubation of the latter sample at 37°C. These determinations were made
after sodium
cyanoborohydride reduction, which reduces Schiff base present on lysines or
the terminal
amino group. All three samples, normalized to alanine ( 12 residues), showed
the same
residual lysine content (4.0 ~ 0.5 out of the original 10 in RNase). This
indicates that after
24 h contact with 0.5 M ribose, most of the formed Schiff base adducts had
been
2o converted to Amadori or subsequent products. No arginine or histidine
residues were lost
by modification.
Discussion
The use of rapidly reacting ribose and the discovery of its reversible
inhibition of
post-Amadori steps have permitted the dissection and determination of the
kinetics of
different steps of protein glycation in RNase. Most previous kinetic studies
of protein
"glycation" have actually been restricted to the "early" steps of Schiff base
formation and
subsequent Amadori rearrangement. Some kinetic studies have been carried out
starting
with synthesized fructosylamines, i.e. small model Amadori compounds of
glucose (Smith
3o and T'hornalley, 1992, Eur. J. Biochem. 210:729-739, and references cited
therein), but
such studies, with few exceptions, have hitherto not been possible with
proteins. One
notable exception is the demonstration by Monnier (Odetti et al., 1992, supra)
that BSA
CA 02347117 2001-04-19
WO 00/23063 PCTNS99/24611
partially glycated with ribose can rapidly produce pentosidine after ribose
removal. The
greater reactivity of ribose has also proven a distinct advantage in
quantitatively defining
the time course of AGE formation. It is noted that glucose and ribose are both
capable of
producing similar AGE products, such as pentosidine (Grandhee & Monnier, 1991,
supra;
Dyer et al. 1991, supra), and some 13C NMR model compound work has been done
with
ADP-ribose (Cervantes-Laurean et al., 1993, Biochemistry 32:1528-1534). The
present
work shows that antigenic AGE products of ribose fully cross-react with anti-
AGE
antibodies directed against glucose-modified proteins, suggesting that ribose
and glucose
produce similar antigenic AGEs. The primary kinetic differences observed
between these
two sugars are probably due to relative differences in the rate constants of
steps leading to
post-Amadori AGE formation, rather than in the mechanism.
The results presented reveal a marked and paradoxical inhibition of overall
AGE
formation by high concentrations of ribose (Figure 6) that has not been
anticipated by
earlier studies. This inhibition is rapidly reversible in the sense that it is
removed by
dialysis of initially modified protein (Figure 7A) or by simple 100-fold
dilution (as used in
Figure 11 ). The experiments of Figure 10 demonstrate that it is not due to
the
accumulation of dialyzable inhibitory intermediates during the initial
glycation, since
dialysis of 24 h modified protein followed by addition of different
concentrations of fresh
ribose induces the same inhibition. The data of Figure lOA,B show that the
inhibition
occurs by reversible and rapid interaction of ribose with protein intermediate
containing
reactive Amadori products. The inhibition is unlikely to apply to the early
step of
formation of Amadori product due to the rapid rate of formation of the
presumed Amadori
intermediate that was determined in the experiment of Figure 9. The
identification of the
reactive intermediate as an Amadori product is well supported by the amino
acid analysis
carried out (after sodium cyanoborohydrate reduction) before and after
dialysis at the 24 h
interruption point. The unchanged residual lysine content indicates that any
dischageable
Schiff bases have already been irreversibly converted (presumably by Amadori
rearrangement) by the 24 h time.
The secondary ribose suppression of "late" but not "early" glycation steps
3o significantly enhances the accumulation of a filly-competent reactive
Amadori
intermediate containing little AGE. Its isolation by the interruption
procedure is of
importance for kinetic and structural studies, since it allows one to make
studies in the
31
CA 02347117 2001-04-19
WO 00/23063 PCT/US99/24611
absence of free or Schiff base bound sugar and their attendant reactions and
complications.
For example, the post-Amadori conversion rates to antigenic AGE and
pentosidine AGE
products have been measured (Figure 7A, open symbols, and Figure 8B), and
demonstrated to be much faster (t 1/2 ~ 10 h) than reflected in the overall
kinetics under
s uninterrupted conditions (Figure 6A and Figure 8A). The rapid formation of
pentosidine
that was measured appears consistent with an earlier interrupted ribose
experiment on
BSA by Odetti et al. (1992, supra). Since ribose and derivatives such as ADP-
ribose are
normal metabolites, the very high rates of AGE formation seen here suggest
that they
should be considered more seriously as sources of potential glycation in
various cellular
1o compartments (Cervantes-Laurean et al., 1993, supra), even though their
concentrations
are well below those of the less reactive glucose.
Another new application of the isolation of intermediate is in studying the pH
dependence of this complex reaction. The unusual bell-shaped pH profile seen
for the
post-Amadori AGE formation {Figure 11) is in striking contrast to the mild pH
15 dependence of the overall reaction. The latter kinetics reflect a composite
effect of pH on
all steps in the reaction, including Schiff base and Amadori product
formation, each of
which may have a unique pH dependence. This complexity is especially well
illustrated by
studies of hemoglobin glycation (Lowery et al., 1985, J. Biol. Chem. 260:11611-
11618).
The bell-shaped pH profile suggests, but does not prove, the involvement of
two ionizing
2o groups. If true, the data may imply the participation of a second amino
group, such as from
a neighboring lysine, in the formation of dominant antigenic AGES. The
observed pH
profile and the pH jump observations described suggest that a useful route to
isolating and
maintaining the reactive intermediate would be by the rapid lowering of the pH
to near 5.0
after 24 h interruption.
25 The kinetic studies provide new insights into the mechanisms of action of
aminoguanidine (guanylhydrazine), an AGE inhibitor proposed by Cerami and co-
workers
to combine with Amadori intermediates (Brownlee et al., 1986, supra). This
proposed
pharmacological agent is now in Phase III clinical trials for possible
therapeutic effects in
treating diabetes (Vlassara et al., 1994, supra). However, its mechanism of
AGE inhibition
3o is likely to be quite complex, since it is multifunctional. As a
nucelophilic hydrazine, it
can reversibly add to active carbonyls, including aldehydo carbonyls of open-
chain
glucose and ribose (Khatami et al., 1988, Life Sci. 43:1725-1731; Hirsch et
al., 1995,
32
CA 02347117 2001-04-19
WO 00/23063 PCT/US99/24611
Carbohyd. Res. 267:17-25), as well as keto carbonyls of Amadori compounds. It
is also a
guanidinium compound that can scavange highly reactive dicarbonyl glycation
intermediates such as glyoxal and glucosones (Chen & Cerami, 1993, J.
Carbohyd. Chem.
12:731-742; Hirsch et al., 1992, Carbohyd. Res. 232:125-130; Ou & Wolff, 1993,
Biochem. Pharmacol. 46:1139-1144). The interrupted glycation method allowed
examination of aminoguanidine efficacy on only post-Amadori steps of AGE
formation.
Equally important, it allowed studies in the absence of free sugar or
dicarbonyi-reactive
fragments from free sugar (Wolff & Dean, 1987, Biochem. J. 245:243-250; Wells-
Knecht
et al., 1995, Biochemistry 34:3702-3709) that can combine with aminoguanidine.
The
results of Figure 20 demonstrate that aminoguanidine has, at best, only a
modest effect on
post-Amadori AGE formation reactions, achieving 50% inhibition at
concentrations above
100-250 mM. The efficacy of aminoguanidine thus predominantly arises either
from
inhibiting early steps of glycation (Schiff base formation) or from scavenging
highly
reactive dicarbonyls generated during glycation. Contrary to the original
claims, it does
not appear to inhibit AGE formation by complexing the Amadori intermediate.
The use of interrupted glycation is not limited for kinetic studies.
Interrupted
glycation can simplify structural studies of glycated proteins and identifying
unknown
AGES using techniques such as 13C NMR that has been used to detect Amadori
adducts of
RNase (Neglia et al., 1983, J. Biol. Chem. 258:14279-14283; 1985, J. Biol.
Chem.
260:5406-5410). The combined use of structural and kinetic approaches should
also be of
special interest. For example, although the identity of the dominant antigenic
AGEs
reacting with the polyclonal antibodies remains uncertain, candidate AGEs,
such as the
recently proposed (carboxymethyl)lysine (Reddy et al., 1995, Biochemistry
34:10872-
10878; cf. Makita et al., 1992, J. Biol. Chem. 267:5133-S 138) should display
the same
kinetics of formation from the reactive intermediate that we have observed.
The
availability of the interrupted kinetics approach will also help to determine
the importance
of the Amadori pathway to the formation of this AGE. Similarly, monitoring of
the
interrupted glycation reaction by techniques such as 13C NMR should identify
resonances
of other candidate antigenic AGEs as being those displaying similar kinetics
of
3o appearance. Table I lists the 13C NMR peaks of the Amadori intermediate of
RNase
prepared by reaction with C-2 enriched ribose. The downfield peak near 205 ppm
is
probably due to the carbonyl of the Amadori product. In all cases, the ability
to remove
33
CA 02347117 2001-04-19
WO 00/23063 PCT/US99/24611
excess free and Schiff base sugars through interrupted glycation will
considerably simplify
isolation, identification, and structural characterization.
Table I lists the peaks that were assigned to the Post-Amadori Intermediate
due to
their invariant or decreasing intensity with time. Peak positions are listed
in ppm
downfield from TMS.
Table I 125MHz C-13 NMR Resonances of Ribonuclease Amadori Intermediate
Prepared by 24 HR Reaction with 99% [2-C13]Ribose
216.5 ppm 108.5 ppm
211.7 105.9
208 103.9
103
172 95.8
165
163.9 73.65
162.1 70.2
69.7
Ribonuclease A was reacted for 24 hr with 0.5 M ribose 99% enriched at C-2,
2o following which excess and Schiff base bound ribose was removed by
extensive dialysis
in the cold. The sample was then warmed back to 37°C immediately before
taking a 2 hr
NMR scan. The signals from RNase reacted with natural abundance ribose under
identical
conditions were then subtracted from the NMR spectrum. Thus all peaks shown
are due to
enriched C-13 that originated at the C-2 position. Some of the peaks arise
from
2s degradation products of the intermediate, and these can be identified by
the increase in the
peak intensity over time. Figure 3 i shows the NMR spectrum obtained.
Example 3
In Vitro Inhibition of the Formation of Antigenic Advanced Glycation End-
Products
30 (AGEs) by Derivatives of Vitamins Bl and B~ and Aminoguanidine. Inhibition
of
Post-Amadori Kinetics Differs from that of Overall Glycation
The interrupted glycation method for following post-Amadori kinetics of AGE
formation allows for the rapid quantitative study of "late" stages of the
glycation reaction.
Importantly, this method allows for inhibition studies that are free of
pathways of AGE
34
CA 02347117 2001-04-19
WO 00/23063 PCT/US99/24611
formation which arise from glycoxidative products of free sugar or Schiff base
(Namiki
pathway) as illustrated in Scheme I. Thus the interrupted glycation method
allows for the
rapid and unique identification and characterization of inhibitors of "late"
stages of
glycation which lead to antigenic AGE formation.
Among the vitamin B 1 and B( derivatives examined, pyridoxamine and thiamine
pyrophosphate are unique inhibitors of the post-Amadori pathway of AGE
formation.
Importantly, it was found that efficacy of inhibition of overall glycation of
protein, in the
presence of high concentrations of sugar, is not predictive of the ability to
inhibit the post-
Amadori steps of AGE formation where free sugar is removed. Thus while
pyridoxamine,
to thiamine pyrophosphate and aminoguanidine are potent inhibitors of AGE
formation in the
overall glycation of protein by glucose, aminoguanidine differs from the other
two in that
it is not an effective inhibitor of post-Amadori AGE formation. Aminoguanidine
markedly
slows the initial rate of AGE formation by ribose under uninterrupted
conditions, but has
no effect on the final levels of antigenic AGES produced. Examination of
different
proteins (RNase, BSA and hemoglobin), confirmed that the inhibition results
are generally
non-specific as to the protein used, even though there are individual
variations in the rates
of AGE formation and inhibition.
Chemicals and Materials As in Example 1 above.
Preparation of polyclonal antibodies to AGES
As in Example 1 above.
ELISA detection of AGE products As in Example 1 above.
Uninterrupted ribose glycation assays Bovine serum albumin, ribonuclease A,
and
human hemoglobin were incubated with ribose at 37°C in 0.4 M sodium
phosphate buffer
of pH 7.5 containing 0.02% sodium azide. The protein (10 mg/ml or 1 mg/ml),
0.05 M
ribose, and prospective inhibitors (at 0.5, 3, 15 and SO mM) were introduced
into the
incubation mixture simultaneously. Solutions were kept in the dark in capped
tubes.
Aliquots were taken and immediately frozen until analyzed by ELISA at the
conclusion of
the reaction. The incubations were for 3 weeks (Hb) or b weeks (RNase, BSA).
Glycation
reactions were monitored for constant pH throughout the duration of the
experiments.
CA 02347117 2001-04-19
WO 00/23063 PCT/US99/24611
Interrupted (post-Amadori) ribose glycation assays
Glycation was first carried out by incubating protein ( 10 mg/ml) with 0.5 M
ribose
at 37°C in 0.4 M phosphate buffer at pH 7.5 containing 0.2% sodium
azide for 24 h in the
absence of inhibitors. Glycation was then interrupted to remove excess and
reversibly
bound (Schiff base) sugar by extensive dialysis against frequent cold buffer
changes at
4°C. The glycated intermediate samples containing maximal amount of
Amadori product
and little AGE (depending on protein) were then quickly warmed to 37°C
without re-
addition of ribose. This initiated conversion of Amadori intermediates to AGE
products in
to the absence or presence of various concentrations (typically 3, 15 and 50
mM) of
prospective inhibitors. Aliquots were taken and frozen at various intervals
for later
analysis. The solutions were kept in capped tubes and opened only to remove
timed
aliquots that were immediately frozen for later carrying out the various
analyses.
Numerical Analysis of kinetics data Kinetics data (time progress curves) was
routinely fit to mono- or bi-exponential functions using non-linear least
squares methods
utilizing either SCIENTIST 2.0 {MicroMath, Inc.) or ORIGIN (Microcal, Inc.)
software
that permit user-defined functions and control of parameters to iterate on.
Standard
deviations of the parameters of the fitted functions (initial and final
ordinate values and
2o rate constants) were returned as measures of the precision of the fits.
Apparent half times
for bi-exponential kinetics fits were determined with the "solve" function of
MathCad
software (MathSoft, Inc.).
RESULTS
Inhibition by vitamin B6 derivatives of the overall kinetics of AGE formation
from Ribose.
The inhibitory effects of vitamin B 1 and B6 derivatives on the kinetics of
antigenic
AGE formation were evaluated by polyclonal antibodies specific for AGEs.
Initial
inhibition studies were corned out on the glycation of bovine ribonuclease A
(RNase) in
the continuous presence of 0.05 M ribose, which is the concentration of ribose
where the
3o rate of AGE formation is near maximal. Figure 13 (control curves, filled
rectangles)
demonstrates that the formation of antigenic AGEs on RNase when incubated with
0.05 M
ribose is relatively rapid, with a half time of approximately 6 days under
these conditions.
36
CA 02347117 2001-04-19
WO 00/23063 PCT/US99/24611
Pyridoxal-5'-phosphate (Figure 13B) and pyridoxal (Figure 13C) significantly
inhibited
the rate of AGE formation on RNase at concentrations of 50 mM and 1 S mM.
Surprisingly, pyridoxine, the alcohol form of vitamin B6, also moderately
inhibited AGE
formation on RNase (Figure 13D). Of the B6 derivatives examined, pyridoxamine
at 50
mM was the best inhibitor of the "final" levels of AGE formed on RNase over
the 6-week
time period monitored (Figure 13A).
Inhibition by vitamin BI derivatives of the overall kinetics of AGE formation
from Ribose.
All of the B 1 vitamers inhibited antigenic AGE formation on RNase at high
1o concentrations, but the inhibition appeared more complex than for the B6
derivatives
(Figure 14A-C). In the case of thiamine pyrophosphate as the inhibitor (Figure
14A), both
the rate of AGE formation and the final levels of AGE produced at the plateau
appeared
diminished. In the case of thiamine phosphate as the inhibitor (Figure 14B),
and thiamine
(Figure 14C), there appeared to be little effect on the rate of AGE formation,
but a
substantial decrease in the final level of AGE formed in the presence of the
highest
concentration of inhibitor. In general, thiamine pyrophosphate demonstrated
greater
inhibition than the other two compounds, at the lower concentrations examined.
Inhibition by aminoguanidine of the overall kinetics ofAGEformation from
Ribose
2o Inhibition of AGE formation by aminoguanidine (Figure 14D) was distinctly
different from that seen in the B 1 and B6 experiments. Increasing
concentration of
aminoguanidine decreased the rate of AGE formation on RNase, but did not
reduce the
final level of AGE formed. The final level of AGE formed after the 6-weeks was
nearly
identical to that of the control for all tested concentrations of
aminoguanidine.
Inhibition of the overall kinetics of AGE formation in serum albumin and
hemoglobin from
Ribose
Comparative studies were carried out with BSA and human methemoglobin (Hb)
to determine whether the observed inhibition was protein-specific. The
different
3o derivatives of vitamin B6 (Figure 15A-D) and vitamin B 1 (Figure 16A-C)
exhibited
similar inhibition trends when incubated with BSA as with RNase, pyridoxamine
and
thiamine pyrophosphate being the most effective inhibitors or each family.
Pyridoxine
37
CA 02347117 2001-04-19
WO 00/23063 PCTNS99/24611
failed to inhibit AGE formation on BSA (Figure 15D). Pyridoxal phosphate and
pyridoxal
(Figure 15B-C) mostly inhibited the rate of AGE formation, but not the final
levels of
AGE formed. Pyridoxamine (Figure 15A) exhibited some inhibition at lower
concentrations, and at the highest concentration tested appeared to inhibit
the final levels
of AGE formed more effectively than any of the other B6 derivatives. In the
case of B 1
derivatives, the overall extent of inhibition of AGE formation with BSA
(Figure 16A-C),
was less than that observed with RNase (Figure 14A-C). Higher concentrations
of
thiamine and thiamine pyrophosphate inhibited the final levels of AGEs formed,
without
greatly affecting the rate of AGE formation (Figure 16C). Aminoguanidine again
1o displayed the same inhibition effects with BSA as seen with RNase (Figure
16D),
appearing to slow the rate of AGE formation without significantly affecting
the final levels
of AGE formed.
The kinetics of AGE formation was also examined using Hb in the presence of
the
B6 and B 1 vitamin derivatives, and aminoguanidine. The apparent absolute
rates of AGE
formation were significantly higher with Hb than with either RNase or BSA.
However, the
tested inhibitors showed essentially similar behavior. The effects of the
vitamin B6
derivatives are shown in Figure 17. Pyridoxamine showed the greatest
inhibition at
concentrations of 3 mM and above (Figure 17A), and was most effective when
compared
to pyridoxal phosphate (Figure 17B), pyridoxal (Figure 17C), and pyridoxine
(Figure
17D). In the case of the B 1 vitamin derivatives (data not shown), the
inhibitory effects
were more similar to the BSA inhibition trends than to RNase. The inhibition
was only
modest at the highest concentrations tested (50 mM), being nearly 30-50% for
all three B 1
derivatives. The primary manifestation of inhibition was in the reduction of
the final levels
of AGE formed.
Inhibition by vitamin B6 derivatives of the kinetics of post-Amadori ribose
AGE formation
Using the interrupted glycation model to assay for inhibition of the "late"
post-
Amadori AGE formation, kinetics were examined by incubating isolated Amadori
3o intermediates of either RNase or BSA at 37°C in the absence of free
or reversibly bound
ribose. Ribose sugar that was initially used to prepaxe the intermediates was
removed by
cold dialysis after an initial glycation reaction period of 24 h. After AGE
formation is
38
CA 02347117 2001-04-19
WO 00/23063 PCT/US99/24611
allowed to resume, formation of AGE is quite rapid (half times of about 10 h)
in the
absence of any inhibitors. Figure 18 shows the effects of pyridoxamine (Figure
18A),
pyridoxal phosphate (Figure 18B), and pyridoxal (Figure 18C) on the post-
Amadori
kinetics of BSA. Pyridoxine did not produce any inhibition (data not shown).
Similar
experiments were carried out on RNase. Pyridoxamine caused nearly complete
inhibition
of AGE formation with RNase at 15 mM and 50 mM (Figure 18D). Pyridoxal did not
show any significant inhibition at 1 S mM (the highest tested), but pyridoxal
phosphate
showed significant inhibition at 15 mM. Pyridoxal phosphate is known to be
able to
affinity label the active site of RNase (Raetz and Auld, 1972, Biochemistry
11:2229-2236).
With BSA, unlike RNase, a significant amount of antigenic AGE formed during
the 24 h initial incubation with RNase (25-30%), as evidenced by the higher
ELISA
readings after removal of ribose at time zero for Figures 18A-C. For both BSA
and RNase,
the inhibition, when seen, appears to manifest as a decrease in the final
levels of AGE
formed rather than as a decrease in the rate of formation of AGE.
Inhibition by vitamin Bl derivatives of the kinetics of post-Amadori ribose
AGE formation
Thiamine pyrophosphate inhibited AGE formation more effectively than the other
B1 derivatives with both RNase and BSA (Figure 19). Thiamine showed no effect,
while
thiamine phosphate showed some intermediate effect. As with the B6 assays, the
post
Amadori inhibition was most apparently manifested as a decrease in the final
levels of
AGE formed.
Effects of aminoguanidine ahd Na acetyl L-lysine on the kinetics of post-
Amadori ribose
AGE formation
Figure 20 shows the results of testing aminoguanidine for inhibition of post-
Amadori AGE formation kinetics with both BSA and RNase. At 50 mM, inhibition
was
about 20% in the case of BSA (Figure 20B), and less than 15% with RNase
(Figure 20A).
The possibility of inhibition by simple amino-containing functionalities was
also tested
using Na-acetyl-L-lysine (Figure 21 ), which contains only a free NE-amino
group. Na-
3o acetyl-L-lysine at up to 50 mM failed to exhibit any significant inhibition
of AGE
formation.
39
CA 02347117 2001-04-19
WO 00/23063 PCT/US99/24611
Discussion
Numerous studies have demonstrated that aminoguanidine is an apparently potent
inhibitor of many manifestations of nonenzymatic glycation (Brownlee et al.,
1986;
Brownlee, 1992,1994, 1995). The inhibitory effects of aminoguanidine on
various
s phenomena that are induced by reducing sugars are widely considered as proof
of the
involvement of glycation in many such phenomena. Aminoguanidine has recently
entered
into a second round of Phase III clinical trials for ameliorating the
complications of
diabetes thought to be caused by glycation of connective tissue proteins due
to high levels
of sugar.
1o Data from the kinetic study of uninterrupted "slow" AGE formation with
RNase
induced by glucose (Example 1 ) confirmed that aminoguanidine is an effective
inhibitor,
and further identified a number of derivatives of vitamins B 1 and B6 as
equally or slightly
more effective inhibitors. However, the inhibition by aminoguanidine
unexpectedly
appeared to diminish in effect at the later stages of the AGE formation
reaction. Due to the
is slowness of the glycation of protein with glucose, this surprising
observation could not be
fully examined. Furthermore, it has been suggested that there may be questions
about the
long-term stability of aminoguanidine (0u and Wolff, 1993, supra).
Analysis using the much more rapid glycation by ribose allowed for the entire
time-course of AGE formation to be completely observed and quantitated during
2o uninterrupted glycation of protein. The use of interrupted glycation
uniquely allowed
further isolation and examination of only post-Amadori antigenic AGE formation
in the
absence of free and reversibly bound {Schiff base) ribose. Comparison of the
data from
these two approaches with the earlier glucose glycation kinetics has provided
novel
insights into the mechanisms and effectiveness of various inhibitors. Figure
22 are bar
2s graphs which depict summarized comparative data of percent inhibition at
defined time
points using various concentrations of inhibitor. Figure 22A graphs the data
for inhibition
after interrupted glycation of RNase AGE formation in ribose. Figure 22B
graphs the data
for inhibition after interrupted glycation of BSA AGE formation by ribose.
The overall results unambiguously demonstrate that aminoguanidine slows the
rate
30 of antigenic AGE formation in the presence of sugar but has little effect
on the final
amount of post-Amadori AGE formed. Thus observations limited to only the
initial
"early" stages of AGE formation which indicate efficacy as an inhibitor may in
fact be
CA 02347117 2001-04-19
WO 00/23063 PCT/US99/24611
misleading as to the true efficacy of inhibition of post-Amadori AGE
formation. Thus the
ability to observe a full-course of reaction using ribose and interrupted
glycation gives a
more complete picture of the efficacy of inhibition of post-Amadori AGE
formation.
Example 4
Animal model & testing of in vivo effects of AGE formation/inhi6itors
Hyperglycemia can be rapidly induced (within one or two days) in rats by
administration of streptozocin (aka. streptozotocin, STZ) or alloxan. This has
become a
common model for diabetes melitus. However, these rats manifest nephropathy
only after
1o many months of hyperglycemia, and usually just prior to death from end-
stage renal
disease (ESRD). It is believed that this pathology is caused by the
irreversible glucose
chemical modification of long-lived proteins such as collagen of the basement
membrane.
STZ-diabetic rats show albuminuria very late after induction of hyperglycemia,
at about
40 weeks usually only just prior to death.
Because of the dramatic rapid effects of ribose demonstrated in vitro in the
examples above, it was undertaken to examine the effects of ribose
administration to rats,
and the possible induction of AGES by the rapid ribose glycation. From this
study, a rat
model for accelerated ribose induced pathology has been developed.
2o Effects of very short-term ribose administration in vivo
Phase I Protocol
Two groups of six rats each were given in one day either:
a. 300 mM ribose (two intraperitoneal infusions 6-8 hours apart, each 5%
of body weight as ml); or
b. 50 mM ribose (one infusion)
Rats were then kept for 4 days with no further ribose administration, at which
time
they were sacrificed and the following physiological measurements were
determined: (i)
initial and final body weight; (ii) final stage kidney weight; (iii) initial
and final tail-cuff
blood pressure; (iv) creatinine clearance per 100 g body weight.
3o Albumin filtration rates were not measured, since no rapid changes were
initially
anticipated. Past experience with STZ-diabetic rats shows that albuminuria
develops very
late (perhaps 40 weeks) after the induction of hyperglycemia and just before
animals
41
CA 02347117 2001-04-19
WO 00/23063 PCT/US99/24611
expire.
Renal Physiology Results
a. Final body weight and final single kidney weight was same for low and high
ribose treatment groups.
b. Tail-cuff blood pressure increased from 66 ~ 4 to 83 ~ 3 to rats treated
with low
ribose ( 1 x SO mM), and from 66 t 4 to 106 ~ S for rats treated with high
ribose (2 x 300
mM). These results are shown in the bar graph of Figure 23.
c. Creatinine clearance, as cc per 100 g body weight, was decreased {normal
range
1o expected about 1.0-1.2) in a dose-dependent fashion to 0.87 ~ 0.15 for the
low ribose
group, and decreased still further 30% to 0.62 t 0.13 for the high ribose
group. These
results are shown in the bar graph of Figure 24.
Phase I Conclusion
A single day's ribose treatment caused a dose-dependent hypertension and a
dose-
dependent decrease in glomerular clearance function manifest 4 days later.
These are
significant metabolic changes of diabetes seen only much later in STZ-diabetic
rats. These
phenomenon can be hypothesized to be due to ribose irreversible chemical
modification
(glycation) of protein in vivo.
Effect of exposure to higher ribose concentrations for longer time
Phase II Protocol
Groups of rats (3-6) were intraperitoneally given 0.3 M "low ribose dose" (LR)
or
1.0 M "high ribose dose" (HR) by twice-daily injections for either (i) 1 day,
(ii) a "short-
2s term" (S) of 4 days, or (iii) a "long-term" (L) of 8 days. Additionally,
these concentrations
of ribose were included in drinking water.
Renal Physiology Results
a. Tail-cuff blood pressure increased in all groups of ribose-treated rats,
confirming
3o Phase I results. (Figure 23).
b. Creatinine clearance decreased in all groups in a ribose dose-dependent and
time-dependent manner (Figure 24).
42
CA 02347117 2001-04-19
WO 00/23063 PCT/US99/24611
c. Albumin Effusion Rate (AER) increased significantly in a ribose-dependent
manner at 1-day and 4-day exposures. However, it showed some recovery at 8 day
relative
to 4 day in the high-dose group but not in the low-dose group. These results
are shown in
the bar graph of Figure 25.
d. Creatinine clearance per 100 g body weight decreased for both low- and high-
ribose groups to about the same extent in a time-dependent manner (Figure 24).
Phase II Conclusion
Exposure to ribose for as little as 4 days leads to hypertension and renal
1o dysfunction, as manifest by both decreased creatinine clearance and
increased albumin
filtration. These changes are typical of diabetes and are seen at much later
times in STZ
diabetic rats.
Intervention by two new therapeutic compounds and aminoguanidine
Phase III Protocol
Sixty rats were randomized into 9 different groups, including those exposed to
1 M
ribose for 8 days in the presence and absence of aminoguanidine, pyridoxamine,
and
thiamine pyrophosphate as follows:
Control Groins:
(i) no treatment;
(ii) high dose (250 mg/kg body weight) of pyridoxarnine ("compound-P");
(iii) high dose (250 mg/kg body weight of thiamine pyrophosphate ("compound-T"
or
"TPP"); and
(iv) low dose (25 mg/kg body weight) of aminoguanidine ("AG").
Test Groups:
(i) only 1 M ribose-saline (2 x 9 cc daily IP for 8 days);
(ii) ribose plus low dose {"LP") of pyridoxamine (25 mg/kg body weight
injected as 0.5
ml with 9 cc ribose);
(iii) ribose plus high dose ("HP") of pyridoxamine (250 mglkg body weight
injected as 0.5
3o ml with 9 cc ribose);
(iv) ribose plus high dose ("HT") of thiamine pyrophosphate (250 mglkg body
weight
injected as 0.5 ml with 9 cc ribose); and
43
CA 02347117 2001-04-19
WO 00/23063 PCTNS99/24611
(v) ribose plus low dose of amino guanidine (25 mg/kg body weight injected as
0.5 ml
with 9 cc ribose).
Unlike Phase II, no ribose was administered in drinking water. Intervention
compounds were pre-administered for one day prior to introducing them with
ribose.
s
Renal physiology Results
a. Blood pressure was very slightly increased by the three compounds alone
(control group); ribose-elevated BP was not ameliorated by the co-
administration of
compounds. These results are shown in the bar graph of Figure 26.
1o b. Creatinine clearance in controls was unchanged, except for TPP which
diminished it.
c. Creatinine clearance was normalized when ribose was co-administerd with low
dose (25 mg/kg) of either aminoguanidine or pyridoxamine. These results are
shown in the
bar graph of Figure 27.
15 d. High concentrations (250 mg/kg) or pyridoxamine and TPP showed only
partial
protection against the ribose-induced decrease in creatinine clearance (Figure
27).
e. Albumin effusion rate (AER) was elevated by ribose, as well as by high dose
of
pyridoxamine and TPP, and low dose of aminoguanidine in the absence of ribose.
These
results are shown in the bar graph of Figure 28.
2o f. Albumin effusion rate was restored to normal by the co-administration of
low
dose of both aminoguanidine and pyridoxamine. These results are shown in the
bar graph
of Figure 29.
Phase III Conclusions
2s As measured by two indicies of renal function, pyridoxamine and
aminoguanidine,
both at 25 mg/kg, were apparently effective, and equally so, in preventing the
ribose-
induced decrease in creatinine clearance and ribose-induced mild increase in
albuminuria.
(i) Thiamine pyrophosphate was not tested at 25 mg/kg; (ii) thiamine
pyrophosphate and pyridoxamine at 250 mg/kg were partially effective in
preventing
3o creatinine clearance decreases but possibly not in preventing mild
proteinuria; (iii) at these
very high concentrations and in the absence of ribose, thiamine pyrophosphate
alone
produced a decrease in creatinine clearance, and both produced mild increases
in
44
CA 02347117 2001-04-19
WO 00/23063 PCT/US99/24611
albuminuria.
Summary
Renal Function and Diabetes
Persistent hyperglycemia in diabetes mellitus leads to diabetic nephropathy in
perhaps one third of human patients. Clinically, diabetic nephropathy is
defined by the
presence of:
1. decrease in renal function (impaired glomerular. clearance)
2. an increase in urinary protein (impaired filtration)
l0 3. the simultaneous presence of hypertension
Renal function depends on blood flow (not measured) and the glomerular
clearance, which can be measured by either inulin clearance (not measured) or
creatinine
clearance. Glomerular permeability is measured by albumin filtration rate, but
this
parameter is quite variable. It is also a log-distribution function: a hundred-
fold increase in
albumin excretion represents only a two-fold decrease in filtration capacity.
Ribose Diabetic Rat Moded
By the above criteria, ribose appears to very rapidly induce manifestations of
diabetic nephropathy, as reflected in hypertension, creatinine clearance and
albuminuria,
even though the latter is not large. In the established STZ diabetic rat,
hyperglycemia is
rapidly established in 1-2 days, but clinical manifestations of diabetic
nephropathy arise
very late, perhaps as much as 40 weeks for albuminuria. In general,
albuminuria is highly
variable from day to day and from animal to animal, although unlike humans,
most STZ
rats do eventually develop nephropathy.
Intervention by Compounds
Using the ribose-treated animals, pyridoxamine at 25 mg/kg body weight appears
to effectively prevent two of the three manifestations usually attributed to
diabetes, namely
the impairment of creatinine clearance and albumin filtration. It did so as
effectively as
3o aminoguanidine. The effectiveness of thiamine pyrophosphate was not
manifest, but it
should be emphasized that this may be due to its use at elevated
concentrations of 250
mg/kg body weight. Pyridoxamine would have appeared much less effective if
only the
CA 02347117 2001-04-19
WO 00/23063 PCT/US99/24611
results at 250 mg/kg body weight are considered.
Effect of Compounds Alone
Overall, the rats appeared to tolerate the compounds well. Kidney weights were
not
remarkable and little hypertension developed. The physiolagical effects of the
compounds
were only tested at 250 mg/kg. Thiamine pyrophosphate, but not pyridoxamine,
appeared
to decrease creatinine clearance at this concentration. Both appeared to
slightly increase
albuminuria, but these measurements were perhaps the least reliable.
Human Administration
A typical adult human being of average size weighs between 66 - 77 Kg.
Typically, diabetic patients may tend to be overweight and can be over 112 Kg.
The
Recommended dietary allowances for an adult male of between 66 - 77 Kg, as
revised in
1989, called for 1.5 mg per day of thiamine, and 2.0 mg per day of Vitamin B6
(Merck
Manual of Diagnosis and Therapy, 16th edition (Merck & Co., Rathaway, N.J.,
1992) pp
938-939).
Based upon the rat model approach, a range of doses for administration of
pyridoxamine or thiamine pyrophosphate that is predicted to be effective for
inhibiting
post-Amadori AGE formation and thus inhibiting related pathologies would fall
in the
2o range of 1 mg/100 g body weight to 200 mg/100 g body weight. The
appropriate range
when co-administered with aminoguanidine will be similar. Calculated for an
average
adult of 75 Kg, the range (at 10 rng/1 Kg body weight) can be approximately
750 mg to
upwards of 150 g (at 2 g/1 Kg body weight). This will naturally vary according
to the
particular patient.
Example 5
3o In Vivo Inhibition of the Formation of Advanced Glycation End-Products
(AGES) by
Derivatives of Vitamins B1 and B6 and Aminoguanidine. Inhibition of diabetic
nephropathy.
The interrupted glycation method, as described in the examples above, allows
for
46
CA 02347117 2004-08-16
the rapid generation of stable well-defined protein Amadori interinediates
from ribose and
other pentose sugars for use in in vivo studies.
The effects of 25 mg/kg/day pyridoxamine (PM) and arninoguanidine (AG) on
renal pathology induced by injecting Sprague-Dawley rats daily with 50
mg/kg/day of
ribose-glycated Amadori-rat serum albumin (RSA), AGE-RSA, and unmodified RSA
for
6 weeks. Hyperfiltration (increased creatinine clearance) was transiently seen
with rats
receiving Amadori-RSA and AGE-RSA, regardless o f the presence of PM and AG.
Individuals from each group receiving Amadori-RSA and AGE-RSA exhibited
microalbuminuria, but none was seen if PM was co-administered. Immunostaining
with
l0 anti-RSA revealed glomerular staining in rats treated with AGE-RSA and with
Amadori
RSA; and this staining was decreased by treatment with PM but not by AG
treatment. A
decrease in glomerular sulfated glycosaminoglycans (Alcian blue pH 1.0 stain)
was also
found in rats treated with glycated (Amadori and AGE) RSA. This appears to be
due to
reduced heparan sulfate proteoglycans (HSPG), as evidenced by diminished
staining with
mAb JM-403 that is specific for HSPG side-chain. These HSPG changes were
ameliorated
by treatment with PM, but not by AG treatment.
Thus we conclude that pyridoxamine can prevent both diabetio-like glomerular
loss of heparan sulfate and glomerular deposition of glycated albumin in SD
rats
chronically treated with ribose-glycated albumin.
Materials and methods
Chemicals
Rat serum albumin (RSA) (fraction V, essentially fatty acid-free 0.005%;
A2018),
D-ribose, pyridoxamine, and goat alkaline phosphatase-conjugated anti-rabbit
IgG were all
from Sigma Chemicals. Aminoguanidine hydrochloride was purchased from Aldrich
Chemicals.
Preparation of ribated RSA
Rat serum albumin was passed down an Affi-Gel Blue column (Bio-Rad), a heparin
Sepharose MCL-6B column (Pharmacia) and an endotoxin-binding affinity column
(Detoxigel, Pierce Scientific) to remove any possible contaminants. The
purified rat serum
albumin (RSA) was then dialyzed in 0.2 M phosphate buffer (pH 7.5). A portion
of the
47
CA 02347117 2001-04-19
WO 00/23063 PCTNS99/24611
RSA (20 mg/ml) was then incubated with 0.5 M ribose for 12 hours at
37°C in the dark.
After the 12 hour incubation the reaction mixture was dialyzed in cold 0.2 M
sodium
phosphate buffer over a 36 hour period at 4°C (this dialysis removes
not only the free
ribose, but also the Schiff base intermediaries). At this stage of the
glycation process, the
ribated protein is classified as Amadori-RSA and is negative for antigenic
AGES, as
determined by antibodies reactive with AGE protein (as described previously;
8618,
antigen:glucose modified AGE-Rnase). The ribated protein is then divided into
portions
that will be injected either as: a)Amadori-RSA, b)NaBH4-reduced Amadori-RSA,
c)AGE-
RSA.
l0 The ribated protein to be injected as Amadori-RSA is simply dialyzed
against cold
PBS at 4°C for 24 hours. A portion of the Amadori-RSA in 0.2 M sodium
phosphate is
reduced with NaBH4 to form NaBH4-reduced Amadori-RSA. Briefly, aliquots were
reduced by adding 5 uL of NaBH4 stock solution (100 mg/ml in 0.1 M NaOH) per
mg of
protein, incubated for 1 hour at 37°C, treated with HCl to discharge
excess NaBH4, and
then dialyzed extensively in cold PBS at 4°C for 36 hours. 'The AGE-RSA
was formed by
reincubating the Amadori-RSA in the absence of sugar for 3 days. The mixture
was then
dialyzed against cold PBS at 4°C for 24 hours. All solutions were
filtered (22 um filter)
sterilized and monitored for endotoxins by a limulus amoebocyte lysate assay
(E-Toxate,
Sigma Chemical) and contained <0.2 ng/ml before being frozen (-70°C)
down into
2o individual aliquots until it was time for injection.
Animal Studies
Male Sprague-Dawley rats (Sasco, 100g) were used. After a 1 week adaptation
period, rats were placed in metabolic cages to obtain a 24 hour urine specimen
for 2 days
before administration of injections. Rats were then divided into experimental
and control
groups and given tail vein injections with either saline, unmodified RSA (50
mg/kg),
Amadori-RSA (50 mg/kg), NaBH4-reduced Amadori-RSA (50 mg/kg), or AGE-RSA (50
mfg)
Rats injected with Amadori-RSA and AGE-RSA were then either left untreated, or
3o father treated by the administration of either aminoguanidine (AG; 25
mg/kg),
pyridoxamine (PM; 25 mg/kg), or a combination of AG and PM ( 10 mg/kg each)
through
the drinking water. Body weight and water intake of the rats were monitored
weekly in
48
CA 02347117 2004-08-16
order to adjust dosages. At the conclusion of the experimental study the rats
were placed
in metabolic cages to obtain 24 hour urine specimen for 2 days prior to
sacrificing the
animals.
TM
Total protein in the urine samples was determined by Bio-Rad assay. Albumin in
urine was determined by competitive ELISA using rabbit anti-rat serum albumin
(Cappell)
as primary antibody (1/2000) and goat anti-rabbit IgG (Sigma Chemical) as a
secondary
antibody (1/2000). Urine was tested with MultistiX 8 SG (Miles Laboratories)
for glucose,
ketone, specific gravity, blook, pH, protein, nitrite, and leukocytes. Nothing
remarkable
was detected other than some protein.
Creatinine measurements were performed with a Beckman creatinine analyzer II.
Blood samples were collected by heart puncture before termination and were
used in the
determination of creatinine clearance, blood glucose (glucose oxidase, Sigma
chemical),
fructosamine (nitroblue tetrazolium, Sigma chemical), and glycated Hb
(columns, Pierce
chemicals). Aorta, heart, both kidneys and the rat tail were visually
inspected and then
quickley removed a$er perfusing with saline through the right ventricle of the
heart. One
kidney, aorta, rat tail, and the lower 2/3 of the heart were snap-frozen and
then
permanently stored at -70°C. The other kidney was sectioned by removing
both ends
(cortex) to be snap-frozen, with the remaining portions of the kidney being
sectioned into
thirds with two portions being placed into neutral buffered formalin and the
remaining
third minced and placed in 2.5% glutaraldehyde/2% paraformaldehyde.
LightMicroscopy
After perfusion with saline, 'kidney sections were fixed in ice-cold 10%
neutral
buffered formalin. Paraffin-embedded tissue sections from all rat groups (n =
4 per group)
were processed for staining with Hams' alum hernatoxylin and eosin (H&E),
perodic
acid/Schiff reagent (PAS), and alcian blue (pH 1.0 and pH 2.5) stains for
histological
examination. The alcian blue sections were scored by two investigators in a
blinded
fashion.
Electron Microscopy
Tissues were fixed in 2.5% glutaraldehyde/2% paraformaldehyde (0.1 M sodium
cacodylate, pH 7.4), post-fixed for 1 hour in buffered osmium tetroxide
(1.0%), prestained
49
CA 02347117 2001-04-19
WO 00/23063 PCT/US99/24611
in 0.5% uranyl acetate for 1 hour and embedded in Effapoxy resin. Ultrathin
sections were
examined by electron microscopy.
Immunofluorescence
s Parrafin-embedded sections were deparaffinized and then blocked with 10%
goat
serum in PBS for 30 min at room temperature. The sections were then incubated
for 2 hour
at 37°C with primary antibody, either affinity purified polyclonal
rabbit anti-AGE
antibody, or a polyclonal sheep anti-rat serum albumin antibody (Cappell). The
sections
were then rinsed for 30 min with PBS and incubated with secondary antibody,
either
1o affinity purified FITC-goat anti-rabbit IgG (H+L) double stain grade
(Zyrned) or a
Rhodamine-rabbit anti-sheep IgG (whole) (Cappell) for 1 hour at 37°C.
The sections were
then rinsed for 30 min with PBS in the dark, mounted in aqueous mounting media
for
immunocytochemistry (Biomeda), and cover slipped. Sections were scored in a
blinded
fashion. Kidney sections were evaluated by the number and intensity of
glomerular
15 staining in 5 regions around the periphery of the kidney. Scores were
normalized for the
immunofluorescent score per 100 glomeruli with a scoring system of 0-3.
Preparation of Polyclonal Antibodies to AGE-Proteins
Immunogen was prepared by glycation of BSA (R479 antibodies) or Rnase (R618
2o antibodies) at 1.6 g protein in 15 ml for 60 - 90 days using 1.5 M glucose
in 0.4 M
phosphate containing 0.05% sodium azide at pH 7.4 and 37°C. New Zealand
white rabbit
males of 8-12 weeks were immunized by subcutaneous administration of a 1 ml
solution
containing 1 mg/ml of glycated protein in Freund's adjuvant. The primary
injection used
the complete adjuvant and three boosters were made at three week intervals
with Freund's
2s incomplete adjuvant. The rabbits were bled three weeks after the last
booster. The serum
was collected by centrifugation of clotted whole blood. The antibodies are AGE-
specific,
being unreactive with either native proteins or with Amadori intermediates.
ELISA Detection ofAGE Products
3o The general method of Engvall (21 ) was used to perform the ELISA. Glycated
protein samples were diluted to approximately 1.5 ug/ml in 0.1 M sodium
carbonate buffer
of pH 9.5 to 9.7. The protein was coated overnight at room temperature onto a
96-well
CA 02347117 2004-08-16
polystyrene plate by pippetting 200 u1 of protein solution into each well
(about .3 ug/well).
After coating, the excess protein was washed from the wells with a saline
solution
containing 0.05% Tweeri 20. The wells were then blocked with 200 u1 of 1%
casein in
carbonate buffer for 2 hours at 37°C followed by washing. Rabbit anti-
AGE antibodies
were diluted at a titer of 1:350 in incubation buffer and incubated for 1 hour
at 37°C,
followed by washing. In order to minimize background readings, antibody 8618
used to
detect glycated RSA was generated by immunization against glycated Rnase. An
alkaline
phosphatase-conjugated antibody to rabbit IgG was then added as the secondary
antibody
at a titer of 1:2000 and incubated for 1 hour at 37°C, followed by
washing. The p-
to nitrophenolate being monitored at 410 nm with a Dynatech MR4000 microplate
reader.
Results
The rats in this study survived the treatments and showed no outward signs of
any
gross pathology. Some of the rats showed some small weight changes and tail
scabbing.
Initial screening of kidney sections with PAS and H&E stains did not reveal
any
obvious changes, and some EM sections did not reveal any gross changes in the
glomerular basement membrane (GBM). However, upon Alcian Blue staining,
striking
differences were discovered. Alcian blue staining is directed towards
negatively charged
groups in tissues and can be made selective via changes in the pH of staining.
At pH 1.0
2o Alcian blue is selective for mucopolysaccharides, and at pH 2.5 detects
glucoronic groups.
Thus negative charges are detected depending upon the pH of the stain.
At pH 2.5 Alcian blue staining showed that Amadori-RSA (p<0.05) and AGE-
RSA (p<0.01) induced increased staining for acidic glycosaminoglycans (GAG)
over
control levels (Figure 33). For both AGE-RSA and Amadori-RSA, treatment with
pyridoxamine (PM) prevented the increase in staining (p<0.05 as compared with
controls).
In contrast, treatment with aminoguanidine (AG) or combined PM and AG at 10
mg/kg
each, did not prevent the increase.
At pH 1.0 Alcian blue staining was significantly decreased by AGE-RSA
(p<0.001) (Figure 34). However, no significant difference was seen with
Amadori-RSA.
3o Due to faint staining, treatment with PM, AG and combined could not be
quantitated.
Immunofluorescent glomerular staining for RSA showed elevated staining with
Amadori-RSA and AGE-RSA injected animals (Figure 35). Significant reduction of
this
51
CA 02347117 2001-04-19
WO 00/23063 PCT/US99/24611
effect was seen in the rats treated with PM, and not with AG or combined AG &
PM.
Immunofluorescent glomerular staining for Heparan Sulfate Proteoglycan Core
protein showed slightly reduced staining with Amadori-RSA and AGE-RSA injected
animals but were not statistically significant(Figure 36). A reduction of this
effect was
seen in the rats treated with PM, and not with AG or combined AG & PM.
However,
immunofluorescent glomerular staining for Heparan Sulfate Proteoglycan side-
chain
showed highly reduced staining with Amadori-RSA and AGE-RSA injected animals
(Figure 37) A significant reduction of this effect was seen in the rats
treated with PM, and
not with AG or combined AG & PM.
to Analysis of average glomerular volume by blinded scoring showed that
Amadori-
RSA and AGE-RSA caused significant increase in average glorneruli volume
(Figure 38).
A significant reduction of this effect was seen with treatment of the rats
with PM. No
effect was seen with treatment with AG or combined AG and PM at 10 mg/kg each.
t 5 Example 6 Inhibition of Hyperglycemia-Associated Hyperlipidemia
In an effort to inhibit the formation of AGES and the development of diabetic
nephropathy, we treated streptozotocin-induced diabetic rats with
pyridoxamine. We now
report that pyridoxamine inhibits the development of nephropathy in the
diabetic rat, as
measured by its effects on albuminuria, proteinuria and plasma creatinine;
significantly
2o corrects the dyslipidemia in diabetic rats, as measured by inhibition of
the increase in
plasma cholesterol and triglycerides; and corrects redox imbalances resulting
from either
hypoxia or pseudohypoxia, as measured by changes in the plasma lactate to
pyruvate ratio.
At comparable doses, pyridoxamine was more effective than the prototype AGE-
inhibitor
aminoguanidine in protection against diabetic nephropathy, and reversal of
dyslipidemia
25 and metabolic abnormalities of diabetes. As used herein, "diabetic mammal"
encompasses
both those mammals that are currently diabetic, and those that are glucose
intolerant
and/or have a pancreatic insufficiency, regardless of their blood sugar level.
We conclude
that AGE inhibitors both protect against diabetic nephropathy, and exert wide-
ranging
effects on lipid and carbohydrate chemistry and metabolism.
Introduction
52
CA 02347117 2001-04-19
WO 00/23063 PCT/US99/24611
The aim of this study was to assess the effect of PM and AG on the formation
of
AGES and development of nephropathy in the diabetic rat. At the end of the 30-
week
experiment, we observed that the plasma from diabetic rats was visibly more
lipemic than
that from control rats and that there appeared to be a decrease in lipemia in
both PM- and
AG-treated diabetic animals. We report that both PM and AG not only retarded
the
development of nephropathy in the STZ-diabetic rat, but also inhibited the
increase in
plasma cholesterol and triglycerides in the diabetic rats, and reversed the
increase in
plasma lactate and lactate/pyruvate ratio, an indicator of altered redox
status in diabetes.
We also discuss the origin of the increased chemical modification of collagen
in the
1o diabetic animals and the relative importance of substrate and oxidative
stress, and lipids
vs. carbohydrates, in formation of AGEs. Our results suggest that PM may be an
effective
therapeutic agent for inhibiting the development of both nephropathy and
vascular disease
in diabetes.
Materials and Methods
Unless otherwise indicated, reagents and enzymes were purchase from Sigma
Chemical Co., St. Louis.
Experimental design. These experiments were conducted in female, Sprague-
Dawley rats, made diabetic by injection of STZ. Diabetes was induced by a
single tail
vein injection of 45 mg/kg of STZ in 0.1 M sodium citrate buffer, pH 4.5.
Control animals
were sham injected with buffer only. Diabetes was confirmed by measuring blood
glucose
levels at 2 and 3 days after the STZ-injection. Animals with plasma glucose
higher than
16 mM were classified as diabetic. The diabetic rats were divided randomly
into an
untreated diabetic group (n = 12) and two diabetic treatment groups, receiving
either PM
(n = 13) or AG (n = 12) at 1 g/L in drinking water. Two non-diabetic control
groups were
included, one receiving no treatment (n = 13), the other receiving PM(HCl)2 at
2 glL in
drinking water (n = 12); the higher dose of PM in the PM-treated control group
was
designed to compensate, in part, for the lower water intake of non-diabetic,
compared to
diabetic animals. All animals were housed individually with a light dark cycle
of 12 hours
3o each, and had free access to food and water. To maintain body weight and to
Iimit
hyperglycemia, diabetic animals received 3 IU of ultralente insulin {Humulin
U, Eli Lilly)
three times per week; this was increased to 5 IU after week 15 to adjust for
the increase in
body weight.
53
CA 02347117 2001-04-19
WO 00/23063 PCT/US99/24611
Nephropathy. The progression of nephropathy was assessed by monthly
measurements of albumin and total protein in urine and of creatinine in
plasma. For
urinary measurements, rats were housed in metabolic rat cages (Nalgene, Nalge
Company,
Rochester, NY) for 24 hours. Several drops of toluene were added to the urine
collection
beaker to prevent microbial growth. All assays for proteins and metabolites in
plasma and
urine were performed by microplate adaptations of current methods, using a
Wallac Victor
Model 1420 multilabel plate reader (Wallac, Inc., Gaithersburg, MD). Control
experiments showed that neither PM nor AG, at concentrations present in plasma
or urine,
caused interference in any of the assays, except for urinary protein (see
below).
1o Urinary albumin was quantified by an ELISA assay. Rabbit antiserum to rat
albumin and horseradish peroxidase (HRP)-conjugated goat anti-rabbit IgG were
purchased from ICN Biomedical Research Products, Costa Mesa, CA. Briefly,
wells were
coated with 50 ng of rat albumin (Sigma, St. Louis) in 0.1 M sodium carbonate
buffer, pH
10.4, overnight at 4°C. In the competition step, 100 ~L of standard or
diluted urine
sample was incubated with 100 pL of the rabbit anti-rat albumin antiserum for
3 hours at
room temperature on a microplate shaker. After washing, horseradish peroxidase-
conjugated goat anti-rabbit IgG (200 ~L) was applied for 1 hour at 25°C
with shaking, and
the plate was developed with 200 ~L of ABTS-reagent (2,2'-azino-bis(3-
ethylbenzthiazoline-6-sulfonic acid) for 45 minutes at room temperature, and
absorbance
was measured at 405 nm.
Total urinary protein was measured at the end of the experiment using Sigma
Microprotein-PR Kit. Briefly, an aliquot of sample or standard was added to
the reagent
solution, containing pyrogallol-red and sodium molybdate, incubated for 3
minutes at
37°C, and absorbance measured at 570 nm. A correction (<10%) was
applied for the PM
or AG content of the sample. Plasma creatinine concentration was measured by
the Jaffe
picric acid procedure, using Sigma kit # 555-A. Briefly, 20 ~L of sample or
standard were
mixed with 200 pL of picrate solution. Absorbance at 490 nm was read before
and after
addition of the acid reagent.
Cholesterol, triglycerides free fatty acids and glycerol in plasma. Total
cholesterol
and triglycerides were measured by enzymatic, colorimetric, end-point assays
using Sigma
kits for total cholesterol (#352) and total triglycerides (#37, GPO Trinder),
including the
calibrators for both assays. Free fatty acids were measured as the organic
soluble copper
54
CA 02347117 2001-04-19
WO 00/23063 PCT/US99/24611
complexes, as described by Noma et al. ( 1973) (Noma et al. 1973. Clin. Chim.
Acta
43:317-320). Glycerol was measured by a spectrometric enzymatic assay using
glycerol
kinase and glycerol 3-phosphate dehydrogenase, as described by Bergman
(Bergman
1974. Assay of glycerol-phosphate dehydrogenase. In Methods of Enzymatic
Analysis,
Vol. 3. Bergman, H.V. Berlin: Verlag Chemie. 1404-1408).
Lactate, pyruvate and ketone bodies. Lactate, pyruvate and ~i-hydroxybutyrate
were measured spectrophotometrically, using NADH/NAD+ linked assays (Sigma
Kits
#826, 726 and 310, respectively). Acetoacetate was measured by reversal of the
(~-
hydroxybutyrate assay using acetoacetic acid lithium salt, (3-hydroxybutyrate
to dehydrogenase type II and NADH, as described by Li et al. (Li, et al. 1980.
Clin. Chem.
26:1713-1717).
Renal morphometry. One side of the right kidney was cut into 2-millimeter
thick
slices using a set of parallel razor blades. One half of the slices were
systematically
selected without bias and place in formalin. These slices were dehydrated
through a series
of alcohols and embedded in JB-4TM (Polysciences, Inc., Warnngton PA). From
each JB-
4TM block, a five-micrometer thick section was cut, stained with toluidine
blue, and used
for glomerular volume determination. From the non-selected slices, small
blocks of cortex
were fixed in 2.5% glutaraldehyde in Millonig buffer, through a series of
alcohols and
embedded in PolyBed 812~ (Polysciences, Inc., Warrington PA). In order to
select
2o glomeruli without bias, one-micrometer thick sections were cut from the
PolyBed 812~
blocks and stained with toluidine blue. The centermost glomerulus was selected
for
electron microscopy. Silver-gold sections were cut using a Reichert Ultracut E
ultramicrotome, placed on formvar coated slot grids and stained with uranyl
acetate and
lead citrate. Images were obtained using a JEOL 100CX electron microscope.
Three
glomeruli from each animal were used for measuring the electron microscopy
parameters.
For measurement of glomerular volume, an Olympus BH-2 microscope fitted with
a small mirror attached to the monocular was used to project an image onto the
bench top.
Fields from the JB-4TM sections were systematically selected without bias by
moving the
microscope stage in 2.5 mm increments. The area of all glomerular profiles
within each
3o field was measured by superimposing a grid of points over the projected
image. The
number of points hitting each glomerular profile was counted. The average
glomerular
area was calculated by the equation, Area = (~P/~G) x (5000/ 150)2 where ~P
was the
CA 02347117 2001-04-19
WO 00/23063 PCTNS99/24611
sum of points hitting glornerular profiles and ~G was the number of profiles
measured,
5000 was the distance between grid points in micrometers and 1 SO was the
magnification
of the projected images. Volume was calculated by the method of Weibel and
Gomez
(Weibel and Gomez, 1962 J. Appl. Physiol. 17:343-348) using the equation
Volume =
Area3~2 x 1.38/1.01 where 1.38 is a correction factor for spherical particles
and 1.01 is a
correction factor for the variation of volume among the glomeruli. An average
of 65
profiles was measured for glomerular volume determination. A calibration slice
was used
to confirm the magnification of the projected images was 150x.
For measurement of glomerular basement membrane (GBM) width, images were
to systematically obtained without bias using preset positions of the
microscopes stage
controls. Approximately 25 per cent of each glomerular profile was imaged at a
final
magnification of 15,000x. Glomerular basement membrane width was measured
using the
orthogonal intercept method (Jensen et al. 1979 J. Microscopy 115:19-33). An
average of
169 measurements of glomerular basement membrane was made per animal. For
measurement of the volume density of mesangium per glomerulus [Vv (Mes/Glom)],
images were obtained and joined together to form a montage of the entire
glomerular
profile at a final magnification of 3900x. A grid of coarse and fine points
was placed over
the montage. The number of fine points falling on the mesangium and the number
of
coarse points falling on the glomerulus were counted (Weibel, E.R. 1979.
Practical
Methods for Biological Morphometry, Stereological Methods, Yol. I. New York,
Academic Press. 332 pp.). Vv (Mes/Glom) = ~FP/(~CP x4) where ~FP is the number
of
fine points falling on mesangium and MCP is the number of coarse points
falling on all
three glomeruli. The grid was made such that there were 4 fine points for each
coarse
point. An average of 174 coarse points hit glomerulus and 164 fine points hit
mesangium
per animal. A calibration grid was photographed at both the high and low
magnification
for each roll of film to determine the exact magnification of each measured
image. Total
mesangial volume was calculated by multiplying glomerular volume by Vv
(Mes/Glom).
Statistical analysis. Statistical analyses were performed using Sigma Stat for
Windows V1.00 (SPSS, Inc., Chicago, IL). P-values were calculated by non-
parametric
Mann-Whitney Rank Sum analysis. Correlation analyses were performed by the
Pearson
Product Moment method.
56
CA 02347117 2001-04-19
WO 00/23063 PCTNS99/24611
Results
Progression of nephropathy. Urinary albumin and protein excretion, and plasma
creatinine concentrations were used as measures of diabetic nephropathy (Fig.
39). PM
treated non-diabetic controls were indistinguishable from untreated, non-
diabetic controls
throughout the experiment, however albuminuria increased with time in all
diabetic
groups, with untreated diabetic animals showing the greatest increases in
albuminuria. At
23 weeks of diabetes, all three diabetic groups were significantly different
from one
another, and from non-diabetic controls, with respect to albuminuria (Fig.
39A). PM
provided significantly greater protection against albuminuria than AG. As
shown in Fig.
l0 39B, plasma creatinine values also began to rise above normal at about the
17'h week. As
observed with albuminuria and proteinuria, both PM and AG also blunted the
rise in
plasma creatinine, although PM was significantly more effective than AG.
Effects on
albuminuria were mirrored by differences in proteinuria, measured at the end
of the
experiment (Fig. 39C), although albuminuria appeared to be the more sensitive
indicator
of nephropathy.
Dyslipidemia. At necropsy we observed that the blood of untreated diabetic
animals was visibly more lipemic than blood from control and PM- or AG-treated
animals.
Assays of plasma lipids (Fig. 40) documented a substantial increase in lipemia
in
untreated diabetic animals, and substantial correction of hyperlipidemia by
both PM and
2o AG. Triglycerides (Fig. 40A) increased to a mean of 700 mg/dL in diabetic
rats,
compared to 100 mg/dL in non-diabetic controls, and were reduced to means of
220 and
350 mg/dL by PM and AG, respectively. Plasma cholesterol (Fig. 40B) was
increased by
~50% and was normalized by PM and partially corrected by AG. Although the
increase in
lipemia might be attributed to decreased uptake of low density lipoprotein in
peripheral
2s tissues because of a defect in lipoprotein lipase activity in diabetes,
there was also an
indication of increased lipolysis, based on increases in both free fatty acids
and glycerol in
plasma. As shown in Figure 40C and 40D, plasma free fatty acid and glycerol
concentrations were increased by 2-3 fold in diabetic rats and were
approximately 50%
normalized by treatment with either PM or AG.
3o Redox imbalances. Alterations in lipid metabolism may result from glucose-
induced redox imbalances (pseudohypoxia) (Williamson et al. 1993, Diabetes
42:801-813)
or decreased tissue oxygenation (Mayrovitz, and Larsen, 1996. Microvasc. Res.
52:115-
57
CA 02347117 2001-04-19
WO 00/23063 PCT/US99/24611
126; Tesfaye et al. 1994. Diabetologia 37:847-854) (true hypoxia) in diabetes.
These
changes are reflected by a change in the cytosolic ratio of NADHINAD+, which
can be
assessed indirectly by measuring the ratio of lactate to pyruvate in plasma.
As shown in
Fig. 41, diabetic animals had significantly higher levels of both lactate and
pyruvate in
plasma, as well an increased lactate / pyruvate ratio. PM, and to a lesser
extent AG,
partially corrected these deficits in oxidative metabolism of carbohydrates.
We also
measured plasma (3-hydroxybutyrate and acetoacetate concentrations, sometimes
used as
an indicator of mitochondria) redox status. Concentrations of these
metabolites varied
greatly among the animals. While there were clear trends toward an increase in
(3-
l0 hydroxybutyrate and acetoacetate in diabetic animals and an indication that
both PM and
AG corrected these changes, the differences did not reach statistical
significance.
Anatomical observations. As shown in Table I, mean kidney and liver weights
were increased in diabetic rats, both in absolute terms and as a fraction of
total body mass.
These changes in tissue weight were partially reversed by PM and AG.
Occasional cysts
were observed in kidneys of diabetic animals, but were not increased in drug-
treated
groups. There was no evidence of an increase in tumors in major organs, nor of
other
unusual pathologies associated with either PM or AG therapy. Significant
changes in
renal morphology were observable within the seven months' duration of diabetes
in the
rat, including a 30% increase in glomerular basement membrane (GBM) thickness,
60%
2o increase in glomerular volume, 25% increase in mesangial volume fraction,
and 100%
increase in mesangial volume (Table 2). PM caused a significant, but partial
correction of
the increase in glomerular volume, and there was a trend toward reduction in
GBM
thickness and mesangial volume by PM. The increase in mesangial volume
fraction in
PM-treated rats might have resulted from a disproportionate decrease in
glomerular
volume in PM-treated animals. The effects of AG on these parameters were not
evaluated.
Table 1: Effects of diabetes and drug treatment on liver and kidney weight.
Group Kidney Kidney Liver Liver
(g) (g I 100g) (g) (g I 100g)
Control 0.84 0.04 0.32 0.02 7.96 0.5 3.37 t 0.22
Untreated Diabetic1.53 0.21 0.73 0.23 16.7 3.4 7.03 0.94
58
CA 02347117 2001-04-19
WO 00/23063 PCT/US99/24611
Diabetic + 1.25 0.30 0.59 f 0.05 12.8 2.1 6.00 0.
PM 59
Diabetic + 1.31 0.18 0.59 t 0.07 14.0 2.b 6.20 0.99
AG
p-value: D NS <. 0.001 = 0.0025 = 0.002
+ PM vs. D
p-value: D NS = 0.002 < 0.05 > 0.05
+ AG vs. D
Table 2. Effect of diabetes and drug treatment on renal morphometryA
GBM width GlomerularMesangial Mesangial
Volume Volume Volume
Fraction
Group
Non-diabetic201 t 14.9B1.30 0. 0.19 t 0.25 0.05B
l OB 0.03
(n = 12)
Diabetic 229 t 19.42.08 0.270.24 0.060.52 t
0.22
(n = 13)
Diabetic 225 f 25.11.68 0.080.27 0.060.46 0.12
+ PM
(n = 13)
"Glomerular basement membrane width and mesangial volume fractions were
measured by electron microscopy and glomerular and mesangial volumes
by light micrsocopy, as described in Materials and Methods.
H p < 0.001 vs. untreated diabetic animals.
~ p < 0.025 vs. untreated diabetic animals.
Relationship among biochemical parameters and AGES. Because lipids were
significantly increased in the diabetic rats and also lowered by PM and AG,
and because
lipids are recognized as sources of CML (13), CEL (14) and fluorescent
products, e.g. in
lipofuscin, and crosslink structures (except for pentosidine) in tissue
proteins, we
1 S examined the relationship between plasma lipids, diabetic nephropathy and
chemical
modification of proteins in the diabetic rat. As shown in Figure 42, there was
a strong
correlation between CML in skin collagen and plasma triglycerides, and both
CML and
59
CA 02347117 2001-04-19
WO 00/23063 PCTNS99/24611
triglycerides also correlated with microalbuminuria. Other correlations are
summarized in
Table 3. None of these measures correlated with glycemia or protein glycation,
since
these parameters were unaffected or, in the case of glycation of collagen,
only slightly
affected by drug therapy.
Table 3: Relationships among various markers of oxidative stress, lipemia and
renal
function."
CML gk;,~ Urinary Plasma Plasma Plasma
Albumin Creatinine Triglycerides Cholesterol
(n = 48) (n = 49 ) (n = 49) (n = 50) (n = 50)
' ~:'4:::~:::::.:::: ;;:.~,.; :..;::::::;: :: ~: ~>~::~ ~::::::: .:':
q;'.~'.:: itr:::: ~'~ ~ ~ i;6: ii:::'v': 5 : : .:r : i ~;.;;;i :: ;:
::~'.~:i::i:i:ii ~::~:~:r'~.~'::~:~:'.'~:~:'~:~'i'::
::.;;;::.::.:~'~i:.'~.'~i:i.'~:~i:: v ~ ~;: ~,.;~,~~ .. ~,~1::: ~'~ .<
::::;:i:viiv;i::'::i;:;:~ii:;<,~'.~,':'r,Yi/:;:::::T::~~~'.::,'i,:i'f' .I y .
.r - . :.: .:
a.~.:::i::::::,,.,;:;:.:;.,..i::::~::~:::.x~ai:ii::i:i:i;:.~~':x: ~ '. ~.::.:
. .;:: x~
~ '. v:.r: :: ~.~...:~...'::.~..r;: ::,.:.:i:'t.~.,.~.:.,::::::~'> ~ ..
,.,w:.;., . - ; ::;.~ .:
Unna < 0.0001 :..~..;>.s,,:,.;.,...,~....::::r......,:,r;.,.;:..
:.....;:<,E.~..,;,.,: . ~~x .:
ry p _ :::.::::i:i.~.:r~:::,::::::::..~:;::::::i::.::i..:::....,:r,.
~:?'~::f::;:::'.,~~;:i.'::':~.''.::'4'.';f:~.'.'.~'.~~;:~i.'~,r;:.:.,::~:::::::
:..':%';%: . .;~. '::
:::;::a::r.~'6:ii::~.:;a::~ii:.'~:o.'~:iix.::i::::::.::.'!/.E~a:....s.'.
>...Sr:. '%~.: .~.~
:.::.:::::;::::::~:::i:ii:::::i:;m;:..'~r.~.ii:i:i>:;~i::i:oi;~.~'~::::: :
:.~.~".,f,.~:r>~: :'.' r.'.:t:. ::.:
:::.:~::::::~»i:~:~:a::::::~~..;::;.:i:::;.y.::.:.::::~~:a::.:::::~.~~~.:t_rn:i
y~:::.~k~ ~r,r,:r."r...;~:.~r::~:
~ - ::::::::::~..::~..;~::::::i;:c;..i;~..>c:::::<::i:i;:~:;::o:i;..rrrr. r.
;:,..,~;, . ?~~yy;. ..::
:>...!~ H~,ø~r.5 . ,.,.r :
Albumin r - 0.54 <::<,:::~::::> ::;::::::::::::::::::;...... . . >. ..~. .' .
: . : ...... ..:
.'..'...'.'.:.'..~...'~.~.v:;:'.,:; .~.~:;:;:::~:G::~i:;.;.:;.:::;:::::;:F~..?
.a:.9::. . ~..~,. ~.,:
:::.v:.~:.v::.~:,;.;,;;.;,.,;';..'~:i~'::iin~.~.y.~~:.:.:.~.~:Y:.vrrf . u~ ~~
' :k.%!~v ::'
::.:::::::::::::::::.~:::::::::.~::y,r!:i:~:::'.'.::'.~.'r:;.~iiS~. . '~:: . .
... : r ~ yrr
:. .; ........ r .
:,;~:.vn:,~~.:::.'~i:y ~ r r
Plasma < 0.0001 0.0001 ':~:::~;r::a~::~'; r
P p < _ :; :,,<:y:.:,.:..;, :k:.
~; : ~,:. :.:. ,:;r
kE~>,,,,r~.~,.,
f; ~:::.:,;, .
~,~'.%'~,.:; .~.".~..~,:: ,
Creatinine r = 0.65 r = 0.55 -"~'~
:: ...,.c...: i..::..:: r:.. . : ' ~
r
Plasma p < 0.0001 p < 0.0001 p < 0.0001 _
Triglycerides r = 0.66 r = 0.62 r = 0.56
Plasma p = 0.001 p = 0.0001 p =- 0.0013 p ~~ 0.0001
Cholesterol r = 0.46 r = 0.82 r = 0.45 r = 0.? I
Urinary p < 0.0001 p <: 0.0001 p < 0.0001 p < 0.0001 p < 0.0001
Protein r = 0.73 r = 0.77 r = 0.61 r = 0.80 r = 0.74
(n = 29)
A
Statistics derived from Pearson Product Moment calculation.
Discussion
Effect of pyridoxamine on diabetic nephropathy. These studies were designed to
evaluate the effectiveness of PM on the formation of AGES and development of
nephropathy in STZ-diabetic rats. In the present report we show that PM
retarded the
development of nephropathy in diabetic rats, as measured by decreases in both
urinary
albumin and plasma creatinine concentrations. Proteinuria, measured at the end
of the
study, was also significantly decreased in PM-treated rats. Similar effects
were observed
CA 02347117 2001-04-19
WO 00/23063 PCT/US99/24611
for both PM and AG, although PM was significantly more effective in inhibiting
the
increases in microalbuminuria and creatininemia, and correcting the
dyslipidemia and
redox imbalances in the diabetic rats. These therapeutic effects were achieved
without
significant changes in glycemia or glycated hemoglobin in the diabetic rats.
All diabetic animals exhibited characteristic changes in renal structure,
including
renal hypertrophy (Table 1), accelerated thickening of glomerular basement
membranes
(GBM), increased glomerular volume and mesangial expansion (Table 2). Although
PM
(and AG) partially inhibited the gain in kidney weight, PM had limited effects
on the
ultrastructural changes in the kidney (Table 2). Effects of AG on renal
morphology were
1o not measured in this study, but other studies on AG treatment of the STZ-
diabetic rat have
yielded mixed results. One study reported inhibition of GBM thickening in the
Lewis rat
(Ellis and Good, 1991.Metabolism 40:1016-1019), while there are two reports
that AG had
no effect on GBM thickening in Sprague Dawley rats (Oturai et al. 1996. APMIS
104:259-264; Soulis-Liparota et al. 1991. Diabetes 40:1328-1334).
In one of the latter studies, however, AG did partially inhibit mesangial
expansion
(Soulis-Liparota et al. 1991. Diabetes 40:1328-1334). In a related report, AG
inhibited the
increase in glomerular basement membrane thickening and fractional mesangial
volume in
Otsuka Long-Evans Tokushima fatty rats, a model for type 2 diabetes ( Yamauchi
et al.
1997. Diab. Res. Clin. Pract. 34:127-133). The potent effects of AGE
inhibitors on
diabetic nephropathy, but variable effects on renal morphology, suggest that
renal
morphological changes may be driven by hyperfiltration or hypertension (not
measured) or
other aspects of renal hemodynamics that were not measured in these
experiments. Future
studies on cellular changes in the diabetic kidney, e.g. changes in podocyte
and mesangial
cell number, may provide better insight into the relationship between the
structural and
functional changes in the diabetic kidney.
Metabolic effects of AGE inhibitors. Although lipid lowering effects of AG in
diabetic humans have been reported previously {Bucala et al. 1994. Proc. Natl.
Acad. Sci.
91:9441-9445), the magnitude of the effects of PM and AG on plasma cholesterol
and
triglycerides in the STZ-diabetic rats was surprising. These changes, together
with effects
on plasma free fatty acids and glycerol, indicate that, in addition to their
AGE-inhibitory
activity, AG and PM affect central pathways of lipid metabolism. Since there
is little
61
CA 02347117 2001-04-19
WO 00/23063 PCTNS99/24611
structural resemblance between AG and PM, it is unlikely that the effects of
PM are
derived from its conversion to pyridoxal phosphate or other B6 vitamers.
Hyperglycemia is known to induce shifts in intracellular ratios of redox
coenzymes, both in vitro and in vivo, leading to a state of pseudohypoxia
(Williamson et
al. 1993. Diabetes 42:801-813). The magnitude of the increase in plasma
lactate and the
lactate:pyruvate ratio in the diabetic rats suggests a redox shift or true
hypoxia in major
tissues in the body, e.g. muscle or nerve. These changes may result from
decreased
perfusion and oxygenation of peripheral tissue and play an important role in
development
of diabetic microangiopathy and neuropathy in both humans and animal models
(Mayrovitz and Larsen, 1996. Micr~ovasc. Res. 52:11.5-126; Tesfaye et al.
1994.
Diabetologia 37:847-854; Cameron, and Cotter, 1994. Diab. Metab. Rev. 10:189-
224;
Boulton and Malik, 1999. Organ specific vascular changes. In Diabetic
Angiopathy.
Tooke, J.E., editor. New York: Oxford University Press. pp. 267-275).
A recent report (Pyke et al. 1999. Diabetes 48 (Suppl. 1) 593(Abstr.)) that
the
diabetic kidney is also hypoxic suggests that hypoxia may be a common
mechanism
contributing to altered metabolism and development of pathology in diabetes.
The
resultant increase in anaerobic metabolism of carbohydrates suggests that
aerobic
metabolism of lipids may also be impaired, contributing in part to the
hyperlipidemia in
the diabetic rat. It is possible that all of these effects are secondary to
inhibition of AGE
2o formation in the vasculature, but we cannot exclude multiple mechanisms of
action of the
drugs. Evaluation of the kinetics of PM's effects on tissue oxygen tension,
peripheral
vascular resistance, lipid concentrations and the lactate:pyruvate ratio in
plasma of the
diabetic rat will yield important insights into the mechanism of drug action
and the role of
hypoxia in the development of metabolic and functional changes in the STZ-
diabetic rat.
Mechanism of action of PM. The effects of PM and AG are consistent with the
AGE hypothesis on diabetic complications. Both drugs inhibit the formation of
CML, and
CEL, theoretically by trapping reactive carbonyl intermediates involved in AGE
formation, and they also retard the development of diabetic nephropathy.
However, the
failure of either PM or AG to affect pentosidine formation, combined with the
strong
3o correlations between triglycerides and CML, and between triglycerides and
albuminuria or
creatininemia, suggests that lipids may be important in both the formation of
AGEs and
development of nephropathy. Indeed, both CML and CEL are formed during lipid
62
CA 02347117 2001-04-19
WO 00/23063 PCT/US99/24611
peroxidation reactions (unpublished results, and Fu, et al. 1996. J. Biol.
Chem. 271:
9982-9986), and it could be argued that the decrease in their concentration in
collagen
could be a direct result of the decrease in plasma triglycerides effected by
the AGE
inhibitors. However, the fact that pentosidine, a product derived exclusively
from
carbohydrates (Pyke et al. 1999. Diabetes 48 (Suppl. 1) 593(Abstr.)) is
increased in both
skin and renal collagen of diabetic rats indicates that carbohydrate
autoxidation and
glycoxidation contribute to AGE formation. Although neither PM nor AG
prevented the
increase in pentosidine in skin collagen, this may reflect the fact that it is
more difficult to
inhibit formation of pentosidine, compared to CML, in vitro (Dyer et al. 1991.
J. Biol.
Chem. 266:11654-11660; Litchfield et al. 1999. /nt. J. Biochem. In press). The
relative
increases in CML, CEL and pentosidine are also similar in diabetic compared to
control
rats, consistent with their origin from a common precursor, which, in the case
of
pentosidine, must be carbohydrate in nature. The relative levels of CML and
pentosidine
in skin (Degenhardt et al., in press) and renal collagen are also consistent
with the relative
yields of these compounds during modification of collagen by glucose in vitro
(Dyer et al.
1991. J. Biol. Chem. 266:11654-11660; Litchfield et al. 1999. /nt. J. Biochem.
In press),
i.e. 50-100 fold higher concentration of CML, compared to pentosidine. Thus,
it seems
most likely that all three of these products, as well as the increased
fluorescence and
crosslinking of diabetic collagen, are derived from glycoxidation reactions.
Dyslipidemia and diabetic complications. Dyslipidemia is recognized as a risk
factor fox development of diabetic nephropathy (Oda and Keane, 1997. Kidney
Internat.
52, Suppl. 2:536-538; Smulders, et al. 1997. Eur. J. Clin. Invest. 27:997-
1002), but is
also commonly associated with nephropathy, independent of diabetes (Guijarro
and
Keane, 1993. Curr. Opin. Nephrol. Hypertens. 2:372-379;Saito, T. 1997. Tohoku
J. Exp.
Med. 181:321-337). It seems most likely that the abnormalities in lipid
metabolism would
have developed early in diabetes, in concert with the development of
hyperglycemia. In
this case, dyslipidemia may have accelerated the development of nephropathy,
possibly
through localized oxidation of lipoproteins entrapped in the kidney (or
vasculature) and
subsequent formation of advanced lipoxidation end-products (ALEs). Both AG
(Picard et
3o al. 1992. Proc. Natl. Acad. Sci. USA 89:6876-6880; Giardino et al. 1998.
Diabetes
47:1114-1120) and PM (unpublished results) are known to inhibit modification
of proteins
during lipid peroxidation reactions, suggesting a mechanism, in addition to
inhibition of
63
CA 02347117 2001-04-19
WO 00/23063 PCT/US99/24611
glycoxidation reactions, by which these drugs may provide protection against
diabetic
nephropathy. A concerted effect on formation of both AGEs and ALEs may lead to
decreased modification (thickening, stiffening) of vascular collagen, improved
peripheral
perfusion and oxygenation, normalization of lipid metabolism and correction of
dyslipidemia. The cause-effect relationships between these pathologies cannot
be
determined by the present experiments and available data, however measurement
of ALEs
in tissues of control, diabetic and PM-treated diabetic animals may uncover a
broader
range of effects of AGE-inhibitors on the chemical modification of proteins
and the
development of complications in diabetes.
to There are multiple causes of dyslipidemia, including genetics, dietary
factors, and
disease, as well as a complex interplay between these various causes of
dyslipidemia.
Methods to prevent and/or treat dyslipidemia may then be dependent of its
causative
factors. Pyridoxamine has previously been reported to partially decrease
elevated
serum lipid levels caused by excessive lipid intake (i.e., high cholesterol
diet) in a rat
model. (Speck, U.S. Patent No. 5,288,716). Speck does not discuss other causes
of
hyperlipidemia such as renal failure or genetic deficiencies in lipid
metabolism. Prior to
the data presented in the instant application, no data existed for the use of
pyridoxamine to
treat or prevent hyperlipidemia caused by defective lipid metabolism.
Particularly, Speck
et al. did not provide any guidance with respect to the effect of pyridoxamine
in treating or
2o preventing hyperlipidemia associated with diabetes, a condition known to
dramatically
effect numerous metabolic pathways and to have wide-ranging physiological
effects.
In summary, we have demonstrated that the AGE inhibitors PM and AG inhibit the
chemical modification of tissue proteins, retard the development of
nephropathy, and
substantially reverse dyslipidemia in the STZ-diabetic rat. We have also
demonstrated
that PM and AG substantially reverse redox imbalances in the STZ-diabetic rat.
Systemic
redox imbalances are indicative of pseudohypoxia, hypoxia, and ischemia in
tissues,
conditions which play an important role in many disease states, including but
not limited
to diabetic complications, neurodegenerative diseases such as Alzheimer's and
amyotrophic lateral sclerosis; shock, inflammatory injuries and diseases,
aging, and tissue
3o ischemia. (See for example, Andrus et al., J. Neurochem. 71:2-41-2048
(1998); Hall et al.,
J. Neurosci. Res. 53:66-77 (1998); Smith et al., J. Histochem. Cytochem.
46:731-735
(1998); Smith et al., J. Neurochem. 70:2212-2215 (1998); Russell et al., Arch.
Biochem.
64
CA 02347117 2001-04-19
WO 00/23063 PCT/US99/24611
Biophys. 370:236-239 {1999); Flowers and Zimmerman, New Horizons 6:169-180
(1998);
Piedimonte et al., J. Infect. Disease 176:655-664 (1997) Thus, methods for
treating and
preventing redox imbalances are useful in treating these conditions.
In general, PM appeared to be comparable to AG in inhibition of nonenzymatic
modifications of collagen, but significantly more effective in inhibiting the
biochemical
and physiological changes in the diabetic rats. Our results suggest a complex
web of
interactions between the altered chemistry and biochemistry of both
carbohydrates and
lipids in diabetes. Animal toxicology studies have shown that PM has low
toxicity and a
good safety profile, and Phase I clinical trials are now in progress in an
effort to evaluate
1 o the efficacy of PM for treatment of diabetic complications.
The plasma levels of cholesterol and triglycerides were also lowered by PM in
the
diabetic rat studies. The mechanism by which PM would lower cholesterol and
triglycerides is not known, but suggests that PM may affect certain enzymatic
pathways of
cholesterol synthesis and degradation. For example, PM may inhibit
hydroxymethylglutaryl-coenzyme A (HMG-CoA) reductase or angiotension
converting
enzyme (ACE). The lowering of plasma creatinine and urinary albumin, of AGE
formation in skin, and of total cholesterol and triglycerides in a diabetic
animal model
supports the hypothesis that PM is a versatile drug capable of inhibiting
several altered
metabolic processes and protein damage associated with the development of
complications
2o arising from both diabetes and dyslipidemia.
We have also provided evidence suggesting that administration of PM may prove
useful for the treatment of vascular disease, as well for the prevention of
complications of
diabetes associated with vascular dysfunction, including neuropathy,
retinopathy, and
wound healing deficits in diabetes, as well as treatment of vascular disease,
tissue hypoxia,
and ischemia in patients without diabetes.
Example 7
Compounds for inhibiting oxidative protein modification
The present invention encompasses compounds, and pharmaceutical compositions
3o containing compounds having the general formula:
CA 02347117 2001-04-19
WO 00/23063 PCT/US99/24611
R~
R2
Y/
R3
Formula I
wherein R~ is CHzNH2, CH2SH, COOH, CHZCH2NH2, CH2CHZSH, or CH2COOH;
R2 is OH, SH or NH2;
Y is N or C, such that when Y is N R3 is nothing, and when Y is C, R3 is NOZ
or another
electron withdrawing group;
and salts thereof.
The present invention also encompasses compounds of the general formula
R,
Rs R2
R5 r R4
R3
Formula II
wherein R, is CHzNHz, CHzSH, COOH, CHZCHzNH2, CH2CHzSH, or CHZCOOH;
Rz is OH, SH or NH2;
Y is N or C, such that when Y is N R3 is nothing, and when Y is C, R3 is NOZ
or another
electron withdrawing group;
R4 is H, or C 1-18 alkyl;
RS and R6 are H, C 1-18 alkyl, alkoxy or alkane;
56
CA 02347117 2001-04-19
WO 00/23063 PCT/US99/24611
and salts thereof.
In addition, the instant invention also envisions compounds of the formulas
HOH2C
HO
CH2NH2
and
The compounds of the present invention can embody one or more electron
to withdrawing groups, such as and not limited to NH2, -NHR, -NR2, -OH, -OCH3,
-OCR,
and -NH-COCH3 where R is C 1-18 alkyl.
By "alkyl" and "lower alkyl" in the present invention is meant straight or
branched
chain alkyl groups having from 1-18 carbon atoms, such as, for example,
methyl, ethyl,
propyl, isopropyl, n-butyl, sec-butyl, tert-butyl, pentyl, 2-pentyl,
isopentyl, neopentyl,
15 hexyl, 2-hexyl, 3-hexyi, and 3-methylpentyl. Unless indicated otherwise,
the alkyl group
substituents herein are optionally substituted with at least one group
independently
selected from hydroxy, mono- or dialkyl amino, phenyl or pyridyl.
By "alkoxy" and "lower alkoxy" in the present invention is meant straight or
branched chain alkoxy groups having 1-18 carbon atoms, such as, for example,
methoxy,
20 ethoxy, propoxy, isopropoxy, n-butoxy, sec-butoxy, tert-butoxy, pentoxy, 2-
pentyl,
isopentoxy, neopentoxy, hexoxy, 2-hexoxy, 3-hexoxy, and 3-methylpentoxy.
67
CH~NH~
CH~NH
CA 02347117 2001-04-19
WO 00/23063 PCT/US99/24611
By "alkene" and "lower alkene" in the present invention is meant stxaight and
branched chain alkene groups having 1-18 carbon atoms, such as, for example,
ethlene,
propylene, I-butene, L-pentene, I-hexene, cis and traps 2-butene or 2-pentene,
isobutylene, 3-methyl-I-butene, 2-methyl-2-butene, and 2,3-dimethyl-2-butene.
By "salts thereop' in the present invention is meant compounds of the present
invention as salts and metal complexes with said compounds, such as with, and
not limited
to, Al, Zn, Mg, Cu, and Fe.
One of ordinary skill in the art will be able to make compounds of the present
invention using standard methods and techniques.
1o The instant invention encompasses pharmaceutical compositions which
comprise
one or more of the compounds of the present invention, or salts thereof, in a
suitable
carrier. The instant invention encompasses methods for administering
pharmaceuticals of
the present invention for therapeutic intervention of pathologies which are
related to AGE
formation in vivo. In one preferred embodiment of the present invention the
AGE related
pathology to be treated is related to diabetic nephropathy.
The instant invention may be embodied in other forms or carried out in other
ways
without departing from the spirit or essential characteristics thereof. The
present
disclosure and enumerated examples are therefore to be considered as in all
respects
illustrative and not restrictive, the scope of the invention being indicated
by the appended
claims, and all equivalency are intended to be embraced therein. One of
ordinary skill in
the ark would be able to recognize equivalent embodiments of the instant
invention, and be
able to practice such embodiments using the teaching of the instant disclosure
and only
routine experimentation.
68