Note : Les descriptions sont présentées dans la langue officielle dans laquelle elles ont été soumises.
CA 02405636 2010-09-01
METHOD AND APPARATUS FOR ACQUISITION, MONITORING,
DISPLAY AND DIAGNOSIS OF OPERATIONAL PARAMETERS
OF ELECTROLYSERS
FIELD OF THE INVENTION
The present invention concerns a method and apparatus for monitoring
electrolyser performances and for diagnosing and predictive identification of
faults
and events likely to affect the manufacturing processes that uses those
electrolysers.
BACKGROUND OF THE INVENTION
An electrolyser is used to convert a lower value chemical (e.g.: NaCl) into a
higher
value chemical (e.g.: NaCI3O). These types of electrolysers can be found in
different areas of the chemical industry, such as for the production of sodium
chlorate, caustic soda and chlorine. In an electrolyser, there is a number of
anodes
and cathodes. An oxidation reaction takes place at the anode and a reduction
reaction takes place at the cathode. The rate of chemical reaction is directly
related to the current. An ion exchange membrane can be used to separate the
anodic reaction from the cathodic reaction. The electrolysis of sodium
chlorate is
usually carried out in an undivided electrolyser. The overall reaction is
described
as: NaCl + 3 H2O NaCIO3 + 3 H2
This reaction requires 6 electrons per sodium chlorate produced. It involves a
multi-step reaction, taking place at the anode and in the bulk of the reactor.
The
article from B.V. Tilak and C.P. Chen B.V. Tilak and C.P. Chen;
`Electrochemical
Society Proceedings' ; vol 99-21 ; 1999 ; pp.8 ; `Electrolytic sodium chlorate
technology: current status' gives an overview of the technology. The
electrolysis of
chlorine and caustic soda can be achieved simultaneously in the same
17923-4CA
CA 02405636 2010-09-01
2
electrolyser. Caustic soda is formed in the cathode compartment. The chlorine
is
formed at the anode compartment. In modern chlor-alkali electrolyser, the
separation between the anodic and the cathodic reaction is achieved with an
ion
exchange membrane. This membrane ideally only allows the passage of sodium
from the anodic compartment to the cathodic compartment. The article from D.L
Caldwell (D.L. Caldwell; Comprehensive Treatise of Electrochemistry'; Vol 2;
1981; pp105; 'Production of chlorine'; Editor: O'M. Bockris, B.E. Conway,
E.Yeager and R.E. White; Publisher: Plenum Press, New York) gives more detail
about this technology.
A fuel cell is a special type of electrolyser that is used as a generator. It
converts
the chemical energy of a fuel into electrical energy. Fuel cells are composed
of a
number of anodes and cathodes. It is at the anode that the fuel is
electrochemically oxidized and it is at the cathode that the oxidant is
electrochemically reduced. Electrons are generated at the anode and flow
through
an external load to the cathode. Ions flow between the anode and the cathode
in
an electrolyte to complete the circuit. There are different fuel cell
technologies. The
proton exchange membrane fuel cell (PEMFC) is one of them. The PEMFC is also
known as a solid polymer electrolyte (SPE) fuel cell. In such fuel cell, a
thin proton
exchange membrane has on one of its faces an anode and on the other a
cathode. Hydrogen is fed to the anode and reacts to produce protons. These
protons move to the cathode where they react with oxygen to produce water. The
overall reaction is: H2 + Y2 02 --> H2O
The ways the anodes and cathodes are connected differ according to the
technology. The electrodes can be connected in parallel, in series or in a
combination thereof.
One of the problems associated with the monitoring of the electrolysers is the
extremely hostile conditions in which they operate. This makes data
acquisition
difficult and unreliable. Furthermore, it is essential to monitor these
electrolysers in
17923-4CA
CA 02405636 2010-09-01
3
order to maximize the production rate and quality while still maintaining a
minimal
operating cost. Looking at the overall production performance does not allow
the
operator to discover that a unit cell is under-performing and should be
changed.
There is a growing need from the industry to be able to diagnose the plant on
a
macroscopic level as well as on an individual cell unit level in order to
correctly
assess the cause of any performance decrease and determine what is the more
economic solution to deal with the problem so identified. Usually, a plant
operator
monitors the electrolysers by measuring manually the pertinent parameters as
voltage and current. Then, the data records are sent to the plant engineer,
and by
using his expertise and different data analysis he can find the symptoms that
may
cause the faults. This procedure is time consuming and imprecise, especially
when the fault symptoms are defined by a large amount of data. For this
reason, it
is useful to have a system that can automatically and accurately monitor the
electrolysers and help to quickly identify the problems that can occur in such
plants to increase the production performance.
Known in the art is US patent no. 5,945,229, to General Motors Corporation
entitled "Pattern Recognition Monitoring of PEM Fuel Cell". The CO
concentration
in the H2 feed stream to a PEM fuel cell stack is monitored by measuring
current
and voltage behaviour patterns from an auxiliary cell attached at the end of
the
stack. The auxiliary cell is connected to the same oxygen and hydrogen feed
manifolds that supply the stack, and discharges through a constant load.
Pattern
recognition software compares the current and voltage patterns from the
auxiliary
cell to current and voltage signatures determined from a reference cell
similar to
the auxiliary cell and operated under controlled conditions over a wide range
of
CO-concentrations in the H2 fuel stream. However, one of the problems
associated
with this method is that the reference signature is taken at ideal operating
conditions for a fuel cell. No allowance is made for the variation in the
operational
characteristics of the fuel cell during the life of the fuel cell.
17923-4CA
CA 02405636 2010-09-01
4
Also known in the art is US patent no. 6105149 to General Electric Company
entitled "System and Method for Diagnosing and Validating a Machine using
Waveform Data". In this patent, a method and a system are developed to
diagnose
faults in devices such as computed tomography or magnetic resonance imaging
machines. The faults are diagnosed by analysing waveform data obtained from
the
machines. A database containing the faults symptoms and corresponding repair
actions are used to build classification rules. These rules are used to
analyze new
waveform data.
U.S. patent no. 5,584,291 to Instrumentarium entitled "Method for recognizing
and
identifying emergency situations in an anaesthesia system by means of a self-
organizing map" describes a method of identifying emergency situations in an
anaesthesia system by measuring a plurality of variables associated with an
anaesthesia delivery. The measurement values of the measured variables are
formed into pattern vectors characterizing the instantaneous states of the
system.
Other fault diagnosis methods applied in plants that use electrolysers can be
found
in the following patents: US patent no. 4,532,018 to Olin Corporation
entitled:
"Chlor-alkali cell control system based on mass flow analysis", US patent no.
5,015,345 to Denora Permelec entitled: "Method for detecting defective ion
exchange membrane in monopolar and bipolar electrolysers" and European patent
application EP1069636A1 to General Motors Corporation entitled: "Fuel cell
stack
monitoring and system control".
SUMMARY OF THE INVENTION
It is an object of the present invention to provide a system and apparatus
that
gives valuable information relative to the performance of electrolysers in a
chemical manufacturing plant and helps to diagnose the origin of performance
fluctuations that sometimes occur during the production.
17923-4CA
CA 02405636 2010-09-01
In accordance with the invention, this object is achieved with a method and
apparatus for monitoring electrolyser performances and for diagnosing and
predictive identification of faults and events that could affect the
manufacturing
processes that uses electrolysers. The system comprises:
5 a) a plurality of acquisition and transmission units, each of said
acquisition and transmission units measuring a plurality of variables
related to a respective electrolyser and for transmitting said
variables;
b) a database and data management unit for recording the variables
transmitted by each of said acquisition and transmission units;
C) an intelligent data analysis and fault diagnosis unit for analysing said
variables and diagnosing events;
wherein each of said units are interconnected through a communication
unit.
In accordance with an embodiment of the invention, the system includes: a data
acquisition and transmission unit which acquires parameters such as voltage,
current and temperature from the cells. These convert the analog signals into
digital data streams. Those data sets are concentrated and transmitted by the
communication unit to the database and data management unit, which records
and formats them into data row files. A processing and monitoring unit
displays
desired data trends and added value data, which are pre-processed and filtered
based on a user-defined setting. In addition, the monitoring unit displays
alarms,
recommended actions and generates reports. The data rows are fed to the
monitoring unit from the database and management unit by making export
requests to the communication unit. An intelligent data analysis and faults
diagnosis unit tracks the evolution of defined pertinent parameters. This unit
prevents faults and events before they occur by isolating data trends
signatures.
The plant engineer or the plant analysis lab defines these faults signatures
in
advance based on their experience or based on a prior knowledge for the
characteristics of the electrolysers in the plant. All the units are
constructed around
17923-4CA
CA 02405636 2010-09-01
6
the communication unit that simplifies the importing and exporting of data and
information between the system units and a remote third party software or
hardware through a network.
BRIEF DESCRIPTION OF THE DRAWINGS
FIG. I shows the global structure of the acquisition and diagnosing system for
the
electrochemical cells according to the present invention.
FIG. 2 shows an example of the interconnexion between the acquisition and the
transmission units for a plant according to the present invention.
FIGS. 3A and 3B show a schematic example layout of the processing and
monitoring unit shown in FIG.1.
FIG. 4 shows the structure of the intelligent data analysis and faults
diagnosis unit
shown in FIG. 1.
FIG. 5 shows the structure of the learning feature extractor and the learning
faults
and events classifier shown in FIGS. 3A and 3B.
FIG. 6 shows the structure of the diagnostic feature extractor and the
diagnostic
faults and events validating unit shown in FIGS. 3A and 3B.
DETAILED DESCRIPTION OF THE INVENTION
In the present invention, a unit cell is defined as the smallest group of
anodes and
cathodes that are connected to the same current feeder. A monopolar
electrolyser
is then considered as a single cell unit and a bipolar electrolyser is
considered as
17923-4CA
CA 02405636 2010-09-01
7
a number of unit cells. A voltage reading is measured for each unit cell. The
present system allows the detection of faults and events in each unit cell.
The present invention concerns an acquisition, monitoring and diagnosis system
and method that help the tracking and the optimization of the performance of
electrolysers in manufacturing chemical plants.
In an electrolyser there are a number of anode and cathodes. A membrane can be
used to separate the anodic reaction from the cathodic reaction. The way the
anodes and cathodes are connected differ according to the technology used. The
electrodes can be connected in parallel, in series or in a combination
thereof.
The system and method of the present invention allows the monitoring of each
unit
cell. There are different indicators that can be used to assess electrolyser
performance. The voltage and the current efficiency are two of them. The
voltage
is very sensitive to any changes occurring in the operating conditions. With
the
right equipment, it can easily be measured for each unit cell. The current
efficiency
is more difficult to determine. It requires measuring concentrations in the
solution
coming from the unit cell. Quite often, it is only possible for a group of
unit cells.
There are many examples in the literature that use these two parameters to
determine the performance of a new type of electrode (see, for example, D.A
Denton, J.T. Desouza, J.H. Entwisle, D. Lee, H.G. Wilson; Modern Chlor-Alkali
Technology; vol. 2; P215; Developments in coatings for metal anodes; Ed: R.W.
Curry; The Royal Society of Chemistry publication) or the effect of impurities
on
the performances (Y. Ogata, T. Kojima, S. Uchiyama, M. Yasuda and F. Hine;J.
Electrochem. Soc.; vol. 136; 1989; 91 "Effects of the brine impurities on the
performance of the membrane type chlor-alkali cell", M. Nakao and H. Miyake
Modern Chlor-Alkali Technology; pp. 185; "Advanced cell operation with flemion
membrane";Ed: R.W. Curry; Pub:The Royal Society of Chemistry).
17923-4CA
CA 02405636 2010-09-01
8
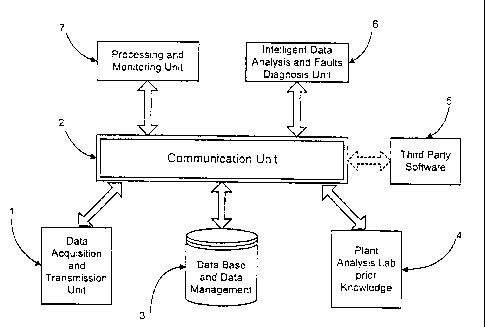
FIG.1 represents the global structure and the connections between the
different
units of the system according to a preferred embodiment of the invention. In
the
core of the system there is the communication unit 2, which simplifies the
dialog
and the exchange of data and information between the different units. This
unit is
built under a server client communication protocol. In the preferred
embodiment,
the public domain OPC (OLE for Process Control) provided with Microsoft
Windows NTTM or 2000TM operating system used to run the software units is
used.
The communication unit 2 acts as a server to the other units, which are
defined as
clients. The data acquisition and transmission unit 1 contains the hardware
devices that acquire data from the cells and transmit them to the other units.
It
includes electronic boards 8 called MODA (Module Acquisition) that measure at
least one of the following cell electrodes voltage, total cell voltage, cell
group
voltage, and may further be adapted to measure temperatures and gas
concentrations measured by adequate sensors. The MODA contains A/D
converters that convert the analog signals into digital signals with a defined
sampling rate; memory buffers; digital filters that eliminates the undesired
noise
and, in the core, a microcontroller used to run the acquisition and
transmission
procedures. The components of the acquisition units 8 are contained in a
hermetic
box that protects them from the surrounding hostile environment. All the data
issued from the MODA devices is sent via optical fiber wires with respect to
the
transmission protocol to the concentration device 9, called the FOCOM (Fiber
Optic Communication Module). The FOCOM is a board plugged in a personal
computer or terminal; it receives, concentrates and formats the data streams
into
data rows to make them recordable by the database and data management unit 3.
The main function of this module is to record the data to make historical data
rows
that could be exported to the other units. The user can access any data record
by
making the adequate SQL request through the communication unit OPC server to
the database. The results of the requests are displayed by the processing and
monitoring unit 7.
17923-4CA
CA 02405636 2010-09-01
9
According to the preferred embodiment of the invention, the processing and
monitoring unit 7 is a multi level monitoring graphical user interface; an
example of
that interface is shown in FIGS. 3A and 3B. The basic monitoring level 44 is a
representation of the plant layout with the monitored cells. For each cell,
the
acquired measurements requested by the user are displayed and refreshed on
each time step (also defined by the user). In that level 44 the user could
also
define a threshold for each variable. Consequently, when the variable
approaches
that threshold, flag alarms will be displayed on the screen. Also on that
level 44,
other desired characteristics 45 such as the current value for each line and
the
mean voltage for a cell could be shown as well. A higher-level 47 displays
defined
variable trends reflecting the evolution in a time window of those variables.
In
addition, value added data such as polarization curves; filtered signals and
analysis reports could be accessed by that interface.
The intelligent data analysis and faults diagnosis unit 6 is a tool that
easily and
precisely makes the detection and prediction of faults and anomalies that
could
happen in the monitored devices and proposes the actions to take to avoid
those
anomalies. The fault diagnosis is based on classification rules defined in
accordance with a prior knowledge of process functioning. This unit is
preferably
embodied by a software package.
An example of the connection between the different units in a plant is shown
on
FIG. 2. A production line 18 has a number of cells 12; each cell 12 contains 8
cell
units. In this case, each electrode voltage is measured by a metal wire 48. To
increase the accuracy of the measuring values and the minimization of noise,
the
wires 48 are concentrated in a multicable protected cable 15 through the TFP10
(Terminal Fuse Protection 10) device 11. In this plant layout, each
acquisition
device 8 monitors 4 cells. The multicables coming from each cell are connected
to
the inputs of the acquisition unit 8. Each MODA multiplexes the input signals
by a
series of relays in a sequence. Then, the input signals are fed to electronic
isolators (high current isolation to 1000 ground volts), which produces a
17923-4CA
CA 02405636 2010-09-01
proportional analog signal. Those analog signals are converted to digital ones
by
an A/D converter. The acquisition units could advantageously process other
inputs
like temperature or chemical readings from sensors, which will be directly
connected to the A/D converters. The acquisition units 8 are powered directly
by
5 the cell 13; this is advantageous because it obviates the need for external
power
lines.
The data streams are then transmitted through the communication optical fiber
loop 10, which links all the MODA acquisition units to the control personal
10 computer 9. The transmitted data streams are processed by the unit 9, which
is
basically a device with memory buffers built around a processor. This unit
formats,
stores and send the data streams to the database, which creates the data row
files
records. Also the unit 9 is able to acquire a 4-20 mA current input that feeds
the
production line. The data files stored in the database could be accessed by
any
terminal in the plant through the local network 16 by making the adequate
exporting request to the OPC communication protocol 2.
FIG. 4 shows block diagrams that set forth the components of the intelligent
data
analysis and fault diagnosis unit 6. It includes three main components: The
learning unit 21, the diagnostic unit 26 and the faults and events knowledge
base
25.
The learning unit 21 obtains historic data files 17 taken from the database
unit 3.
Those data files 17 (called also training data) contain values of electrical
and
chemical parameters acquired by the acquisition unit I and other parameters
deemed relevant for the fault signatures learning and extraction. The data
files are
preferably organized in a row-column fashion, where each row represents the
time
step acquisition and each column indicates the parameter type. The learning
unit
21 includes a learning feature extractor 20 for extracting the most important
features from the data sets. Those features are the most representative of the
plant state. The generated features are then sent to the learning faults and
events
17923-4CA
CA 02405636 2010-09-01
11
classifier 24, which associates and classifies them into events classes. This
association is done by respect to the plant prior knowledge. The resulting
classification rules are then stored in the diagnostic faults and events
knowledge
base 25.
FIG. 5 depicts in detail the interaction between the different components of
the
learning unit 21. As mentioned previously, the learning data files 17 are
organized
in a manner that the rows represent the acquisition time and columns the
parameters values as shown by 30. In the preferred embodiment of the
invention,
the faults signatures and the process operation profiles could be isolated by
doing
two levels of feature extraction. The basic level is to learn the
Instantaneous
process state at each time step tq; this is done by tracking the state vector
32. The
state vector contains the pertinent process parameters [Pi, P2, P3... Pn],
which
defines a global operation process state at the step time tq. An operation
profile or
a fault signature could be defined not just by the state vector 32 but also by
the
evolution of that vector in a certain time window [th, tr] 31. The sequence
feature
parser 49 performs different numerical analysis or data pre-processing on the
time
sequence to generate the feature matrix 50. For each parameter time sequence
P;
E [th, tr], the sequence feature parser 49 performs time domain analysis,
frequency
analysis and data pre-processing and obtain for that time series, a feature
vector.
All the feature vectors are concatenated to build the feature matrix 50. The
extracted time domain features are values such as: the time sequence average,
the peak to peak distance of the time sequence, the time sequence standard
deviation, the integral and the derivative. The extracted frequency domain
features
are values such as: the maximum amplitude of the power spectrum and the
frequency of that maximum. Some events could be defined just by the evolution
of
one pertinent parameter in the time window [th, tr]. In that case, one feature
vector
for the parameter is generated and learned. This is usually called local
learning.
Other features are generated by performing pre-processing operations such as
filtering the data for eliminating outliers (points lie far from the mean
value) or
17923-4CA
CA 02405636 2010-09-01
12
removing undesired frequencies from the frequency spectrum. Other pre-
processing operations such as data normalization by mean, by variance or
normalization of a parameter versus another one, could also advantageously be
done. An example of this kind of pre-processing is the normalization of
voltage
versus current. In a day-to-day electrolysis plant operation, the current may
vary to
respond to a new production constraint. Changing the current will also affect
the
voltage. The voltage variation related to the current change has to be ignored
during the analysis of the voltage trends. To somewhat simplify the analysis;
it is
convenient to estimate what would be the voltage if the current had not
changed.
Consequently, it becomes easier to see any voltage variation that is not
related to
a current change. A simple approach to the normalization of voltage versus the
current consists in assuming that the relationship between voltage and current
is
linear and that only the slope can change.
The formula used to calculate the normalized voltage is then:
I ,.
V1~f = (V - Vo). + Vo
where V and i are the voltage and the operating current; Viref is the
normalized
voltage; Iref is the current used for the normalization and Vo is the
intercept of the
V versus I linear relationship. Other types of normalization are possible and
useful.
The voltage can be normalized versus the temperature or the electrolyte
concentration. Quite often, empiric formulas or tables are used to normalize
the
voltage versus temperature or the electrolyte concentration. Another useful
method for analysing the electrolyser state is the polarization curves. They
are
obtained by adjusting the current to a number of values and recording the
corresponding voltage. During a polarization curve, it is best to keep the
other
parameters constant (e.g.: temperature, electrolyte concentration). If it is
not
possible, adjustments have to be made to compensate for these variations. The
polarization curves give the relationship between current and voltage V =
f(l). In
chlor-alkali, the relationship is often described as:
17923-4CA
CA 02405636 2010-09-01
13
Vcell = Anode potential + cathode potential + iRmembrane + iRelectrolyte+
iRhardware
The cell voltage represents the sum of many different voltage losses related
to the
different parts of the system (e.g.: the cathode, the anode, the membrane and
the
electrolyte). These voltage losses are function of current but also of the
characteristics of the different parts of the system. A lot of information can
be
extracted just by following the variations in the current voltage
relationship.
Different methods for doing so can be used. The simplest method consists in
doing a linear regression with the linear part of the polarization curve. Then
a
change in the slope and the intercept can be used to detect a variation in
performance. As an example: In the chlorate industry, an increase in the slope
of
the polarization curve is generally due to cathode deposit, whereas an
increase in
intercept is usually attributed to anode loss of coating. A more advanced
method
for analysing variation in the polarization curve consists in doing a non-
linear
regression of the polarization curve. In the chlor-alkali and the chlorate
industry,
the polarization curves can be fitted with the following equation:
V=a+b.l + c .Iog(l)
where a is related to the standard potential and the exchange current as well
as
the Taffel slope;
b is the sum of all the resistances in the cell (hardware + electrolyte);
c is related to the Taffel slopes.
K.L. Hardee (K.L. Hardee; 'Modern Chlor-Alkali Technology'; vol 6; 1995;
pp.234;
'A simple procedure for Evaluating membrane electrolyser performance'; Editor:
R.W. Curry; Publisher: The Royal Society of Chemistry) has used this method in
the chlor-alkali to discriminate between a few situations. He has not
considered
looking at how these parameters will evolve in time. If a hole occurs in a
17923-4CA
CA 02405636 2010-09-01
14
membrane, this will lead after some time to the destruction of the anode
coating
near the hole. The polarization curve then reflects the hole but also the
partial
coating destruction.
The relative change of these three coefficients gives a signature that is
particular
to a given situation. Comparing these changes with known signatures makes it
possible to discriminate between a numbers of situations (e.g.: anode
corrosion,
anode poisoning, cathode deposit, etc). With this method, it is also possible
to
estimate the state of advancement for different situations such as the loss of
anode coating. Other features could be use to construct the feature matrix 50
but
those cited previously are the main ones used in the context of the present
invention. Each state vector 32 and feature matrix 50 is then associated with
a
label; this one defines the feature matrix membership to an operation class or
fault
signature based on the plant prior knowledge 23. The state profiles classifier
33
performs this operation by using geometric classification algorithms as the
well-
known neural network supervised self-organizing maps algorithm (also called
the
kohonen mapping). In the preferred embodiment of the invention the former one
is
used but the latter one perform as well.
The self-organizing map classification algorithm maps non-linear statistical
dependencies between high-dimensional measurement data into simple geometric
relationships on a usually two-dimensional grid map. The mapping is,
furthermore,
done in such a way to preserve the topological relations between the input
feature
vectors and matrices. Due to that topology preserving property of the map,
similar
feature vectors corresponding to similar states of the process are mapped
close to
each other resulting in clusters on the map. Clusters corresponding to certain
faults are created on the map and those clusters could be defined as dangerous
areas. Visualization techniques such as color-coded maps or grey level maps
could identify these clusters. More details on the learning by the self-
organizing
algorithm could found in the following publication: Kohonen, T. "The self-
Organizing Maps", proceeding of the IEEE, 78, pp.1464-1480, and Kohonen, T.
17923-4CA
CA 02405636 2010-09-01
"Self Organized Formation of Topologically Correct Feature Maps", Biological
Cybernetics, 43, p.p. 59-69.
The classification assignments are then input to the Diagnostic Faults and
Events
5 Knowledge base 25. The rules are composed by a condition part that includes
a
conjunction of classification assignments and a consequent part that contains
the
recommendations as a result of the condition part. The recommendations, the
identified events and problems depend on the electrolyser technology. In the
chlor-
alkali industry, there are many events or problems that will affect the
performance
10 of the electrolytic process. Some of those problems are: anode loss of
coating,
cathode loss of coating, cathode poisoning, electrode passivation, blockage in
cell
or liquor circuit, problem with the purification of the feed (e.g.: impurities
such as
sulphate, Mg, Ca, Iron, Ni, Si), insufficient brine feed (too low level of Cl
in the
reactor), loss of feed caustic flow, membrane blistering, membrane fooling
15 (plugging), membrane piercing. This list is not exhaustive. All of these
events will
have an effect on the performance of the electrolyser. Often, they will lead
to a
voltage increase and a decrease in current efficiency. The following are
simplified
examples of rules that show how the recommendations are inferred in the
knowledge base for the chlor-alkali technology. In the preferred embodiment of
the
invention, those rules are more elaborated:
RI: If the voltage increases in all cell units and the set points remain
constants =>
it is recommended to an impurity level analysis.
R2: If parameter b from the polarization curve increase and a and c do not =>
event purely resistive in nature; recommendation: check if there is a fouling
of the
membrane or an increase in the hardware resistance.
R3: If the oxygen level rises => check if there is a blockage in that cell or
a problem
related to the membrane or the anode in that cell.
17923-4CA
CA 02405636 2010-09-01
16
Similarly to the chlor-alkali industry, in the chlorate industry, there are
many events
or problems which will affect the process performance. The electrolyser is
somewhat simplified because there is no membrane to separate the anodic
reaction from the cathodic reaction. However, there is a chemical reaction
taking
place after the electrochemical step that is complicating the overall process.
Examples of typical events or problems are: electrode separation from the
carrier
plate or back plate split, electrode assembly damage, crystallization between
the
cell electrodes, anode loss of coating, anode passivation, cathode blistering,
cathode corrosion, cathode deactivation, heavy electrode deposits, blockage in
cell or liquor circuit, valve closed between reactor and electrolyser, problem
with
crystalliser (loss in efficiency in removing CIO3), problem with the brine
purification
(impurities such as Ca, Mg, sulphate, Co, Ni, Cu, etc), insufficient brine
feed (too
low level of Cl- in the reactor). Here again, the recommendations rules are
expressed in an "if-then" way.
In a PEM fuel cell, many factors can affect its performance. Carbon monoxide
(CO) poisoning is a typical example. When CO is present in the hydrogen feed,
it
can adsorb on the platinum surface and block part of the surface that was
available for hydrogen reaction. Some more examples of typical event and
problems are: flooding of the anode or cathode backing layer, drying of the
membrane, leakage of hydrogen around or through the membrane, membrane
damage.
The above cited rules are reformulated and stored as symbolic if-then
statements
in the faults and events diagnosis knowledge base 25. Known in the art are
rule
based selectors as expert systems or fuzzy logic engines that can be used to
infer
the recommendations from the classification assignments in the diagnostic
phase.
In the learning phase, the user has entered the first set of rules based on
the
electrolyser technology prior knowledge. This first set of rules is then
updated and
fine-tuned when new events or situations occur. An interactive graphical user
17923-4CA
CA 02405636 2010-09-01
17
interface is used to help the user to well enter the rules according to the
selected
features and the classification assignments done by the state profiles
classifier 33.
In Fig.4, the diagnostic unit 26 contains two main components: the diagnostic
feature extractor 19 which obtains the data measurements rows 18 from the data
base and generates the adequate features to the other components, the
diagnostic validating unit 28. The latter module identified the faults
signatures and
events in the input features based on the classification rules and
recommendations stored in the diagnostic faults and events knowledge base
during the learning phase. Fig. 6 details the interaction between the
components
of the diagnostic unit 26. In order to identify the faults and events learned
in the
training phase, the sequence feature extractor 51 performs in the time series
sequence P; E [th, tr] 37 i.e. the same analysis and pre-processing operations
as in
49. Multiple recognition operations are done, depending on the kind of the
desired
detection: instantaneous operation profile identification, the evolution of
the global
operation profile or the evolution of a local operation profile. In the simple
case
where an event is defined by the evolution of one parameter in a time window,
the
feature vector for the parameter in interest generated from the sequence
feature
extractor 51 is compared with the learned reference local features vectors
stored
in the fault and events knowledge base 25. The so-called "dynamic time warping
algorithm" is used to compare the feature vector for the parameter P; and the
stored reference vectors to identify the local fault or event signature. This
algorithm is implemented in the sequence recognition unit 39. It measures the
similarity distance between the prototype feature vectors. By the mean of that
distance measure, the faults and profiles isolation unit 41 chooses the
suitable
local recommendation rule for the most similar feature vector to the measured
feature vector (More details about the dynamic time warping algorithm could be
found in the publication entitled "Applied Pattern recognition", author:
Dietrich W.
P. Paulos, pp. 334-340, vieweg publications). The second detection level is
the
identification of the instantaneous state vector profile at the each step time
tq. This
operation is done by the process state recognition 40. This module calculates
for
17923-4CA
CA 02405636 2010-09-01
18
each instantaneous state vector 38 a membership degree to the event classes
mapped in the learned two-dimensional grid. This membership degree is
generated by mean of the maximum quantisation error. This error is the
similarity
distance between the measured state vector 38 and the learned training state
vectors mapped into the two-dimensional classification grid 33. In other
words, the
quantisation error informs about the location of the input state vector in the
learned
map. In the preferred embodiment of the invention, the quantisation error is
measured by the Euclidian distance. Furthermore, the history evolution of the
global state vector in the time window [th, tnj 37, could be tracked by
following the
trajectory of the operation point in the classification grid map 33. Based on
the
classification degree or movement generated by the state recognition module
40,
the fault and events isolation module infers the most suitable recommendations
from the faults and events knowledge base. In the case where the matching
degree to the learned features is poor, the parameters measurements input to
the
diagnosis unit are probably novel situations or events not learned in the
training
unit. As a result, the fault and events isolation unit generates a "Unknown
event"
message. The novel situation could be taken in account by updating the
knowledge base. Thus, if this situation occurs in the future, it could be
recognized.
All the recommendations and event identifications are presented to the user by
daily, weekly or monthly reports or by the graphical visualization of the
operation
point's movement in the classification map grid.
Although the present invention has been explained hereinabove by way of a
preferred embodiment thereof, it should be pointed out that any modifications
to
this preferred embodiment within the scope of the appended claims is not
deemed
to alter or change the nature and scope of the present invention.
17923-4CA