Note : Les descriptions sont présentées dans la langue officielle dans laquelle elles ont été soumises.
CA 02521448 2005-10-04
TO3008 PCT
1
1-Mobile Deutschland GmbH 08/08/2005
METHOD FOR ANALYSING THE INTERFERENCE AND SUPPLY
SITUATION IN UMTS SUB-NETWORKS
The invention relates to a method for analysing the interference and supply
situation in UMTS
(universal mobile telecommunication system) sub-networks.
UMTS networks are based on ATM (asynchronous transfer mode) and IP (internet
protocol) and
make possible the transmission of line- and packet-oriented services.
Providing for this is a new
air interface for the mobile telephone network, which interface can
efficiently transmit the different
formats. In Europe and Japan, the air interface is based on the WCDMA
(Wideband Code Divi-
sion Multiple Access) radio technology. Thereby, a GSM infrastructure can be
migrated into a
UTMS network. With WCDMA, Europe, as the most important mobile phone market
worldwide,
achieves a unified UMTS standard. Mobile broadband communication with Japan is
also possible
thereby. The PDC (person digital cellular) standard used there can be easily
integrated into
WCDMA. In America, in contrast, there are only a few GSM networks. The
majority of the net-
works are based on cdmaOne or IS95. In the third mobile-phone generation,
these networks
migrate to CDMA 2000 (code division multiple access) and are compatible with
WCDMA. The
WCDMA modulation method is no longer based on time division and the frequency
is used in
wideband manner: at 5 MHz, the transmission frequencies are 25 times as wide
as in the case of
GSM at only 200 kHz. These propagation characteristics affect both the cell
capacity, and thus
the network planning, and the reception quality. In times of little demand by
a user, another user
can utilize the channels. Also, a user can operate several data streams at the
same time, e.g.
telephoning, faxing, fetching email, loading and simultaneously surfing a file
from the network.
From experience with IS95 CDMA networks and initial investigations into WCDMA
networks, it
appears to be very important that an optimization of the radio-field supply
involving measurement
data be carried out. For this purpose, the UMTS network is first of all
surveyed and the present
interference and supply situation determined. Through the method described in
the following,
both are determined, with only data from pilot-channel measurements serving as
the basis. Inter-
ference matrices form the basis of the interference analysis. As a result of
the pilot-channel
measurements, one obtains for each measurement point the pilot-channel
reception power for
several base stations. The possibility thereby exists of producing a
measurement-data based in-
terference matrix. In this, within a locally-limited region (=pixel) the
supplying as well as the
CA 02521448 2005-10-04
T03008 PCT
2
interfering base stations are identified. If this is carried out over the
entire measurement region,
then one obtains for all of the base stations in this region an expression of
how much these sta-
tions interfere with other cells. Described in this document is how the
interference matrix is
produced and two different sets of contents of the interference matrix are
introduced.
The document WO 01 45284 Al discloses a method wherein, by means of
simulation, the per-
formance of a CDMA network is calculated. In order to carry out the
simulation, appropriate input
parameters are necessary. Mentioned here for the determining of the
performance are, for exam-
ple, the best server, the traffic load, the power, and the interference. The
strength of the pilot
channel and the interference at each location of the network are simulated.
DE 43 02 228 Al describes a method for assigning frequencies to base stations
of a mobile-
phone network. Here, input information that originates from other simulations
is necessary. Fur-
ther, this method is designed for the frequency allocation in a GSM network.
The method uses
interference probabilities that are represented in matrix form. In contrast to
a GSM network, a
CDMA network represents an interference-operated network, i.e. all stations
transmit at the same
frequency.
CA 02521448 2005-10-04
TO3008 PCT
2a
The task of the invention consists in specifying a method for analysing the
interference and sup-
ply situation in UMTS sub-networks, by the aid of which method unsupplied
regions can be
identified and the reason for the lack of supply determined. It should also be
possible to identify
which service is available at which location.
According to the invention, this task is accomplished through the teaching of
the independent
patent claims.
Advantageous configurations and further developments of the invention are
specified in the de-
pendent patent claims.
The invention makes possible an investigation of the interference and supply
situation for the
most various services, taking into consideration the traffic load, and the
feeding back of the
measured data to the base without traffic load.
CA 02521448 2014-03-18
An embodiment example of the invention is explained with the aid of the
drawings. Additional fea-
tures, advantages, and application possibilities of the invention result from
the drawings and the
following description.
Fig. 1 is a graphical representation of the setup possibilities of the general
conditions for the inter-
ference analysis;
Fig. 2 shows an example of an interference matrix for a series of base
stations;
Fig. 3 shows an interference matrix (sum) of the interferers, graphically
represented;
Fig. 4 is a matrix that specifies the probability (in `)/0) of the
interference relative to the area;
2b
CA 02521448 2005-10-04
' WO 2004/091103 3
PCT/DE2004/000715
Fig. 5 shows an example of a visualization of the supply information
determined according to the
method;
Fig. 6 shows an example of a visualization of the cause of the regions not
supplied in Fig. 5.
Input data
Forming the basis of the described method are measured data that are acquired
by so-called
WCDMA scanners. These measurement devices detect, in a downlinked manner, the
so-called
common control channels (common control channels for connection establishment
with the mo-
bile stations), which are transmitted on an ongoing basis independently of the
traffic. These are
the primary common pilot channel, in the following referred to as the pilot
channel, the primary
synchronization channel, and the secondary synchronization channel. Of
interest here is only the
pilot channel. The measured data relevant in the following are the reception
power of the pilot
channel (= Es), the total interference power (= /0) present in the relevant
frequency band of 5
MHz, as well as the ratio Ed /0, which thus defines the measured power of the
pilot channel in
relation to the total (interference) signal power. The assignment of the
measurement values to a
base station takes place by means of the scrambling code (SC), which is
likewise detected and
displayed by the measurement device. All of these data can be detected per
each measurement
point for several, e.g. eight, base stations simultaneously.
In order to attain a higher statistical certainty, the original measured data
do not serve as the ba-
sis of the described method, but rather these data are determined within a
constant path
intervals. Conditioned by the scanning rate as well as the statistical
characteristics of the radio
channel, the path interval should amount to at least 20 m.
Both methods assume that the measured data are present in a region in the most
area-wide
manner possible. In particular, in the analysis of the interference matrix
misinterpretations can
occur when the potential supply regions of individual cells have not be
surveyed in a comprehen-
sive manner.
Interference analysis
In the interference analysis, the so-called noise power density Ec/No, i.e.
the energy per informa-
tion bit in relation to the spectral noise-power density at the input of the
receiver, and the pilot
pollution play a role. If a mobile station is located at a spot at which pilot
signals can be received
from several base stations with comparable power, the result is a so-called
pilot pollution, that is
to say, an interfering of the pilot signals with one another. The analysis of
Ec/N0 and pilot pollution
CA 02521448 2005-10-04
' WO 2004/091103 4
PCT/DE2004/000715
represents, it is true, a quality measurement for WCDMA networks, but these do
not lead pur-
posefully to the necessary measures for optimization of non-acceptable
locations/regions.
Lending themselves to the optimization of the radio supply, e.g. with respect
to the pilot pollution
and Ec/No, in an existing network are the changing of the antenna lowering,
i.e. reduction of the
antenna height, as well as the modification of the CPICH power (power of the
common pilot
channel). An interference analysis is necessary as the basis for these. This
analysis can take
place with the aid of an interference matrix.
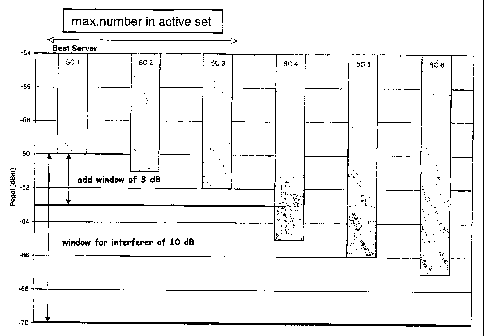
In order to construct an interference matrix, for each pixel (tile) within a,
for example, 10 dB win-
dow below the station measured as the best server, interferers are registered.
This procedure is
represented schematically in Fig. 1. So that stations necessary for the so-
called soft handover
(SHO) are not evaluated as interferers, these must be removed from
consideration through an
additional window. For this purpose, the permitted number of stations in the
active set and a fur-
ther window, e.g. 3 dB window (add window for handover HO), are to be defined.
In the example
according to Fig. 1, the base station with scrambling code SC1 represents the
best server. The
station with scrambling codes SC2 and SC3 are only marginally weaker and lie
within a window
of 3 dB below the power of the best server. The three stations SC1, SC2, and
5C3 are thus used
for the soft handover. The remaining stations 5C4-SC6 in their powers lie
within a window of e.g.
dB below the best server and are evaluated as interferers.
According to the realization of the method, the window of the interferers is
related to the best
server or the best server (negative value) + add window.
For each surface element (pixel), the interferers are determined according to
the above-described
scheme. These data are compiled in a matrix. In this matrix the interference
relationship of each
station to other stations is specified by the number of incidences.
In the matrix according to Fig. 2, in the detailed analysis it can be seen in
which cells precisely
and how frequently a cell (base station) appears as an interferer. The column
of base station SC
88 is emphasized. One learns that station 5C88 interferes with station SC48
with a frequency of
125, that is to say, in the case of 125 measurements SC48 is interfered with
by SC88.
If, now, in the case of each station the sum of the individual interferences
is formed, then one ob-
tains an overall view of how frequently the individual stations appear as
interferers in the
measurement region. As representation such as that of Fig. 3 provides a first
overview of which
station or stations bring a high potential for interference. From Fig. 3 it is
to be learned that the
station with the scrambling code 88 represents the greatest interferer in the
partial network under
consideration.
CA 02521448 2005-10-04
= W02004/091103 5
PCT/DE2004/000715
Conversely, the interference matrix can be used in order to see how frequently
and by which cells
a cell is interfered with. In Fig. 2, this is emphasized in the row for SC 48
and can be represented
in a manner equivalent to Fig. 3. One learns that for cell SC48 the cells SC88
and SC224 repre-
sent the most frequent interferers.
Fig. 4 describes a probability of interference relative to an area. In order
to obtain a probability of
interference relative to an area of the best server, it must first be
ascertained how often a cell ap-
pears as the best server in a region, that is to say, in how many measurement
procedures this
cell is detected as the best server. The interfered-with pixels (area
elements) are compared to the
pixels not interfered with and can be shown as a percentage. The values thus
obtained are
weighted over the area.
Example: In 10,000 measurements (= 10,000 area elements) the cell SC48 is
detected as the
best server. The cell SC88 appears here 1,903 times as an interferer. The
probability of the inter-
ference relative to the measured area thus amounts to 19.03%, as is evident
from Fig. 4.
This processing of the data provides additional information regarding to what
degree one cell is
interfered with by the other. Otherwise, Fig. 4 is to be read in precisely the
same manner as Fig.
2.
Together, the two interference matrices provide the observer with a very
precise picture of the
interference relationships and the necessary measures resulting therefrom.
Findings
The processing of the interference relationships in a WCDMA network presents
the possibility of
reducing the interference potential of specific stations, e.g. SC88, on the
basis of the measured
data through antenna lowering or changing of the CPICH power. Thus, in common
with the other
representations such as best server (Es), EjNo, pilot pollution, and the
location knowledge, the
stations can be purposefully selected for optimization. Subsequent control
measurements will
then allow an improvement of EdNo and the pilot pollution to be detected.
Since in WCDMA networks the minimization of interferences represents an
important factor for
the capacity and quality, such an analysis is to be considered very important.
Supply assertion based on scanner measurement data
According to the invention, as a function of the traffic load a forecast for
the supply situation can
be carried out.
CA 02521448 2005-10-04
' WO 2004/091103 6
PCT/DE2004/000715
Forming the basis of the method described in the following are measured values
from pilot-
channel measurements, which are first carried out in a UMTS network without
active users, i.e.
without a traffic load. Taking into account the utilization of the network in
the uplink and downlink,
based on these measured values a supply assertion is made for uplink and
downlink. In order to
achieve a higher statistical certainty, the measurement values can be
determined within specific
path intervals, and the supply assertion can be based on these middle values.
As an introduction, a few remarks concerning notation. In the usual manner, E,
denotes the chip
energy of the pilot channel and /0 the interference-power density. In the
following, even when
powers are exclusively assumed, the usual notation should be maintained; i.e.
Ec corresponds to
the reception power of the primary common pilot channel (pCPICH). In addition,
transmission
powers are denoted by S and reception powers by P.
Supply assertion for the uplink
Based on the measured reception level E, of the pilot signal, the reception
level PuL in the uplink
can be calculated as
PUL = Ec SMS max SpCPICH (1)
where
SMS max is the maximum transmission power of the mobile station,
and
SpCPICH is the pilot-channel transmission power of the base
station.
In the determination of Pa according to (1) it is to be kept in mind that the
measured reception
power of the pilot channel cannot be determined immediately but only after the
correlation recep-
tion. Accordingly, the orthogonality factor has some influence on E. Since the
pilot signal is only
detected by means of a RAKE finger of the receiver, the orthogonality factor
is to be used for a
RAKE finger. Thus, the real receiver power results from the receiver power
Ec,mess determined by
the measurement device through the equation
Ec = Ec,mess (2)
where al corresponds to the orthogonality factor for a RAKE finger. The Ec
thus determined is to
be used in the equations specified here.
A service is available in the uplink when the reception power Pa exceeds a
service-specific, re-
quired minimum reception level P
erf,UL= Perf,UL (in dBm) can be based on the reference value Eb/N0,
which must be given in order to ensure a data transfer of adequate quality,
calculated as
CA 02521448 2005-10-04
= WO 2004/091103 7
PCT/DE2004/000715
P
= 10.1og(kTo) Alfes+ (EVNOref+ 10.1og(R) + Lpõ + Nr + GrmA + 30 (3) erfUL
where
is the Boltzmann constant (= 1.38.10-23 Ws/Kelvin)
To is the ambient temperature (in degrees Kelvin)
Alf,BS is the noise factor of the base station (dB)
(Er/NOref is the reference value (dB) for Eb/No that must be
present for availability
of a service
is the utilization data rate (service specific) (kb/s)
Lpen is the penetration damping (dB)
Nr is the rise in noise through traffic (dB)
GTMA is the gain through an antenna-vicinity preamplifier
(TMA)
Both (EVNOref and the utilization data rate R can be different for each
service, for which reason
Perf,UL is to be calculated separately for each service considered. The rise
of the noise is caused
by the interference power of the active users and is to be introduced
according to the traffic sce-
nario. Here, Nr = 3 dB corresponds to a load of 50%. This value was determined
through
calculation.
By means of (3), a service is considered available in the uplink if
PUL > Perf, UL (4)
PUL according to (1) is based on downlink measurement values, so that the
influence of the an-
tenna diagrams and the lead losses (e.g. cable losses) are contained
implicitly in Pik and need
not be separately taken into consideration in the calculation of Pert, a.
Supply assertion for the downlink
In order for a service to be available in the downlink, two conditions must be
met:
- the reception level lies above the required minimum reception level; and
- the existing value for Et/No is greater than the corresponding target value.
The first condition, it is true, can be directly derived from the second
condition, but is here consid-
ered individually.
Determination of the reception level necessary for a service
First of all, let the first condition be considered.
CA 02521448 2005-10-04
= WO 2004/091103 8
PCT/DE2004/000715
In the downlink, the reception power of a traffic channel Pm/4 can be
calculated based on the
measure reception level E, of the pilot signal as follows:
PTCH = Ec STCH max SpCPICH (5)
where
STCH max is the maximum transmission power of a traffic channel to
which an indi-
vidual user is entitled
SpCPICH is the pilot channel transmission power of the base
station
The minimum reception level P
erf,DL (in dBm) is calculated through
Perf,DL = 10.1og(kTo) + Nf,ms (EI/NOref 10.1og(R) + Lpen + 30 (6)
Nws corresponds to the noise factor of the mobile station. The other values
are analogous to (3).
In principle, as in the uplink, likewise in the downlink the rise in the noise
through interference
power of active users would need to be taken into consideration. However, in
the downlink this
aspect is primarily taken into consideration through the estimation of the
Et/No value (as de-
scribed below) and is thus ignored in the calculation of P
erf,DL=
Determination of own-cell and foreign-cell reception power
The above-explained second condition ¨ the existing value for Et/No is greater
than the corre-
sponding target value ¨ requires that one can make an assertion concerning the
current value of
Et/No. The basis for this is provided by the measure values E, and E0//0.
Described in the follow-
ing is how, based on these measured values, a value for Et/No can be
determined when some
assumptions are made.
For the calculation of the E1/N0 value in the downlink it is necessary to
determine the reception
power from the own-cell (Iig) and the reception power from the foreign cell
(If,). The "own-cell"
corresponds to the base station that is active within a path interval of the
average highest pilot-
channel reception level (= best server).
First, /e,c, is determined. If one assumes that the pilot-channel measurements
take place in a net-
work without traffic load, then the reception power /0 results from the
permanently-transmitting
downlink common-control channels.
The reception power PccH of these control channels results from
PCCH = Ec 4- 0.1 =PpSCH .PsSCH 0.9.P5CH (7)
CA 02521448 2005-10-04
= WO 2004/091103 9
PCT/DE2004/000715
where
PCCH is the reception power of all permanently-transmitting
downlink common-
control channels
Ec is the reception power of the pilot channel
PpSCH is the reception power of the primary synchronization
channel (pSCH)
PsSCH is the reception power of the secondary synchronization
channel (sSCH)
PBCH is the reception power of the broadcast channel (BCH)
Since pSCH and sSCH are transmitted in an alternating manner with the BCH,
their transmission
power is weighted in (7) by a factor that corresponds to the respective
portion of the transmission
time.
The transmission power of the other downlink common-control channels is
specified in relation to
that of the pilot channel. Thus, (7) can be formulated as
PCCH = Ec.(1 + OA' ApBCH + 0 .1 ASCH 0.9.AecH) (8)
where A corresponds to the ratio of the corresponding transmission powers to
that of the pilot
channel. Simplified, the following applies:
PCCH = Ec.(1 Acsh) (9)
Under the assumption that the interference power /0 is generated not through
active users but
exclusively through the downlink common-control channels, one obtains finally
eig = PCCH = Ec=Ci &ch) (10)
With I eig according to (10), If,. is now determined. For the ratio Ec//0 the
following applies:
E E
C c
(1 1 )
I0 Ieig Ifr
Not contained in this is the background noise, which is indeed also included
in the measurement.
Thus, the thermal noise power is to be subtracted from the measured /0 (=
I0,mess)
= I0,mess -k-T=W (12)
Thus, it follows by (10) from (11) for the ratio /eigdfr
CA 02521448 2005-10-04
WO 2004/091103 10
PCT/DE2004/000715
Ieig Ec I IO
(13)
I fr 1 41+ A cch ¨ E, I Io
and If, is given by
Ifr = /0 - Ec'(1 Lscch) (14)
Calculation of Eh/No
From the measured values of EI/0 without traffic, the value for Eo/No of a
service should be de-
termined, based on the defined assumptions for the utilization of a base
station in the downlink. A
prerequisite for this is the distribution of the total reception power /0 into
/eig and /f, according to
(10) and (14).
In general, Eh/No in the downlink is calculated as
E b W ETCH (15)
No R I eig=(1- a) + I fr + I,,
where the apostrophe denotes the variables involving the interference powers
through traffic
channels. In addition:
PTCH is the
reception power (downlink) of the traffic channel for a user of a
particular service.
is the chip rate.
a is the orthogonality factor. Here, however, this is specified for
more than
one RAKE finger, e.g. for 4 RAKE fingers.
For the subsequent considerations the following assumptions apply.
The transmission power of the pilot channel SpcpicH is specified in relation
to the total transmis-
sion power SBS of the base station.
SpCPICH = ApCPICH'SBS (16)
Thus, analogously to equation (9), it follows for the transmission power of
all downlink common-
control channels
CA 02521448 2005-10-04
' WO 2004/091103 11
PCT/DE2004/000715
SCCH = ApCPICH.(1 SBS (17)
The utilization of the base station in the downlink is defined by the used
power of all traffic chan-
nels, which is likewise specified in relation to the total transmission power
Sgs of the base station.
Accordingly, the transmission power SaTcH used for all traffic channels of a
cell results from
SaTCH = TCH SBS (18)
The value for 4, TcH is provided according to the desired traffic scenario. It
defines the utilization of
the network in the downlink.
The maximum transmission power STcHina, that is available to an individual
user is likewise speci-
fied in relation to the total transmission power Sgs of the base station:
STcH max = &TCH'SBS (19)
Based on these assumptions, the terms contained in (15) can be determined from
the pilot chan-
nel measurement data.
For the foreign-cell interference power Ph. involving the additional
interference P
- aTCH through traffic
channels, the following applies:
p + p
Jr = CCH aTCH = 1 + A aTCH
(20)
I fr
CCH A pCPICH = (1 4- A CCH)
After calculation of lir by means of (14), I'f,- is immediately determined.
For the own-cell interference power Gig involving the additional interference
/
-aTCH through all traffic
channels of the own-cell the following applies:
reig = leig laTCH (21)
which together with
AaTCH
IaTCH = E c=
A (22)
pCPICH
results in:
CA 02521448 2005-10-04
' WO 2004/091103 12
PCT/DE2004/000715
(
A aTCH
eig = E, = 1+ A cut + A (23)
pCPICH
Analogously, for the maximum traffic-channel reception power that is available
to a user of a ser-
vice, the following applies:
AuTCH
P =E (24)
TCH max
c A pCPICH
Through the use of (20), (23), and (24) in (15), one obtains the downlink
EL/No value based on
pilot-channel measurements.
By way of summarizing, the presuppositions should be stated once again.
= The reception power /0 contains no interference power through traffic
channels of active
users.
= For the traffic-channel transmission power of a user, the maximum
permitted transmis-
sion power is assumed across the board.
= The utilization of the cells in the downlink is prescribed for all cells
in a uniform manner.
Figs. 5 and 6 show examples of visualizations for estimation of the supplying.
The two images
reproduce the results of the above-described method. Assumed here is a
utilization of 50% in the
uplink and 80% in the downlink. Represented is the supplying for indoors, for
which an additional
building damping of 15 dB is assumed.
Supply assertion based on measurements in traffic-loaded UMTS networks
An essential presupposition of the above-described method for estimating the
supply situation is
that the measurement takes place in a network without active participants
(i.e. without a traffic
load). This is no longer the case in later measurements, which are carried out
in networks that are
in operation. Consequently, the use and analysis of the measurement data of a
WCDMA scanner
would be called into question or, at the minimum, reduced in its field of
application. Described in
the following is a method whereby one can continue to utilize the measurement
data from a net-
work burdened with a traffic load for the interference analysis described
further above and utilize
the supply assertions based on the scanner measurement data.
The above-described method for supply assertions based on scanner measurement
data can be
used for this purpose in modified form. Here, it is assumed that /0 without
traffic results from the
reception power of the permanently-transmitted downlink common-control
channels. Under this
CA 02521448 2005-10-04
' WO 2004/091103 13
PCT/DE2004/000715
assumption, /eig and If, without traffic can be calculated via the summation
of the pilot-channel re-
ception powers of all base stations received at a measurement point. Thus, for
/fr the following
applies:
fr = (1+ A CCH) = EEc,k (25)
k=2
and for /eig:
Ec,1*(1 &A (26)
Here, it is assumed that per measurement point the pilot-channel reception
power of N base sta-
tions can be detected and k=1 corresponds to the best server. In this
formulation there exists a
fundamental problem in the consideration of mean values inside a path
interval. The determina-
tion of If, and /eig according to (25) and (26), respectively, must take place
with unaveraged
values, since the received based stations, or rather their field strengths,
can change from meas-
urement point to measurement point and thus cannot be considered constant
within a path
interval. In this aspect it seems doubtful whether the determination of Ifr
and /eig according to (25)
and (26) is reasonable. It remains to be tested whether, instead of this, a
determination of /0
analogously to (25) should not be made, but rather exclusively the best server
for each meas-
urement point should be determined and, based on this, an average value within
the path interval
ascertained. After that, the course of calculation starting from equation (7)
can be retained.
A further uncertainty of this method lies in whether the measurement receiver
detects the pilot
channel of all relevant base stations and thus whether /0 is correctly
calculated. Hence, so long as
no traffic is present in the network the supply assertion should occur based
on the measured I.