Note : Les descriptions sont présentées dans la langue officielle dans laquelle elles ont été soumises.
CA 02540167 2006-03-24
WO 2005/042760 PCT/US2004/032006
SYSTEMS AND METHODS FOR DETECTING BIOLOGICAL FEATURES
CROSS-REFERENCE TO RELATED APPLICATIONS
This application claims benefit, under 35 U.S.C. ~ 119(e), of U.S. Provisional
Patent
Application No. 60/577,416 filed on June 5, 2004 which is incorporated herein,
by
reference, in its entirety. This application also claims benefit, under 35
U.S.C. ~ 119(e), of
U.S. Provisional Patent Application No. 60/507,381 filed on September 29, 2003
which is
incorporated herein, by reference, in its entirety. This application also
claims benefit, under
35 U.S.C. ~ 119(e), of U.S. Provisional Patent Application No. 60/507,445
filed on
September 29, 2003 which is incorporated herein, by reference, in its
entirety. This
application is a continuation-in-part of U.S. Patent Application No.
10/861,216, filed on
June 4, 2004, which is incorporated herein, by reference, in its entirety.
This application is
also a continuation-in-part of U.S. Patent Application No. 10/861,177, filed
on June 4,
2004, which is incorporated herein, by reference, in its entirety.
1. FIELD OF THE INVENTION
The field of this invention relates to computer systems and methods for
identifying
biological features, such as disease, in biological specimens.
2. BACKGROUND OF THE INVENTION
A first step in rationally treating disease is to assess the patient against a
classification of diseases, the results being used to determine what kind of
disease the
patient has and to predict the person's response to various therapies. The
effectiveness of
the process depends on the quality of the classification. At least in the case
of cancer, the
advent of microarray methods to analyze DNA, RNA or proteins from tumor cells
has
started to refine and improve the classification of cancer cells. See, for
example, Golub et
al., 1999, Science 286, p. 531.
Further, van't Veer et al., 2002, Nature 41 S, p. 530, illustrates how such
"molecular
profiling" is improving cancer classification. Van't Veer et al. shows that
the results of
gene-expression profiling of breast tumors, carried out after they had been
surgically
removed, can be used to predict which patients will develop clinical
metastasis (the spread
of the tumor to other sites, where secondary tumors develop). Treatment for
individual
breast cancer patients is chosen according to various criteria, such as the
extent of tumor
1
CA 02540167 2006-03-24
WO 2005/042760 PCT/US2004/032006
spread (which involves determining tumor size), whether cancer cells have
spread to the
auxiliary lymph nodes and how many nodes are involved, and whether distant
clinical
metastases are present. In women with no evidence of metastasis, the mainstay
of treatment
aimed at curing the disease is the removal of the tumor and radiotherapy.
Unfortunately
i
some of these patients later develop clinical metastasis. Thus, there is a
need to identify
women who, after surgery, will require further ("adjuvant") therapy for the
microscopic
deposits of cancer cells that may have already spread from the primary tumor.
See, for
example, Caldas and Aparicio, 2002, Nature 415, p. 484; and Goldhirsch et al.
1998, J.
Natl. Cancer Inst. 90, p. 1601.
Adjuvant therapy uses pharmaceutical agents, such as oestrogen modulators or
cytotoxic drugs that reach cancer cells through the bloodstream. Such
treatments frequently
have toxic side effects. Identifying women who might need such treatment has
traditionally
relied on various clinical and histopathological indicators (e.g., patient's
age, degree to
which the cancer cells resemble their normal counterparts, the 'tumor grade',
and whether
the cancer cells express the oestrogen receptor). Even taken together,
however, these
indicators are only poorly predictive. So, to save a sizable but small
percentage of lives,
many patients who would have been cured by surgery and radiotherapy alone go
on to
receive unnecessary and toxic adjuvant treatment.
The results of van't Veer et al., 2002, Nature 415, p. 530 as well as other
studies are
beginning to be used in classification schemes that attempt to characterize a
biological
specimen (e.g. tumor) from a patient into plurality of biological sample
classes (e.g., breast
cancer requiring adjuvant therapy versus breast cancer that does not require
adjuvant
therapy). A number of clinical trials, funded by companies and organizations
such as the
Avon Foundation, Millennium Pharmaceuticals, the European Organization for
Research
and Treatment of Cancer, and the National Cancer Institute, are presently
underway to
discover and validate such classification schemes. See, for example, Branca,
2003, Science
300, p. 238.
A number of biological classification schemes are available for breast cancer.
For
example, Ramaswamy et al., 2003, Nature Genetics 33, p. 49 provides a gene-
expression
signature that distinguishes primary from metastatic adenocarcinomas. Su et
al., 2001,
Cancer Research 61, p. 7388, describe the use of large-scale RNA profiling and
supervised
machine-learning algorithms to construct a first-generation molecular
classification scheme
for identifying carcinomas of the prostate, breast, lung ovary, colorectum,
kidney, pancreas,
bladder/ureter, and gastroesophagus. The Su et al. molecular classification
scheme is useful
2
CA 02540167 2006-03-24
WO 2005/042760 PCT/US2004/032006
in diagnosing metastatic cancers in which the origin of the primary tumor has
not been
determined. Wilson et al., 2002, American Journal of Pathology 161, provides
an
expression signature characteristic of HER2/neu positive tissue that is
correlated with
reduced survival of node-positive breast cancer patients. Richer et al., 2002,
The Journal of
Biological Chemistry 277, p. 5209, provides a genetic signature for human
breast cancer
cells that are over-expressing progesterone receptor-A (PR-A) and a genetic
signature for
human breast cancer cells that are over-expressing progesterone receptor-B (PR-
B). As
indicated by Richer et al., 2002, an excess of one or the other PR isoforms
can result in
tumors with different prognostic and hormone-responsiveness profiles from
tumors that
have equimolar levels of the two PR isoforms. Gruvberger et al., 2001, Cancer
Research
61, p. 5979, provides a molecular classification based on DNA microarray data
that can
discriminate tumors based on estrogen receptor status.
The biological classification schemes outlined above are just a sampling of
the many
biological classification schemes that are available for breast cancer.
Further, breast cancer,
represents just one of many biological classifications of interest. Other
representative
biological classifications include a diagnosis of cancer generally and, even
more generally,
a diagnosis of a disease. One problem with each of these aforementioned
biological
classification schemes is that they each require specialized input (e.g.,
formatted microarray
data). Thus, in an effort to characterize a biological specimen, the
specialized input and
output of each biological classification scheme must be deciphered. Because of
such
obstacles, medical care professionals typically use only a limited subset, at
most, of such
biological classification schemes.
Thus, given the above background, what is needed in the art are improved
methods
for making biological classification schemes available for classifying
specimens into
biological classes.
Discussion or citation of a reference herein will not be construed as an
admission
that such reference is prior art to the present invention.
3. SUMMARY OF THE INVENTION
A first embodiment of the present invention provides a computer having a
central
processing unit and a memory coupled to the central processing unit. The
memory stores
instructions for receiving data, wherein the data comprises one or more
characteristics for
each cellular constituent in a plurality of cellular constituents that have
been measured in a
3
CA 02540167 2006-03-24
WO 2005/042760 PCT/US2004/032006
test organism of a species or a test biological specimen from an organism of
the species.
The memory further stores instructions for computing a model in a plurality of
models,
wherein the model is characterized by a model score that represents the
absence or presence
of a biological feature in the test organism or the test biological specimen.
Computation of
the model comprises determining the model score using one or more
characteristics for one
or more cellular constituents in the plurality of cellular constituents. The
memory further
comprises instructions for repeating the instructions for computing one or
more times,
thereby computing the plurality of models. Also stored in the memory are
instructions for
communicating each of the computed model scores.
In some embodiments, two or more model scores are communicated by the
instructions for communicating and each model score in these two or more model
scores
corresponds to a different model in the plurality of models. In some
embodiments, five or
more model scores are communicated by the instructions for communicating and
each
model score in the five or more model scores corresponds to a different model
in the
plurality of models.
In some embodiments, the instructions for receiving data comprise instructions
for
receiving the data from a remote computer over a wide area network such as the
Internet. In
some embodiments, the instructions for communicating comprise instructions for
transmitting each model score to a remote computer over a wide area network
such as the
Internet.
In some embodiments, the test organism or the test biological specimen is
deemed to
have the biological feature represented by a model in the plurality of models
when the
model score is in a first range of values and not to have the biological
feature represented by
the model when the model score is in a second range of values. In some
embodiments, the
biological feature is a disease such as cancer (e.g., breast cancer, lung
cancer, prostate
cancer, colorectal cancer, ovarian cancer, bladder cancer, gastric cancer, or
rectal cancer,
etc. )
In some embodiments, the plurality of models comprises a first model
characterized
by a first model score and a second model characterized by a second model
score and an
identity of a cellular constituent whose one or more characteristics is used
to compute the
first model score is different than an identity of a cellular constituent
whose one or more
characteristics is used to compute the second model score.
In some embodiments, a characteristic in the one or more characteristics for
one or
more cellular constituents used to determine the model score for a model in
the plurality of
4
CA 02540167 2006-03-24
WO 2005/042760 PCT/US2004/032006
models comprises an abundance of the one or more cellular constituents in the
test organism
of the species or the test biological specimen from an organism of the
species. In some
instances, the species is human. In some instances, the test biological
specimen is a biopsy
or other form of sample from a tumor, blood, bone, a breast, a lung, a
prostate, a
colorectum, an ovary, a bladder, a stomach, or a rectum.
In some embodiments, the one or more characteristics comprises cellular
constituent
abundance and the data comprises cellular constituent abundances of at least
one hundred,
at least five hundred, at least five thousand, or between one thousand and
twenty thousand
cellular constituents in the test organism of the species or said the
biological specimen from
the organism of the species. In some embodiments, a cellular constituent in
the plurality of
cellular constituents is mRNA, cRNA or cDNA.
In some embodiments of the present invention, a cellular constituent in the
one or
more cellular constituents is a nucleic acid or a ribonucleic acid and a
characteristic in the
one or more characteristics of the cellular constituent is obtained by
measuring a
transcriptional state of all or a portion of the cellular constituent in the
test organism or the
test biological specimen. In some embodiments, a cellular constituent in the
one or more
cellular constituents is a protein and a characteristic in the one or more
characteristics of the
cellular constituent is obtained by measuring a translational state of the
cellular constituent
in the test organism or the test biological specimen. In some embodiments, a
characteristic
in the one or more characteristics of a cellular constituent in the plurality
of cellular
constituents is determined using isotope-coded affinity tagging followed by
tandem mass
spectrometry analysis of the cellular constituent using a sample obtained from
the test
organism or the test biological specimen. In some embodiments, a
characteristic in the one
or more characteristics of a cellular constituent in the plurality of cellular
constituents is
determined by measuring an activity or a post-translational modification of
the cellular
constituent in a sample obtained from the test organism or in the test
biological specimen.
In some embodiments, the biological feature is sensitivity to a drug. In some
embodiments, the plurality of models for which model scores are computed by
instances of
the instructions for computing collectively represent the presence or absence
of two or more
biological features. In some embodiments, each biological feature in the two
or more
biological features is a cancer origin. In some embodiments, the two or more
biological
features comprise a first disease and a second disease.
In some embodiments, the plurality of models for which model scores are
computed
by instances of the instructions for computing collectively represent the
presence or absence
CA 02540167 2006-03-24
WO 2005/042760 PCT/US2004/032006
of five or more biological features. In some instances, each of the five or
more biological
features represents a different cancer origin. In some instances, the five or
more biological
features comprise a first disease and a second disease.
In some embodiments, the plurality of models for which model scores are
computed
by instances of the instructions for computing collectively represent the
presence or absence
of between two and twenty biological features. In some embodiments, each
biological
feature in the between two and twenty biological features is a cancer origin.
In some
embodiments, the between two and twenty biological features comprise a first
disease and a
second disease.
Another aspect of the invention comprises a computer having a central
processing
unit and a memory coupled to the central processing unit. The memory stores
instructions
for receiving data. The data comprises one or more characteristics for each
cellular
constituent in a plurality of cellular constituents that have been measured in
a test organism
of a species or a test biological specimen from an organism of the species.
The memory
further stores (ii) instructions for computing a plurality of models. Each
model in the
plurality of models is characterized by a model score that represents the
absence or presence
of a biological feature in the test organism or the test biological specimen.
Computation of
a respective model in the plurality of models comprises determining the model
score
associated with the respective model using one or more characteristics for one
or more
cellular constituents in the plurality of cellular constituents. The memory
further stores
instructions for communicating each model score computed in an instance of the
instructions for computing.
Still another aspect of the invention comprises a computer program product for
use
in conjunction with a computer system. The computer program product comprises
a
computer readable storage medium and a computer program mechanism embedded
therein.
The computer program mechanism comprises instructions for receiving data. The
data
comprises one or more characteristics for each cellular constituent in a
plurality of cellular
constituents that have been measured in a test organism of a species or a test
biological
specimen from an organism of the species. The computer program mechanism
further
comprises instructions for computing a model in a plurality of models. The
model is
characterized by a model score that represents the absence or presence of a
biological
feature in the test organism or the test biological specimen and computation
of the model
comprises determining the model score using one or more characteristics for
one or more
cellular constituents in the plurality of cellular constituents. The computer
program product
6
CA 02540167 2006-03-24
WO 2005/042760 PCT/US2004/032006
further comprises instructions for repeating the instructions for computing
one or more
times, thereby computing the plurality of models. Still further, the computer
program
product comprises instructions for communicating each model score computed in
an
instance of the instructions for computing.
Another aspect of the invention provides a computer program product for use in
conjunction with a computer system. The computer program product comprises a
computer
readable storage medium and a computer program mechanism embedded therein. The
computer program mechanism comprises instructions for receiving data. The data
comprises one or more characteristics for each cellular constituent in a
plurality of cellular
constituents that have been measured in a test organism of a species or a test
biological
specimen from an organism of the species. The computer program mechanism
further
comprises instructions for computing a plurality of models. Each model in the
plurality of
models is characterized by a model score that represents the absence or
presence of a
biological feature in the test organism or the test biological specimen and
computation of a
respective model in the plurality of models comprises determining the model
score
associated with the respective model using one or more characteristics for one
or more
cellular constituents in the plurality of cellular constituents. The computer
program
mechanism further comprises instructions for communicating each model score
computed
in an instance of the instructions for computing.
Another aspect of the present invention comprises a method in which data is
obtained. The data comprises one or more characteristics for each cellular
constituent in a
plurality of cellular constituents that have been measured in a test organism
of a species or a
test biological specimen from an organism of the species. The method further
comprises
computing a model in a plurality of models. The model is characterized by a
model score
that represents the absence or presence of a biological feature in the test
organism or the test
biological specimen. Computation of the model comprises determining the model
score
using one or more characteristics for one or more cellular constituents in the
plurality of
cellular constituents. The method further comprises repeating the computing
one or more
times thereby computing the plurality of models. The method further comprises
communicating each model score computed in an instance of the computing.
Still another aspect of the invention comprises receiving data. The data
comprises
one or more characteristics for each cellular constituent in a plurality of
cellular constituents
that have been measured in a test organism of a species or a test biological
specimen from
an organism of the species. A plurality of models is computed. Each model in
the plurality
7
CA 02540167 2006-03-24
WO 2005/042760 PCT/US2004/032006
of models is characterized by a model score that represents the absence or
presence of a
biological feature in the test organism or the test biological specimen and
computation of a
respective model in said plurality of models comprises determining the model
score
associated with the respective model using one or more characteristics for one
or more
cellular constituents in the plurality of cellular constituents. Then, each
model score
computed in an instance of computing is communicated.
Still another aspect of the invention provides a computer having a central
processing
unit and a memory, coupled to the central processing unit. The memory stores
instructions
for sending data. The data comprises one or more characteristics for each
cellular
constituent in a plurality of cellular constituents that have been measured in
a test organism
of a species or a test biological specimen from an organism of the species.
The memory
further stores instructions for receiving a plurality of model scores. Each
model score
corresponds to a model in a plurality of models. Each model in the plurality
of models is
characterized by a model score that represents the absence or presence of a
biological
feature in the test organism or the test biological specimen and computation
of the model
comprises determining the model score using one or more characteristics for
one or more
cellular constituents in the plurality of cellular constituents.
Another aspect of the present invention provides a computer comprising a
central
processing unit and a memory coupled to the central processing unit. The
memory stores
instructions for receiving data, wherein the data comprises one or more
aspects of the
biological state of each cellular constituent in a plurality of cellular
constituents that have
been measured in a test organism of a species or a test biological specimen
from an
organism of the species. The memory further stores instructions for computing
a model in a
plurality of models. The instructions for computing produce a model
characterization for
the model that indicates whether the test organism of the species or the test
biological
specimen from the organism of the species is a member of a biological sample
class. The
instructions for computing the model comprise characterizing the model using
one or more
aspects of the biological state of one or more cellular constituents in the
plurality of cellular
constituents. The memory further stores instructions for repeating the
instructions for
computing one or more times, thereby computing the plurality of models. The
memory also
stores instructions for communicating each model characterization computed in
an instance
of the instructions for computing. In some embodiments, the instructions for
receiving data
comprise instructions for receiving the data from a remote computer over a
wide area
CA 02540167 2006-03-24
WO 2005/042760 PCT/US2004/032006
network, such as the Internet. In some embodiments, the biological sample
class is a
disease such as cancer.
Another aspect of the invention provides a computer comprising a central
processing
unit and a memory, coupled to the central processing unit. The memory stores
instructions
for receiving data. The data comprises one or more aspects of the biological
state of each
cellular constituent in a plurality of cellular constituents that have been
measured in a test
organism of a species or a test biological specimen from an organism of the
species. The
memory further stores instructions for computing a plurality of models. This
computing
produces a model characterization for each model in the plurality of models
that indicates
whether the test organism of the species or the test biological specimen from
the organism
of the species is a member of a biological sample class. The computing
comprises
characterizing each model in the plurality of models using one or more aspects
of the
biological state of one or more cellular constituents in the plurality of
cellular constituents.
The memory further stores instructions for communicating each model
characterization
computed by the instructions for computing.
Still another aspect of the invention provides a computer program product for
use in
conjunction with a computer system. The computer program product comprises a
computer
readable storage medium and a computer program mechanism embedded therein. The
computer program mechanism further comprises instructions for receiving data.
Such data
comprises one or more aspects of the biological state of each cellular
constituent in a
plurality of cellular constituents that have been measured in a test organism
of a species or a
test biological specimen from an organism of the species. The computer program
mechanism further comprises instructions for computing a model in a plurality
of models.
Such computing produces a model characterization for the model that indicates
whether the
test organism of the species or the test biological specimen from the organism
of the species
is a member of a biological sample class. The computation of the model
comprises
characterizing the model using one or more aspects of the biological state of
one or more
cellular constituents in the plurality of cellular constituents. The computer
program
mechanism further comprises instructions for repeating the instructions for
computing one
or more times, thereby computing the plurality of models. The computer program
mechanism also comprises instructions for communicating each model
characterization
computed in an instance of the instructions for computing.
Still another aspect of the invention comprises a computer program product for
use
in conjunction with a computer system. The computer program product comprises
a
9
CA 02540167 2006-03-24
WO 2005/042760 PCT/US2004/032006
computer readable storage medium and a computer program mechanism embedded
therein.
The computer program mechanism comprises instructions for receiving data. The
data
comprises one or more aspects of the biological state of each cellular
constituent in a
plurality of cellular constituents that have been measured in a test organism
of a species or a
S test biological specimen from an organism of the species. The computer
program
mechanism further comprises instructions for computing a plurality of models.
The
computing produces a model characterization for each model in the plurality of
models that
indicates whether the test organism of the species or the test biological
specimen from the
organism of the species is a member of a biological sample class. The
computing comprises
characterizing each model in the plurality of models using one or more aspects
of the
biological state of one or more cellular constituents in the plurality of
cellular constituents.
The computer program mechanism further comprises instructions for
communicating each
model characterization computed by the instructions for computing.
Another aspect of the invention provides a method that comprises receiving
data.
Such data comprises one or more aspects of the biological state of each
cellular constituent
in a plurality of cellular constituents that have been measured in a test
organism of a species
or a test biological specimen from an organism of the species. A model in a
plurality of
models is computed. The computing produces a model characterization for the
model that
indicates whether the test organism of the species or the test biological
specimen from the
organism of the species is a member of a biological sample class. The
computing of the
model comprises characterizing the model using one or more aspects of the
biological state
of one or more cellular constituents in the plurality of cellular
constituents. The computing
is repeated one or more times thereby computing the plurality of models. Each
of the model
characterization computed in an instance of the computing is then
communicated.
Still another aspect of the invention comprises receiving data. The data
comprises
one or more aspects of the biological state of each cellular constituent in a
plurality of
cellular constituents that have been measured in a test organism of a species
or a test
biological specimen from an organism of the species. A plurality of models is
computed.
Such computing produces a model characterization for each model in the
plurality of
models that indicates whether the test organism of the species or the test
biological
specimen from the organism of the species is a member of a biological sample
class. The
computing comprises characterizing each model in the plurality of models using
one or
more aspects of the biological state of one or more cellular constituents in
the plurality of
cellular constituents. Each computed model characterization communicated.
CA 02540167 2006-03-24
WO 2005/042760 PCT/US2004/032006
4. BRIEF DESCRIPTION OF THE DRAWINGS
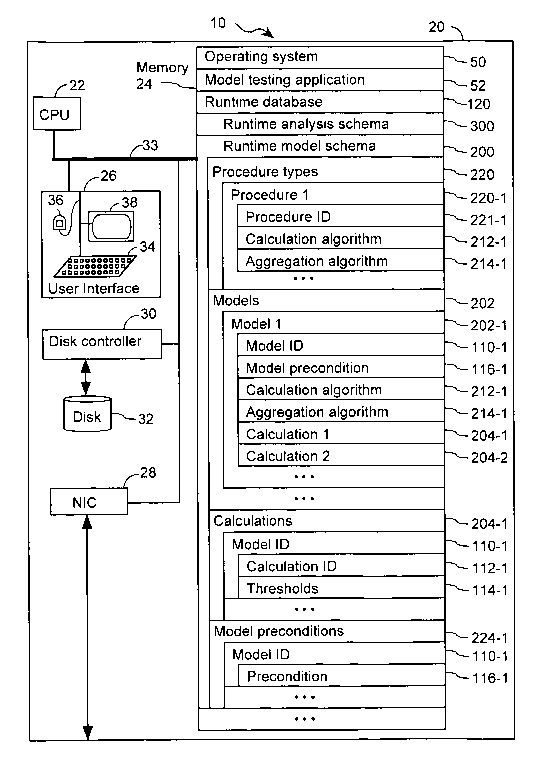
Fig. 1 illustrates a computer system for classifying a biological specimen in
accordance with one embodiment of the present invention.
Fig. 2 illustrates processing steps for using a plurality of classifiers to
classify a
specimen in accordance with one embodiment of the present invention.
Fig. 3 illustrates a data structure that stores a plurality of models
(classifiers) in
accordance with one embodiment of the present invention.
Like reference numerals refer to corresponding parts throughout the several
views of
the drawings.
5. DETAILED DESCRIPTION
Fig. 1 illustrates a system 10 that is operated in accordance with one
embodiment of
the present invention. Figs. 3 illustrate data structures that are useful for
storing data used
in the present invention. Fig. 2 illustrates processing steps used to test a
plurality of models
in accordance with one embodiment of the present invention. Using the
processing steps
outlined in Fig. 2, such models are capable of determining whether a specimen
has one or
more biological features. These figures will be referenced in this section in
order to
disclose the advantages and features of the present invention. Representative
biological
features are disclosed in Section 5.4, below.
System 10 comprises at least one computer 20 (Fig. 1). Computer 20 comprises
standard components including a central processing unit 22, memory 24 for
storing program
modules and data structures, user input/output device 26, a network interface
card 28 for
coupling computer 20 to other computers in system 10 or other computers via a
communication network (not shown), and one or more busses 33 that interconnect
these
components. User input/output device 26 comprises one or more user
input/output
components such as a mouse 36, display 38, and keyboard 34. Computer 20
further
comprises a disk 32 controlled by disk controller 30. Together, memory 24 and
disk 32
store program modules and data structures that are used in the present
invention.
11
CA 02540167 2006-03-24
WO 2005/042760 PCT/US2004/032006
Memory 24 comprises a number of modules and data structures that are used in
accordance with the present invention. It will be appreciated that, at any one
time during
operation of the system, a portion of the modules and/or data structures
stored in memory
24 is stored in random access memory while another portion of the modules
and/or data
structures is stored in non-volatile storage 32. In a typical embodiment,
memory 24
comprises an operating system 50. Operating system SO comprises procedures for
handling
various basic system services and for performing hardware dependent tasks.
Memory 24
further comprises a file system (not shown) for file management. In some
embodiments,
this file system is a component of operating system 50.
Now that an overview of an exemplary computer system in accordance with the
present invention has been detailed, an overview of exemplary data structures
used in
accordance with one embodiment of the present invention is presented below in
Section 5.1.
Then, in Section 5.2, detailed processing steps for testing a plurality of
models using such
exemplary data structures are described. In Section 5.3, examples of the
results provides by
the present invention are provided.
5.1. EXEMPLARY DATA STRUCTURES
Exemplary data structures used in one embodiment of the present invention are
illustrated in Fig. 1. A model testing application 52 uses runtime database
120. Runtime
database 120 is modeled such that it includes a runtime analysis schema 300
and a runtime
model schema 200. These schemas describe the organization of a number of
different types
of tables in runtime database 120. In preferred embodiments, database 120 is
any form of
data storage apparatus, including but not limited to a flat file, a relational
database (SQL),
and an OLAP database (MDX and/or variants thereof). In some specific
embodiments,
database 120 is a hierarchical OLAP cube. In some specific embodiments,
database 120
comprises a star schema that is not stored as a cube but has dimension tables
that define
hierarchy. Still further, in some embodiments, database 120 has hierarchy that
is not
explicitly broken out in the underlying database or database schema (e.g.,
dimension tables
are not hierarchically arranged). In some embodiments, database 120 is a
database in a
format such as Oracle, MS Access 95/97/2000 or better, Informix, Sybase,
Interbase, IBM
DB2, Paradox, dBase, SQL Anywhere, Ingres, MsSQL, MS SQL server, ANSI Level 2,
or
PostgreSQL. In some embodiments, runtime database 120 includes a runtime model
schema 200 and a runtime analysis schema 300.
12
CA 02540167 2006-03-24
WO 2005/042760 PCT/US2004/032006
A fundamental table type specified by runtime model schema 200 is a model 202.
The goal of a model 202 is to attempt to determine the likelihood that a
biological specimen
(e.g., a tumor) has a biological feature (e.g., breast cancer, lung cancer,
etc.). As such, each
model 202 is associated with a biological feature. As used herein, biological
features are
any distinguishable phenotype exhibited by one or more biological specimens.
For
example, in one application of the present invention, each biological feature
refers to an
origin or primary tumor type. It has been estimated that approximately four
percent of all
patients diagnosed with cancer have metastatic tumors for which the origin of
the primary
tumor has not been determined. See, for example, Hillen, 200, Postgrad. Med.
J. 76, p. 690.
On occasion, the primary site for a metastatic tumor is not clearly apparent
even after
pathological analysis. Thus, predicting the primary tumor site of origin for
some of these
cancers represent an important clinical objective. In the case of tumor of
unknown primary
origin, representative biological sample classes include carcinomas of the
prostate, breast,
colorectum, lung (adenocarcinoma and squamous cell carcinoma), liver,
gastroesophagus,
. pancreas, ovary, kidney, and bladder/ureter, which collectively account for
approximately
seventy percent of all cancer-related deaths in the United States. See, for
example, Greenlee
et al., 2001, CA Cancer J. Clin. 51, p. 15. Section 5.4, below, describes
additional
examples of biological sample classes in accordance with the present
invention.
To illustrate how a model 202 can be used to determine the likelihood of
whether a
biological specimen is a member of a biological sample class, consider the
case in which a
particular model 202 represents the likelihood that a biological sample has
lung cancer.
Further hypothesize that this lung cancer model is applied to a biological
specimen and the
result of the test indicates that there is a high likelihood that the
biological specimen has
lung cancer. In some embodiments, each respective model 202 in runtime
database 120
includes a model identifier 110 that uniquely identifies the respective model.
In addition,
each model 202 specifies one or more calculations 204 (also termed tests). In
some
embodiments, a model 202 specifies between two and one thousand calculations.
In more
preferred embodiments, each model 202 specifies between three calculations and
five
hundred calculations, between three calculations and one hundred calculations,
or between
three calculations and fifty calculations.
Each calculation 204 in a model 202 specifies the identity of certain cellular
constituents. For example, in one instance, each respective calculation 204
specifies a first
cellular constituent and a second cellular constituent. To illustrate,
consider the case in
which there are four calculations 204 in a model 202 as described in Table 1:
13
CA 02540167 2006-03-24
WO 2005/042760 PCT/US2004/032006
Table 1: Exemplary calculations 204
Calculation number First cellular constituent Second cellular constituent
1 Gene AAA Gene DDD
2 Gene CCC Gene DDD
3 Gene NNN Gene MMM
4 Gene XXX Gene YYY
Thus, calculation 1 specifies a first cellular constituent AAA and a second
cellular
constituent DDD, and so forth.
In addition to specifying calculations 204, each model 202 specifies a
calculation
algorithm 212 that is to be used to apply each calculation 204 in the model. A
calculation
algorithm 212 specifies the operational relationship between cellular
constituent abundance
values when a calculation 204 in a model 202 is computed. The cellular
constituent
abundance values are taken from a biological specimen that is to be classified
by a model
202.
One instance of a calculation algorithm 212 is a ratio, where the ratio
numerator is
determined by an abundance of a first cellular constituent in a biological
specimen and the
ratio denominator is determined by an abundance of a second cellular
constituent in the
biological specimen. In this instance, the calculation algorithm 212 specifies
that a ratio
between the two cellular constituent abundance values is to be taken whereas
the calculation
204 specifies the actual identity of the cellular constituents in the test
biological specimen
that are to be used when computing the calculation 204 in accordance with the
calculation
algorithm 212. For example, one calculation algorithm 212 specifies to take
the ratio of an
abundance of a first cellular constituent, as the numerator, to the abundance
of a second
cellular constituent, as the denominator. This calculation algorithm 212 is
used in each
calculation 204 in an exemplary model 202. In the case of calculation number 1
of Table 1,
an exemplary calculation algorithm 212 specifies to take the ratio between
gene AAA and
gene DDD, in the case of calculation number 2, the calculation algorithm 212
specifies to
take the ratio between gene CCC and gene DDD, and so forth.
The present invention encompasses a wide range of calculation algorithms 212
in
addition to ratios between a first cellular constituent and a second cellular
constituent. For
example, in some embodiments, a calculation algorithm 212 can specify that the
abundance
value for a first cellular constituent be multiplied by the abundance value
for a second
14
CA 02540167 2006-03-24
WO 2005/042760 PCT/US2004/032006
cellular constituent (A x B). In fact, calculation algorithm 212 can specify
that the product
of the abundance values of the first two cellular constituents be multiplied
by the abundance
value of a third cellular constituent (A x B x C). Alternatively, calculation
algorithm 212
can specify that the product of the abundance values of the first two cellular
constituents be
divided by the abundance value of a third cellular constituent [(A x B) / C)].
As these
examples illustrate, a calculation algorithm is any mathematical operation, or
set of
mathematical operations (e.g., multiplication, division, logarithm, etc.) of
any combination
of cellular constituents. A calculation algorithm 212 does not indicate the
actual identity of
the cellular constituents that are to be used to compute any given calculation
204. A
calculation 204, on the other hand, specifies a set of cellular constituents
but does not
indicate the operational relationship between the cellular constituents that
is used to
compute the calculation 204. By applying a calculation algorithm 212 to a
calculation 204,
the calculation 204 can be computed in accordance with the methods of the
present
invention.
In some embodiments, each respective calculation 204 includes a model
identifier
110 that specifies the model 202 to which the calculation belongs. Further,
each calculation
includes thresholds 114. For example, in some embodiments, each calculation
204 includes
a lower threshold and an upper threshold. In such embodiments, each
calculation 204 in a
model 202 is computed by applying the calculation algorithm 212 for the model
202 to the
calculations as described above. When the computed calculation 204 is below
the lower
threshold the calculation is characterized as negative. When the computed
calculation 204
is above the upper threshold the calculation is characterized as positive.
When the
computed calculation 204 is between the lower threshold and the upper
threshold, the
calculation is characterized as indeterminate. For more information on how
such thresholds
can be computed, as well as more detailed examples of models and their uses in
accordance
with the present invention, see copending United States Patent Application
Serial No.
60/507,381 entitled "Systems and Methods for Analyzing Gene Expression Data
For
Clinical Diagnostics" to Anderson, as well as United States Patent Application
Serial No. to
be determined, entitled "Systems and Methods for Analyzing Gene Expression
Data for
Clinical Diagnostics," to Moraleda and Anderson, filed June 4, 2004.
To illustrate a calculation (test) where upper and lower thresholds are used,
consider
the case of calculation 1 from Table 1, where the abundance of gene AAA
([AAA]) is 1000
and the abundance of DDD ([DDD]) is 100 in a biological specimen. Further,
calculation 1
specifies a lower threshold of 0.8 and an upper threshold is 5. The
calculation algorithm
CA 02540167 2006-03-24
WO 2005/042760 PCT/US2004/032006
212 for the model 202 that includes calculation 1 indicates that a ratio
between the first gene
and second gene is to be taken. When this calculation algorithm 212 is applied
to
calculation 204, the computed calculation, ratio [AAA]/[DDD], has the value 10
(1000/100). Because the ratio is greater than the upper ratio threshold, the
calculation 204
is characterized as "positive."
In another example, [AAA] has a value of 70 in a biological specimen and [DDD]
has a value of 100 in the biological specimen. Further, calculation 1
specifies a lower
threshold of 0.8 and an upper threshold of 5. In such an instance, the ratio
[AAA]/[DDD]
has the value 0.7 (70/100). Because the ratio is less than the lower
threshold, the calculation
is characterized as "negative."
In still another example, [AAA] has a value of 120 in a biological specimen
and
[DDD] has a value of 100 in the biological specimen. Further, calculation 1
specifies a
lower threshold of 0.8 and an upper threshold of 5. In such an instance, the
ratio
[AAA]/[DDD] has the value 1.2 (120/100). Because the ratio is greater than the
lower
threshold but less than the upper threshold, the calculation is characterized
as
"indeterminate."
In addition to a calculation algorithm 212, each model 202 includes an
aggregation
algorithm 214 that specifies how the calculations 204 for a given model 202
are to be
combined in order to characterize (compute) the model. One example of an
aggregation
algorithm 214 is a voting scheme where the model 202 is characterized as
having a high
probability or likelihood if more of the calculations in the model are
positive, when
computed, then are negative. For example, consider the case in which a
calculation
algorithm 212 is applied to the calculations of Table 1, above, and that
calculations 1 and 2
are positive, calculation 3 is indeterminate, and calculation 4 is negative.
When this is the
result, an organism that is tested using the model that consists of the
calculations in Table 1
will be characterized as having a likelihood of having the biological feature
associated with
the model.
Each model 202 optionally includes model preconditions 116. A model
precondition 116 specifies a requirement that is to be satisfied before a
calculation
algorithm 212 is applied to the calculations 204 of the model. An example of a
model
precondition 116 is the requirement that the calculations 204 of another
predetermined
model 202 be computed before the calculations 204 of the model 202 associated
with the
precondition 116 are computed. For example, consider the case in which there
is a model
202 for lung cancer and another model 202 for lung adenocarcinoma. The model
for lung
16
CA 02540167 2006-03-24
WO 2005/042760 PCT/US2004/032006
cancer is used to determine whether a particular tumor is positive for lung
cancer. In this
case, the model 202 for lung adenocarcinoma can have a precondition 116 that
requires that
the model for lung cancer be run before the model for lung adenocarcinoma is
run. The
precondition 116 can further require that the model for lung cancer test
positive before the
model for lung adenocarcinoma is run.
In addition to the model 202 table type, runtime model schema 200 specifies
other
tables in a hierarchical manner. At the top of this hierarchy are procedure
types 220. Each
procedure type 220 specifies a calculation algorithm 212 and an aggregation
algorithm 214.
Furthermore, each procedure type 220 optionally includes a procedure
identifier 221.
One or more models 202 can be associated with a procedure type 220. When a
model 202 is associated with a procedure type 220, the model uses the
calculation algorithm
212 and aggregation algorithm 214 specified by the procedure type 220. In one
example, a
model 202 includes the procedure identifier 221 of a procedure 220 that is to
be used by the
model. In such an example, the model 202 need not include explicit information
about the
calculation algorithm 212 and the aggregation algorithm 214 to be used by the
model
because such information can be obtained from the procedure 220 designated by
the
procedure identifier field 221 in the model 202.
As illustrated in Fig. 1 and discussed above, each model 202 includes one or
more
calculations 204. In fact, in some embodiments, each calculation 204 is stored
in another
form of table that is found in runtime model schema 200. Each calculation 204
specifies
one or more cellular constituent abundance values (not shown). In addition,
each
calculation 204 can optionally include a model identifier 110 that identifies
the model 202
to which the calculation 204 is associated. For example, the model identifier
110 can
indicate that the calculation 204-1 is associated with model 202-1. Further,
each calculation
204 can have a calculation identifier 112 and thresholds 114. In the case
where each
calculation 204 includes a model identified 10, models 202 of runtime database
120 need
not explicitly describe the calculations 204 that are part of such models. If
the calculations
204 for a given model 202 are desired, they can be identified by searching
through the
calculations 204 in runtime database 120 for calculations that have a model
identifier 110
that matches the given model.
As illustrated in Fig. 1 and discussed above, each model 202 includes one or
more
model preconditions 224. In fact, each model precondition 224 is another form
of data
structure that is found in runtime model schema 200. Each precondition 224
specifies a
precondition 116 that is satisfied before the model associated with the
precondition is run.
17
CA 02540167 2006-03-24
WO 2005/042760 PCT/US2004/032006
In addition, each model precondition 224 can optionally include a model
identifier 110 that
identifies the model 202 to which the precondition is associated. For example,
a model
identifier 110 can indicate that a precondition 224-1 is associated with a
model 202-1. In
the case where each precondition 224 includes a model identifier 110, models
202 of
runtime database 120 need not explicitly describe the preconditions 224 that
are part of such
models. In such instances, to determine which preconditions 224 apply to a
given model
202, a search through the preconditions in runtime database 120 for
preconditions that have
a model identifier 110 that matches the given model is made.
5.2. EXEMPLARY PROCESSING STEPS
Exemplary data structures in accordance with one embodiment of the present
invention were introduced in Section 5.1. This section describes how such
novel data
structures can be used to test a plurality of models 202. In Section 5.3,
results of such
calculations will be described.
Step 402.
In step 402 cellular constituent characteristic data is obtained. Typically,
the cellular
constituent characteristic data is in the form of a cellular constituent
abundance data file that
is submitted by a clinician at a remote site. In some instances, when the data
file is
submitted, computer 20 receives the file via network interface card 28. In
typical
embodiments a remote computer transmits the data to computer 20 over a wide
area
network (WAN) such as the Internet.
The cellular constituent characteristic data file typically includes aspects
(also
termed characteristics) of the biological state of each cellular constituent
in a plurality of
cellular constituents. For instance, in some embodiments, the cellular
constituent
characteristic file comprises abundance data for several cellular constituents
in a given
biological specimen or organism. The cellular constituent abundance data file
can include
data for more than one hundred cellular constituents in a given biological
specimen. In fact,
the cellular constituent abundance data file can include data for more than
500, more than
1000, more than 10,000, or more than 15,000 cellular constituents in a given
biological
specimen. In some embodiments, a cellular constituent abundance data file
includes data
for multiple biological specimens. In such embodiments, the data file clearly
indicates
18
CA 02540167 2006-03-24
WO 2005/042760 PCT/US2004/032006
which biological specimen is associated with each cellular constituent
abundance level that
is in the file.
In some embodiments, the cellular constituent characteristic data file is in a
format
designed for Affymetrix (Santa Clara, California) GeneChip probe arrays (e.g.
Affymetrix
chip files with a CHP extension that are generated using Affymetrix MAS4.0
software and
U95A or U133 gene chips), a format designed for Agilent (Palo Alto,
California) DNA
microarrays, a format designed for Amersham (Little Chalfont, England)
CodeLink
microarrays, the ArrayVision file format by Imaging Research (St. Catharines,
Canada), the
Axon (Union City, California) GenePix file format, the BioDiscovery (Marina
del Rey,
California) ImaGene file format, the Rosetta (Kirkland, Washington) gene
expression
markup language (GEML) file format, a format designed for Incyte (Palo Alto,
California)
GEM microarrays, or a format developed for Molecular Dynamics (Sunnyvale,
California)
cDNA microarrays.
In some embodiments, the cellular constituent characteristic file comprises a
processed microarray image for a biological specimen. For example, in one such
embodiment, the file comprises cellular constituent abundance information for
each cellular
constituent represented on the array, optional background signal information,
and optional
associated annotation information describing the probe used for the respective
cellular
constituent. In some embodiments, cellular constituent abundance measurements
are
transcriptional state measurements as described in Section 5.5, below.
In some embodiments of the present invention, aspects (characteristics) of the
biological state, other than the transcriptional state, such as the
translational state, the
activity state, or mixed aspects of the biological state, are represented in a
cellular
constituent characteristic file. See, for example, Section 5.6, below. For
instance, in some
embodiments, the cellular constituent characteristic file includes protein
levels for various
proteins in a biological specimen under study. In some specific embodiments,
the cellular
constituent characteristic file comprises amounts or concentrations of
cellular constituents
in tissues of a biological specimen under study, cellular constituent activity
levels in one or
more tissues of the biological specimen, or the state of modification (e.g.,
phosphorylation)
of one or more cellular constituents of the biological specimen.
In one aspect of the present invention, the expression level of a gene in a
biological
specimen is determined by measuring an amount of at least one cellular
constituent that
corresponds to the gene in one or more cells of a biological specimen under
study. In one
embodiment, the amount of at least one cellular constituent that is measured
comprises
19
CA 02540167 2006-03-24
WO 2005/042760 PCT/US2004/032006
abundances of at least one RNA species present in one or more cells of the
biological
specimen. Such abundances can be measured by a method comprising contacting a
gene
transcript array with RNA from one or more cells of the organism, or with cDNA
derived
therefrom. A gene transcript array comprises a surface with attached nucleic
acids or
nucleic acid mimics. The nucleic acids or nucleic acid mimics are capable of
hybridizing
with the RNA species or with cDNA derived from the RNA species. In one
particular
embodiment, the abundance of the RNA is measured by contacting a gene
transcript array
with the RNA from one or more cells of an organism under study, or with
nucleic acid
derived from the RNA, such that the gene transcript array comprises a
positionally
addressable surface with attached nucleic acids or nucleic acid mimics,
wherein the nucleic
acids or nucleic acid mimics are capable of hybridizing with the RNA species,
or with
nucleic acid derived from the RNA species.
In some embodiments, the cellular constituent characteristic file comprises
gene
expression data for a plurality of genes (or cellular constituents that
correspond to the
plurality of genes). In one embodiment, the plurality of genes comprises at
least five genes.
In another embodiment, the plurality of genes comprises at least one hundred
genes, at least
one thousand genes, at least twenty thousand genes, or more than thirty
thousand genes. In
some embodiments, the plurality of genes comprises between five thousand and
twenty
thousand genes.
In some implementations of step 402, the abundance data is preprocessed. In
some
embodiments, this preprocessing involves a standardization in which all the
cellular
constituent characteristic values for a given biological specimen are divided
by the median
cellular constituent abundance value measured for the biological specimen. In
some
embodiments, all the cellular constituent abundance values for a given
biological specimen
or organism are divided by an average of the 25t" and 75t" percentile of the
cellular
constituent abundance values measured for the biological specimen.
In the case where the source of the cellular constituent abundance
measurements is a
microarray, negative cellular constituent abundance values can be obtained
when a
mismatched probe measure is greater than a perfect match probe. This typically
occurs
when the primary gene (representing a cellular constituent) is expressed at
low levels. In
some representative cases, on the order of thirty percent of the abundance
values in a given
cellular constituent abundance file are negative. In some instances of the
preprocessing of
the present invention, all cellular constituent abundance values with a value
of zero or less
are replaced with a fixed value. In the case where the source of the cellular
constituent
CA 02540167 2006-03-24
WO 2005/042760 PCT/US2004/032006
abundance measurements is an Affymetrix GeneChip MAS 5.0, negative cellular
constituent abundance values can be replaced with a fixed value, such as 20 or
100, in some
embodiments. More generally, in some embodiments, all cellular constituent
abundance
values with a value of zero or less are replaced with a fixed value that is
between 0.001 and
0.5 (e.g., 0.1 or 0.01 ) of the median cellular constituent abundance value
for a given
biological specimen. In some embodiments, all cellular constituent abundance
values are
replaced with a transformation of the value that varies between the median and
zero
inversely in proportion to the absolute value of the cellular constituent
abundance value that
is being replaced. In some embodiments, all cellular constituent abundance
values with a
value less than zero are replaced with a value that is determined based on a
function of the
magnitude of their initial negative value. In some instances, this function is
a sigmoidal
function.
In some embodiments, step 402 is facilitated by a web page that is either on
computer 20 or that is addressable by computer 20. The web page allows a
remote user to
select which models are to be run and facilitates the transfer of the cellular
constituent data
file from the remote site to computer 20. In some embodiments, the web page
allows for
the transfer of any of the following information:
an address of the lab requesting computation of one or models;
an identity of the one or models (suites) that should be run using the
cellular
constituent characteristic data file;
a unique specimen identifier that identifies the specimen submitted;
an identifier that identifies the microarray format used to measure cellular
constituent characteristic data;
an identifier that identifies the patient represented by the cellular
constituent
characteristic data file;
a description of the biological specimen from which cellular constituent
characteristic data was obtained for the cellular constituent characteristic
file; and/or
an identity of a physician or other health care professional that ordered the
models to
be run on the biological specimen.
In some embodiments, rather than, or in addition to, using a web-page based
interface, a software module (not shown) is run on the remote originating
computer. The
software module allows the remote clinician to upload the requisite data to
computer 20
using file transfer protocol, Internet protocol, or other types of file
sharing techniques. In
21
CA 02540167 2006-03-24
WO 2005/042760 PCT/US2004/032006
some embodiments, all communication between computer 20 in step 402 (and in
step 424)
is encrypted using encryption algorithms known in the art such as secret key
cryptography,
hashes, message digests, and/or public key algorithms. Such techniques are
enclosed in, for
example, Kaufman, Network Security, 1995, Prentice-Hall, New Jersey; and
Schneier,
Applied Cryptography: Protocols, Algorithms, and Source Code in C, Second
Edition,
John-Wiley & Sons, Inc., each of which is hereby incorporated by reference in
its entirety.
Steps 404 and 406.
In step 404 a determination is made as to which models 202 should be run
(computed). For example, in some cases, models 202 in runtime database 120 are
divided
into suites of models. In one example, there is a suite of models to test for
cancer of
unknown primary, another suite of models specifically designed to test for
lung cancer, and
so forth. Each suite of models 202 includes one or more models. Thus, in some
instances,
step 404 involves determining which suite of models 202 was requested by a
user. In step
406, a model from the set of models selected in step 404 is selected.
Step 408.
Step 408 is optional. In some embodiments, step 408 is not run and all the
models
specified by the remote user in step 402 (e.g., all models in a selected
suite) are run. In
optional step 408, a determination is made as to whether the model
preconditions 116 have
been satisfied for the model 202 selected in step 406. For example, in some
embodiments, a
model precondition 116 can specify that a model 202 that is indicative of a
broader
biological sample class (e.g., a more general phenotype) than the model
selected in the last
instance of step 406 must be run before a certain model 202, indicative of a
narrower
biological sample class, is run. To illustrate, a model precondition 116 of a
first model 202
that is indicative of a particular form of lung cancer could require that a
second model 202,
that is indicative of lung cancer generally, test positive prior to running
the first model.
Further, the second model 202 could have a model precondition 116 that
requires that a
third model, which is indicative of cancer, test positive prior to running the
second model.
In some embodiments, a model precondition 116 comprises a requirement that
another
model in a plurality of models be identified as negative, positive, or
indeterminate prior to
testing the selected model. A few additional examples of how preconditions 116
can be
used to arrange models 202 into hierarchies follow.
22
CA 02540167 2006-03-24
WO 2005/042760 PCT/US2004/032006
In a first example, the preconditions of model B require that model A have a
specific
result before model B is run. It may well be the case that model A is run, yet
fails to yield
the specific result required by model B. In this case, model B is never run.
If, however,
model A is run and yields the specific result required by model B, then model
B is run.
This example can be denoted as:
if (A = result), then B can be run.
In a second example, the preconditions 116 of model C require that either
model A
has a specific result or that model B has a specific result prior to running
model C. This
example can be denoted as:
if ((A= first result) or (B = second result)), then C can be run.
To illustrate, a model C can require that model A be run and test positive for
cancer or that
model B be run and test positive for lung cancer, before model C is run.
Alternatively, the
preconditions 116 of model C could require that both model A and model B
achieve specific
results:
if ((A= first result) and (B = second result)), then C can be run.
In a another example, the preconditions 116 of model D require that model C
has a
specific result before model D is run. The preconditions 116 of model C, in
turn, require
that model A has a first result and that model B has a second result before
model C is run.
This example can be denoted as:
If ((A= first result) and (B = second result)), then C can be run
If (C=third result), then D can be run.
These examples illustrate the advantages that model preconditions 116 provide.
Because of the novel preconditions 116 of the present invention, models 202
can be
arranged into hierarchies in which specific models 202 are run before other
models 202 are
run. Often, the models 202 run first are designed to classify a biological
specimen into a
broad biological sample class (e.g., broad phenotype). Once the biological
sample has been
23
CA 02540167 2006-03-24
WO 2005/042760 PCT/US2004/032006
broadly classified, subsequent models 202 are run to refine the preliminary
classification
into a narrower biological sample class (e.g., a more specific biological
sample class).
When the model preconditions 116 for a model 202 selected in step 406 have
been
satisfied (408-Yes), process control passes to step 410. When the model
preconditions 116
for the model 202 have not been satisfied (408-No), process control passes
back to step 406
where another model 202 from the set models identified in step 404 is
selected.
Step 410.
A calculation 204 in the model is selected in step 410. A calculation 204
identifies
two or more cellular constituents whose characteristics (aspects of the
biological state of the
cellular constituent) are to be tested in the biological specimen under study.
For example, a
calculation 204 can specify cellular constituent abundance values for genes
AAA and BBB.
In some embodiments, a calculation specifies at least one cellular constituent
that is up-
regulated or down-regulated in specimens that have the biological feature
represented by the
model 202 selected in the last instance of step 406 relative to biological
specimens that do
not have the biological feature represented by model 202 and/or have a
different biological
feature.
Cellular constituents that are up-regulated or down-regulated in specimens
having
certain biological features relative to specimens having other biological
features can be
obtained through routine experimentation or in published references. For
example, Su et al.
2001, Cancer Research 61, p. 7388 provides the names of genes that are both
(i) up-
regulated in specific primary tumor types and (ii) predictive of such tumor
types. Su et al.
identified the expression of the cellular constituents listed in Table 2 with
prostate tumors.
Table 2: Su et al. Cellular constituents that are up-regulated in prostate
tumors.
Number Accession Name Name Description
calcium/calmodulin-dependent
protein
1 NM_003656 CAMK1 kinase I
2 Hs.12784 KIAA0293 KIAA0293 protein
3 NM 001648 KLK3 kallikrein 3, (prostate specific
antigen)
4 NM-005551 KLK2 kallikrein 2, prostatic
5 None TRG@ T cell receptor gamma locus
transcription factor similar
to D.
melanogaster homeodomain
protein
6 NM_006562 LBX1 lady bird late
7 NM 016026 LOC51109 CGI-82 protein
8 NM 001099 ACPP acid phosphatase, prostate
24
CA 02540167 2006-03-24
WO 2005/042760 PCT/US2004/032006
Number Accession Name Name Description
9 NM_005551 KLK2 kallikrein 2, prostatic
None none Antigen ~TIGR==HG2261-HT2352
11 six transmembrane epithelial
antigen
NM 012449 STEAP of the prostate
12 NM 001099 ACPP acid phosphatase, prostate
13 NM 004522 KIFSC kinesin family member SC
14 None none Antigen ~TIGR==HG2261-HT2351
NM_001634 AMD 1 S-adenosylmethionine decarboxylase
1
16 NM-001634 AMD 1 S-adenosylmethionine decarboxylase
1
17 None none Antigen ~TIGR==HG2261-HT2351
18 LIM protein (similar to rat
protein
NM_006457 LIM kinase C-binding enigma)
19 NM 001648 KLK3 Kallikrein 3, (prostate specific
antigen)
In some embodiments, a cellular constituent is deemed to be up-regulated in
specimens having a biological feature when the abundance of the cellular
constituent in
biological specimens having the biological feature is greater than the
abundance of at least
5 sixty percent, at least seventy percent, at least eighty percent or at least
ninety percent of the
cellular constituents in biological specimens having the biological feature
for which a
plurality of cellular constituent abundance measurements have been made. In
some
embodiments, a cellular constituent is deemed to be up-regulated in specimens
having a
biological feature relative to biological specimens that do not have the
biological feature
10 when the abundance of the cellular constituent in biological specimens
having the biological
feature is, on average, higher than the abundance of the cellular constituent
in biological
specimens that do not have the biological feature. In some embodiments, a
cellular
constituent is deemed to be down-regulated in specimens having a biological
feature when
the abundance of the cellular constituent in biological specimens having the
biological
15 feature is less than the abundance of at least forty percent, at least
thirty percent, at least
twenty percent, or at least ten percent of the cellular constituents in
biological specimens
having the biological feature for which a plurality of cellular constituent
abundance
measurements have been made. In some embodiments, a cellular constituent is
deemed to
be down-regulated in biological samples or organisms relative to biological
samples or
organisms that do not have the biological feature when the abundance of the
cellular
constituent in biological specimens that have the biological feature is, on
average, less than
the abundance of the cellular constituent in biological specimens that do not
have the
biological feature.
CA 02540167 2006-03-24
WO 2005/042760 PCT/US2004/032006
In some embodiments, the cellular constituents specified in a calculation 204
are
each a nucleic acid or a ribonucleic acid and the abundance of these cellular
constituents in
a biological specimen is obtained by measuring a transcriptional state of all
or a portion of
the first cellular constituent and the second cellular constituent in the
biological specimen.
In some embodiments, the cellular constituents specified by a calculation 204
are each
independently all or a fragment of an mRNA, a cRNA or a cDNA. In some
embodiments,
the cellular constituents specified by a calculation 204 are each proteins and
the abundance
of these cellular constituents is obtained by measuring a translational state
of all or a portion
of the cellular constituents. In some embodiments, the abundance of the
cellular
constituents specified by a calculation 204 is determined by measuring an
activity or a post-
translational modification of the cellular constituents.
Step 412.
In step 412, the cellular constituent characteristic values specified in the
calculation
204 selected in the last instance of step 410 are obtained from the cellular
constituent
characteristic submitted in step 402. Thus, in the example where calculation
204 specifies
gene AAA and gene BBB, the cellular constituent abundance values (or some
other
characteristic specified by the calculation) for gene AAA and gene BBB are
obtained from
the cellular constituent abundance file.
Step 414.
In step 414, the calculation 204 selected in the last instance of step 410 is
computed
in accordance with the calculation algorithm 212 specified in the model. For
example, the
calculation algorithm can specify to take the ratio between the abundance
values of the first
cellular constituent specified in an exemplary calculation 204 and the second
cellular
constituent specified in an exemplary calculation 204. Additional examples of
computing
calculations 204 in accordance with a calculation algorithm 214 have been
described in
Section 5.1, above. These examples describe how a calculation 204 can be
characterized
after it has been computed based on the value of the computed calculation
relative to
threshold values for the calculation. For example, if the computed calculation
204 has a
value that is greater than the true minimum for the calculation, then the
computed
calculation 204 is characterized as positive.
26
CA 02540167 2006-03-24
WO 2005/042760 PCT/US2004/032006
Step 416.
In step 416, results of the computation of the last calculation 204 are
stored. In
some embodiments, storage includes the storage of a model identifier that
identifies the
model 202 for which the calculation 204 was run, a model version identifier
that indicates
which version of the model 202 was run, an expression datafile identifier that
identifies the
cellular constituent characteristic data file that supplied the cellular
constituent
characteristic values used to compute the calculation 204, the calculation
identifier 112 (Fig.
1) associated with the calculation 204, and the calculation result code (e.g.,
"extremely
likely", "not likely", etc.).
Step 418.
In step 418 a determination is made as to whether all the calculations 204 in
the
model 202 have been computed in accordance with the calculation algorithm 212
for the
model. If not (418-No), process control returns to step 410 where another
calculation (test)
202 is selected from the model 202 for computation. If so (418-Yes), network
control
passes to step 420.
Step 420.
In step 420, all calculations (tests) 204 that have been made for the model
selected in
the last instance of step 406 are aggregated in accordance with the
aggregation algorithm
214 specified by the model 202. Such aggregation results in a model
characterization for
the model. This model characterization indicates whether the test organism of
the species or
the test biological specimen from the organism of the species is a member of a
biological
sample class.
In one embodiment, the result code of each row in table 318 with a model
identifier
matching the model identifier for the model 202 selected in the last instance
of step 406 is
collected. For example, consider the case in which a model 202 includes five
calculations
204. Each calculation 204 has been computed in an instance of step 414 and the
result is
stored. In the case where threshold values are associated with each
calculation 204, the
result for a calculation can be an indication as to whether the calculation is
positive,
negative, or indeterminate.
Consider the case where a model 202 includes five calculations (tests) 204.
There
will be five rows in calculation results table 318, one for each of the five
calculations 204.
Each of these five rows will include a result code. In this user case
scenario, each result
27
CA 02540167 2006-03-24
WO 2005/042760 PCT/US2004/032006
code is either positive, negative, or indeterminate. Next, the aggregation
algorithm
associated with the model 202 will specify how these five result codes are to
be combined
in order to characterize the model 202. For instance, the aggregation
algorithm can specify
that the five result codes are to be combined in a voting scheme where the
model 202 is
considered positive (characterized as positive) if more of the computed
calculations in the
model are positive than are negative.
One example of an aggregation algorithm 214 is a voting scheme where the model
202 is characterized as positive if more of the calculations in the model are
positive, when
computed, than are negative. For example, consider the case in which a
calculation
algorithm 212 is applied to the calculations of Table 1, above, and that
calculations 1 and 2
are positive, calculation 3 is indeterminate, and calculation 4 is negative.
When this is the
result, a model that consists of the calculations in Table 1 will be
characterized as positive.
However, in some embodiments of the present invention, a weighting scheme can
be used
where each positive calculation in a model is given a different weight than
each negative
1 S calculation in the model. For example, each positive calculation in a
model can be given a
weight of 3.0 and each negative calculation in a model can be given a weight
of 1Ø In this
weighting scheme, a model will be characterized as positive even when the
model consists
of one positive calculation and two negative calculations.
In preferred embodiments, each characterized model yields a likelihood that a
biological specimen or organism has a biological feature represented by the
model. This
likelihood represents a model score for the computed model. In other words,
each
characterized model produces a model characterization (e.g., model score) that
indicates
whether a test organism of a species or a test biological specimen from the
organism of a
species is a member of a biological sample class. In some embodiments, the
higher a model
score, the more likely it is that the biological specimen or organism whose
cellular
constituent values were used to compute the model (i) has the biological
feature represented
by the model or (ii) is a member of the biological sample class represented by
the model. In
some embodiments, a model determines whether it is extremely likely, likely,
indeterminate, not likely, or very unlikely that a biological specimen or
organism has the
biological feature associated with the model or is a member of a biological
sample class
represented by the test. In some embodiments, the biological feature
represented by a
model is sensitivity and/or resistance to a therapy combination. In some
embodiments, the
biological feature represented by a model is metastatic potential of a
particular disease
and/or likelihood of recurrence of the disease in a biological organism. In
some
28
CA 02540167 2006-03-24
WO 2005/042760 PCT/US2004/032006
embodiments, the biological sample class represented by a model is a cancer
and/or any of
the exemplary biological features represented in Section 5.4. In embodiments
that track
likelihood of recurrence of the disease, a model may score as "sensitive",
"low risk", or
"high risk", etc. In embodiments that track metastatic potential of a disease,
a model may
score as "malignant", "inconclusive", or "non malignant", etc. In embodiments
that
evaluate aggressiveness of a disease, a model may score as "aggressive",
"inconclusive", or
"indolent", etc.
Steps 422 and 424.
In step 422, a determination is made as to whether all the models in the set
of
models that are to be run (computed) on a given cellular constituent abundance
file have
been run. If not (422-No) process control returns to step 406 where another
model 202 is
selected. If all the models have been run, then the results are reported (step
424). In some
embodiments, the results that are reported are a characterization of each
model in a plurality
of models.
In typical embodiments, the results that are reported are a characterization
of each
model 202 in the set of models that have been run. Each respective model 202
that has been
run is characterized in accordance with the respective aggregation algorithm
214 for the
model. In typical embodiments, results are reported to the remote client
computer that
submitted the original cellular constituent abundance file. Exemplary reports
made in step
424 are described in Section 5.3.
5.3. EXEMPLARY RESULTS
In some embodiments, the report provided in step 424 is sent from computer 20
to a
remote computer that originated the cellular constituent characteristic data
file in step 402 of
Fig. 4. In some embodiments, the report has a header that provides the
following
information:
an address of the lab requesting computation of one or models;
a unique order identifier for the request;
a unique specimen identifier that identifies the specimen submitted;
an identifier that identifies the microarray format used to measure cellular
constituent characteristic data;
29
CA 02540167 2006-03-24
WO 2005/042760 PCT/US2004/032006
a date the cellular constituent characteristic data file was submitted to
computer 20
in step 402;
a date the report of step 424 was generated;
an identifier that identifies the patient represented by the cellular
constituent
characteristic data file;
a description of the biological specimen from which cellular constituent
characteristic data was obtained for the cellular constituent characteristic
file; and/or
an identity of a physician or other health care professional that ordered the
models to
be run on the biological specimen.
Tables 3 and 4 below collectively represent an example of a report that is
provided
for a prostate suite of models. Each row in Tables 3 and 4 represent a
different model. In
Table 3, each reported model has a clinical test name that provides an
indication of what the
model tests, one or more references to a research article (or other form of
clinical test) that
provides the scientific basis for selection of cellular constituents to test
the mode, a model
result, and a clinical description of the model result. Table 3 provides
models that indicate
either (i) the degree of likelihood that a patient will suffer from a
recurrence of prostate
cancer or (ii) the sensitivity of the patient to a particular form of
treatment. Table 4 differs
from Table 3 in that each row (model) of Table 4 represents a confirmation
test that
confirms whether or not a patient has prostate cancer.
30
CA 02540167 2006-03-24
WO 2005/042760 PCT/US2004/032006
Table 3. Prostate cancer suite / clinical tests.
CLINICAL TESTS REFERENCE RESULT DESCRIPTION
Androgen Ablation-Holzbeierlein- SensitiveExpression signature
resistance Gerald2004 inconsistent with
androgen ablation-
resistance
Likelihood of LaTulippe- Low risk Expression signature
Recurrence Gerald2002 consistent with
low
risk of recurrence
Likelihood of SinglySellers2002 Low risk Expression signature
Recurrence consistent with
low
risk of recurrence
Likelihood of Febbo-Sellers2003 Low risk Expression signature
Recurrence consistent with
low
risk of recurrence
Likelihood of Henshall- Low risk Expression signature
Recurrence Sutherland2003 consistent with
low
risk of recurrence
Likelihood of Lapointe-Pollack2004Low risk Expression signature
Recurrence consistent with
low
risk of recurrence
Table 4. Prostate cancer suite / confirmation tests.
CONFIRMATION REFERENCE RESULT DESCRIPTION
TESTS
Benign vs. MalignantErnst- Malignant Expression signature
Grone2002 consistent with
malignant cells
Benign vs. MalignantWelsh- InconclusiveExpression signature
Hampton2001 inconclusive with
respect to malignancy
Benign vs. MalignantMagee- Malignant Expression signature
Milbrandt2001 consistent with
malignant cells
Site of Origin: Su- Prostate Expression signature
Prostate
Hampton2001 consistent with
primary prostate
carcinoma.
Tables 5 and 6 describe chemosensitivity models that are found in another type
of report
that is sent in step 424 in another instance of the present invention.
31
CA 02540167 2006-03-24
WO 2005/042760 PCT/US2004/032006
Table 5. Chemosensivity model report.
CHEMOSENSITIVITY REFERENCE RESULT DESCRIPTION
TESTS
Vinca alkaloid: Gene expression consistent
Camptothecin PathWork2004 Sensitive with camptothecin
sensitivity
Vinca alkaloid: Gene expression consistent
Irinotecan PathWork2004 Sensitive with irinotecan sensitivity
Vinca alkaloid: Gene expression consistent
Vincristine PathWork2004 Resistant with vincristine resistance
Vinca alkaloid: Gene expression consistent
Vinblastine PathWork2004 Resistant with vinblastine resistance
Taxane: Paclitaxel PathWork2004 Resistant Gene expression consistent
with paclitaxel resistance
Taxane: Docetaxel PathWork2004 Sensitive Gene expression consistent
with docetaxel sensitivity
Antibiotic: Actinomycin Gene expression consistent
D PathWork2004 Resistant with actinomycin D
resistance
Antibiotic: Bleomycin PathWork2004 Resistant Gene expression consistent
with bleomycin resistance
Gene expression consistent
Antibiotic: Mitomycin C PathWork2004 Resistant with mitomycin C
resistance
Anthracycline: Gene expression consistent
Doxorubicin PathWork2004 Resistant with doxorubicin
resistance
Anthracycline: Gene expression consistent
Daunorubicin PathWork2004 Resistant with daunorubicin
resistance
Antimetabolite: Gene expression consistent
Methotrexate pathWork2004 Resistant with methotrexate
resistance
Antimetabolite: 5- Gene expression consistent
fluorouracil PathWork2004 Sensitive with 5-fluorouracil
sensitivity
Antimetabolite: pathWork2004 Resistant Gene expression consistent
Cytarabine with cytarabine resistance
Antimetabolite: Gene expression consistent
Gemcitabine pathWork2004 Sensitive with gemcitabine
sensitivity
Antimetabolite: 6- Gene expression consistent
thioguanine PathWork2004 Resistant with 6-thioguanine
resistance
Antimetabolite: 6- Gene expression consistent
mercaptopurine PathWork2004 Resistant with 6-mercaptopurine
resistance
32
CA 02540167 2006-03-24
WO 2005/042760 PCT/US2004/032006
Table 6. Chemosensivity Model.
CHEMOSENSITIVITY REFERENCE RESULT DESCRIPTION
TESTS
DNA alkylator: Cisplatin PathWork2004 Sensitive Gene expression consistent
with cisplatin sensitivity
Interferon: Interferon-a PathWork2004 Resistant Gene expression consistent
with interferon-a resistance
Gene expression consiste t
Interferon: Interferon-(3 PathWork2004 Resistant with interferon-(3
resistan~C~
Interferon: Interferon-y PathWork2004 Resistant Gene expression consistent
with interferon-y resistance
Gene expression consiste~~
Other: STI 571 PathWork2004 Resistant
with STI 571 resistance
Gene expression consistent
Other: L-asparaginase PathWork2004 Resistant with L-asparaginase
resistance
Tables 7 and 8 describe colorectal models that are found in another type of
report that is
sent in step 424 in another instance of the present invention.
25 Table 7. Colorectal model report.
CLINICAL TESTS REFERENCE RESULT DESCRIPTION
Chemosensitivity: Takeshi- Resistant Expression signature
SFU
Fukushima2001 consistent with SFU
resistant
cancers
Chemosensitivity: Farrugia- Sensitive Expression signature
SFU/RTX Jackman2003 consistent with SFU/RTX
sensitive cancers
Chemosensitivity: Mariadason- Sensitive Expression signature
SFU/CPT Augenlicht2003 consistent with SFU/CPT
sensitive cancers
Chemosensitivity: Huerta- InconclusiveExpression signature
cisplatin Heber2003 inconclusive with
respect to
cisplatin sensitivity
Metastatic PotentialLi- Low risk Expression signature
Furukawa2004 consistent with low
risk for
metastasis
Metastatic PotentialHedge- Low risk Expression signature
Quakenbush200 consistent with low
risk for
1 metastasis
33
CA 02540167 2006-03-24
WO 2005/042760 PCT/US2004/032006
Table 8. Colorectal model report.
CONFIRMATION REFERENCE RESULT DESCRIPTION
TESTS
Benign vs. MalignantYamamoto- MalignantExpression signature
consistent
Imai2002 with malignancy
Zou- InconclusiExpression signature
Benign vs. MalignantM ve inconclusive with respect
2002 to
lt
e malignancy
zer
Adenoma vs. Lin- CarcinomaExpression signature
consistent
Carcinoma Nakamura2002 with carcinoma
Adenoma vs. Notterman- Expression signature
Carcinomaconsistent
Carcinoma Levine2001 with carcinoma
Site of Origin: Su- Expression signature
consistent
Colorectal Hampton2001 Colorectalwith primary colorectal
carcinoma.
Table 9 describes a site of origin suite of models that is found in another
type of report that
S is sent in step 424 in another embodiment of the present invention.
Table 9. Site of origin report.
PREDICTIVE SIGNIFICANCE
SITE OF ORIGIN PATHWORK
INDEX LOW HICI-I
Colorectum +32
Lung +12
Stomach -42
Liver -42
Kidney -88
Breast -88
Ovary -88
Bladder -88
Pancreas -100
Prostate -100
34
CA 02540167 2006-03-24
WO 2005/042760 PCT/US2004/032006
5.4. EXEMPLARY BIOLOGICAL FEATURES
The present invention can be used to develop models that determine whether a
biological specimen has any of a plurality of biological features. In other
words, the present
invention can be used to develop models that indicate whether a test organism
of a species
or a test biological specimen from an organism of a species is a member of a
biological
sample class. A broad array of biological features (e.g. biological sample
classes) is
contemplated. In one example, two respective biological features are (i) a
wild type state
and (ii) a diseased state. In another example two respective biological
features are (i) a first
diseased state and a second diseased state. In still another example, two
respective
biological features are (i) a drug respondent state and (ii) a drug
nonrespondent state. In
such instances, a first model 202 tests for the absence or presence of the
first biological
sample feature and a second model 202 tests for the absence or presence of the
second
biological feature. The present invention is not limited to instances where a
sample is tested
for the absence or presence of only two biological features. Indeed any number
of
biological features (e.g., one biological feature, two or more biological
features, between
three and ten biological features, between five and twenty biological
features, more than
twenty-five biological features, etc.) can be tested using the methods,
computers, and
computer program products of the present invention. In such instances, a
different' model
202 is typically used to test for the presence or absence of each such
biological feature (e.g.,
to determine whether the specimen is a member of biological sample class
characterized by
the presence of the feature or is, alternatively, a member of a biological
sample class
characterized by the absence of the feature). In some embodiments, multiple
models test for
the absence or presence of the same biological features. In other words,
multiple models
test to determine whether a biological sample is a member of a particular
biological sample
class. This section describes exemplary biological features. Organisms a given
biological
feature can be considered members of a corresponding biological sample class.
5.4.1 BREAST CANCER
Pusztai et al. Several different adjuvant chemotherapy regimens are used in
the
treatment of breast cancer. Not all regimens may be equally effective for all
patients.
Currently it is not possible to select the most effective regimen for a
particular individual.
One accepted surrogate of prolonged recurrence-free survival after
chemotherapy in breast
CA 02540167 2006-03-24
WO 2005/042760 PCT/US2004/032006
cancer is complete pathologic response (pCR) to neoadjuvant therapy. Pusztai
et al., ASCO
2003 abstract 1 report the discovery of a gene expression profile that
predicts pCR after
neoadjuvant weekly paclitaxel followed by FAC sequential chemotherapy (T/FAC).
The
Pusztai et al. predictive markers were generated from fine needle aspirates of
24 early stage
breast cancers. Six of the 24 patients achieved pCR (25 percent). In Pusztai
et al., RNA
from each sample were profiled on cDNA microarrays of 30,000 human
transcripts.
Differentially expressed genes between the pCR and residual disease (RD)
groups were
selected by signal-to-noise-ratio. Several supervised learning methods were
evaluated to
define the best class prediction algorithm and the optimal number of genes
needed for
outcome prediction using leave-one out cross validation. A support vector
machine using
five genes (3 ESTs, nuclear factor 1/A, and histone acetyltransferase) yielded
the greatest
estimated accuracy. This predictive marker set was tested on independent cases
receiving
T/FAC neoadjuvant therapy. Pusztai et al. reported results for 21 patients
included in the
validation. The overall accuracy of the Pusztai et al. response prediction
based on gene
expression profile was 81 percent. The overall specificity was 93 percent. The
sensitivity
was 50 percent (three of the six pCR were misclassified as RD). Pusztai et al.
found that
patients predicted to have pCR to T/FAC preoperative chemotherapy had a 75
percent
chance of experiencing pCR compared to 25-30 percent that is expected in
unselected
patients. The Pusztai et al. findings can be used to build a model 202 that
can then be used
to help physicians to select individual patients who are most likely to
benefit from T/FAC
adjuvant chemotherapy.
Cobleigh et al. Breast cancer patients with ten or more positive nodes have a
poor
prognosis, yet some survive long-term. Cobleigh et al., ASCO 2003 abstract
3415 sought to
identify predictors of distant disease-free survival (DDFS) in this high risk
group of
patients. Patients with invasive breast cancer and ten or more positive nodes
diagnosed
from 1979 to 1999 were identified. RNA was extracted from three 10 micron
sections and
expression was quantified for seven reference genes and 185 cancer-related
genes using RT-
PCR. The genes were selected based on the results of published literature and
microarray
experiments. A total of 79 patients were studied. Fifty-four percent of the
patients received
hormonal therapy and eighty percent received chemotherapy. Median follow-up
was 15.1
yrs. As of Aug. 2002, 77 percent of patients had distant recurrence or breast
cancer death.
Univariate Cox survival analysis of the clinical variables indicated that the
number of nodes
involved was significantly associated with DDFS (p=0.02). Cobleigh et al.
applied a
multivariate model including age, tumor size, involved nodes, tumor grade,
adjuvant
36
CA 02540167 2006-03-24
WO 2005/042760 PCT/US2004/032006
hormonal therapy, and chemotherapy that accounted for 13 percent of the
variance in DDFS
time. Univariate Cox survival analysis of the 185 cancer-related genes
indicated that a
number of genes were associated with DDFS (5 with p<0.01; 16 with p<0.05).
Higher
expression was associated with shorter DDFS (p<0.01) for the HER2 adaptor Grb7
and the
macrophage marker CD68. Higher expression was associated with longer DDFS
(p<0.01)
for TP53BP2 (tumor protein p53-binding protein 2), PR, and Bcl2. A
multivariate model
including five genes accounted for 45 percent of the variance in DDFS time.
Multivariate
analysis also indicated that gene expression is a significant predictor after
controlling for
clinical variables. The Cobleigh et al. findings can be used to build a model
202 that can
then be used to help determine which patients are likely associated with DDFS
and that are
not likely associated with DDFS.
van't Veer. Breast cancer patients with the same stage of disease can have
markedly
different treatment responses and overall outcome. Predictors for metastasis
(a poor
outcome), lymph node status and histological grade, for example fail to
classify accurately
breast tumors according to their clinical behavior. To address this
shortcoming van't Veer
2002, Nature 415, 530-535, used DNA microanalysis on primary breast tumors of
117
patients, and applied supervised classification to identify a gene expression
signature
strongly predictive of a short interval to distant metastases ('poor
prognosis' signature) in
patients without tumor cells in local lymph nodes at diagnosis (lymph node
negative). In
addition van't Veer established a signature that identifies tumors of BRCA1
carriers. The
van't Veer findings can be used to build a model 202 that can then be used to
help
determine patient prognosis.
Other references. A representative sample of additional breast cancer studies
that
can be used to build models 202 for detecting breast cancer include, but are
not limited to,
Soule et al., ASCO 2003 abstract 3466; Ikeda et al., ASCO 2003 abstract 34;
Schneider et
al., 2003, British Journal of Cancer 88, p. 96; Long et al. ASCO 2003 abstract
3410; and
Chang et al., 2002, PeerView Press, Abstract 1700, "Gene Expression Profiles
for
Docetaxel Chemosensitivity."
5.4.2 LUNG CANCER
Rosell-Costa et al. ERCCl mRNA levels correlate with DNA repair capacity
(DRC) and clinical resistance to cisplatin. Changes in enzyme activity and
gene expression
37
CA 02540167 2006-03-24
WO 2005/042760 PCT/US2004/032006
of the M1 or M2 subunits of ribonucleotide reductase (RR) are observed during
DNA repair
after gemcitabine damage. Rosell-Costa et al., ASCO 2003 abstract 2590
assessed ERCC 1
and RRM1 mRNA levels by quantitative PCR in RNA isolated from tumor biopsies
of 100
stage IV (NSCLC) patients included in a trial of 570 patients randomized to
gem/cis versus
gem/cis/vrb vs gem/vrb followed by vrb/ifos (Alberola et al. ASCO 2001
abstract 1229).
ERCC1 and RRM1 data were available for 81 patients. Overall response rate,
time to
progression (TTP) and median survival (MS) for these 81 patients were similar
to results for
all 570 patients. A strong correlation between ERCC1 and RRM1 levels was found
(P=0.00001). Significant differences in outcome according to ERCC1 and RRM1
levels
were found in the gem/cis arm but not in the other arms. In the gem/cis arm,
TTP was 8.3
months for patients with low ERCC 1 and 5.1 months for patients with high ERCC
1
(P=0.07), 8.3 months for patients with low RRM1 and 2.7 months for patients
with high
RRM 1 (P=0.01 ), 10 months for patients with low ERCC 1 & RRM 1 and 4.1 months
for
patients with high ERCC 1 & RRM 1 (P=0.009). MS was 13.7 months for patients
with low
ERCC 1 and 9.5 months for patients with high ERCC 1 (P=0.19), 13.7 months for
patients
with low RRM1 and 3.6 months for patients with high RRM1 (P=0.009), not
reached for
patients with low ERCC 1 & RRM 1 and 6.8 months for patients with high ERCC 1
& RRM 1
(P=0.004). Patients with low ERCC1 and RRMI levels, indicating low DRC, are
ideal
candidates for gem/cis, while patients with high levels have poorer outcome.
Accordingly,
ratios that include ERCCl & RRM1 can be used to build models 202 that
determine what
kind of therapy should be given to lung cancer patients.
Hayes et al. Despite the high prevalence of lung cancer, a robust
stratification of
patients by prognosis and treatment response remains elusive. Initial studies
of lung cancer
gene expression arrays have suggested that previously unrecognized subclasses
of
adenocarcinoma may exist. These studies have not been replicated and the
association of
subclass with clinical outcomes remains incomplete. For the purpose of
comparing
subclasses suggested by the three largest case series, their gene expression
arrays
comprising 366 tumors and normal tissue samples were analyzed in a pooled data
set by
Hayes et al., ASCO 2003 abstract 2526. The common set of expression data was
re-scaled
and gene filtering was employed to select a subset of genes with consistent
expression
between replicate pairs yet variable expression across all samples.
Hierarchical clustering
was performed on the common data set and the resultant clusters compared to
those
proposed by the authors of the original manuscripts. In order to make direct
comparisons to
38
CA 02540167 2006-03-24
WO 2005/042760 PCT/US2004/032006
the original classification schemes, a classifier was constructed and applied
to validation
samples from the pool of 366 tumors. In each step of the analysis, the
clustering agreement
between the validation and the originally published classes was statistically
significant. In
an additional validation step, the lists of genes describing the originally
published
subclasses were compared across classification schemes. Again there was
statistically
significant overlap in the lists of genes used to describe adenocarcinoma
subtypes. Finally,
survival curves demonstrated one subtype of adenocarcinoma with consistently
decreased
survival. The Hayes et al. analyses helps to establish that reproducible
adenocarcinoma
subtypes can be described based on mRNA expression profiling. Accordingly the
results of
Hayes et al. can be used to build models 202 that can be used to identify
adenocarcinoma
subtypes.
5.4.3 PROSTATE CANCER
Li et al. Taxotere shows anti-tumor activity against solid tumors including
prostate
cancer. However, the molecular mechanisms) of action of Taxotere have not been
fully
elucidated. In order to establish the molecular mechanism of action of
Taxotere in both
hormone insensitive (PC3) and sensitive (LNCaP) prostate cancer cells
comprehensive gene
expression profiles were obtained by using Affymetrix Human Genome U133A
array. See
Li et al. ASCO 2003 abstract 1677. The total RNA from cells untreated and
treated with 2
nM Taxotere for 6, 36, and 72 hours was subjected to microarray analysis and
the data were
analyzed using Microarray Suite and Data Mining, Cluster and TreeView, and
Onto-express
software. The alternations in the expression of genes were observed as early
as six hours,
and more genes were altered with longer treatments. Additionally, Taxotere
exhibited
differential effects on gene expression profiles between LNCaP and PC3 cells.
A total of
166, 365, and 1785 genes showed >2 fold change in PC3 cells after 6, 36, and
72 hours,
respectively compared to 57, 823, and 964 genes in LNCaP cells. Li et al.
found no effect
on androgen receptor, although up-regulation of several genes involved in
steroid-
independent AR activation (IGFBP2, FGF13, EGFB, etc) was observed in LNCaP
cells.
Clustering analysis showed down-regulation of genes for cell proliferation and
cell cycle
(cyclins and CDKs, Ki-67, etc), signal transduction (IMPA2, ERBB2IP, etc),
transcription
factors (HMG-2, NFYB, TRIP13, PIR, etc), and oncogenesis (STK15, CHK1,
Survivin,
etc.) in both cell lines. In contrast, Taxotere up-regulated genes that are
related to induction
39
CA 02540167 2006-03-24
WO 2005/042760 PCT/US2004/032006
of apoptosis (GADD45A, FasApo-1, etc), cell cycle arrest (p21CIP1, p27KIP1,
etc) and
tumor suppression. From these results, Li et al. concluded that Taxotere
caused alterations
of a large number of genes, many of which may contribute to the molecular
mechanisms)
by which Taxotere affects prostate cancer cells. This information could be
further exploited
to devise strategies to optimize therapeutic effects of Taxotere for the
treatment of
metastatic prostate cancer.
Using the results described in this section, models 202 that stratify patients
into
groups that will have a varying degree of response to Taxotere and related
treatment
regimens (e.g. a first biological feature that is highly responsive to
Taxotere, a second
biological feature that is not responsive to Taxotere, etc.) can be developed.
In another
approach, biological features can be developed based, in part, on Cox-2
expression in order
to serve as a survival predictor in stage D2 prostate cancer.
5.4.4 COLORECTAL CANCER
Kwon et al. To identify a set of genes involved in the development of
colorectal
carcinogenesis, Kwon et al. ASCO 2003 abstract 1104 analysed gene-expression
profiles of
colorectal cancer cells from twelve tumors with corresponding noncancerous
colonic
epithelia by means of a cDNA microarray representing 4,608 genes. Kwon et al.
classified
both samples and genes by a two-way clustering analysis and identified genes
that were
differentially expressed between cancer and noncancerous tissues. Alterations
in gene
expression levels were confirmed by reverse-transcriptase PCR (RT-PCR) in
selected genes.
Gene expression profiles according to lymph node metastasis were evaluated
with a
supervised learning technique. Expression change in more than 75 percent of
the tumors
was observed for 122 genes, i.e., 77 up-regulated and 45 down-regulated genes.
The most
frequently altered genes belonged to functional categories of signal
transduction (19
percent), metabolism (17 percent), cell structure/motility (14 percent), cell
cycle (13
percent) and gene protein expression (13 percent). The RT-PCR analysis of
randomly
selected genes showed consistent findings with those in cDNA microarray. Kwon
et al.
could predict lymph node metastasis for 10 out of 12 patients with cross-
validation loops.
The results of Kwon et al. can be used to develop a model 202 for determining
whether a
patient has colorectal cancer. Furthermore, the results of Kwon et al. can be
extended to
identify subclasses of colorectal cancer.
CA 02540167 2006-03-24
WO 2005/042760 PCT/US2004/032006
Additional studies that can be used to develop models 202 for colorectal
cancer
(including models that identify a biological specimen as having colorectal
cancer and
possibly additional models that predict subgroups of colorectal cancer)
include, but are not
limited to Nasir et al., 2002, In Vivo. 16, p. 501 in which research that
finds elevated
expression of COX-2 has been associated with tumor induction and progression
is
summarized, as well as Longley et al., 2003 Clin. Colorectal Cancer. 2, p.
223; McDermott
et al., 2002, Ann Oncol. 13, p. 235; and Longley et al., 2002,
Pharmacogenomics J. 2, p.
209.
5.4.5 OVARIAN CANCER
Shemzo.s et al. To identify expression profiles associated ~vitb clinical
outcomes in
epithelial ovarian cancer (EOC), Spentzos et al. ASC~O 2003 abstract 1800
evaluated 38
tumor samples from patients with EOC receiving :7.rst-line platinum/taxane-
based
chemotherapy. RNA probes were reverse-transcribed, fluorescent-labeled. and
hybridized
to oligonucleotide arrays containing 12675 human genes and expressed sequence
tags.
Expression data were analyzed for signatures predictive of chemoscnsitivity,
disease-free
survival (DFS) and overall survival (OS). A l3ayesian model was used to sort
the genes
according to their probability of differential expression between tumors of
different
chemosensitivity and survival. Genes with the highest probabiliy of being
differentially
expressed between tumor subgroups with different outcome were included in the
respective
signah.~re. Spentzos et al. found one set of genes that were overexpressed in
chemoresistant
tumors and another set of genes that were ovcrexpressed in chemosensitive
tumors.
Spentzos el cal. found 45 genes that were c>verexpressed in tumors associated
with short
disease free survival (DFS) and 18 genes that were overexpressed in llunors
associated with
long DFS. These genes separated the patient population into two groups with
median DFS
of 7.5 and 30.5 months (p< 0.00001 ). Spentzos et crl. found 20 genes that
were
overexpressed in tumors with short overall survival (OS) and 29 genes that
were
overexpressed in genes with long OS (median OS of 22 and 40 months,
p=0.00008). 'fhe
overexpressed genes identified by Spenlzvs et al. c.an be used to build models
202 that
classify a biological specimen into biological classes such as chcmorcsistant
ovarian cancer,
chemosensitive ovarian cancer, short DFS ovarian cancer, long DFS ovarian
cancer, short
OS ovarian cancer and long OS ovarian cancer.
41
CA 02540167 2006-03-24
WO 2005/042760 PCT/US2004/032006
Additional studies that can be used to develop models 202 for ovarian cancer
include, but are not limited to, Presneau et al., 2003, Oncogene 13, p. 1568;
and Takano et
al. ASCO 2003 abstract 1856.
5.4.6 BLADDER CANCER
Wulfing et al. Cox-2, an inducible enzyme involved in arachidonate metabolism,
has been shown to be commonly overexpressed in various human cancers. Recent
studies
have revealed that Cox-2 expression has prognostic value in patients who
undergo radiation
or chemotherapy for certain tumor entities. In bladder cancer, Cox-2
expression has not
been well correlated with survival data is inconsistent. To address this,
Wulfing et al.
ASCO 2003 abstract 1621 studied 157 consecutive patients who had all undergone
radical
cystectomy for invasive bladder cancer. Of these, 61 patients had received
cisplatin-
containing chemotherapy, either in an adjuvant setting or for metastatic
disease. Standard
immunohistochemistry was performed on paraffin-embedded tissue blocks applying
a
monoclonal Cox-2 antibody. Semiquantitative results were correlated to
clinical and
pathological data, long-term survival rates (3-177 months) and details on
chemotherapy.
Twenty six (16.6 percent) cases were Cox-2-negative. From all positive cases
(n=131, 83.4
percent), 59 (37.6 percent) showed low, 53 (33.8 percent) moderate and 19
(12.1 percent)
strong Cox-2 expression. Expression was independent of TNM-Staging and
histological
grading. Cox-2 expression correlated significantly with the histological type
of the tumors
(urothelial vs. squamous cell carcinoma; P=0.01 ). In all investigated cases,
Kaplan-Meier
analysis did not show any statistical correlation to overall and disease free
survival.
However, by subgroup analysis of those patients who had cisplatin-containing
chemotherapy, Cox-2-expression was significantly related to poor overall
survival time
(P=0.03). According to Wulfing et al., immunohistochemical overexpression of
Cox-2 is a
very common event in bladder cancer. Patients receiving chemotherapy seem to
have worse
survival rates when overexpressing Cox-2 in their tumors. Therefore, Wulfing
et al.
reasoned that Cox-2 expression could provide additional prognostic information
for patients
with bladder cancer treated with cisplatin-based chemotherapy regimens and
that this could
be the basis for a more aggressive therapy in individual patients or a risk-
adapted targeted
therapy using selective Cox-2-inhibitors. The results of Wulfing et al. can be
used to
develop a model 202 that stratifies a bladder cancer population into treatment
groups.
42
CA 02540167 2006-03-24
WO 2005/042760 PCT/US2004/032006
5.4.7 GASTRIC CANCER
Terashima et al. In order to detect the chemoresistance-related gene in human
gastric cancer, Terashima et al., ASCO 2003 abstract 1161 investigated gene
expression
profiles using DNA microarray and compared the results with in vitro drug
sensitivity.
Fresh tumor tissue was obtained from a total of sixteen patients with gastric
cancer and then
examined for gene expression profile using GeneChip Human U95Av2 array
(Affymetrix,
Santa Clara, California), which includes 12,000 human genes and EST sequences.
The
findings were compared with the results of in vitro drug sensitivity
determined by a ATP
assay. The investigated drugs and drug concentrations were cisplatin (CDDP),
doxorubicin
(DOX), mitomycin C (MMC), etoposide (ETP), irinotecan (CPT; as SN-38), 5-
fluoruuracil
(5-FU), doxifluridine (5'-DFUR), paclitaxel (TXL) and docetaxel (TXT). Drug
was added
at a concentration of CmaX of each drug for 72 hours. Drug sensitivity was
expressed as the
ratio of the ATP content in drug treated group to control group (T/C percent).
Pearson
correlation between the amount of relative gene expression and T/C percent was
evaluated
and clustering analysis was also performed y using genes selected by the
correlation. From
these analyses, 51 genes in CDDP, 34 genes in DOX, 26 genes in MMC, 52 genes
in ETP,
51 genes in CPT, 85 genes in 5-FU, 42 genes in 5'-DFUR, 11 genes in TXL and 32
genes in
TXT were up-regulated in drug resistant tumors. Most of these genes were
related to cell
growth, cell cycle regulation, apoptosis, heat shock protein or ubiquitin-
proteasome
pathways. However, several genes, such as ribosomal proteins, CD44 and
elongation factor
alpha, were specifically up-regulated in each drug-resistant tumors. The up-
regulated genes
identified by Terashima et al. can be used to develop a model 202 that not
only diagnoses
patients with gastric cancer, but provides an indication of whether the
patient has a drug-
resistant gastric tumor and, if so, which kind of drug-resistant tumor.
Additional references that can be used to develop models 202 for gastric
cancer
include, but are not limited to Kim et al. ASCO 2003 abstract 560; Arch-Ferrer
et al. ASCO
2003 abstract 1101; Hobday ASCO 2003 abstract 1078; Song et al. ASCO 2003
abstract
1056 (overexpression of the Rb gene is an independent prognostic factor for
predicting
relapse free survival); Leichman et al., ASCO 2003 abstract 1054 (thymidylate
synthase
expression as a predictor of chemobenefit in esophageal/gastric cancer).
43
CA 02540167 2006-03-24
WO 2005/042760 PCT/US2004/032006
5.4.8 RECTAL CANCER
Lens el al. Local recurrence is a signif cant clinical problem in patients
with rectal
cancer. Accordingly, I,enz el ud. ASCO 2003 abstract 1 185 sought to establish
a genetic
profile that would predict pelvic recurrence in patients with rectal cancer
treated with
adjuvant c.hemoradiation. A total of 73 patients with locally advanced rectal
cancer (L11CC
stage II and III), 25 female, 48 male, median age 52.1 years, were treated
from 1991-2000.
Histological staging categorized 22 patients as stage T2, 51 as stage T3. A
total of 35
patients were lymph node negative, 38 had one or more lymph node metastases.
All
patients underwent cancer resection, followed by 5-FL1 plus pelvic radiation.
RNA was
extracted from formalin-fixed, paraffin-embedded, laser-capttu~e-
microdissected tissue.
l.enz el cal. determined mRNA Levels of genes involved in the 5FL1 pathway
(TS, DPD),
angiogenesis (VEGF), and DNA repair (ERCC1, RAD51) in tumor and adjacent
normal
tissue by quantitative RT-fCR (Taqman). L,enz el al. found a significant
association
beriveen local tumor recurrence and higher m-RNA expression levels in adjacent
normal
tissue of ER.CCI and TS suggest that gene expression levels oi~target genes of
the 5-1~LI
pathways as well as DNA repair and angiogenesis may be useful to identify
patients at risk
for pelvic recurrence. The results of Lenz el al. can be used to develop a
model 202 that
identifies patients at risk for pelvic recurrence.
5.4.9 ADDITIONAL EXEMPLARY BIOLOGICAL FEATURES
Additional representative biological features include, but are not limited to,
acne,
acromegaly, acute cholecystitis, Addison's disease, adenomyosis, adult growth
hormone
deficiency, adult soft tissue sarcoma, alcohol dependence, allergic rhinitis,
allergies,
alopecia, alzheimer disease, amniocentesis, anemia in heart failure, anemias,
angina
pectoris, ankylosing spondylitis, anxiety disorders, arrhenoblastoma of ovary,
arrhythmia,
arthritis, arthritis-related eye problems, asthma, atherosclerosis, atopic
eczema
atrophic vaginitis, attention deficit disorder, attention disorder, autoimmune
diseases,
balanoposthitis, baldness, bartholins abscess, birth defects, bleeding
disorders, bone cancer,
brain and spinal cord tumors, brain stem glioma, brain tumor, breast cancer,
breast cancer
risk, breast disorders, cancer, cancer of the kidney, cardiomyopathy, carotid
artery disease,
44
CA 02540167 2006-03-24
WO 2005/042760 PCT/US2004/032006
carotid endarterectomy, carpal tunnel syndrome, cerebral palsy, cervical
cancer, chancroid,
chickenpox, childhood nephrotic syndrome, chlamydia, chronic diarrhea, chronic
heart
failure, claudication, colic, colon or rectum cancer, colorectal cancer,
common cold,
condyloma (genital warts), congenital goiters, congestive heart failure,
conjunctivitis,
corneal disease, corneal ulcer, coronary heart disease, cryptosporidiosis,
Cushings
syndrome, cystic fibrosis, cystitis, cystoscopy or ureteroscopy, De Quervains
disease,
dementia, depression, mania, diabetes, diabetes insipidus, diabetes mellitus,
diabetic
retinopathy, Down syndrome, dysmenorrhea in the adolescent, dyspareunia, ear
allergy, ear
infection, eating disorder, eczema, emphysema, endocarditis, endometrial
cancer,
endometriosis, eneuresis in children, epididymitis, epilepsy, episiotomy,
erectile
dysfunction, eye cancer, fatal abstraction, fecal incontinence, female sexual
dysfunction,
fetal abnormalities, fetal alcohol syndrome, fibromyalgia, flu, folliculitis,
fungal infection,
gardnerella vaginalis, genital candidiasis, genital herpes, gestational
diabetes, glaucoma,
glomerular diseases, gonorrhea, gout and pseudogout, growth disorders, gum
disease, hair
disorders, halitosis, Hamburger disease, hemophilia, hepatitis, hepatitis b,
hereditary colon
cancer, herpes infection, human placental lactogen, hyperparathyroidism,
hypertension,
hyperthyroidism, hypoglycemia, hypogonadism, hypospadias, hypothyroidism,
hysterectomy, impotence, infertility, inflammatory bowel disease, inguinal
hernia, inherited
heart irregularity, intraocular melanoma, irritable bowel syndrome, Kaposis
sarcoma,
leukemia, liver cancer, lung cancer, lung disease, malaria, manic depressive
illness,
measles, memory loss, meningitis in children, menorrhagia, mesothelioma,
microalbumin,
migraine headache, mittelschmerz, mouth cancer, movement disorders, mumps,
Nabothian
cyst, narcolepsy, nasal allergies, nasal cavity and paranasal sinus cancer,
neuroblastoma,
neurofibromatosis, neurological disorders, newborn jaundice, obesity,
obsessive-compulsive
disorder, orchitis or epididymitis, orofacial myofunctional disorders,
osteoarthritis,
osteoporosis, osteoporosis, osteosarcoma, ovarian cancer, ovarian cysts,
pancreatic cancer,
paraphimosis, Parkinson disease, partial epilepsy, pelvic inflammatory
disease, peptic ulcer,
peripartum cardiomyopathy, peyronie disease, polycystic ovary syndrome,
preeclampsia, ,
pregnanediol, premenstrual syndrome, priapism, prolactinoma, prostate cancer,
psoriasis,
rheumatic fever, salivary gland cancer, SARS, sexually transmitted diseases,
sexually
transmitted enteric infections, sexually transmitted infections, Sheehans
syndrome, sinusitis,
skin cancer, sleep disorders, smallpox, smell disorders, snoring, social
phobia, spina bifida,
stomach cancer, syphilis, testicular cancer, thyroid cancer, thyroid disease,
tonsillitis, tooth
disorders, trichomoniasis, tuberculosis, tumors, type II diabetes, ulcerative
colitis, urinary
CA 02540167 2006-03-24
WO 2005/042760 PCT/US2004/032006
tract infections, urological cancers, uterine fibroids, vaginal cancer,
vaginal cysts,
vulvodynia, and vulvovaginitis.
5.5 TRANSCRIPTIONAL STATE MEASUREMENTS
This section provides some exemplary methods for measuring the expression
level
of genes, which are one type of cellular constituent. One of skill in the art
will appreciate
that this invention is not limited to the following specific methods for
measuring the
expression level of genes in each organism in a plurality of organisms.
5.5.1 TRANSCRIPT ASSAY USING MICROARRAYS
The techniques described in this section include the provision of
polynucleotide
probe arrays that can be used to provide simultaneous determination of the
expression levels
of a plurality of genes. These techniques further provide methods for
designing and making
such polynucleotide probe arrays.
The expression level of a nucleotide sequence in a gene can be measured by any
high throughput techniques. However measured, the result is either the
absolute or relative
amounts of transcripts or response data, including but not limited to values
representing
abundances or abundance ratios. Preferably, measurement of the expression
profile is made
by hybridization to transcript arrays, which are described in this subsection.
In one
embodiment, "transcript arrays" or "profiling arrays" are used. Transcript
arrays can be
employed for analyzing the expression profile in a cell sample and especially
for measuring
the expression profile of a cell sample of a particular tissue type or
developmental state or
exposed to a drug of interest.
In one embodiment, an expression profile is obtained by hybridizing detectably
labeled polynucleotides representing the nucleotide sequences in mRNA
transcripts present
in a cell (e.g., fluorescently labeled cDNA synthesized from total cell mRNA)
to a
microarray. A microarray is an array of positionally-addressable binding
(e.g.,
hybridization) sites on a support for representing many of the nucleotide
sequences in the
genome of a cell or organism, preferably most or almost all of the genes. Each
of such
binding sites consists of polynucleotide probes bound to the predetermined
region on the
support. Microarrays can be made in a number of ways, of which several are
described
herein below. However produced, microarrays share certain characteristics. The
arrays are
reproducible, allowing multiple copies of a given array to be produced and
easily compared
46
CA 02540167 2006-03-24
WO 2005/042760 PCT/US2004/032006
with each other. Preferably, the microarrays are made from materials that are
stable under
binding (e.g., nucleic acid hybridization) conditions. Microarrays are
preferably small, e.g.,
between 1 cmz and 25 cmz, preferably 1 to 3 cmz. However, both larger and
smaller arrays
are also contemplated and may be preferable, e.g., for simultaneously
evaluating a very
large number or very small number of different probes.
Preferably, a given binding site or unique set of binding sites in the
microarray will
specifically bind (e.g., hybridize) to a nucleotide sequence in a single gene
from a cell or
organism (e.g., to exon of a specific mRNA or a specific cDNA derived
therefrom).
The microarrays used can include one or more test probes, each of which has a
polynucleotide sequence that is complementary to a subsequence of RNA or DNA
to be
detected. Each probe typically has a different nucleic acid sequence, and the
position of
each probe on the solid surface of the array is usually known. Indeed, the
microarrays are
preferably addressable arrays, more preferably positionally addressable
arrays. Each probe
of the array is preferably located at a known, predetermined position on the
solid support so
that the identity (e.g., the sequence) of each probe can be determined from
its position on
the array (e.g., on the support or surface). In some embodiments, the arrays
are ordered
arrays.
Preferably, the density of probes on a microarray or a set of microarrays is
100
different (e.g., non-identical) probes per I cm2 or higher. More preferably, a
microarray
used in the methods of the invention will have at least S50 probes per 1 cm2,
at least 1,000
probes per 1 cm2, at least 1,500 probes per 1 cmz, at least 2,000 probes per 1
cm2, at least
8,000 probes per 1 cmz, or at least 15,000 probes per 1 cmz, or greater. The
microarrays
used in the invention therefore preferably contain at least 25,000, at least
50,000, at least
100,000, at least 150,000, at least 200,000, at least 250,000, at least
500,000 or at least
550,000 different (e.g., non-identical) probes.
In one embodiment, the microarray is an array (e.g., a matrix) in which each
position
represents a discrete binding site for a nucleotide sequence of a transcript
encoded by a gene
(e.g., for an exon of an mRNA or a cDNA derived therefrom). The collection of
binding
sites on a microarray contains sets of binding sites for a plurality of genes.
For example, in
various embodiments, the microarrays of the invention can comprise binding
sites for
products encoded by fewer than 50 percent of the genes in the genome of an
organism.
Alternatively, the microarrays of the invention can have binding sites for the
products
encoded by at least SO percent, at least 75 percent, at least 85 percent, at
least 90 percent, at
least 95 percent, at least 99 percent or 100 percent of the genes in the
genome of an
47
CA 02540167 2006-03-24
WO 2005/042760 PCT/US2004/032006
organism. In other embodiments, the microarrays of the invention can have
binding sites
for products encoded by fewer than 50 percent, by at least 50 percent, by at
least 75 percent,
by at least 85 percent, by at least 90 percent, by at least 95 percent, by at
least 99 percent or
by 100 percent of the genes expressed by a cell of an organism. The binding
site can be a
DNA or DNA analog to which a particular RNA can specifically hybridize. The
DNA or
DNA analog can be, e.g., a synthetic oligomer or a gene fragment, e.g.
corresponding to an
exon.
In some embodiments of the present invention, a gene or an exon in a gene is
represented in the profiling arrays by a set of binding sites comprising
probes with different
polynucleotides that are complementary to different sequence segments of the
gene or the
exon. Such polynucleotides are preferably of the length of 15 to 200 bases,
more preferably
of the length of 20 to 100 bases, most preferably 40-60 bases. Each probe
sequence may
also comprise linker sequences in addition to the sequence that is
complementary to its
target sequence. As used herein, a linker sequence is a sequence between the
sequence that
is complementary to its target sequence and the surface of support. For
example, in
preferred embodiments, the profiling arrays of the invention comprise one
probe specific to
each target gene or exon. However, if desired, the profiling arrays may
contain at least 2, 5,
10, 100, or 1000 or more probes specific to some target genes or exons. For
example, the
array may contain probes tiled across the sequence of the longest mRNA isoform
of a gene
at single base steps.
In specific embodiments of the invention, when an exon has alternative spliced
variants, a set of polynucleotide probes of successive overlapping sequences,
i.e., tiled
sequences, across the genomic region containing the longest variant of an exon
can be
included in the exon profiling arrays. The set of polynucleotide probes can
comprise
successive overlapping sequences at steps of a predetermined base intervals,
e.g. at steps of
1, 5, or 10 base intervals, span, or are tiled across, the mRNA containing the
longest variant.
Such sets of probes therefore can be used to scan the genomic region
containing all variants
of an exon to determine the expressed variant or variants of the exon to
determine the
expressed variant or variants of the exon. Alternatively or additionally, a
set of
polynucleotide probes comprising exon specific probes and/or variant junction
probes can
be included in the exon profiling array. As used herein, a variant junction
probe refers to a
probe specific to the junction region of the particular exon variant and the
neighboring exon.
In some cases, the probe set contains variant junction probes specifically
hybridizable to
each of all different splice junction sequences of the exon. In other cases,
the probe set
48
CA 02540167 2006-03-24
WO 2005/042760 PCT/US2004/032006
contains exon specific probes specifically hybridizable to the common
sequences in all
different variants of the exon, and/or variant junction probes specifically
hybridizable to the
different splice junction sequences of the exon.
In some cases, an exon is represented in the exon profiling arrays by a probe
comprising a polynucleotide that is complementary to the full length exon. In
such
instances, an exon is represented by a single binding site on the profiling
arrays. In some
preferred cases, an exon is represented by one or more binding sites on the
profiling arrays,
each of the binding sites comprising a probe with a polynucleotide sequence
that is
complementary to an RNA fragment that is a substantial portion of the target
exon. The
lengths of such probes are normally between 15-600 bases, preferably between
20-200
bases, more preferably between 30-100 bases, and most preferably between 40-80
bases.
The average length of an exon is about 200 bases (see, e.g., Lewin, Genes V,
Oxford
University Press, Oxford, 1994). A probe of length of 40-80 allows more
specific binding
of the exon than a probe of shorter length, thereby increasing the specificity
of the probe to
the target exon. For certain genes, one or more targeted exons may have
sequence lengths
less than 40-80 bases. In such cases, if probes with sequences longer than the
target exons
are to be used, it may be desirable to design probes comprising sequences that
include the
entire target exon flanked by sequences from the adjacent constitutively
spliced exon or
exons such that the probe sequences are complementary to the corresponding
sequence
segments in the mRNAs. Using flanking sequence from adjacent constitutively
spliced
exon or exons rather than the genomic flanking sequences, i.e., intron
sequences, permits
comparable hybridization stringency with other probes of the same length.
Preferably the
flanking sequences used are from the adjacent constitutively spliced exon or
exons that are
not involved in any alternative pathways. More preferably the flanking
sequences used do
not comprise a significant portion of the sequence of the adjacent exon or
exons so that
cross-hybridization can be minimized. In some embodiments, when a target exon
that is
shorter than the desired probe length is involved in alternative splicing,
probes comprising
flanking sequences in different alternatively spliced mRNAs are designed so
that expression
level of the exon expressed in different alternatively spliced mRNAs can be
measured.
In some instances, when alternative splicing pathways and/or exon duplication
in
separate genes are to be distinguished, the DNA array or set of arrays can
also comprise
probes that are complementary to sequences spanning the junction regions of
two adjacent
exons. Preferably, such probes comprise sequences from the two exons which are
not
substantially overlapped with probes for each individual exon so that cross
hybridization
49
CA 02540167 2006-03-24
WO 2005/042760 PCT/US2004/032006
can be minimized. Probes that comprise sequences from more than one exon are
useful in
distinguishing alternative splicing pathways and/or expression of duplicated
exons in
separate genes if the exons occurs in one or more alternative spliced mRNAs
and/or one or
more separated genes that contain the duplicated exons but not in other
alternatively spliced
S mRNAs and/or other genes that contain the duplicated exons. Alternatively,
for duplicate
exons in separate genes, if the exons from different genes show substantial
difference in
sequence homology, it is preferable to include probes that are different so
that the exons
from different genes can be distinguished.
It will be apparent to one of skill in the art that any of the probe schemes,
supra, can
be combined on the same profiling array and/or on different arrays within the
same set of
profiling arrays so that a more accurate determination of the expression
profile for a
plurality of genes can be accomplished. It will also be apparent to one
skilled in the art that
the different probe schemes can also be used for different levels of
accuracies in profiling.
For example, a profiling array or array set comprising a small set of probes
for each exon
may be used to determine the relevant genes and/or RNA splicing pathways under
certain
specific conditions. An array or array set comprising larger sets of probes
for the exons that
are of interest is then used to more accurately determine the exon expression
profile under
such specific conditions. Other DNA array strategies that allow more
advantageous use of
different probe schemes are also encompassed.
Preferably, the microarrays used in the invention have binding sites (i.e.,
probes) for
sets of exons for one or more genes relevant to the action of a drug of
interest or in a
biological pathway of interest. As discussed above, a "gene" is identified as
a portion of
DNA that is transcribed by RNA polymerase, which may include a 5 untranslated
region
("UTR"), introns, exons and a 3 UTR. The number of genes in a genome can be
estimated
from the number of mRNAs expressed by the cell or organism, or by
extrapolation of a well
characterized portion of the genome. When the genome of the organism of
interest has been
sequenced, the number of ORFs can be determined and mRNA coding regions
identified by
analysis of the DNA sequence. For example, the genome of Saccharomyces
cerevisiae has
been completely sequenced and is reported to have approximately 6275 ORFs
encoding
sequences longer than 99 amino acid residues in length. Analysis of these ORFs
indicates
that there are 5,885 ORFs that are likely to encode protein products (Goffeau
et al., 1996,
Science 274: 546-567). In contrast, the human genome is estimated to contain
approximately 30,000 to 130,000 genes (see Crollius et al., 2000, Nature
Genetics 25:235-
238; Ewing et al., 2000, Nature Genetics 25:232-234). Genome sequences for
other
CA 02540167 2006-03-24
WO 2005/042760 PCT/US2004/032006
organisms, including but not limited to Drosophila, C. elegans, plants, e.g.,
rice and
Arabidopsis, and mammals, e.g., mouse and human, are also completed or nearly
completed. Thus, in preferred embodiments of the invention, an array set
comprising in
total probes for all known or predicted exons in the genome of an organism is
provided. As
a non-limiting example, the present invention provides an array set comprising
one or two
probes for each known or predicted exon in the human genome.
It will be appreciated that when cDNA complementary to the RNA of a cell is
made
and hybridized to a microarray under suitable hybridization conditions, the
level of
hybridization to the site in the array corresponding to an exon of any
particular gene will
reflect the prevalence in the cell of mRNA or mRNAs containing the exon
transcribed from
that gene. For example, when detestably labeled (e.g., with a fluorophore)
cDNA
complementary to the total cellular mRNA is hybridized to a microarray, the
site on the
array corresponding to an exon of a gene (e.g., capable of specifically
binding the product
or products of the gene expressing) that is not transcribed or is removed
during RNA
splicing in the cell will have little or no signal (e.g., fluorescent signal),
and an exon of a
gene for which the encoded mRNA expressing the exon is prevalent will have a
relatively
strong signal. The relative abundance of different mRNAs produced from the
same gene by
alternative splicing is then determined by the signal strength pattern across
the whole set of
exons monitored for the gene.
In one embodiment, cDNAs from cell samples from two different conditions are
hybridized to the binding sites of the microarray using a two-color protocol.
In the case of
drug responses one cell sample is exposed to a drug and another cell sample of
the same
type is not exposed to the drug. In the case of pathway responses one cell is
exposed to a
pathway perturbation and another cell of the same type is not exposed to the
pathway
perturbation. The cDNA derived from each of the two cell types are differently
labeled
(e.g., with Cy3 and Cy5) so that they can be distinguished. In one embodiment,
for
example, cDNA from a cell treated with a drug (or exposed to a pathway
perturbation) is
synthesized using a fluorescein-labeled dNTP, and cDNA from a second cell, not
drug-exposed, is synthesized using a rhodamine-labeled dNTP. When the two
cDNAs are
mixed and hybridized to the microarray, the relative intensity of signal from
each cDNA set
is determined for each site on the array, and any relative difference in
abundance of a
particular exon detected.
In the example described above, the cDNA from the drug-treated (or pathway
perturbed) cell will fluoresce green when the fluorophore is stimulated and
the cDNA from
51
CA 02540167 2006-03-24
WO 2005/042760 PCT/US2004/032006
the untreated cell will fluoresce red. As a result, when the drug treatment
has no effect,
either directly or indirectly, on the transcription and/or post-
transcriptional splicing of a
particular gene in a cell, the exon expression patterns will be
indistinguishable in both cells
and, upon reverse transcription, red-labeled and green-labeled cDNA will be
equally
prevalent. When hybridized to the microarray, the binding sites) for that
species of RNA
will emit wavelengths characteristic of both fluorophores. In contrast, when
the
drug-exposed cell is treated with a drug that, directly or indirectly, changes
the transcription
and/or post-transcriptional splicing of a particular gene in the cell, the
exon expression
pattern as represented by the ratio of green to red fluorescence for each exon
binding site
will change. When the drug increases the prevalence of an mRNA, the ratios for
each exon
expressed in the mRNA will increase, whereas when the drug decreases the
prevalence of
an mRNA, the ratio for each exon expressed in the mRNA will decrease.
The use of a two-color fluorescence labeling and detection scheme to define
alterations in gene expression has been described in connection with detection
of mRNAs,
e.g., in Schena et al., 1995, Quantitative monitoring of gene expression
patterns with a
complementary DNA microarray, Science 270:467-470, which is incorporated by
reference
in its entirety for all purposes. The scheme is equally applicable to labeling
and detection of
exons. An advantage of using cDNA labeled with two different fluorophores is
that a direct
and internally controlled comparison of the mRNA or exon expression levels
corresponding
to each arrayed gene in two cell states can be made, and variations due to
minor differences
in experimental conditions (e.g., hybridization conditions) will not affect
subsequent
analyses. However, it will be recognized that it is also possible to use cDNA
from a single
cell, and compare, for example, the absolute amount of a particular exon in,
e.g., a
drug-treated or pathway-perturbed cell and an untreated cell. Furthermore,
labeling with
more than two colors is also contemplated in the present invention. In some
embodiments
of the invention, at least 5, 10, 20, or 100 dyes of different colors can be
used for labeling.
Such labeling permits simultaneous hybridizing of the distinguishably labeled
cDNA
populations to the same array, and thus measuring, and optionally comparing
the expression
levels of, mRNA molecules derived from more than two samples. Dyes that can be
used
include, but are not limited to, fluorescein and its derivatives, rhodamine
and its derivatives,
texas red, 5 carboxy-fluorescein ("FMA"), 2 ,7 -dimethoxy-4 ,5 -dichloro-6-
carboxy-
fluorescein ("JOE"), N,N,N',N'-tetramethyl-6-carboxy-rhodamine ("TAMRA"), 6
carboxy-
X-rhodamine ("ROX"), HEX, TET, IRD40, and IRD41, cyamine dyes, including but
are
not limited to Cy3, Cy3.5 and CyS; BODIPY dyes including but are not limited
to
52
CA 02540167 2006-03-24
WO 2005/042760 PCT/US2004/032006
BODIPY-FL, BODIPY-TR, BODIPY-TMR, BODIPY-630/650, and BODIPY-650/670;
and ALEXA dyes, including but are not limited to ALEXA-488, ALEXA-532, ALEXA-
546, ALEXA-568, and ALEXA-594; as well as other fluorescent dyes which will be
known to those who are skilled in the art.
In some embodiments of the invention, hybridization data are measured at a
plurality
of different hybridization times so that the evolution of hybridization levels
to equilibrium
can be determined. In such embodiments, hybridization levels are most
preferably
measured at hybridization times spanning the range from zero to in excess of
what is
required for sampling of the bound polynucleotides (i.e., the probe or probes)
by the labeled
polynucleotides so that the mixture is close to equilibrium, and duplexes are
at
concentrations dependent on affinity and abundance rather than diffusion.
However, the
hybridization times are preferably short enough that irreversible binding
interactions
between the labeled polynucleotide and the probes and/or the surface do not
occur, or are at
least limited. For example, in embodiments wherein polynucleotide arrays are
used to
probe a complex mixture of fragmented polynucleotides, typical hybridization
times may be
approximately 0-72 hours. Appropriate hybridization times for other
embodiments will
depend on the particular polynucleotide sequences and probes used, and may be
determined
by those skilled in the art (see, e.g., Sambrook et al., Eds., 1989, Molecular
Cloning: A
Laboratory Manual, 2nd ed., Vol. 1-3, Cold Spring Harbor Laboratory, Cold
Spring
Harbor, New York).
In one embodiment, hybridization levels at different hybridization times are
measured separately on different, identical microarrays. For each such
measurement, at
hybridization time when hybridization level is measured, the microarray is
washed briefly,
preferably in room temperature in an aqueous solution of high to moderate salt
concentration (e.g., 0.5 to 3 M salt concentration) under conditions which
retain all bound
or hybridized polynucleotides while removing all unbound polynucleotides. The
detectable
label on the remaining, hybridized polynucleotide molecules on each probe is
then
measured by a method which is appropriate to the particular labeling method
used. The
resulted hybridization levels are then combined to form a hybridization curve.
In another
embodiment, hybridization levels are measured in real time using a single
microarray. In
this embodiment, the microarray is allowed to hybridize to the sample without
interruption
and the microarray is interrogated at each hybridization time in a non-
invasive manner. In
still another embodiment, one can use one array, hybridize for a short time,
wash and
53
CA 02540167 2006-03-24
WO 2005/042760 PCT/US2004/032006
measure the hybridization level, put back to the same sample, hybridize for
another period
of time, wash and measure again to get the hybridization time curve.
Preferably, at least two hybridization levels at two different hybridization
times are
measured, a first one at a hybridization time that is close to the time scale
of cross-
hybridization equilibrium and a second one measured at a hybridization time
that is longer
than the first one. The time scale of cross-hybridization equilibrium depends,
inter alia, on
sample composition and probe sequence and may be determined by one skilled in
the art. In
preferred embodiments, the first hybridization level is measured at between 1
to 10 hours,
whereas the second hybridization time is measured at 2, 4, 6, 10, 12, 16, 18,
48 or 72 times
as long as the first hybridization time.
5.5.1.1 PREPARING PROBES FOR MICROARRAYS
As noted above, the "probe" to which a particular polynucleotide molecule,
such as
an exon, specifically hybridizes according to the invention is a complementary
polynucleotide sequence. Preferably one or more probes are selected for each
target exon.
For example, when a minimum number of probes are to be used for the detection
of an
exon, the probes normally comprise nucleotide sequences greater than 40 bases
in length.
Alternatively, when a large set of redundant probes is to be used for an exon,
the probes
normally comprise nucleotide sequences of 40-60 bases. The probes can also
comprise
sequences complementary to full length exons. The lengths of exons can range
from less
than 50 bases to more than 200 bases. Therefore, when a probe length longer
than an exon
is to be used, it is preferable to augment the exon sequence with adjacent
constitutively
spliced exon sequences such that the probe sequence is complementary to the
continuous
mRNA fragment that contains the target exon. This will allow comparable
hybridization
stringency among the probes of an exon profiling array. It will be understood
that each
probe sequence may also comprise linker sequences in addition to the sequence
that is
complementary to its target sequence.
The probes can comprise DNA or DNA "mimics" (e.g., derivatives and analogues)
corresponding to a portion of each exon of each gene in an organism's genome.
In one
embodiment, the probes of the microarray are complementary RNA or RNA mimics.
DNA
mimics are polymers composed of subunits capable of specific, Watson-Crick-
like
hybridization with DNA, or of specific hybridization with RNA. The nucleic
acids can be
modified at the base moiety, at the sugar moiety, or at the phosphate
backbone. Exemplary
54
CA 02540167 2006-03-24
WO 2005/042760 PCT/US2004/032006
DNA mimics include, e.g., phosphorothioates. DNA can be obtained, e.g., by
polymerise
chain reaction (PCR) amplification of exon segments from genomic DNA, cDNA
(e.g., by
RT-PCR), or cloned sequences. PCR primers are preferably chosen based on known
sequence of the exons or cDNA that result in amplification of unique fragments
(e.g.,
fragments that do not share more than 10 bases of contiguous identical
sequence with any
other fragment on the microarray). Computer programs that are well known in
the art are
useful in the design of primers with the required specificity and optimal
amplification
properties, such as Oligo version 5.0 (National Biosciences). Typically each
probe on the
microarray will be between 20 bases and 600 bases, and usually between 30 and
200 bases
in length. PCR methods are well known in the art, and are described, for
example, in Innis
et al., eds., 1990, PCR Protocols: A Guide to Methods and Applications,
Academic Press
Inc., San Diego, CA. It will be apparent to one skilled in the art that
controlled robotic
systems are useful for isolating and amplifying nucleic acids.
An alternative, preferred means for generating the polynucleotide probes of
the
microarray is by synthesis of synthetic polynucleotides or oligonucleotides,
e.g., using N-
phosphonate or phosphoramidite chemistries (Froehler et al., 1986, Nucleic
Acid Res.
14:5399-5407; McBride et al., 1983, Tetrahedron Lett. 24:246-248). Synthetic
sequences
are typically between 15 and 600 bases in length, more typically between 20
and 100 bases,
most preferably between 40 and 70 bases in length. In some embodiments,
synthetic
nucleic acids include non-natural bases, such as, but by no means limited to,
inosine. As
noted above, nucleic acid analogues may be used as binding sites for
hybridization. An
example of a suitable nucleic acid analogue is peptide nucleic acid (see,
e.g., Egholm et al.,
1993, Nature 363:566-568; and U.S. Patent No. 5,539,083).
In alternative embodiments, the hybridization sites (i.e., the probes) are
made from
plasmid or phage clones of genes, cDNAs (e.g., expressed sequence tags), or
inserts
therefrom (Nguyen et al., 1995, Genomics 29:207-209).
5.5.1.2. ATTACHING NUCLEIC ACIDS TO THE SOLID SURFACE
Preformed polynucleotide probes can be deposited on a support to form the
array.
Alternatively, polynucleotide probes can be synthesized directly on the
support to form the
array. The probes are attached to a solid support or surface, which may be
made, e.g., from
glass, plastic (e.g., polypropylene, nylon), polyacrylamide, nitrocellulose,
gel, or other
porous or nonporous material.
CA 02540167 2006-03-24
WO 2005/042760 PCT/US2004/032006
A preferred method for attaching the nucleic acids to a surface is by printing
on
glass plates, as is described generally by Schena et al., 1995, Science
270:467-470. This
method is especially useful for preparing microarrays of cDNA (See also,
DeRisi et al,
1996, Nature Genetics 14:457-460; Shalon et al., 1996, Genome Res. 6:639-645;
and
Schena et al., 1995, Proc. Natl. Acad. Sci. U.S.A. 93:10539-11286).
A second preferred method for making microarrays is by making high-density
polynucleotide arrays. Techniques are known for producing arrays containing
thousands of
oligonucleotides complementary to defined sequences, at defined locations on a
surface
using photolithographic techniques for synthesis in situ (see, Fodor et al.,
1991, Science
251:767-773; Lockhart et al., 1996, Nature Biotechnology 14:1675; U.S. Patent
Nos.
5,578,832; 5,556,752; and 5,510,270) or other methods for rapid synthesis and
deposition of
defined oligonucleotides (Blanchard et al., Biosensors & Bioelectronics 11:687-
690).
When these methods are used, oligonucleotides (e.g., 60-mers) of known
sequence are
synthesized directly on a surface such as a derivatized glass slide. The array
produced can
1 S be redundant, with several polynucleotide molecules per exon.
Other methods for making microarrays, e.g., by masking (Maskos and Southern,
1992, Nucl. Acids. Res. 20:1679-1684), may also be used. In principle, and as
noted supra,
any type of array, for example, dot blots on a nylon hybridization membrane
(see Sambrook
et al., supra) could be used. However, as will be recognized by those skilled
in the art, very
small arrays will frequently be preferred because hybridization volumes will
be smaller.
In a particularly preferred embodiment, microarrays of the invention are
manufactured by means of an ink jet printing device for oligonucleotide
synthesis, e.g.,
using the methods and systems described by Blanchard in International Patent
Publication
No. WO 98/41531, published September 24, 1998; Blanchard et al., 1996,
Biosensors and
Bioelectronics 11:687-690; Blanchard, 1998, in Synthetic DNA Arrays in Genetic
Engineering, Vol. 20, J.K. Setlow, Ed., Plenum Press, New York at pages 111-
123; and
U.S. Patent No. 6,028,189 to Blanchard. Specifically, the polynucleotide
probes in such
microarrays are preferably synthesized in arrays, e.g., on a glass slide, by
serially depositing
individual nucleotide bases in "microdroplets" of a high surface tension
solvent such as
propylene carbonate. The microdroplets have small volumes (e.g., 100 pL or
less, more
preferably 50 pL or less) and are separated from each other on the microarray
(e.g., by
hydrophobic domains) to form circular surface tension wells that define the
locations of the
array elements (e.g., the different probes). Polynucleotide probes are
normally attached to
the surface covalently at the 3 end of the polynucleotide. Alternatively,
polynucleotide
56
CA 02540167 2006-03-24
WO 2005/042760 PCT/US2004/032006
probes can be attached to the surface covalently at the 5' end of the
polynucleotide (see for
example, Blanchard, 1998, in Synthetic DNA Arrays in Genetic Engineering 20,
Setlow,
Ed., Plenum Press, New York at pages 111-123).
5.5.1.3. TARGET POLYNUCLEOTIDE MOLECULES
Target polynucleotides that can be analyzed by the methods and compositions of
the
invention include RNA molecules such as, but by no means limited to, messenger
RNA
(mRNA) molecules, ribosomal RNA (rRNA) molecules, cRNA molecules (i.e., RNA
molecules prepared from cDNA molecules that are transcribed in vivo) and
fragments
thereof. Target polynucleotides which may also be analyzed by the methods and
compositions of the present invention include, but are not limited to DNA
molecules such as
genomic DNA molecules, cDNA molecules, and fragments thereof including
oligonucleotides, ESTs, STSs, etc.
The target polynucleotides can be from any source. For example, the target
polynucleotide molecules may be naturally occurring nucleic acid molecules
such as
genomic or extragenomic DNA molecules isolated from an organism, or RNA
molecules,
such as mRNA molecules, isolated from an organism. Alternatively, the
polynucleotide
molecules may be synthesized, including, e.g., nucleic acid molecules
synthesized
enzymatically in vivo or in vitro, such as cDNA molecules, or polynucleotide
molecules
synthesized by PCR, RNA molecules synthesized by in vitro transcription, etc.
The sample
of target polynucleotides can comprise, e.g., molecules of DNA, RNA, or
copolymers of
DNA and RNA. In preferred embodiments, the target polynucleotides of the
invention will
correspond to particular genes or to particular gene transcripts (e.g., to
particular mRNA
sequences expressed in cells or to particular cDNA sequences derived from such
mRNA
sequences). However, in many embodiments, particularly those embodiments
wherein the
polynucleotide molecules are derived from mammalian cells, the target
polynucleotides may
correspond to particular fragments of a gene transcript. For example, the
target
polynucleotides may correspond to different exons of the same gene, e.g., so
that different
splice variants of that gene may be detected and/or analyzed.
In preferred embodiments, the target polynucleotides to be analyzed are
prepared in
vitro from nucleic acids extracted from cells. For example, in one embodiment,
RNA is
extracted from cells (e.g., total cellular RNA, poly(A)+ messenger RNA, or
fraction thereof)
57
CA 02540167 2006-03-24
WO 2005/042760 PCT/US2004/032006
and messenger RNA is purified from the total extracted RNA. Methods for
preparing total
and poly(A)+ RNA are well known in the art and are described generally, e.g.,
in Sambrook
et al., supra. In one embodiment, RNA is extracted from cells of the various
types of
interest in this invention using guanidinium thiocyanate lysis followed by
CsCI
centrifugation and an oligo dT purification (Chirgwin et al., 1979,
Biochemistry 18:5294-
5299). In another embodiment, RNA is extracted from cells using guanidinium
thiocyanate
lysis followed by purification on RNeasy columns (Qiagen). The cDNA is then
synthesized
from the purified mRNA using, e.g., oligo-dT or random primers. In preferred
embodiments, the target polynucleotides are cRNA prepared from purified
messenger RNA
extracted from cells. As used herein, cRNA is defined here as RNA
complementary to the
source RNA. The extracted RNAs are amplified using a process in which doubled-
stranded
cDNAs are synthesized from the RNAs using a primer linked to an RNA polymerise
promoter in a direction capable of directing transcription of anti-sense RNA.
Anti-sense
RNAs or cRNAs are then transcribed from the second strand of the double-
stranded cDNAs
using an RNA polymerise (see, e.g., U.S. Patent Nos. 5,891,636, 5,716,785;
5,545,522 and
6,132,997; see also, U.S. Patent No. 6,271,002, and U.S. Provisional Patent
Application
Serial No. 60/253,641, filed on November 28, 2000, by Ziman et al.). Both
oligo-dT
primers (U.S. Patent Nos. 5,545,522 and 6,132,997) or random primers (U.S.
Provisional
Patent Application Serial No. 60/253,641, filed on November 28, 2000, by Ziman
et al.)
that contain an RNA polymerise promoter or complement thereof can be used.
Preferably,
the target polynucleotides are short and/or fragmented polynucleotide
molecules which are
representative of the original nucleic acid population of the cell.
The target polynucleotides to be analyzed by the methods and compositions of
the
invention are preferably detectably labeled. For example, cDNA can be labeled
directly,
e.g., with nucleotide analogs, or indirectly, e.g., by making a second,
labeled cDNA strand
using the first strand as a template. Alternatively, the double-stranded cDNA
can be
transcribed into cRNA and labeled.
Preferably, the detectable label is a fluorescent label, e.g., by
incorporation of
nucleotide analogs. Other labels suitable for use in the present invention
include, but are
not limited to, biotin, imminobiotin, antigens, cofactors, dinitrophenol,
lipoic acid, olefinic
compounds, detectable polypeptides, electron rich molecules, enzymes capable
of
generating a detectable signal by action upon a substrate, and radioactive
isotopes.
Preferred radioactive isotopes include 32P, 3sS, iaC, isN and ~ZSI.
Fluorescent molecules
suitable for the present invention include, but are not limited to,
fluorescein and its
58
CA 02540167 2006-03-24
WO 2005/042760 PCT/US2004/032006
derivatives, rhodamine and its derivatives, texas red, 5 carboxy-fluorescein
("FMA"), 2 ,7 -
dimethoxy-4 ,5 -dichloro-6-carboxy-fluorescein ("JOE"), N,N,N',N'- tetramethyl-
6-
carboxy-rhodamine ("TAMRA"), 6 carboxy-X-rhodamine ("ROX"), HEX, TET, IRD40,
and IRD41. Fluorescent molecules that are suitable for the invention further
include:
cyamine dyes, including by not limited to Cy3, Cy3.5 and CyS; BODIPY dyes
including
but not limited to BODIPY-FL, BODIPY-TR, BODIPY-TMR, BODIPY-630/650, and
BODIPY-650/670; and ALEXA dyes, including but not limited to ALEXA-488, ALEXA-
532, ALEXA-546, ALEXA-568, and ALEXA-594; as well as other fluorescent dyes
which
will be known to those who are skilled in the art. Electron rich indicator
molecules suitable
for the present invention include, but are not limited to, ferritin,
hemocyanin, and colloidal
gold. Alternatively, in less preferred embodiments the target polynucleotides
may be
labeled by specifically complexing a first group to the polynucleotide. A
second group,
covalently linked to an indicator molecules and which has an affinity for the
first group, can
be used to indirectly detect the target polynucleotide. In such an embodiment,
compounds
suitable for use as a first group include, but are not limited to, biotin and
iminobiotin.
Compounds suitable for use as a second group include, but are not limited to,
avidin and
streptavidin.
5.5.1.4. HYBRIDIZATION TO MICROARRAYS
As described supra, nucleic acid hybridization and wash conditions are chosen
so
that the polynucleotide molecules to be analyzed by the invention (referred to
herein as the
"target polynucleotide molecules) specifically bind or specifically hybridize
to the
complementary polynucleotide sequences of the array, preferably to a specific
array site,
wherein its complementary DNA is located.
Arrays containing double-stranded probe DNA situated thereon are preferably
subjected to denaturing conditions to render the DNA single-stranded prior to
contacting
with the target polynucleotide molecules. Arrays containing single-stranded
probe DNA
(e.g., synthetic oligodeoxyribonucleic acids) may need to be denatured prior
to contacting
with the target polynucleotide molecules, e.g., to remove hairpins or dimers
which form due
to self complementary sequences.
Optimal hybridization conditions will depend on the length (e.g., oligomer
versus
polynucleotide greater than 200 bases) and type (e.g., RNA, or DNA) of probe
and target
nucleic acids. General parameters for specific (i.e., stringent) hybridization
conditions for
59
CA 02540167 2006-03-24
WO 2005/042760 PCT/US2004/032006
nucleic acids are described in Sambrook et al., (supra), and in Ausubel et
al., 1987, Current
Protocols in Molecular Biology, Greene Publishing and Wiley-Interscience, New
York.
When the cDNA microarrays of Schena et al. are used, typical hybridization
conditions are
hybridization in 5 X SSC plus 0.2% SDS at 65 °C for four hours,
followed by washes at
25°C in low stringency wash buffer (1 X SSC plus 0.2% SDS), followed by
10 minutes at
25°C in higher stringency wash buffer (0.1 X SSC plus 0.2% SDS) (Schena
et al., 1996,
Pros. Natl. Acad. Sci. U.S.A. 93:10614). Useful hybridization conditions are
also provided
in, e.g., Tijessen, 1993, Hybridization With Nucleic Acid Probes, Elsevier
Science
Publishers B.V. and Kricka, 1992, Nonisotopic DNA Probe Techniques, Academic
Press,
San Diego, CA.
Particularly preferred hybridization conditions for use with the screening
and/or
signaling chips of the present invention include hybridization at a
temperature at or near the
mean melting temperature of the probes (e.g., within 5 °C, more
preferably within 2 °C) in
1 M NaCI, 50 mM MES buffer (pH 6.5), 0.5% sodium Sarcosine and 30 percent
formamide.
5.5.1.5. SIGNAL DETECTION AND DATA ANALYSIS
It will be appreciated that when target sequences, e.g., cDNA or cRNA,
complementary to the RNA of a cell is made and hybridized to a microarray
under suitable
hybridization conditions, the level of hybridization to the site in the array
corresponding to
an exon of any particular gene will reflect the prevalence in the cell of mRNA
or mRNAs
containing the exon transcribed from that gene. For example, when detestably
labeled (e.g.,
with a fluorophore) cDNA complementary to the total cellular mRNA is
hybridized to a
microarray, the site on the array corresponding to an exon of a gene (i.e.,
capable of
specifically binding the product or products of the gene expressing) that is
not transcribed or
is removed during RNA splicing in the cell will have little or no signal
(e.g., fluorescent
signal), and an exon of a gene for which the encoded mRNA expressing the exon
is
prevalent will have a relatively strong signal. The relative abundance of
different mRNAs
produced from the same gene by alternative splicing is then determined by the
signal
strength pattern across the whole set of exons monitored for the gene.
In preferred embodiments, target sequences, e.g., cDNAs or cRNAs, from two
different cells are hybridized to the binding sites of the microarray. In the
case of drug
responses one cell sample is exposed to a drug and another cell sample of the
same type is
not exposed to the drug. In the case of pathway responses one cell is exposed
to a pathway
CA 02540167 2006-03-24
WO 2005/042760 PCT/US2004/032006
perturbation and another cell of the same type is not exposed to the pathway
perturbation.
The cDNA or cRNA derived from each of the two cell types are differently
labeled so that
they can be distinguished. In one embodiment, for example, cDNA from a cell
treated with
a drug (or exposed to a pathway perturbation) is synthesized using a
fluorescein-labeled
dNTP, and cDNA from a second cell, not drug-exposed, is synthesized using a
rhodamine-labeled dNTP. When the two cDNAs are mixed and hybridized to the
microarray, the relative intensity of signal from each cDNA set is determined
for each site
on the array, and any relative difference in abundance of a particular exon
detected.
In the example described above, the cDNA from the drug-treated (or pathway
perturbed) cell will fluoresce green when the fluorophore is stimulated and
the cDNA from
the untreated cell will fluoresce red. As a result, when the drug treatment
has no effect,
either directly or indirectly, on the transcription and/or post-
transcriptional splicing of a
particular gene in a cell, the exon expression patterns will be
indistinguishable in both cells
and, upon reverse transcription, red-labeled and green-labeled cDNA will be
equally
prevalent. When hybridized to the microarray, the binding sites) for that
species of RNA
will emit wavelengths characteristic of both fluorophores. In contrast, when
the
drug-exposed cell is treated with a drug that, directly or indirectly, changes
the transcription
and/or post-transcriptional splicing of a particular gene in the cell, the
exon expression
pattern as represented by ratio of green to red fluorescence for each exon
binding site will
change. When the drug increases the prevalence of an mRNA, the ratios for each
exon
expressed in the mRNA will increase, whereas when the drug decreases the
prevalence of
an mRNA, the ratio for each exon expressed in the mRNA will decrease.
The use of a two-color fluorescence labeling and detection scheme to define
alterations in gene expression has been described in connection with detection
of mRNAs,
e.g., in Schena et al., 1995, Science 270:467-470, which is incorporated by
reference in its
entirety for all purposes. The scheme is equally applicable to labeling and
detection of
exons. An advantage of using target sequences, e.g., cDNAs or cRNAs, labeled
with two
different fluorophores is that a direct and internally controlled comparison
of the mRNA or
exon expression levels corresponding to each arrayed gene in two cell states
can be made,
and variations due to minor differences in experimental conditions (e.g.,
hybridization
conditions) will not affect subsequent analyses. However, it will be
recognized that it is
also possible to use cDNA from a single cell, and compare, for example, the
absolute
amount of a particular exon in, e.g., a drug-treated or pathway-perturbed cell
and an
untreated cell.
61
CA 02540167 2006-03-24
WO 2005/042760 PCT/US2004/032006
When fluorescently labeled probes are used, the fluorescence emissions at each
site
of a transcript array can be, preferably, detected by scanning confocal laser
microscopy. In
one embodiment, a separate scan, using the appropriate excitation line, is
carried out for
each of the two fluorophores used. Alternatively, a laser can be used that
allows
simultaneous specimen illumination at wavelengths specific to the two
fluorophores and
emissions from the two fluorophores can be analyzed simultaneously (see Shalon
et al.,
1996, Genome Res. 6:639-645). In a preferred embodiment, the arrays are
scanned with a
laser fluorescence scanner with a computer controlled X-Y stage and a
microscope
objective. Sequential excitation of the two fluorophores is achieved with a
mufti-line,
mixed gas laser, and the emitted light is split by wavelength and detected
with two
photomultiplier tubes. Such fluorescence laser scanning devices are described,
e.g., in
Schena et al., 1996, Genome Res. 6:639-645. Alternatively, the fiber-optic
bundle
described by Ferguson et al., 1996, Nature Biotech. 14:1681-1684, may be used
to monitor
mRNA abundance levels at a large number of sites simultaneously.
Signals are recorded and, in a preferred embodiment, analyzed by computer,
e.g.,
using a 12 bit analog to digital board. In one embodiment, the scanned image
is despeckled
using a graphics program (e.g., Hijaak Graphics Suite) and then analyzed using
an image
gridding program that creates a spreadsheet of the average hybridization at
each wavelength
at each site. If necessary, an experimentally determined correction for "cross
talk" (or
overlap) between the channels for the two fluors can be made. For any
particular
hybridization site on the transcript array, a ratio of the emission of the two
fluorophores can
be calculated. The ratio is independent of the absolute expression level of
the cognate gene,
but is useful for genes whose expression is significantly modulated by drug
administration,
gene deletion, or any other tested event.
According to the method of the invention, the relative abundance of an mRNA
and/or an exon expressed in an mRNA in two cells or cell lines is scored as
perturbed (i.e.,
the abundance is different in the two sources of mRNA tested) or as not
perturbed (i.e., the
relative abundance is the same). As used herein, a difference between the two
sources of
RNA of at least a factor of 25 percent (e.g., RNA is 25 more abundant in one
source than in
the other source), more usually 50 percent, even more often by a factor of 2
(e.g., twice as
abundant), 3 (three times as abundant), or S (five times as abundant) is
scored as a
perturbation. Present detection methods allow reliable detection of
differences of an order
of 1.5 fold to 3-fold.
62
CA 02540167 2006-03-24
WO 2005/042760 PCT/US2004/032006
It is, however, also advantageous to determine the magnitude of the relative
difference in abundances for an mRNA and/or an exon expressed in an mRNA in
two cells
or in two cell lines. This can be carried out, as noted above, by calculating
the ratio of the
emission of the two fluorophores used for differential labeling, or by
analogous methods
that will be readily apparent to those of skill in the art.
5.5.2 OTHER METHODS OF TRANSCRIPTIONAL STATE
MEASUREMENT
The transcriptional state of a cell can be measured by other gene expression
technologies known in the art. Several such technologies produce pools of
restriction
fragments of limited complexity for electrophoretic analysis, such as methods
combining
double restriction enzyme digestion with phasing primers (see, e.g., European
Patent
534858 Al, filed September 24, 1992, by Zabeau et al.), or methods selecting
restriction
fragments with sites closest to a defined mRNA end (see, e.g., Prashar et al.,
1996, Proc.
Natl. Acad. Sci. USA 93:659-663). Other methods statistically sample cDNA
pools, such as
by sequencing sufficient bases (e.g., 20-50 bases) in each of multiple cDNAs
to identify
each cDNA, or by sequencing short tags (e.g., 9-10 bases) that are generated
at known
positions relative to a defined mRNA end (see, e.g., Velculescu, 1995, Science
270:484-
487).
The transcriptional state of a cell can also be measured by reverse
transcription-
polymerase chain reaction (RT-PCR). RT-PCR is a technique for mRNA detection
and
quantitation. RT-PCR is sensitive enough to enable quantitation of RNA from a
single cell.
See, for example, Pfaffl and Hageleit, 2001, Biotechnology Letters 23, 275-
282; Tadesse et
al., 2003, Mol Genet Genomics 269, p. 789-796; and Kabir and Shimizu, 2003, J.
Biotech.
9, p. 105.
5.6 MEASUREMENT OF OTHER ASPECTS OF THE BIOLOGICAL
STATE
In various embodiments of the present invention, aspects of the biological
state other
than the transcriptional state, such as the translational state, the activity
state, or mixed
aspects can be measured. Thus, in such embodiments, cellular constituent
abundance data
can include translational state measurements or even protein expression
measurements.
63
CA 02540167 2006-03-24
WO 2005/042760 PCT/US2004/032006
Details of aspects of the biological state other than the transcriptional
state are described in
this section.
5.6.1 TRANSLATIONAL STATE MEASUREMENTS
Measurement of the translational state can be performed according to several
methods. For example, whole genome monitoring of protein (e.g., the
"proteome,") can be
carried out by constructing a microarray in which binding sites comprise
immobilized,
preferably monoclonal, antibodies specific to a plurality of protein species
encoded by the
cell genome. Preferably, antibodies are present for a substantial fraction of
the encoded
proteins, or at least for those proteins relevant to the action of a drug of
interest. Methods
for making monoclonal antibodies are well known (see, e.g., Harlow and Lane,
1988,
Antibodies: A Laboratory Manual, Cold Spring Harbor, New York, which is
incorporated in
its entirety for all purposes). In one embodiment, monoclonal antibodies are
raised against
synthetic peptide fragments designed based on genomic sequence of the cell.
With such an
antibody array, proteins from the cell are contacted to the array and their
binding is assayed
with assays known in the art.
Alternatively, proteins can be separated by two-dimensional gel
electrophoresis
systems. Two-dimensional gel electrophoresis is well-known in the art and
typically
involves iso-electric focusing along a first dimension followed by SDS-PAGE
electrophoresis along a second dimension. See, e.g., Hames et al., 1990, Gel
Electrophoresis of Proteins: A Practical Approach, IRL Press, New York;
Shevchenko et
al., 1996, Proc. Natl. Acad. Sci. USA 93:1440-1445; Sagliocco et al., 1996,
Yeast 12:1519-
1533; Lander, 1996, Science 274:536-539. The resulting electropherograms can
be
analyzed by numerous techniques, including mass spectrometric techniques,
Western
blotting and immunoblot analysis using polyclonal and monoclonal antibodies,
and internal
and N-terminal micro-sequencing. Using these techniques, it is possible to
identify a
substantial fraction of all the proteins produced under given physiological
conditions,
including in cells (e.g., in yeast) exposed to a drug, or in cells modified
by, e.g., deletion or
over-expression of a specific gene.
64
CA 02540167 2006-03-24
WO 2005/042760 PCT/US2004/032006
5.6.2 OTHER TYPES OF CELLULAR CONSTITUENT ABUNDANCE
MEASUREMENTS
The methods of the invention are applicable to any cellular constituent that
can be
monitored. For example, where activities of proteins can be measured,
embodiments of this
invention can use such measurements. Activity measurements can be performed by
any
functional, biochemical, or physical means appropriate to the particular
activity being
characterized. Where the activity involves a chemical transformation, the
cellular protein
can be contacted with the natural substrate(s), and the rate of transformation
measured.
Where the activity involves association in multimeric units, for example
association of an
activated DNA binding complex with DNA, the amount of associated protein or
secondary
consequences of the association, such as amounts of mRNA transcribed, can be
measured.
Also, where only a functional activity is known, for example, as in cell cycle
control,
performance of the function can be observed. However known and measured, the
changes
1 S in protein activities form the response data analyzed by the foregoing
methods of this
invention.
In some embodiments of the present invention, cellular constituent
measurements
are derived from cellular phenotypic techniques. One such cellular phenotypic
technique
uses cell respiration as a universal reporter. In one embodiment, 96-well
microtiter plates,
in which each well contains its own unique chemistry, is provided. Each unique
chemistry
is designed to test a particular phenotype. Cells from the organism of
interest are pipetted
into each well. If the cells exhibit the appropriate phenotype, they will
respire and actively
reduce a tetrazolium dye, forming a strong purple color. A weak phenotype
results in a
lighter color. No color means that the cells don't have the specific
phenotype. Color
changes can be recorded as often as several times each hour. During one
incubation, more
than 5,000 phenotypes can be tested. See, for example, Bochner et al., 2001,
Genome
Research 11, p. 1246.
In some embodiments of the present invention, cellular constituent
measurements
are derived from cellular phenotypic techniques. One such cellular phenotypic
technique
uses cell respiration as a universal reporter. In one embodiment, 96-well
microtiter plates,
in which each well contains its own unique chemistry is provided. Each unique
chemistry is
designed to test a particular phenotype. Cells from biological specimens of
interest are
pipetted into each well. If the cells exhibit the appropriate phenotype, they
will respire and
actively reduce a tetrazolium dye, forming a strong purple color. A weak
phenotype results
in a lighter color. No color means that the cells don't have the specific
phenotype. Color
CA 02540167 2006-03-24
WO 2005/042760 PCT/US2004/032006
changes may be recorded as often as several times each hour. During one
incubation, more
than 5,000 phenotypes can be tested. See, for example, Bochner et al., 2001,
Genome
Research 11, 1246-55.
In some embodiments of the present invention, the cellular constituents that
are
measured are metabolites. Metabolites include, but are not limited to, amino
acids, metals,
soluble sugars, sugar phosphates, and complex carbohydrates. Such metabolites
can be
measured, for example, at the whole-cell level using methods such as pyrolysis
mass
spectrometry (Irwin, 1982, Analytical Pyrolysis: A Comprehensive Guide, Marcel
Dekker,
New York; Meuzelaar et al., 1982, Pyrolysis Mass Spectrometry of Recent and
Fossil
Biomaterials, Elsevier, Amsterdam), fourier-transform infrared spectrometry
(Griffiths and
de Haseth,1986, Fourier transform infrared spectrometry, John Wiley, New York;
Helm et
al., 1991, J. Gen. Microbiol. 137, 69-79; Naumann et al., 1991, Nature 351, 81-
82;
Naumann et al., 1991, In: Modern techniques for rapid microbiological
analysis, 43-96,
Nelson, W.H., ed., VCH Publishers, New York), Raman spectrometry, gas
chromatography-
mass spectroscopy (GC-MS) (Fiehn et al., 2000, Nature Biotechnology 18, 1157-
1161,
capillary electrophoresis (CE)/MS, high pressure liquid chromatography / mass
spectroscopy (HPLC/MS), as well as liquid chromatography (LC)-Electrospray and
cap-LC-tandem-electrospray mass spectrometries. Such methods can be combined
with
established chemometric methods that make use of artificial neural networks
and genetic
programming in order to discriminate between closely related samples.
5.7 ANALYTIC KIT IMPLEMENTATION
In one embodiment, the methods of this invention can be implemented by use of
kits
for developing and using biological classifiers. Such kits contain
microarrays, such as those
described in subsections above. The microarrays contained in such kits
comprise a solid
phase, e.g., a surface, to which probes are hybridized or bound at a known
location of the
solid phase. Preferably, these probes consist of nucleic acids of known,
different sequence,
with each nucleic acid being capable of hybridizing to an RNA species or to a
cDNA
species derived therefrom. In a particular embodiment, the probes contained in
the kits of
this invention are nucleic acids capable of hybridizing specifically to
nucleic acid sequences
derived from RNA species in cells collected from an organism of interest.
In a preferred embodiment, a kit of the invention also contains one or more
data
structures and/or software modules described above and in Figs. 1-3 and/or 5,
encoded on
66
CA 02540167 2006-03-24
WO 2005/042760 PCT/US2004/032006
computer readable medium, and/or an access authorization to use the databases
described
above from a remote networked computer.
In another preferred embodiment, a kit of the invention contains software
capable of
being loaded into the memory of a computer system such as the one described
supra, and
illustrated in Fig. 1. The software contained in the kit of this invention, is
essentially
identical to the software described above in conjunction with Fig. 1.
Alternative kits for implementing the analytic methods of this invention will
be
apparent to one of skill in the art and are intended to be comprehended within
the
accompanying claims.
6. REFERENCES CITED
All references cited herein are incorporated herein by reference in their
entirety and
for all purposes to the same extent as if each individual publication or
patent or patent
application was specifically and individually indicated to be incorporated by
reference in its
entirety for all purposes.
The present invention can be implemented as a computer program product that
comprises a computer program mechanism embedded in a computer readable storage
medium. For instance, the computer program product could contain the program
modules
shown in Fig. 1 and/or the database schema shown in Figs. 2 and 3. These
program
modules can be stored on a CD-ROM, magnetic disk storage product, or any other
computer
readable data or program storage product. The software modules in the computer
program
product can also be distributed electronically, via the Internet or otherwise,
by transmission
of a computer data signal (in which the software modules are embedded) on a
carrier wave.
Many modifications and variations of this invention can be made without
departing
from its spirit and scope, as will be apparent to those skilled in the art.
The specific
embodiments described herein are offered by way of example only, and the
invention is to
be limited only by the terms of the appended claims, along with the full scope
of equivalents
to which such claims are entitled.
67