Note : Les descriptions sont présentées dans la langue officielle dans laquelle elles ont été soumises.
CA 02551991 2006-07-05
WO 2005/067582 PCT/US2005/001867
METHODS AND APPARATUS FOR ENHANCED SAMPLE IDENTIFICATION
BASED ON COMBINED ANALYTICAL TECHNIQUES
Reference to Related Applications
This application claims the benefit of and priority to U.S. Provisional
Application
No. 60/536,182, filed on January 13, 2004, entitled "DMS-IMS Chemical
Identification
System." The entire teachings of the above referenced application are
incorporated
herein by reference.
This application also incorporates by reference the entire contents of the
following co-pending U.S. Patent Applications: U.S. Ser. No. 10/187,464, filed
on 28
June 2002; U.S. Ser. No. 10/215,251, filed on 7 August 2002; U.S. Ser. No.
10/462,206,
filed on 13 June 2003; U.S. Ser. No. 10/684,332, filed on 10 October 2003;
U.S. Ser. No.
10/734,499, filed on 12 December 2003; U.S. Ser. No. 10/738,967, filed on 17
December
2003; U.S. Ser. No. 10/797,466, filed on 10 March 2004; U.S. Ser. No.
10/821,812, filed
on 8 April 2004; U.S. Ser. No. 10/824,674, filed on 14 April 2004; U.S. Ser.
No.
10/836,432, filed on 30 April 2004; U.S. Ser. No. 10/840,829, filed on 7 May
2004; U.S.
Ser. No. 10/866645, filed on 10 June 2004; U.S. Ser. No. 10/887,016, filed on
8 July
2004; U.S. Ser. No. 10/894,861, filed on 19 July 2004; U.S. Ser. No.
10/903,497, filed
on 30 July 2004; U.S. Ser. No. 10/916,249, filed on 10 August 2004; U.S. Ser.
No.
10/932, 986, filed on 2 September 2004; U.S. Ser. No. 10/943,523, filed on 17
September 2004; U.S. Ser. No. 10/981,001, filed on 4 November 2004; U.S. Ser.
No.
10/998,344, filed 24 November 2004; and U.S. Ser. No. 11/015,413, filed on
December
17, 2004.
-1-
CA 02551991 2006-07-05
WO 2005/067582 PCT/US2005/001867
Field of the Invention
The invention relates generally to mobility-based systems, methods and devices
for analyzing samples. More particularly, in various embodiments, the
invention relates
to improving the detection capability of ion mobility based systems using DMS
in
combination with other detection techniques, such as IMS detection techniques,
to
analyze the constituents of a sample.
Background
There are a number of different circumstances in which it is desirable to
perform
analysis to identify compounds in a sample. Such samples may be taken directly
from
the environment or they may be provided by front end specialized devices to
separate or
prepare compounds before analysis. There exists, a demand for low cost,
compact, low-
power, accurate, easy to use, and reliable devices capable of detecting
compounds in a
sample.
One class of known analyzers are mass spectrometers (MS). Mass spectrometers
are generally recognized as being the most accurate type of analyzers for
compound
identification. However, mass spectrometers are quite expensive, easily
exceeding a cost
of $100,000 or more and are physically large enough to become difficult to
deploy
everywhere the public might be exposed to dangerous chemicals. Mass
spectrometers
also suffer from other shortcomings such as the need to operate at relatively
low
pressures, resulting in complex support systems. They also need a highly
trained operator
to tend to and interpret the results. Accordingly, mass spectrometers are
generally
difficult to use outside of laboratories.
A class of chemical analysis instruments more suitable for field operation is
known as Field Asymmetric Ion Mobility Spectrometers (FAIMS) or Differential
Mobility Spectrometers (DMS), and also known as Radio Frequency Ion Mobility
Spectrometers (RFIMS) among other names. Hereinafter, FAIMS, DMS, and RFIMS,
are referred to collectively as DMS. This type of spectrometer subjects an
ionized fluid
(e.g., gas, liquid or vaper) sample to a varying high-low asymmetric electric
field and
filters ions based on their field mobility.
The sample flows through a filter field which allows selected ion species to
pass
through, according to a compensation voltage (Vcomp) applied to filter
electrodes, and
specifically those ions that exhibit particular mobility responses to the
filter field. An ion
-2-
CA 02551991 2006-07-05
WO 2005/067582 PCT/US2005/001867
detector then collects ion intensitylabundancy data for the detected ions. The
intensity
data exhibits attributes, such as "peaks" at particular compensation voltages.
A typical DMS device includes a pair of electrodes in a drift tube. An
asymmetric RF field is applied to the electrodes across the ion flow path. The
asymmetric RF field, as shown in Fig. l, alternates between a high or "peak"
field
strength and a low field strength. The field varies over a particular time
period (T),
frequency (f) and duty cycle (d). The field strength E varies with an applied
field voltage
(Vrf) and the size of the gap between the electrodes. Ions pass through the
gap between
the electrodes when their net transverse displacement per period of the
asymmetric field
is zero. In contrast, ions that undergo a net displacement eventually undergo
collisional
neutralization on one of the electrodes. In a given RF field, a displaced ion
can be
restored to the center of the gap (i.e. compensated, with no net displacement
for that ion)
by superimposing a low strength direct current (dc) electric field (e.g., by
applying
Vcomp across the filter electrodes) on the RF. Ions with differing
displacement (owing
to characteristic dependence of mobility in the particular field) pass through
the gap at
differing characteristic compensation voltages. By applying a substantially
constant
Vcomp, the system can be made to function as a continuous ion filter.
Alternatively,
scanning Vcomp obtains a spectral measurement for a sample. A recorded image
of the
spectral scan of the sample is sometimes referred to as a "mobility scan" or
as an
"ionogram."
Examples of mobility scans based on the output from a DMS device are shown in
Figs. 2A and 2B. The compounds for which scans are depicted are acetone and an
isomer of xylene (o-xylene). The scan of Fig. 2A resulted from a single
compound,
acetone, being independently applied to the DMS analyzer. The illustrated plot
is typical
of the observed response of the DMS device, with an intensity of detected ions
dependent on Vcomp. For example, the acetone sample exhibits a peals intensity
response at a Vcomp of approximately-2 Vdc.
Fig. 2B illustrates the results when analyzing a mixture of acetone and o-
xylene.
The combined response shows two peals in approximately the same region as for
the
independent case. The compounds in the mixture can be detected by comparing
the
response against a library, for example, of stored known responses for
independently
analyzed compounds, or libraries of mixtures. Thus, the scans fox
independently
-3-
CA 02551991 2006-07-05
WO 2005/067582 PCT/US2005/001867
analyzed compounds, such as the scan of Fig. 2A for acetone, can be stored in
a
computer system, and when compound responses such as that in Fig. 2B are
observed,
the relative locations of the peaks can be compared against the stored
responses in the
library to determine the constitution of the compound.
A specific RF field voltage and field compensation voltage Vcomp permits only
ion species having a particular ion mobility characteristic to pass through
the filter to the
detector. By noting the RF level and compensation voltage and the
corresponding
detected signal, various ion species can be identified, as well as their
relative
concentrations (as seen in the peak characteristics).
Consider a plot of ion mobility dependence on Vrf, as shown in Fig. 3. This
figure shows ion intensity/abundancy versus RF field strength for three
examples of ions,
with field dependent mobility (expressed as the coefficient of high field
mobility, a)
shown for species at greater, equal to and less than zero. The velocity of an
ion can be
measured in an electric field (E) low enough so that velocity (v) is
proportional to the
electrical field as v = KE, through a coefficient (K) called the coefficient
of mobility. K
can be shown to be related to the ion species and gas molecular interaction
properties.
This coefficient of mobility is considered to be a unique parameter that
enables the
identification of different ion species and is determined by, ion properties
such as charge,
size, and mass as well as the collision frequency and energy obtained by ions
between
collisions.
When the ratio of E/N, where N is gas density, is small, K is constant in
value,
but at increasing E/N values, the coefficient of mobility begins to vary. The
effect of the
electric field can be expressed approximately as K(E) = K(0)[1+a(E)], where
K(0) is a
low voltage coefficient of mobility, and a is a specific parameter showing the
electric
field dependence of mobility for a specific ion.
Thus, as shown in Fig. 3, at relatively low electric field strengths, for
example, of
less than approximately 10,000 V/cm, multiple ions may have the same mobility.
However, as the electric field strengths increase, the different species
diverge in their
response such that their mobility varies as a function of the applied electric
field. This
shows that ion mobility is independent of applied RF field voltage at
relatively low RF
field strengths, but is field-dependent at higher RF field strengths.
-4-
CA 02551991 2006-07-05
WO 2005/067582 PCT/US2005/001867
Figs. 2A and 2B demonstrate that species can have a unique behavior in high
fields according to mobility characteristics. The ions passing through the
filter are
detected downstream. The detection signal intensity can be plotted as a
characteristic
detection peak for a given RF field voltage and field compensation voltage
Vcomp. Peals
intensity, location, and shape are typically used for species identification.
However, a problem occurs in that the peaks, as seen in the typical DMS
spectra,
are generally broad in width. Therefore, compounds exhibiting intensity peaks
at similar
compensation voltages may be difficult to separate from each another.
Consequently,
there may be particular conditions under which two different chemicals
generate
indistinguishable scans for a particular Vcomp and a particular RF field
voltage, or for
other combinations of filter field l flow channel parameters. In such a case,
it is may not
be possible to differentiate between the two different compounds. Another
problem may
occur when two or more chemical species have the same or almost the same ion
mobility
characteristic for a particular set of field / flow channel parameters. This
is most likely
to happen in the low electric field regime (referred to herein as Ion Mobility
Spectrometry or IMS), where many existing ion mobility spectrometer systems
operate.
Therefore, if two or more chemical species have the same or almost the same
mobility
characteristic, then their spectroscopic peaks will overlap, and
identification and
quantification of individual species will be difficult or impossible.
Fig. 4 is a graph of Vcomp versus Vrf according to an illustrative embodiment
of
the invention, but also highlighting the above described prior art drawbaclc.
More
particularly, Fig. 4 depicts a graph of Vcomp versus Vrf for four compounds:
lutidine;
cyclohexane; benzene; and dimethyl-methl-phosphonate (DMMP). Each curve shows
the location of detected ion intensity peaks, such as those circled at 100, at
the various
(Vrf, Vcomp) locations, which in total provide the peak characteristics for
each particular
compound. As shown, there is a region 100 in which the intensity peaks and
mobility
curves for DMMP and cyclohexane overlap with each other. As can be seen,
operating
in a Vrf region of from approximately 2,500 Vpeak to approximately 2,650
Vpeak, at a
Vcomp of about -6 Vdc to about -~ Vdc, one would find it virtually impossible
to
discriminate between the two compounds based on a single Vcomp scan at a
single Vrf.
Specifically, in a conventional spectral scan approach that plots
intensity/abundance
-5-
CA 02551991 2006-07-05
WO 2005/067582 PCT/US2005/001867
versus Vcomp over a range of Vcomp for a single Vrf plots the overlapping
peaks as a
single peak.
Another drawback of conventional mobility based ion detection systems is that
they are susceptible to competitive ionization, such as atmospheric pressure
competitive
ionization (APCI). APCI occurs when one compound is preferentially ionized
over
another compound. If a desired compound is not ionized into an ion species, a
mobility-
based detector will not identify or detect the presence of that compound.
Systems have
been developed that remove compounds from a sample that preferentially ionize
to
enable a desired compound to then be ionized and detected. For example, a gas
chromatograph (GC) has been employed as a front end for a DMS to pre-separate
a
sample into its constituent compounds before detection. However, GCs are
generally
slow, and add complexity and expense to mobility-based detection systems.
Also,
conventional mobility based ion detection systems are not sensitive enough to
detect
very small amounts of chemical or biological agents which may pose a health
risk to
humans.
A further drawback of mobility based ion detection systems is that these
systems
often employ one type of ion mobility detection technique. While one ion
mobility
detection technique may provide adequate identification for certain types of
ion species
and/or sample constituent, other ion mobility detection techniques may be
better suited
for the identification of other types of ion species and/or sample
constituents.
Accordingly, there is a need for improved ion mobility based compound
identification using a combination of detection techniques such as DMS in
combination
with IMS detection.
Summary of the Invention
The invention addresses the deficiencies of the prior art by providing, in
various
embodiments, improved mobility based systems, devices and methods for
analyzing
constituents in a sample. More particularly, in various embodiments, the
invention
provides for improved sample analysis by employing multiple detection
techniques, such
as combined IMS and DMS techniques.
Sample analysis may be enhanced by combining DMS techniques with sample
detection using another type of device such as IMS, TOF 1MS, MS,
electrochemical
-6-
CA 02551991 2006-07-05
WO 2005/067582 PCT/US2005/001867
detector, or the like. In one illustrative embodiment of the invention, DMS
detection is
combined with 1MS detection to enhance sample identification.
IMS technology uses the coefficient of mobility (K) to identify chemical
constituents of a sample by measuring the different values of mobility
associated with
different sample constituent ion species. The coefficient of mobility K may be
expressed
as: K(E)=K(0)[1-a(E)].
Because a conventional TOF IMS operates at low field conditions, a TOF IMS
may be employed to plot and determine the K(0) of a particular ion species.
Because a
DMS alternately operates at high and low field conditions, a DMS may be
employed to
plot and determine the alpha parameter a(E) of a particular ion species. Thus,
by using a
DMS in combination with a TOF IMS, the coefficient of mobility K(E) for a
particular
ion species may be plotted over a range of electric field strengths and,
thereby, provide
enhanced ion species identification based on the derived coefficient of
mobility over a
range of field strengths.
Also, by detecting a select ion species using multiple detection techniques,
improved analysis may be achieved where one detection technique, e.g., DMS,
provides
better ion species differentiation and identification than another detection
technique, e.g.,
TOF M, and visa versa.
In one embodiment of the invention, a system for identifying a constituent in
a
sample includes a first analyzer for measuring an differential field mobility
characteristic
as a function of a varying RF electric field strength for the sample to
determine an ion
mobility sig~iature for the sample. The system also includes a second analyzer
measuring low field ion mobility coefficient for the sample and a processor
for
determining a total coefficient of mobility for the sample based at least in
part on the ion
mobility signature and the low field mobility coefficient of the sample, and
for
identifying the constituent based at least in part on the total coefficient of
mobility for the
sample. The first analyzer may include a DMS while the second analyzer may
include
an IMS.
In another embodiment, the second analyzer employs a modulated electric field
voltage for measuring the low field ion mobility coefficient for the sample.
In certain embodiments, the first analyzer includes detectors for determining
the
ion mobility signature for the sample for both negative and positive mode ions
while the
7_
CA 02551991 2006-07-05
WO 2005/067582 PCT/US2005/001867
second analyzer includes one or more collectors for measuring the low field
ion mobility
coefficient for the sample for both the negative and positive mode ions. The
system also
includes a processor that determines the total coefficient of mobility for
both the positive
and negative mode ions.
In a further embodiment of the invention, a system for identifying a
constituent in
a sample includes a DMS analyzer for measuring a first ion mobility
characteristic for
the sample and a first IMS analyzer fox measuring a second ion mobility
characteristic
for the sample. The first and second ion mobility characteristics may be
either or both
positive and negative mode characteristics. The system also includes a
processor for
identifying the constituent based at least in part on at Ieast one of the
first and second ion
mobility characteristics.
hl one embodiment, the processor identifies the constituent based at least in
part
on a combination of both the first and second ion mobility characteristics. In
another
embodiment, the processor selects, based at least in paxt on a mass of the
sample, either
the first or the second ion mobility characteristic for use in.identifying the
constituent. Tn
certain embodiments, the DMS includes a detector that operates as a shutter
fox gating
ions into the first IMS analyzer. In other embodiments, the system includes an
outlet for
exhausting neutral molecules from the DMS analyzer without introducing the
neutral
molecules into the first IMS analyzer.
Tn another embodiment, the system includes a second IMS analyzer for
measuring a third ion mobility characteristic. In this case, the processor
identifies the
constituent based at least in part on the first, second and third ion mobility
characteristics. The second ion mobility characteristic may be a positive mode
characteristic while the third ion mobility characteristic may be a negative
mode
characteristic.
In certain embodiments, the first and second analyzers measure the first and
second ion mobility characteristics concurrently.
In a fixrther embodiment, a system for identifying a constituent in a sample
includes an analyzer operable in a first mode for measuring an differential
field mobility
characteristic as a function of a varying RF electric field strength for the
sample to
determine an ion mobility signature for the sample, and operable in a second
mode for
measuring low field ion mobility coefficient for the sample. The system also
includes a
_g_
CA 02551991 2006-07-05
WO 2005/067582 PCT/US2005/001867
processor for determining a total coefficient of mobility for the sample based
at least in
part on the ion mobility signature and the low field mobility coefficient of
the sample,
and for identifying the constituent based at least in part on the total
coefficient of
mobility for the sample. The first mode may be a DMS mode and the second mode
may
be an IMS mode.
As discussed above, atmospheric pressure competitive ionization (APCI) may
cause compounds with the highest proton affinity (PA) and/or highest electron
affinity
(EA) to capture preferentially or take up the charge from an ionization
source. If there is
a limited amount of charge available, for example, in a compact DMS system
with
limited power resources, the amount of available charge may not be sufficient
to charge
or ionize all of the molecules in a sample matrix. Thus, if only some of the
molecules in
a sample matrix are ionized, only that limited amount of molecules may be
detected,
resulting in erroneous analysis of a chemical matrix. Furthermore, certain
compounds
may not be ionized due to APCI, resulting in no detection of these compounds.
According to one aspect, the invention pre-separates certain ion species of a
sample to reduce, and in some cases, eliminate the problem of competitive
ionization
within ion based mobility detection analyzers. The invention includes
embodiments that
eliminate or mitigate the effects of competitive ionization by separating ion
species
before sample detection to prevent one ion species from consuming the charge
intended
to be used to ionize another ion species.
According to one embodiment, neutrals, i.e., molecules of a sample that are
not
ionized, axe mixed with a new supply of charge, e.g., reactant ions or a
plasma field, to
enable further APCI reactions to occur. The newly created ions may then be
removed for
analysis or simply discarded. This process may be repeated until a desired
compound
type is ionized and detected using an analyzer.
In one implementation, a sample matrix is exposed to an ionization source to
cause particular compounds in the sample to be ionized, the ionized compounds
to be
removed, and the residual neutrals to be re-circulated. The ionization source
may be, for
example, an ITV source, laser, plasma source, soft X-ray source, or reactant
ions.
Repeated interrogation of chemical compounds in a sample based on competitive
ionization and the reaction of residual andlor un-reacted neutrals provides a
-9-
CA 02551991 2006-07-05
WO 2005/067582 PCT/US2005/001867
comprehensive measure of the chemical composition of the sample, without the
need for
traditional GC techniques.
The process of competitive ionization and the removal of product ions may be
repeated, enabling incremental isolation of product ions and neutrals.
Additionally,
chemical ionization may be employed to inject fresh charge using reactant
ions.
According to one aspect, the invention ionizes sample molecules to cause a
subset of the sample molecules to combine to form first product ions. It then
separates
the first product ions from a first un-io~uzed group of sample molecules.
Next, it ionizes
a subset of the first un-ionzed group of sample molecules to form second
product ions,
and separates the second product ions from a second un-ionized group of sample
molecules.
In one embodiment, the invention flows the first un-ionized group of sample
molecules and the first product ions through a first field to separate the
first product ions
from the first un-ionized group of sample molecules. According to one
implementation
of this embodiment, the inventions flows the second un-ionized group of sample
molecules and the second product ions through a second field to separate the
second
product ions from the second un-ionized group of sample molecules. In some
implementations, the first and second fields are the same field. However, in
other
implementations, the first and second fields are different fields.
In an alternative embodiment, the invention employs a mechanical separation
for
separating the first product ions from the first un-ionized group of sample
molecules.
According to another alternative embodiment, the invention employs a chemical
process
for separating the first product ions from the first un-ionized group of
sample molecules.
According to another embodiment, the invention, subsequent to extracting the
second product ions, ionizes a subset of the second un-ionized group of sample
molecules to form third product ions, and separates the third product ions
from a third
un-ionized group of sample molecules.
The invention employs various approaches for ionizing the sample molecules. In
some instances, the invention mixes the first reactant ions with the sample
molecules to
form the first product ions. The invention may also mix the second reactant
ions with the
first un-ionized group of sample molecules to form the second product ions.
According
to one feature, the invention controls an effluent flow to control contact
time between the
-10-
CA 02551991 2006-07-05
WO 2005/067582 PCT/US2005/001867
first reactant ions and the sample molecules. According to another feature,
the invention
injects the first reactant ions into a flow of the sample molecules to mix the
sample
molecules to with first reactant ions.
According to one approach, the invention exposes the sample molecules to a
first
ionization source to form the first product ions, and re-circulates the first
un-ionized
group of sample molecules to expose them to the first ion source to form the
second
product ions. According to an alternative approach, the invention exposes the
sample
molecules to a first ion source to form the first product ions, and flows the
first un-
ionized group of sample molecules to expose them to a second ion source to
form the
second product ions.
According to one embodiment, the invention flows the sample molecules along a
first flow path past a first ionization source to form the first product ions
and then directs
the first product ions along a second flow path to separate the first product
ions from the
first un-ionized group of sample molecules. The invention may further flow the
first un-
ionized group of sample molecules past a second ionization source in the first
flow path
to form the second product ions and then direct the second product ions into
the second
flow channel to separate the second product ions from a second un-ionized
group of
sample molecules. The invention may further flow the second un-ionized group
of
sample molecules past a third ionization source in the f rst flow channel to
form the third
product ions and then direct the third product ions into the second flow
chamiel to
separate the third product ions from a third un-ionized group of sample
molecules.
The invention employs various approaches to directing product ions. In some
instances, the directing includes attracting the first product ions into the
second flow
channel. In other instances, the directing includes deflecting the first
product ions into
the second flow channel. The directing may also include directing the first
product ions
into the second flow channel via an opening in a barrier between the first and
second
flow channels. In certain instances, the first flow path includes a
substantially cylindrical
portion while the second flow channel is substantially enclosed.
Alternatively, the
second flow path may be substantially unenclosed.
In certain embodiments, the invention mixes the sample molecules with one or
more dopants to improve separation of the first product ions from the first un-
ionized
group of sample molecules. The dopants may include any one or combination of
-11-
CA 02551991 2006-07-05
WO 2005/067582 PCT/US2005/001867
methylene bromide (CH2Br2), methylene chloride (CHZCla), chloroform (CHC13),
water
(H20), methanol (CH30H), and isopropanol.
According to another aspect, the invention ionizes sample molecules to cause a
subset of the sample molecules to combine to form first product ions and
separates the
first product ions from a first un-ionized group of sample molecules.
Subsequent to
separating the first product ions, the invention ionizes a subset of the first
un-ionized
group of sample molecules to form second product ions and separates the second
product
ions from a second un-ionized group of sample molecules. Then, the invention
analyzes
the sample based at least in part on the first and second product ions.
In one embodiment, tho invention flows the first and second product ions to
the
first analyzer and processes the information from the first analyzer about the
first and
second product ions to perform an analysis of the sample. In an alternative
embodiment,
the invention flows the first product ions to a first analyzer, flows the
second product
ions to a second analyzer, and processes the information from the first and
second
analyzers about the first and second product ions to perform an analysis of
the sample.
The first and second analyzers may be in series or parallel with each other.
In certain
instances, the invention analyzes the sample based at least in part on at
least one of the
first and second groups of un-ionized sample molecules.
In another embodiment, the invention directs the first product ions from a
first
flow channel into an analyzer flow channel and causes a flow from the analyzer
flow
channel toward a first flow channel containing the first product ions and the
first group
of un-ionized sample molecules. The flow is directed from the analyzer to
inhibit the
first un-ionized groups of sample molecules from entering the a~ialyzer flow
chamiel.
Tn another embodiment, a system for pre-separating a sample includes a first
ionizer for ionizing sample molecules to cause a subset of the sample
molecules to
combine to form first product ions and a first separator for separating the
first product
ions from a first un-ionized group of sample molecules. The system also
includes a
second ionizer for ionizing a subset of the first un-ionized group of sample
molecules to
form second product ions and a second separator for separating the second
product ions
from a second un-ionized group of sample molecules. The first and second
ionizers may
be the same ionizer or different ionizers. Also, the first and second
separators may be the
same separator or different separators.
-12-
CA 02551991 2006-07-05
WO 2005/067582 PCT/US2005/001867
In another embodiment, a compact DMS system includes a sample pre-separation
unit for pre-separating product ions from un-ionized sample molecules, a
filter unit for
passing particular ones of the product ions, and a detection unit for
detecting the
particular ones of the product ions passed by the filter unit.
S In addition to being used for analysis, the invention may be used for
selectively
cleaning and/or conditioning samples, e.g., for removing selected molecules
from a
sample stream. Fox example, certain semiconductor industry or other process
control
applications require ultra pure or clean gasses. In these processes, water
molecules are
considered a contaminant in a gas stream of Nitrogen or Argon. Tn certain
embodiments
of the invention, water within a gas sample may be preferentially ionized and
then
removed from the gas stream while purified Argon or Nitrogen are then used in
a low
pressure chemical vapor deposition or for another semiconductor application.
While current mobility based analyzers such as DMS, TMS, and MS systems are
sensitive, there is a need to detect concentrations in ranges lower than parts-
per-trillion
(ppt). For instance, a very small number of anthrax spores may cause
significant health
effects. However, existing analyzers may not be sensitive enough to detect the
charge
generated by such a small number of spores. One technique for overcoming this
limitation involves concentrating and/or amplifying the number of molecules of
a
sample, in time, to enable an analyzer to produce a larger signal for
detection.
In embodiment, the invention ionizes the molecules of a sample and then
filters
the ionized sample to pass particular ion species of a sample constituent to a
detector.
The invention mixes the constituent from the detector with additional
molecules of the
sample and then ionizes the mixture of the constituent and the additional
molecules of
the sample. The invention then filters the ionized mixture.to pass a
concentration of the
particular ion species of the constituent to the detector. The preceding steps
of mixing,
ionizing, and filtering may be repeated until a desired concentration of the
particular ion
species of the constituent is achieved and detected.
In other embodiments, the invention provides improved sample collection,
filtration, detection, measurement, identification and/or analysis
(collectively "analysis")
using, for example: dispersion characteristics; sample fragmentation; and/or
sample
processing variations, such as and without limitation, variations in flow
channel / filter
field conditions. Such conditions may include, any spectral changes,
including, without
-13-
CA 02551991 2006-07-05
WO 2005/067582 PCT/US2005/001867
limitation changes in: pressure; temperature; humidity; field strength, duty
cycle, and/or
frequency; field voltage amplitude, frequency and/or duty cycle; detector bias
voltage
magnitude and/or polarity; and/or filter field compensation voltage magnitude
and/or
polarity.
In one practice, the invention employs one or more of the above to provide a
library of spectral signatures for a plurality of known species, and
identifies unknown
species by comparing at least a portion of a spectral signature for the
unknown species to
at least a portion of one or more of the spectral signatures stored in the
library. The
spectral signature is a compilation of spectral information for a particular
species. The
spectral information may include, without limitation, spectral peak amplitude;
spectral
peak width; spectral peak slope; spectral peak spacing; spectral peak
quantity; relative
shifts in spectral peaks due, for example, to changes in processing
conditions; spectral
discontinuities; Vrf versus Vcomp characteristics or any other characteristics
of any of
the above described conditions plotted against any one or more other above
described
conditions.
According to one aspect, the invention provides improved ion-based systems,
methods and devices for analyzing samples by varying a first sample processing
condition over a first plurality of values, and one or more second sample
processing
conditions over a second plurality of values to determine spectral information
for a
sample. In one particular embodiment, the invention scans a field compensation
voltage
Vcomp over a range of values for one or more Vrf values to generate a spectral
representation at each of the one or more Vrf values.
According to one feature, the invention adjusts a third sample processing
condition to narrow the widths of the resulting spectral peals of the
determined ion
spectral information. Such width reduction reduces spectral peals overlap fox
samples
having similar mobility characteristics, improves resolution of an ion
mobility-based
analyzer, and thus, provides more accurate discrimination between sample
species. In
one configuration, the third sample processing condition includes pressure in
a sample
flow channel, and the invention reduces the pressure in the sample flow
channel to
decrease the width of the spectral peaks.
According to another feature, the invention adjusts a third sample processing
condition to change a location of the resulting spectral peaks of the
determined ion
-14-
CA 02551991 2006-07-05
WO 2005/067582 PCT/US2005/001867
spectral information, relative to a Vcomp at which they occur. Since peaks of
differing
species may shift differently, such shifts can provide improved discrimination
between
peaks of species having similar mobility characteristics. In one
configuration, the third
sample processing condition includes Vrf, and the invention applies more than
two field
voltages Vrf to provide peak shifting information for species identification.
According to another feature, the invention adjusts a third sample processing
condition to provide spectral information regarding both positive and negative
ions of the
sample. More particularly, in one configuration, the invention provides both
negative
and a positive bias voltages to multiple detector electrodes concurrently or
to a single
detector electrode alternatively to provide both negative and positive mode
scans. Since
compounds that have similar ion mobility characteristics relative to one mode
may have
differing ion mobility characteristics relative to the other mode, adjusting
the polarity of
a bias voltage to detector electrodes can further improve sample analysis.
In a further embodiment, the invention employs various n-dimensional
representations of ion spectral information, to enhance the quality of
spectral signatures,
improve differentiation between species having similar ion mobility
characteristics, and
thus, improve identification accuracy, specifically, and sample analysis,
generally. By
way of example, in one configuration, the invention scans Vcomp for > 2 field
voltages
Vrf, to capture additionally, for example, spectral peak shift information.
The invention
then generates an n-dimensional representation of the spectral information
that
aggregates the spectral information captured by scanning Vcomp at each Vrf. In
one
example, the n-dimensional representation is a two-dimensional plot of Vrf
versus
Vcomp aggregating the spectral information captured by scanning Vcomp at each
of the
> Vrf field voltages. In a fizrther example, the aggregated representation is
a three-
dimensional representation aggregating the spectral information captured from
scanning
Vcomp at the > 2 Vrf field voltages.
According to one approach, the three-dimensional representation is a plot of
ion
intensity as a function of Vrf and Vcomp. According to one implementation,
Vcomp and
Vrf are represented in special coordinates, such as x- and y- coordinates, and
variations
in ion intensity at the (Vcomp,Vrf) coordinates is represented in variations
of any color-
related feature, including without limitation, variations in gray scale, color
saturation, or
color at those coordinates. Such color-related representations provide easily
recognized
-15-
CA 02551991 2006-07-05
WO 2005/067582 PCT/US2005/001867
distinctions between species that were difficult or impossible to distinguish
between,
without the n-dimensional aggregation of the invention.
In a related implementation, a curve circumscribing the color-related
differences
may be generated and the color-related differences themselves may be
discarded. In this
way, the invention can provide a two-dimensional representation of the
spectral peaks,
for example, on a Vcomp versus Vrf grid, while still incorporating the
spectral
information captured by scanning Vcomp over a plurality of Vrf values. In
another
alternative implementation, Vcomp, Vrf, and ion intensity are mapped into a
three-
dimensional (x,y,z) spatial representation.
According to a related embodiment, any or all of the spectral information may
be
represented in n-dimensional space as a function of any or all of the
processing
variations to create >3 dimensional spectral signatures for both known and
unknown
species. Conventional n-dimensional cluster matching techniques may then be
employed
for identifying the unknown species.
In any of the above described n-dimensional representations, any or all of the
spectral information represented may be incorporated into the spectral
signatures for
known species and stored in the libraxy of such signatures. Conventional
pattern
recognition techniques may be employed to correspond at least portions of the
spectral
signatures from unknown species with at least portions of the signatures from
known
samples stored in the library to identify the unknown species. In other
implementations,
both the library of signatures and the captured signatures from the unknown
species are
represented as mathematical descriptions, and any suitable approach for making
comparisons between such mathematical descriptions may be employed to identify
the
unknown species.
According to another embodiment, the invention employs fragmentation to-
improve DMS analysis. Fragmentation includes breaking large molecules of
samples
into smaller molecules, molecule clusters, components, and/or base elements.
The
fragments may then be individually analyzed, in series and/or in parallel to
generate
more spectral information for the sample than would be otherwise available
without
fragmentation. Fragmentation may be achieved, for example and without
limitation, by
using any one or a combination of a chemical reaction, a high energy field
strength, high
Vrf, heating, laser light, colliding the sample molecules with other
molecules, soft x-ray,
-16-
CA 02551991 2006-07-05
WO 2005/067582 PCT/US2005/001867
electromagnetic waves, or the like. According to one feature, the invention
incorporates
any or all of the above described spectral information for the fragment
spectral peaks into
the spectral signature. According to a further feature, the invention
incorporates the
point (e.g. the temperature, pressure, field strength, Vrf, colliding molecule
mass,
colliding molecule velocity, laser intensity, laser frequency, x-ray intensity
etc.) into the
spectral signature.
According to other aspects, the invention provides various serial and parallel
combinations of ion-based analyzers employing features, including those
summarized
above. In additional aspects, the invention provides various compact,
handheld,
lightweight and Iow power based analyzers, for example, for detecting chemical
warfare
agents (CWAs), Toxic Industrial Compounds (TICs), and/or Toxic Industrial
Materials
(TlMs).
The invention will now be described with reference to various illustrative
embodiments.
Brief Description of the Drawings
The patent or application file contains at least one drawing executed in
color.
Copies of this patent or patent application publication with color drawings
will be
provided by the Office upon request and payment of the necessary fee.
The foregoing and other obj ects, features, advantages, and illustrative
embodiments of the invention will now be described with references to the
following
drawings in which like reference designations refer to the same parts
throughout the
different views. These drawings are not necessarily to scale, emphasis instead
being
placed upon illustrating principles of the invention.
Fig. 1 is a graph depicting an asynunetric field having a peak RF, time
period,
and duty cycle.
Figs. 2A and 2B are graphs showing ion abundance (intensity) versus applied
field compensation voltage for acetone alone and for a combination of ortho-
xylene and
acetone, respectively, as detected in a held asymmetric ion mobility
spectrometer.
Fig. 3 is a graph of ion mobility versus electric field strength for three
different
compounds in a differential mobility spectrometer (DMS).
17-
CA 02551991 2006-07-05
WO 2005/067582 PCT/US2005/001867
Fig. 4 is a graph of Vrf versus Vcomp indicating intensity peak locations
according to an illustrative embodiment of the invention and conceptualizing
drawbacks
of prior art approaches.
Fig. 5 is a conceptual diagram of a DMS according to an illustrative
embodiment
of the invention.
Fig. 6 is a graph of ion intensity versus field compensation voltage.for
positive
mode spectra for a sample containing various amounts of ethyl mercaptan as
measured in
a DMS.
Fig. 7 is a graph of ion intensity versus compensation voltage for negative
mode
spectra of a sample containing various amounts of ethyl rnercaptan.
Fig. 8 is a graph of ion intensity versus field compensation voltage
illustrating
negative mode separation between monomer and reactant ion peak (RIP)
detections for
sulfur hexafluoride (SF6).
Fig. 9 is a graph of ion intensity versus field compensation voltage
illustrating the
positive mode separation between monomer and reactant ion peak (RIf)
detections for
sulfur hexafluoride (SF6).
Fig. 10 is a graph of ion intensity versus field compensation voltage
illustrating a
DMS response at various RF voltage levels in the negative ion mode and also
showing
the RIP detected in absence of SF6.
Fig. 11 is a graph of ion intensity versus field compensation voltage
illustrating a
DMS response in the positive ion mode where the SF6 peak is not isolated from
the RIP.
Fig. 12 is graph of ion intensity (abundance) versus field compensation
voltage
illustrating an ability to improve discrimination between detected ion species
by
observing ion spectral peak shifts corresponding to a change in field
strength.
Figs. 13A and 13B are graphs of ion intensity (abundance) versus field
compensation voltage illustrating an ability to improve discrimination between
detected
ion species by observing ion spectral peals shifts due to reducing field
strength.
Figs. 14A and 14B are graphs of ion intensity at multiple field strengths
versus
field compensation voltage, showing the affect of changes in compensation
voltage on
specific spectra, and show the divergent behavior of monomer, cluster, and
reactant ion
peals (RIP) detections with changes in field strength and field compensation
voltage.
-18-
CA 02551991 2006-07-05
WO 2005/067582 PCT/US2005/001867
Fig. 15A is a three-dimensional color dispersion plot illustrating detection
of
methyl salicylate over a range of field voltages and field compensation
voltages with
varying ion intensity represented in varying color according to an
illustrative
embodiment of the invention.
Fig. 15B is a two-dimensional graph of ion intensity versus field compensation
voltage for methyl salicylate at a single field voltage.
Fig. 16A is a three-dimensional color dispersion plot illustrating detection
of
DMMP over a range of field voltages and field compensation voltages with
varying ion
intensity represented in varying color according to an illustrative embodiment
of the
invention.
Fig. 16B is a two-dimensional graph of ion intensity versus field compensation
voltage fox DMMP at a single field voltage.
Fig. 17 is a three-dimensional color dispersion plot illustrating detection of
DIMP
over a range of field voltages and field compensation voltage with varying ion
intensity
represented in varying color according to an illustrative embodiment of the
invention.
Fig. 1 S is a two-dimensional graph of ion intensity versus field compensation
voltage for DIMP at a single field voltage.
Fig. 19 is a graph of ion intensity at a plurality of field voltages versus
field
compensation voltage illustrating the effects of changes in field conditions
on location of
individual detection peaks and the ability to separate the detection.
Fig. 20A is a graph of ion intensity versus field compensation voltage
illustrating
the separation of detection peaks at different compensation voltages between
light and
heavy molecules according to an illustrative embodiment of the invention.
Fig. 20B is a graph of ion intensity versus field compensation voltage showing
the increase in number of peaks detected after sample fragmentation according
to an
illustrative embodiment of the invention.
Fig. 21 is a conceptual diagram of a DMS system using fragmentation operating
in parallel with a DMS system not using fragmentation to improve sample
analysis
according to an illustrative embodiment of the invention.
Fig. 22 is a conceptual diagram of a DMS system not using fragmentation
operating in series with a DMS system using fragmentation to improve sample
analysis
according to an illustrative embodiment of the invention.
-19-
CA 02551991 2006-07-05
WO 2005/067582 PCT/US2005/001867
Fig. 23A is a graph of ion intensity versus field compensation voltage showing
peak detection for the DMS system of Fig. 22 not using fragmentation.
Fig. 23B is a graph of ion intensity versus field compensation voltage showing
peak detection for the DMS system of Fig. 22 using fragmentation.
S Fig. 24 is a conceptual block diagram of a DMS system including a
fragmentation region according to an illustrative embodiment of the invention.
Fig. 25 is a three-dimensional color dispersion plot illustrating detection of
agent
GA according to an illustrative embodiment of the invention.
Figs. 26A-26H are two-dimensional graphs of ion intensity versus field
compensation voltage at particular field voltages, the two-dimensional graphs
being of
the type combinable into the three-dimensional color dispersion plot of Fig.
25,
according to an illustrative embodiment of the invention.
Figs. 27A and 27B are graphs of ion intensity at a plurality of pressures
versus
field compensation voltage according to an illustrative embodiment of the
invention.
Figs. 28A and 28B are graphs of ion intensity versus pressure showing a
quantifiable effect on positive and negative background spectra, respectively,
caused by
a decrease in pressure according to an illustrative embodiment of the
invention.
Figs. 29A and 29B are graphs of ion intensity at a plurality of pressures
versus
field compensation voltage showing the effect of varying pressure on negative
and
positive tert-butylmercaptan or tert-butylithiol (TBM) spectra, respectively,
according to
an illustrative embodiment of the invention.
Figs. 30A and 30B axe graphs of ion intensity versus pressure showing the
effect
of vaxying pressure on negative and positive TBM ion peak parameters,
respectively,
according to an illustrative embodiment of the invention.
Fig. 31 is a graph that shows the effect of reduced pressure on analyte peaks
for
chemical warfare agents such as DMMP, DIIVVIP, and MS.
Figs. 32A-32D are graphs of ion intensity versus field compensation voltage
showing improved detection resolution for agent GF at reduced pressures
according to an
illustrative embodiment of the invention.
Fig. 33 is a three-dimensional color dispersion plot illustrating detection of
positive ions of 0.005 mg/m3 D1MP at aboutØ65 atm and over a range of field
voltages
and field compensation voltages with varying intensity depicted by varying
colors.
-20-
CA 02551991 2006-07-05
WO 2005/067582 PCT/US2005/001867
Fig. 34 is a three-dimensional color dispersion plot illustrating detection of
positive ions of 0.005 mg/m3 DM' at about 0.5 atm and over a range of field
voltages
and field compensation voltages with varying intensity depicted by varying
colors.
Fig. 35 is a graph that shows positive (left) and negative (right) three-
dimensional
color dispersion plots for 0.X5 mg/m3 agent GB with a relative humidity (RH) =
S7 in a
DMS system operating at 0.5 atm and for a fragmented sample.
Figs. 36A and 36B are graphs that show a plot of compensation versus field
strength of detected monomer and cluster ion peaks for a family of ketones
according to
an illustrative embodiment.
Figs. 37 and 3~ are tables, each including a collection of detection data for
a
group of monomer and dimers (clusters) of eight ketones respectively, that
were used to
generate the curves in the graphs of Fig. 36A and 36B.
Figs. 39A and 39B are graphs of a ratio of field strength to gas density (E/I~
versus field compensation voltage that illustrate the results of calculating
normalized
alpha parameter curves.
Fig. 40A is a flow diagram of an exemplary sequence of steps of a computer
process used to acquire data concerning a particular chemical ion species.
Fig. 40B shows a diagram of a data structure for a library of stored compound
data measurement information.
Fig. 40C is a flow diagram of a series of steps that may be applied to perform
a
chemical recognition.
Fig. 40D is a flow diagram of a series of steps that may be added to the data
acquisition and chemical recognition processes using alpha curve fitting.
Fig. 40E shows a diagram of a more complex data structure.
Fig. 40F is a flow diagram of a sequence of processes that may be used to
distinguish monomer and cluster peak responses.
Fig. 40G is a flow diagram of a process showing the combination of monomer
and cluster scoring.
Fig. 41 is a conceptual diagram of a compact DMS analyzer system 1400 used to
detect and identify chemical warfare agents (CWAs), Toxic Industrial Compounds
(TICS) and Toxic Industrial Materials (TIMs) which may be released in warfare
or
terrorist situations according to an illustrative embodiment of the invention.
-21 -
CA 02551991 2006-07-05
WO 2005/067582 PCT/US2005/001867
Fig. 42 is a graph of multiple plots showing experimental results for a series
of
warfare agent simulants selectively mixed with 1% headspace of AFFF.
Fig. 43 is a three-dimensional color dispersion plot of the detection of
positive
ions of agent GA over a range of field voltages and field compensation
voltages with
varying intensity represented in varying color according to an illustrative
embodiment of
the invention.
Fig. 44 is a conceptual block diagram of a chemical and/or biological agent
detection system using an ion mobility analyzer system, membrane, and
recirculation
system according to an illustrative embodiment of the invention.
Fig. 45 is a conceptual block diagram of a chemical and/or biological agent
detection system configured for reduced pressure analysis according to an
illustrative
embodiment of the invention.
Fig. 46 is a conceptual block diagram of a chemical and/or biological agent
detection system using a cylindrical DMS analyzer system, recirculation
system, and
multiple flow channels according to an illustrative embodiment of the
invention.
Figs. 47-53 are conceptual block diagrams respectively of chemical and/or
biological agent detection systems using various configurations of a DMS
analyzer
system, recirculation system, and other components according to an
illustrative
embodiment of the invention.
Fig. 54A is a conceptual diagram showing a pre-separation process of a sample
matrix according to an illustrative embodiment of the invention.
Fig. 54B is a conceptual diagram showing a pre-separation process of a sample
matrix according to another illustrative embodiment of the invention.
Fig. 55 is a conceptual block diagram of a sample pre-separation system using
a
first and second ionization region and first and second deflector regions to
separate a
sample matrix according to an illustrative embodiment of the invention.
Fig. 56A is a conceptual diagram of a sample pre-separation process where a
sample matrix may be re-circulated multiple times to interact with an
ionization source
such as reactant ions to sequentially remove differing compound product ions
according
to an illustrative embodiment of the invention.
Fig. 56B is a conceptual diagram of a sample pre-separation process where a
sample may be re-circulated multiple times to interact with an ionization
source, such as
-22-
CA 02551991 2006-07-05
WO 2005/067582 PCT/US2005/001867
an electric or magnetic field, to sequentially remove differing compound ions
according
to an illustrative embodiment of the invention.
Fig. S7 is a conceptual block diagram of a sample pre-separation system
capable
of re-circulating a sample through an ionization region multiple times to
sequentially
S remove differing compound ions having differing proton or electron
affinities according
to an illustrative embodiment of the invention.
Fig. S~A is a conceptual diagram of a sample pre-separation system where
selected ions are intermixed with a sample to enable the pre-separation of
ions having a
particular proton or electronic affinity according to an illustrative
embodiment of the
invention.
Fig. SIB is a conceptual diagram of a sample pre-separation system where
selected ions, having been filtered and pre-selected, are then intermixed with
a sample to
enable the pre-separation of ions having a particular proton or electronic
affinity
according to an illustrative embodiment of the invention.
1S Fig. S9A is a conceptual diagram of a sample pre-separation system
including
two flow channels and multiple (and optionally different) ionization sources
for selective
ion separation from a sample matrix according to an illustrative embodiment of
the
invention.
Fig. S9B is a conceptual diagram of a sample pre-separation system having two
flow channels and multiple (and optionally different) ionization sources for
selective ion
separation from a sample matrix where at least one of the ionization sources
is a plasma
ionization source.
Fig. 60 is a graph of ionization energies required fox various NOx ion species
to
form either positive or negative ions by direct photo ionization in air.
2S Fig. 61A is a graph of relative intensity versus mass units showing the
mass-
spectra to positive NOx ion NO.
Fig. 61B is a graph of relative ion intensity versus mass units showing the
mass-
spectra for positive NOx ion N02.
Fig. 61 C is a graph of ion intensity versus field compensation voltage
showing
the ion intensity peaks for NO and N02.
23 -
CA 02551991 2006-07-05
WO 2005/067582 PCT/US2005/001867
Fig. 62 is a conceptual diagram of a cylindrical sample pre-separation system
including an integrated cylindrical DMS or other analyzer according to an
illustrative
embodiment of the invention.
Fig. 63 is a conceptual block diagram of a sample pre-separation system
capable
of mixing dopants with a sample matrix in a controlled manner before or after
the
reactant ions are added according to an illustrative embodiment of the
invention.
Fig. 64 is a conceptual diagram of an array of logic circuits including an
"or"
flow circuit and an "and" flow circuit used to cause multiple and different
ions to interact
and form a desired reactant ion species according to an illustrative
embodiment of the
invention.
Fig. 65 is a conceptual diagram of a sample pre-separation and analysis system
using multiple ionization zones and multiple analyzers to analyze various ions
of a
sample matrix according to an illustrative embodiment of the invention.
Fig. 66 is a conceptual diagram of a sample pre-separation and analysis system
using multiple ionization zones and DMS analyzers, including a DMS with a
drift tube
and ion filter region arbitrarily curved, according to an illustrative
embodiment of the
invention.
Fig. 67 is a conceptual diagram of a sample pre-separation and analysis system
employing multiple ionization zones and analyzers along with a filtered gas
source to
control pressure within the analyzers according to an illustrative embodiment
of the
invention.
Fig. 6~ is a flow diagram of a sample analysis process including sample re-
circulation and pre-separation according to an illustrative embodiment of the
invention.
Fig. 69 is a flow diagram of a process showing the analysis of a sample matrix
composed of multiple molecule species according to an illustrative embodiment
of the
invention.
Fig. 70 is a conceptual diagram of a sample pre-separation (neutrals removal)
system where the neutral molecules are removed from the ionized molecules
rather than
removing the ions from the neutral gas stream.
Fig. 71 is a conceptual diagram of a sample pre-separation system employing an
ionization region, DMS filter, deflector, pump, and valve to selectively
filter an ion
species for analysis according to an illustrative embodiment of the invention.
-24-
CA 02551991 2006-07-05
WO 2005/067582 PCT/US2005/001867
Fig. 72 is a conceptual diagram of a sample pre-separation system employing an
ionization region, ion guiding region, DMS ion filter, positive and negative
ion
deflectors, optional analyzers, flow generator, selective concentrator and
valve for ion
species analysis according to an illustrative embodiment of the invention.
Fig. 73A is a conceptual diagram of a sample amplification system employing a
DMS filter, detector and neutralizer, and recirculation loop for selected ion
species
analysis according to an illustrative embodiment of the invention.
Fig. 73B is a conceptual diagram of a sample amplification system employing a
DMS filter, detector, ionization source, deflector, and an optional DMS with a
re-
circulation channel for selected ion species analysis according to an
illustrative
embodiment of the invention.
Fig. 74 is a conceptual diagram of a sample amplification and analysis system
employing a re-circulation channel according to an illustrative embodiment of
the
invention.
Fig. 75 is a flow diagram of a process for amplifying a selected ion species
using
an analyzer, such as a DMS analyzer, according to an illustrative embodiment
of the
invention.
Fig. 76 is a graph of ion intensity versus drift time in a conventional IMS
for ions
of benzene, acetone, and toluene respectively.
Fig. 77 is a graph of ion intensity versus field compensation voltage in a DMS
for
acetone, acetone 0-xylene, acetone m-xylene, acetone-toluene, and acetone-
benzene
respectively.
Fig. 78 is a graph of ion intensity versus field compensation voltage in a.
DMS for
ions of DEMP and DEEP respectively.
Fig. 79 is a graph of ion intensity versus drift time in a conventional IMS
for
DEMP and DEEP respectively.
Fig. 80 is a graph of field compensation voltage versus mass in a DMS and
drift
time versus mass in an IMS illustrating the effect of ion mass on the type of
detection
method performed.
Fig. 81A is a graph of the alpha parameter versus electric field strength for
two
ion species with similar alpha parameters.
- 25 -
CA 02551991 2006-07-05
WO 2005/067582 PCT/US2005/001867
Fig. 81B is a graph of the coefficient of mobility versus electric field
strength for
two ion species having similar alpha parameters but different low field
mobility
parameters.
Fig. 82A is a graph of the alpha parameter versus electric field strength for
two
ion species with different alpha parameters.
Fig. 82B is a graph of the coefficient of mobility versus electric field
strength for
two ion species with similar low field mobility parameters but different alpha
parameters.
Fig. 83 is a conceptual diagram of a DMS - IMS detection system according to
an
illustrative embodiment of the invention.
Fig. 84 is a conceptual diagram of a DMS - IMS detection system using a
shutterless IMS according to an illustrative embodiment of the invention.
Fig. 85 is a conceptual diagram of a DMS - IMS detection system where the IMS
is comiected to the DMS in manner that reduces the introduction of neutral
molecules
into the IMS according to another illustrative embodiment of the invention.
Fig. 86 is a conceptual diagram of a DMS - IMS detection system using a
shutterless IMS that is connected to the DMS in a manner that reduces the
introduction
of neutral molecules into the IMS according to an illustrative embodiment of
the
invention.
Fig. 87 is a conceptual diagram of a DMS - IMS detection system using two IMS
detectors according to an illustrative embodiment of the invention.
Fig. 88 is a conceptual diagram of a DMS - IMS detection system using two
shutterless IMS detectors according the an illustrative embodiment of the
invention.
Fig. 89 is a conceptual diagram of a DMS - IMS detection system that supports
a
DMS mode and an IMS mode according to an illustrative embodiment of the
invention.
Fig. 90 is a conceptual diagram of a DMS - IMS detection system where IMS
and DMS detection occur concurrently and/or near simultaneously according to
an
illustrative embodiment of the invention.
Description of Illustrative Embodiments
As described above in summary, the invention is generally directed to systems,
methods and devices for providing improved detection, measurement,
discrimination and
analysis (collectively "analysis") of compounds. The compounds analyzed may
include
-26-
CA 02551991 2006-07-05
WO 2005/067582 PCT/US2005/001867
any compound, both organic and inorganic, and without limitation elements,
chemicals,
and biologicals. In particular illustrative embodiments, the invention is
directed to
improved ion mobility-based compound analysis. Particular features of the
invention
include using multiple combined analytical techniques to improve compound
analysis.
By way of example, in various illustrative embodiments, the invention combines
Field
Asymmetric Ion Mobility Spectrometers (FAIMS), also lcnown as Differential
Mobility
Spectrometers (DMS) or Radio Frequency Ion Mobility Spectrometers (REIMS)
among
other names (collectively DMS) with ion mobility spectrometry (IMS), time of
flight
(TOE) IMS, gas chromatography (GC), Fourier transform infrared (FTIR)
spectroscopy,
mass spectrometry (MS), and liquid chromatography mass spectrometry (LCMS)
techniques. According to other illustrative embodiments, the invention employs
dispersion plots, sample fragmentation and/or pressure controls to improve
discrimination between compounds having similar or overlapping ion mobility
characteristics.
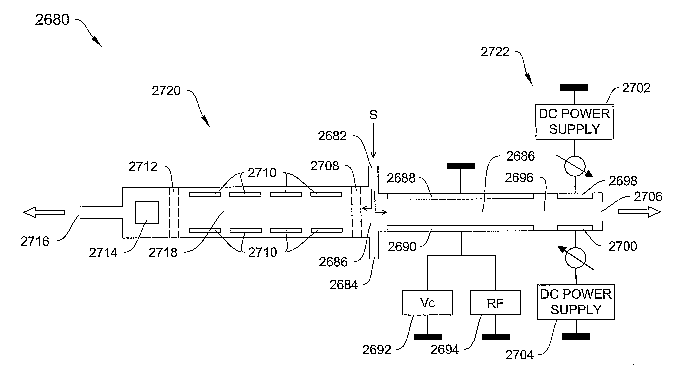
Fig. 5 is a block diagram of a DMS system 10 of the type that may employ the
invention. The system 10 includes a flow section 15 and a processor section
40. The
flow section 15 includes a flow channel 11 extending from a flow inlet 12 to a
flow
outlet 13. Opposing filter electrodes 20 and 21 are located within the flow
channel 11.
Detector electrodes 26 and 30 are also located within the flow channel 11. The
processor section 40 includes an RF voltage generator 42 for providing an RF
field
voltage to the filter electrodes 20 and 21, and direct current (dc) voltage
generator 44 for
providing a do compensation voltage Vcomp to the filter electrodes 20 and 21.
The
processor section 40 also includes a processor 46 for controlling the voltage
generators
42 and 44, and for processing inputs from the ion detectors 28 and 30 by way
of the
amplifiers 36 and 38 the A/D converter 48. The processor section 40 also
provides a
display 49 for providing analysis information to a user. One feature of the
system 10 is
that it may be contained in a hand held unit weighing less than about one
pound.
In operation, a sample S enters the flow channel 11 at the flow channel inlet
12.
The sample S may, for example, be drawn in from the environment or received
from a
front end device, such as another DMS, an IMS, TOFIMS, GC, FTIR, MS, or LCMS.
The sample S may be mixed with an effluent, such as a gas, liquid or vapor. In
the
instant example, a carrier gas CG is employed to flow the sample S through the
flow
-27-
CA 02551991 2006-07-05
WO 2005/067582 PCT/US2005/001867
channel 11. Upon entering the flow channel 11, the sample S flows into an
ionization
region 14. The sample is ionized by an ionization source 16 as it flows
through the
ionization region 14, creating a set of ionized molecules 17+, 17-, with some
neutral
molecules 17n, of various chemical species in the sample S. This may include,
for
example, monomer ions and cluster ions. Such clusters may be created when a
monomer
combines with water molecules or other background molecules, and the
combination is
ionized.
The carrier gas CG then carries the ionized sample S into the ion filter field
18
located between the opposing filter electrodes 20 and 21 of the ion filter 24.
Filtering
proceeds based on differences in mobility in the filter field 18 of the
various ions
included in the sample S. Ion mobility is influenced, for example, by ion
size, shape,
mass and charge. The field generator 42 applies an asymmetric field voltage
Vrf across
the filter electrodes 20 and 21 to cause the field strength within the filter
field 18 to
alternate between high and low field strengths. The ions 17+, 17- and 17n move
in
1 S response to the f eld, based on their mobility characteristics. Typically,
an ion's mobility
in the high field strength condition differs from its mobility in the low
field strength
condition. This mobility difference produces a net transverse displacement of
the ions as
they travel longitudinally through the filter 24. The transverse displacement
defines an
ion trajectory for each of the sample S ions.
As described above, the voltage generator 44, under the control of the
processor
46, applies a do compensation voltage Vcomp across the electrodes 20 and 21.
The
compensation voltage Vcomp causes particular ion species to be returned toward
the
center of the flow path 14, and thus enables them to exit the filter field 18,
without
colliding with either of the filter electrodes 20 or 21 and without being
neutralized.
Other species, for which the applied Vcomp is not sufficient ultimately
collide with the
filter electrodes 20 and 21 and are neutralized. The neutralized ions are
purged, for
example, by the carrier gas CG, or by heating the flow path 11.
The illustrative system 10 of Fig. 5 also can discriminate between ions based
on
differences in polarity, as is the case with the ions 17- and 17+. According
to one
feature, the system 10 of Fig. 5 can be operated to concurrently, or in some
instances,
substantially simultaneously detect both positive and negative ions in the
sample S. This
feature enables identification of two compounds concurrently, or in some
instances,
-28-
CA 02551991 2006-07-05
WO 2005/067582 PCT/US2005/001867
substantially simultaneously. This feature also enables concurrent or
substantially
simultaneous detection of two modes of a single compound.
In operation, the two species of ions 17+ and 17-, enter the detection region
25,
where further separation occurs followed by their intensity determination. In
an
illustrative embodiment, the electrode 28 of the detector 26 may be positively
biased to
attract the ions 17- and repel the ions 17~. Alternatively, the electrode 30
of the detector
26 may be biased negatively to attract the ions 17+ while repelling the ions
17-. The
signals generated by the ions collecting at the detector electrodes 28 and 30
are amplified
by respective amplifiers 36 and 38 and provided to the processor 46 by way of
the A/D
converter 48. According to one feature, the processor 46 compares the
digitized signals
from the A/D converter 48, with a library of ion intensity curves for known
compounds
stored in the memory 47, to identify compounds in the sample S. The results of
the
comparison operation can then be provided to an appropriate output device,
such as the
display 49, or may be provided to an external destination by way of an
interface 56.
According to a further illustrative embodiment, the system 10 is calibrated
prior
to employing it for analyzing a sample. More particularly, the library of ion
intensity
curves for known species of ions at particular Vcomp and Vrf settings is
created amd
stored in the memory 47. According to one feature, once the system 100 is
calibrated, it
may be used continuously, without need for further calibration. However, it is
also
within the scope of the invention to calibrate the system 10 using the
reactant ion peak
(RIP) or a dopant peak, for example.
According to various illustrative embodiments, field strength within the
filter
field 18 resulting from an applied field voltage Vrf may have values ranging
from about
1,000 V/cm to about 30,000 V/cm, or higher. The frequency of Vrf may have
values
ranging from about 1 to about 20 megahertz (MHz), with the higher frequencies
having
an approximately 30 percent duty cycle.
It should be noted that the system 10 may be tuned by employing any suitable
operating values of, for example, Vrf, Vcomp, field strength, Vrf duty cycle,
Vrf
wavelength and Vrf frequency. Additionally, as described in further detail
below, to
improve analysis, the system 10 may be tuned by varying values of other flow
channel
conditions, such as and without limitation, temperature, pressure, humidity,
flow rate,
doping and carrier gas CG composition. As also described below in more detail,
-29-
CA 02551991 2006-07-05
WO 2005/067582 PCT/US2005/001867
multiple scans of the sample S taken, for example, by recirculating the sample
S and/or
processing the sample in parallel and/or in series with one or more additional
DMS, IMS,
TOFIMS, FTIMS, GC, FTIR, MS, or LCMS, at differing flow channel and/or filter
field
conditions may be employed to improve analysis of the sample S.
According to one illustrative embodiment, the processor 46 causes the voltage
generator 44 to scan or sweep a range of field compensation voltages Vcomp for
a
particular RF field strength as controlled by the applied Vrf to obtain a
first spectrum for
the sample S. Then, Vrf is set to a different level and the Vcomp is once
again scanned
to establish a second spectrum for the sample S. This information can be
compared to a
library of spectral scans in a similar fashion as that described above to
identify a
compound in a sample.
If a particular combination of peaks in a spectral scan is known to indicate
the
presence of a particular compound, data representing the multiple peaks can be
stored
and future detection data can be compared against this stored data. For
example, under
controlled filter field conditions, such as at a raised field strength, a
clustered compound
may become de-clustered. The detection results in a signature of peaks that
can be used
to identify the source compound being detected even as detected in a single
scan.
According to one illustrative application, the invention is used for detecting
sulfur-containing compounds in a hydrocarbon background. In one example,
negative
and positive ions are separately detected. The detected data enables a
quantitative
measurement of concentration of these sulfur-containing compounds, independent
of the
hydrocarbon background.
In another illustrative application, the invention is used for detecting trace
amounts (parts per million (ppm), parts per billion (ppb), or parts per
trillion (ppt)) of
mercaptan in varying and even high hydrocarbon backgrounds. The system 10 of
Fig. 5
is also able to characterize hydrocarbon gas backgrounds. For example, the
invention is
capable of detecting mercaptans, such as ethyl mercaptan in a methane
background, and
is also capable of detecting a gas, such as methane, in a mercaptan
background.
1n this practice of the invention, where mercaptans were detected in
hydrocarbon
background, the asymmetric voltage applied to the ion filter electrodes ranged
from
about 900 to about 1.5 kV (high field condition), and a low voltage of about -
400 to
about -500 V (low field condition). The frequency ranged from about 1 to about
2 MHz,
-30-
CA 02551991 2006-07-05
WO 2005/067582 PCT/US2005/001867
and the high frequency had an approximate 30% duty cycle, although other
operating
ranges may be employed. In one embodiment, the detector electrodes were biased
at +5v
and -Sv. With this arrangement, the mercaptans can be detected by the negative
mode (-
Sv) detector and the hydrocarbon gases can be detected by the positive mode
(+Sv)
detector.
The system 10 employs various conventional components. By way of example,
the amplifiers 36 and 38 may be Analog Devices model 459 amplifiers.
Additionally,
the A/D converter may be included on a National Instruments circuit component
(model
6024E) for digitizing and storing the scans, and may include software for
displaying the
results as spectra, topographic plots, dispersion plots or graphs of ion
intensity versus
time. Alternatively, such software may be stored in the memory 47 and may
control the
processor 46. The ionization source may be, for example, a plasma, laser,
radioactive,
UV lamp, or any other suitable ionization source.
According to one illustrative embodiment, Vrf is applied across the filter
electrodes 20 and 21. However in some configurations, Vrf is applied to one
filter
electrode, e.g., electrode 20, and the other electrode, e.g., electrode 22, is
tied to ground.
Vcomp is then applied to one of the filter electrodes 20 and 21, or
alternatively, across
the filter electrodes 20 and 21, according to the ions species to be passed.
According to
another feature, the detector electrodes 28 and 30 are biased with a floating
bias, such as
with the electrode 28 being biased at -5 Vdc and the electrode 30 being biased
at +5 Vdc,
leads to good performance for detection of mercaptans in hydrocarbon or air
backgrounds.
Fig. 6 is a graph of ion intensity versus field compensation voltage for
"positive
mode" spectra for a sample containing varying amounts of ethyl mercaptan as
measured
in a DMS system of the type depicted at 10 in Fig. 5. For positive mode
detection, the
detector electrode 28 is negatively biased and attracts positive methane ions
17m+ for
detection. Fig. 7 is a graph of ion intensity versus compensation voltage for
"negative
mode" spectra of a sample containing various amounts of ethyl mercaptan. For
negative
mode detection, the detector electrode 30 is positively biased and attracts
the negative
mercaptan ions 17m- for detection. As can by seen from Figs. 6 and 7, the
mercaptan
signatures are captured independent of the air-hydrocarbon carrier gas 'CG
background,
at various dosage levels and the detected sample peaks are fully isolated from
the
-31-
CA 02551991 2006-07-05
WO 2005/067582 PCT/US2005/001867
background. As can be seen in Fig. 6, the reactant ion peak (RIP) is isolated;
and as
shown in Fig. 7, the background (sample #9) is flat.
As mentioned above, the detector electrodes 28 and 30 can be oppositely biased
to enable concurrent, or in some configurations, substantially simultaneous
detection of
both positive and negative ions. Even in a sample such as mercaptan, which
when
ionized may have predominantly negative ions, detecting both positive and
negative ions
provides improved analysis accuracy over a single mode detection approach.
This, in
turn, improves identification accuracy and confidence, and reduces the
likelihood of false
positives and false negatives.
For example, Sulfur hexafluoride (SF6) can be well detected in the negative
mode. However, the response in the positive mode, while alone not definitive,
has a
profile, and thus in combination with the negative mode, is confirmative and
provides a
lower likelihood of a false detection. According to one feature, the invention
can detect
SF6 in single mode (e.g., only negative mode detection) or dual mode (both
negative and
positive mode detection), seriatim, concurrently, or simultaneously.
SF6 gas is used in atmospheric tracer applications to monitor air flow, as a
tracer
for leak detection in pipes to point detect sources of leaks, in power plants
to isolate
switches to reduce, or prevent breakdown of the switches, among other uses.
Isolation
and detection of SF6 is often found to be a difficult proposition.
According to one illustrative application, a system of the invention is
employed
to detect SF6 in air. According to a further illustrative embodiment, the
invention
provides a portable, battery powered unit for the detection of SF6 with a
sensitivity of
about 1x10⁻⁹ atm cc/sec SF6 (0.01 PPM). In this illustrative embodiment, the
invention
may be used, for example, in the power industry to ensure the leak tightness
of High
Voltage Switchgear and in the laboratory for testing fume hoods to the ASHREA
110
specification. Other applications include torpedo head, pipework systems, and
air bag
integrity testing. The high sensitivity, rugged design and ease of use and set
up of the
invention are advantageous for many applications that involve the detection of
SF6.
Fig. 8 is a graph of ion intensity (y-axis) versus Vcomp (x-axis) for negative
mode detection of SF6 according to an illustrative embodiment of the
invention. As can
be seen, application of the invention provides a distinct peak for the SF6,
separate from
the reactant ion peak. Fig. 9 provides a similar plot for SF6 for positive
mode detection.
-32-
CA 02551991 2006-07-05
WO 2005/067582 PCT/US2005/001867
As can be seen, for positive mode detection, there is no significant
difference between
the signal 51 without the SF6 present and the signal 53 with the SF6 present.
Fig. 10
shows a plot of intensity (y-axis) versus Vcomp (x-axis) for SF6 at three
different field
voltages Vrf (shown at 57, 58 and 61 for negative mode detection along with
the RIP 55
detected in absence of SF6. Fig. 11 shows a similar plot to that of Fig. 10,
for positive
mode detection. As would be expected, the positive mode detection curves 69,
71 and
73, substantially track their corresponding RIP curves 63, 65 and 67,
respectively. As
mentioned above with respect Fig. 16, while alone this is not definitive, it
is an expected
detection and therefore may be used as confirmative when combined with a
defnutive
SF6 negative mode detection.
According to another feature, the above described library data for known ion
species intensity signatures for known device characteristics may be accessed
for either
single mode or simultaneous positive and negative mode detections. By
comparison
with historical detection data for the device, these peaks can be more clearly
identified as
the tell-tale spectra of the mercaptan. Both spectra give an indication of the
mercaptan,
qualitatively and quantitatively. Although the advantages of the simultaneous
positive
and negative mode detection is described above with respect to mercaptan, they
may be
employed to the analysis of any sample, and are especially useful with real-
time analysis
of complex samples, such as ones containing mercaptans and hydrocarbon gas,
which
have similar ion mobility characteristics, and axe therefore, difficult to
discriminate
between.
The foregoing demonstrates favorably obtaining multiple detection data from a
single mobility scan for identification of detected ion species in a sample.
This
innovation is useful in many applications. Notwithstanding tl>is valuable
innovation, a
still higher level of confidence and further reduced false positives may be
obtained by (1)
obtaining multiple detection data from multiple ion mobility scans, and (2)
further
processing such data to extract device independent attributes, such as a
mobility
coefficient, a.
According to one illustrative "multiple scan" embodiment, ions are identified
based not on a single set of field conditions, but instead on multiple ion
intensity scans
taken at at least two and possibly additional numbers of field conditions
(e.g., at at least
two field measurement points). Detections are correlated with the Vrf and
Vcomp, at the
-33-
CA 02551991 2006-07-05
WO 2005/067582 PCT/US2005/001867
at least two different field conditions, to characterize a given detected
compound.
Because multiple detection data are associated with a given ion species of
interest, more
accurate detections can be made. Comparison with stored data results in
reliable
identification of detected compounds.
Strategies for identifying detected ions based on data in spectral peaks or in
mobility curves include: curve matching, peak fitting, deconvolution (for
overlapping
peaks), mufti-dimensional mapping, for example, employing three-dimensional
representations, including (x,y,z, etc.) spatial coordinate systems and/or
(x,y, etc.)
coordinate systems, with z- or other values represented by color variations.
These
techniques enable identification of detected ion species based peaks in a
single scan,
including simultaneous positive and negative mode detections, and also in
multiple
scans. The goal is the same: analysis of multiple detection data that can be
used to
definitively identify, detect, measure or otherwise analyze the species of a
detected ion.
As described above, different ion species of chemicals exhibit different
mobility
as a function of the compensated applied Vrf. Thus, by applying a set of
different Vrf
voltages and measuring the Vcomp at the ion abundance peak locations, for
example, as
detected by the detector 26 of Fig. 1, for the various compounds, a family of
measurement points characteristic of a compound can be developed. This family
of
points can then be plotted to determine the ion mobility curve signature for
specific
species as a function of Vrf and Vcomp, for example, as shown in Fig. 4. As
also
described above; such data can be stored and compared with data from scans of
unknown
compounds to identify the unknown compounds. While some comparison approaches
perform curve matching, other approaches determine an ion intensity for a
particular ion
species for two nearby field strength and Vcomp conditions. The slope between
the two
data points is calculated and employed as a signature for the particular ion
species. The
selection of measurement points and the number of measurement points may be
adjusted
for the specificity required for a particular application. The minimum number
of
measurement points is two, which at least identifies an aspect (such as slope)
of the
characteristic curve for a compound, given the known field values.
Although performing slope and/or curve matching for an individual or for
multiple scans, where a single filter field / flow channel condition is
varied, may provide
sufficiently accurate results for some applications, one illustrative
embodiment of the
-34-
CA 02551991 2006-07-05
WO 2005/067582 PCT/US2005/001867
invention recognizes that multiple scans taken while varying multiple filter
field and/or
flow channel conditions can provide improved results. By way of example,
according to
one illustrative embodiment, the invention steps Vrf through a plurality of
values and
scans Vcomp at each of the plurality of Vrf values to generate unique sets of
data, which
better distinguish between compounds and, thus, provide more accurate
identification of
detected compounds. This approach can be employed to create a data store of
more
accurate ion mobility signatures for compounds of interest.
According to one illustrative embodiment, the invention incorporates
information
regarding shifts in an ion abundance peak for a particular ion species at
multiple filter
field / flow channel conditions into the spectral signature for a compound.
More
specifically, at a particular Vrf (Vrfl) an ion abundance peak may be detected
at a
particular Vcomp (Vcompl). However, the ion abundance peak may shift to be
detected
at a second Vcomp (Vcomp2) for a second Vrf (Vrf2). One illustrative
embodiment of
the invention recognizes that, in many instances, the ion peak shift from
Vcompl to
Vcomp2 in response to varying Vrf from Vrfl to VrfZ is indicative of a
particular ion
species. Similar measurements of unknown compounds can be compared against
this
portion of the spectral signature to aid in identification of the unknown
compound.
Fig. 12 depicts an example illustrating the above described ion abundance
spectral shift due to a change in Vrf from 1400 Vpeak to 1450 Vpeak over a
scanned
Vcomp. In Fig. 12, the peaks 110-1, 110-2, 110-3, and 110-4 occur at a
particular field
compensation voltages Vcomp, for Vrf at 1400 Vpeak (corresponding to a field
strength
of 28,000 V/cm), but shift to be located at different compensation voltages in
response to
Vrf being changed to 1450 Vpeak (corresponding to a field strength of 29,000
V/cm).
As can be seen from Fig. 12, even small changes in a field condition, such as
a change in
Vrf, can cause a measurable ion peak shift, and can thus provide significant
additional
information to the ion spectral signature. In the specific example of Fig. 12,
the shift in
ion peak due to the change in Vrf is employed when making a comparison to ion
spectral
signatures for known compounds to identify an unlrnown compound.
Figs. 13A and 13B show an experimental example illustrating how ion spectral
peals shifting can be employed to identify an unknown species. In Figs. 13A
and 13B, in
a field strength of about 24000 V/cm, peaks for three different isomers of
xylene in a
-35-
CA 02551991 2006-07-05
WO 2005/067582 PCT/US2005/001867
sample, p-, o-, and m-, were detected. In Fig. 13A, the peaks for p- and o-
are
indistinguishable, while the peak for m- is well defined. To farther evaluate
the sample,
a second detection (Fig. 13B) was performed at a lower field strength of 18000
V/crn.
As can be seen in Fig. 13B, the peak shift due to the change in field strength
causes the
three different isomers p-, o-, and m- of xylene to be more clearly
distinguishable, and
thus more accurately identified. As can be seen from Figs. 13A and 13B, better
discrimination between species is not always a result of applying a higher
field strength.
More particularly, in this example, the p- and o- xylene isomers become more
distinguishable at a reduced field strength.
I0 According to another illustrative embodiment and.as mentioned above, the
invention generates detection data over a range of applied filter field / flow
channel
conditions. For example, Figs. 14A and 14B show the effect of changes in field
strength
on the location of detection peaks at different Vcomp levels for hexanone and
octanone,
as detected in a DMS system of the type depicted at 10 in Fig. 1. The curves
are offset
on the vertical axis, with the offset increasing as electric field strength
increases. While
various operating ranges are possible, as an illustration, Figs. 14A and 14B
may be
understood as presenting peak Vrf between a low of about 620 Vpeak (lowermost
plot in
each) and a high of around 1450 Vpeak (uppermost plot in each). Several
attributes are
noted in this series of responses. For example, referring specifically to the
hexanone plot
ofFig. 14A, a monomer peak of 601-1 ofparticular interest is somewhat obscured
in the
lowest field strength condition. However, at the highest applied field
strength, the peals
601-m corresponding to hexanone is clearly discernible from the other peaks.
Several phenomena have occurred with the increase in increasing applied field
strength. First, a reactant ion peak (RIP) 605-1 is relatively dominant in the
Iow field
strength detection. However, as electric field strength is increased, the RIP
605-m shifts
to the left at a more rapid rate than the monomer ion peak 601-m of interest.
This is
because the aparameter for the mobility coefficient for the reactant ion
species is
different than the a parameter for the monomer ion of interest.
In addition, the relative amplitude of the R1P 605 decreases markedly with the
increase in the electric field strength. Thus, R1P 605-m is observed at much
lower
amplitude and well separated from the monomer peak 601-m of interest at a
specific field
condition. While the monomer peaks 601 also shift, they do not shift by the
same
-36-
CA 02551991 2006-07-05
WO 2005/067582 PCT/US2005/001867
amount, or by as much. Thus, by analyzing the compound over a range of applied
field
conditions, a condition can be discovered at which the RIP 605 shifts away
from or off
the scale of other observed peak voltages. In some cases, this allows easier
detection of
the monomer ion peak 601 of interest.
Similar behavior is observed in the monomer peaks 610-1, 610-. . ., 610-n
observed for octanone and the resulting reactant ion peaks 615-1 to 615-m.
This
information can thus be used to identify a species by comparing a family of
response
curves to a stored family of known response curves.
Another observed effect shown in both Figs. 14A and 14B is that a group of
cluster ions 608 and 610 are seen. The cluster ions 608 represent clusters of
chemical
materials in the sample. Typical cluster ions, having a heavier chemical
weight, have
peaks that are shifted differently from monomer ion peaks of interest. In this
example,
the cluster peaks shift in a direction away from the direction of shift of the
monomer
peaks with increasing applied field strength. This characteristic feature of
cluster ions,
observed with this sample, can also be stored and utilized in recognizing the
hexanone
and/or octonone ions. The curves shown in Figs. 14A and 14B are but one
example of
how applying a range of field / flow channel conditions to detect a given
sample can be
utilized to an advantage.
As mentioned above briefly, according to one illustrative embodiment, the
invention employs multi-dimensional compound signatures for comparison with
multi-
dimensional representations of unknown compounds to identify and more
generally
analyze the unknown compounds. Such multi-dimensional representations may
arise, for
example, from plotting ion abundancy as a function of a plurality of varying
filter field /
flow channel conditions. Such conditions may include, without limitation, Vrf,
Vcomp,
filter field strength, Vrf duty cycle, Vrf wavelength and Vrf frequency;
temperature,
pressure, humidity, flow rate, doping and Garner gas CG composition. Mufti-
dimensional
representations may also result from taking multiple scans of the sample S
taken, for
example, by recirculating the sample S and/or processing the sample S in
parallel and/or
in series with one or more additional DMS, IMS, TOFIMS, GC, FTIR, MS, or LCMS,
at
the same or differing flow channel / filter field conditions. The mufti-
dimensional
representation, according to one illustrative embodiment, is a three-
dimensional
-37-
CA 02551991 2006-07-05
WO 2005/067582 PCT/US2005/001867
dispersion plot, employing x- and y- spatial coordinates, with a z-coordinate
being
represented by a variation in color.
Fig. 15A shows a three-dimensional color dispersion plot 620 depicting
detection
of methyl salicylate over a range of field voltages Vrf (y-axis) and field
compensation
voltages Vcomp (x-axis), with varying ion intensity (abundance) represented in
varying
colors, according to an illustrative embodiment of the invention. Although,
particular
color coordination may vary, the dispersion plot of Fig. 15A represents the
highest ion
intensity in blue with yellow representing the lowest. The three-dimensional
color
dispersion plot 620 represents an aggregation of data-from a plurality of two-
dimensional
graphs, such as that shown in Fig. 15B. More specifically, Fig. 15B shows a
plot 622 of
ion intensity (y-axis) versus Vcomp (x-axis) at a particular Vrf for methyl
salicylate. A
plurality, illustratively more than two, of such graphs taken at a plurality,
illustratively
more than two, of field voltages Vrf are aggregated to provide the color plot
620 of Fig.
11A. Aggregating a plurality of scans taken at a plurality of filter field
voltages Vrf
(and thus, field strengths) provides a more discriminating scan than a single
scan taken at
a single Vrf. One reason for this is that the aggregated scans incorporate the
above
discussed peak shifting that occurs due to the changes in Vrf. As can be seen,
the three-
dimensional representation of Fig. 15A provides three signature peaks 621,
623, and 625,
as opposed to the two peaks 627 and 629 of Fig. 15B.
The effect of the increased resolution provided by employing dispersion plots,
is
even more evident, when trying to distinguish between compounds having similar
ion
mobility characteristics. By way of example, Figs. 16A and 16B show positive
mode
plots 624 and 626 for DMMP, while Figs. 17 and 18 show positive mode plots 628
and
630 for DIMP. More specifically, Figs. 16B and 18, plot ion intensity (y-axis)
versus
Vcomp (x-axis) at a particular Vrf for DMMP and DM', respectively. As shown,
both
Figs. 16B and 18 included three peaks of similar magnitude, located at a
approximately
the same field compensation voltages, and similarly spaced apart.
Distinguishing
between DMMP and DIMP, based solely on the individual plots 626 and 630 of
Figs.
16B and 18 is at best unreliable, and at worst impossible. However, referring
to Figs.
16A and 17, the three-dimensional plots 624 and 636 are easily visually
distinguishable.
More particularly, the DMMP color plot 624 of Fig. 16A shows three clear peaks
638, 639 and 640, while the DM' color plot 628 shows four clear pealcs 631,
632, 634
-38-
CA 02551991 2006-07-05
WO 2005/067582 PCT/US2005/001867
and 636. While the peaks 638, 639 and 640 nearly overlay the peaks 631, 634
and 636,
the fourth blue peak 632 for DIIVVIP, which is lacking for DM1VVIP, easily
distinguishes the
DMMP scan from the DIIVVIP scan. Also, the branches 634 and 636 of the color
plot 628
are closer together than the branches 638 and 640 of the color plot 624.
Additionally, the
color distribution (e.g., saturation) throughout the branches of the three-
dimensional
color plot 624 is not the same as the color distribution throughout the
branches of the
plot 628. As in the case of previously discussed signature scans, three-
dimensional
signature scans of the type depicted in Figs. 15A-18 may be stored in a
library for known
compounds. At least portions of one or more of the stored scans may be
compared with
at least portions of similar scans of unknown species to identify and
generally analyze
the unknown species. Any suitable pattern matching approach, including
conventional
pattern matching approaches, may be employed for such comparison.
It should lie noted that although the above discussed dispersion plots of
Figs.
15A, 16A and 17 employ color changes to indicate intensity, changes in any
color-
related feature, such as changes in color saturation, gray scale or black and
white may be
employed instead or in combination. Additionally, in a further illustrative
embodiment,
the invention generates a curve circumscribing the intensity peaks, and the
color-related
information may be discarded. By way of example, in this illustrative
embodiment, the
outlines, for example, for the intensity peaks 632, 634 and 636 would remain,
without
the color-related information. Removing the color-related information provides
a two-
dimensional dispersion representation of, for example, Vrf versus Vcomp that
also takes
into account the spectral information gained from aggregating a plurality of
Vcomp
scans at a plurality of Vrf values. Any or all of this two-dimensional
information may be
incorporated into the above discussed signature information.
As described above, various illustrative comparison approaches may employ
pattern matching using, for example, the above described two- and/or three-
dimensional
dispersion plots. However, in other illustrative embodiments, the information
provided
by the dispersion plots is stored in the library as mathematical
relationships, and suitable
conventional approaches for comparing such mathematical relationships are
employed to
identify the unknown species.
According to another illustrative embodiment, Vcomp may be plotted on the x-
axis, Vrf on the y-axis, and ion intensity on the z-axis. Thus, instead of
showing ion
-39-
CA 02551991 2006-07-05
WO 2005/067582 PCT/US2005/001867
intensity as color, saturation, gray scale or black and white variations, as
in the three-
dimensional color plots 620, 624, and 628, ion intensity may be
depicted/conceptualized
in a topographical manner. Multi-dimensional signature representations of this
sort may
also be stored in the library of lcnown species and used in the same fashion
as the above
described ion mobility signatures. In other embodiments of the invention, more
than
three dimensions may be employed, for example, plotting spectral data as
clusters in n-
dimensional space and employing known cluster matching algorithms.
A processor, such as the processor 46 of Fig. 5, may be programmed in a
conventional fashion to automatically step an analyzer, such as the system 10,
through a
range of field voltages Vrf and a scanned Vcomp, and provide the data to a
display or
other system for processing and generation of a three-dimensional dispersion
plot.
Another analysis improving effect can be observed with the application of
relatively high field strengths. Specifically, complex ion groupings can be
fragmented,
for example, by applying a high field strength to the sample. Sample
fragmentation is a
useful technique for enhancing species separation, detection, and
identification.
Fragmentation includes a process in which large molecules of samples are
brolcen up into
smaller molecules, components, or fragments prior to sample detection. This
enables the
components of the group to be individually detected arid more generally
analyzed.
Fig. 19 is an example of such an effect on a mercaptan sample. In particular,
a
range of background voltages (from 620 -1450 Vpeak) were applied to an ethyl
mercaptan spectra in which a general shift of ion peak behavior can be seen as
electric
field conditions are strengthened. However, a fragmentation condition can also
be
observed. Specifically, at lower applied field conditions, strong single peak
is observed,
such as at 701-1. However, as electric field strength is increased, multiple
peaks 701-n,
702, ... 710 are observed in a spectra. By observing and recording the peak
locations,
not only at the low voltage field conditions, but also at a range of field
conditions, this
fragmentation behavior can be further exploited to better identify compounds.
According to one feature, data indicating the peak RF voltage at which
fragmentation
occurs is incorporated into the stored spectral signatures for the known
samples.
According to another feature, the locations of the fragment peaks are also or
instead
incorporated into the stored spectral signatures for further use for matching
detection
data with known data.
-40-
CA 02551991 2006-07-05
WO 2005/067582 PCT/US2005/001867
Fig. 20A is a graph 712 of ion intensity (y-axis) versus field compensation
voltage Vcomp (x-axis) illustrating the separation of detection peaks at
different
compensation voltages between light and heavy molecules according to an
illustrative
embodiment of the invention. The graph 712 shows that light molecules
associated with
the RIP background peak 714 may be identified at an arbitrary -30 Vdc
compensation
voltage, while heavier molecules tend to be clustered and form a peak 716 at
about 0 Vdc
compensation. By fragmenting a sample of heavy molecules and detecting the
fragments
using, for example, a DMS or IMS system, a plurality of ion intensity peaks,
each
associated with a fragment, may be used to create a unique signature of the
sample to
enable subsequent identification of that sample. Fragmentation of a sample may
be
achieved, for example and without limitation, by using any one or a
combination of a
chemical reaction, a high energy field at high strength, high field voltage,
heating, laser
light, colliding the sample molecules with other molecules, soft x-ray, or the
like.
Fig. 20B is a graph 718 of ion intensity (y-axis) versus field compensation
voltage (x-axis) showing the increase in number of peaks detected after sample
fragmentation according to an illustrative embodiment of the invention. The
graph 718
shows that fragments are lighter, and therefore, have lower mass and lugher
associated
compensation voltages, resulting in improved resolution of arid
differentiation between
the fragments. Also, the graph 718 shows an increased number of peaks 720
associated
with the fragmented sample, which increases the collective data that may be
used to
fingerprint the compound. The additional detection data enable a more accurate
identification of the detected species, such as by comparing the signature
detected with a
set of signatures in a look up table and by other techniques disclosed herein.
Fig. 21 is a conceptual block diagram of a dual channel detection system 748
including a first DMS system 722 using fragmentation and forming a first
channel
operating in parallel with a second DMS system 724 not using fragmentation and
forming a second channel to improve sample analysis according to an
illustrative
embodiment of the invention. As shown, the DMS system 724 includes a sample
inlet
726, ionization region 728, ion source 730, analyzer region 732, and outlet
734.
Similarly, the DMS system 722 includes a sample inlet 736, ionization region
738, ion
source 740, analyzer region 742, and outlet 744. The DMS system 722, however,
also
includes a fragmentation energy source 746 within the ionization region 73 8.
The
-41 -
CA 02551991 2006-07-05
WO 2005/067582 PCT/US2005/001867
analyzer regions 732 and 742, respectively, include a DMS filter and detector
to enable
detection and identification of samples. In operation, the dual channel
detection system
748 operates DMS systems 722 and 724 concurrently, simultaneously or
alternatively.
With respect to the DMS system 724, a sample S is introduced into ionization
region 728
via the sample inlet 726. The ionization source 730 may then ionize the sample
S into
positive and/or negative ions that are then delivered to the analyzer region
732. The
analyzer region 732 performs filtering and detection of the sample which then
exits the
DMS system 724 via the outlet 734. The DMS system 722 operates in a similar
manner
as the DMS system 724, but with an additional fragmentation source 746. Thus,
when
the sample S enters ionization region 738 of DMS system 724, the fragmentation
source
746 breaks up / fragments the sample S molecules into lighter, less massive
molecules.
These lighter molecules are then delivered to analyzer region 742 for
filtering and
detection.
Thus, the dual channel detection system 748 using DMS systems 722 and 724
may improve sample analysis by substantially simultaneously analyzing a sample
S and
its fragments to create a more complete signature of the sample.
Alternatively, the dual
channel detection system 748 may selectively compare the fragmentation
spectra,
depending on the sample species to be detected and the need for better
discrimination
from other interferants or compounds.
Fig. 22 is a conceptual diagram of a DMS system 750, not using fragmentation,
and operating in series with a DMS system 752 using fragmentation to improve
sample
analysis according to an illustrative embodiment of the invention. The
combination of
the DMS systems 750 and 752 form a serial detection system 754. As shown, the
serial
detection system 754 includes a sample inlet 756, the DMS system 750, the DMS
system
752, and an outlet 758. The DMS system 750 includes an ionization region 760,
ion
source 762, ion filter 764, and detector 766. The DMS system 752 includes an
ionization
region 768, ion source 770, fragmentation source 772, ion filter 774, and
detector 776.
In operation, a sample S is introduced into the serial detection system 754
via the
sample inlet 756. The DMS system 750 ionizes the sample S using the ionization
source
762 within the ionization region 760. Then, the ionized sample S is delivered
to the ion
filter 764. The ion filter 764 applies a combination of field and field
compensation
-42-
CA 02551991 2006-07-05
WO 2005/067582 PCT/US2005/001867
voltage to the sample S to allow selected ion species to reach and be detected
by the
detector 766.
Fig. 23A is a graph 778 of ion intensity (y-axis) versus Vcomp (x-axis)
showing
peak detection for the DMS system 750. As shown previously, when no
fragmentation
occurs, the relatively heavy sample molecules cluster to form a peak 780 at
Vcomp =
approximately 0 Vdc.
After analysis by the DMS system 750, the sample S is delivered to the DMS
system 752, where the sample S is ionized by an ionization source 770, and
also
fragmented by the fragmentation source 772. The fragmentation source 772 may
be a
radioactive source, a high energy voltage source or the Iike with enough
energy to break
up the relatively large sample molecule into a plurality of fragment
molecules,
fragments, components, or atoms. Then, the fragments are delivered to the ion
filter 774
whereupon a combination of filter f eld voltages Vrf and field compensation
voltages
Vcomp applied a plurality of filter field conditions to the fragments to
filter them before
1 S detection by the detector 776.
Fig. 23B is a graph 782 of ion intensity versus compensation voltage showing
peak detection for the DMS system 752 of Fig. 22 using fragmentation. As shown
previously, when fragmentation occurs, the relatively lighter fragments form a
plurality
of ion intensity peaks 784 at various distinct field compensation voltages
Vcomp.
Thus, the serial detection system 754 using the DMS systems 750 and 752 may
improve sample analysis by serially detecting a sample S and its fragments to
create a
more complete signature or fingerprint of the sample. Alternatively, the
serial detection
system 754 may selectively compare the fragmentation spectra depending on the
sample
species to be detected and the need for better discrimination from other
interferants or
compounds.
Fig. 24 is a conceptual block diagram of a DMS system 786 including a
fragmentation region 792 according to an illustrative embodiment of the
invention. As
shown, the DMS system 786 includes a sample introduction region 788,
ionization
region 790, fragmentation region 792, fragmentation source 806, fragmentation
effluent
inlet 794, transport effluent inlet 796, ion filter 798, detector 800, and
controller 812. An
ionization source 802 may optionally be located within the fragmentation
region 792.
An ionization source 804 may optionally be located within ion filter 798.
-43-
CA 02551991 2006-07-05
WO 2005/067582 PCT/US2005/001867
In operation, a sample S is introduced into sample introduction region 788.
The
sample introduction region 788 may perform pre-separation of the sample S to
reduce the
amount of interferants or unwanted compounds. The ionization source 808 then
ionizes
the sample S in the ionization region 790. Once the sample S is delivered to
the
fragmentation region 792, the fragmentation source 806 fragments the
relatively heavy
molecules of the sample S into a plurality of lighter fragments.
Alternatively, a
fragmentation gas including fragmentation molecules may be introduced into
fragmentation region 792 via fragmentation gas inlet 794. The fragmentation
gas
molecules, upon colliding with the sample S molecules, cause a portion of the
sample S
molecules to break up into sample S fragments.
After fragmentation, a transport effluent, such as a carrier gas CG may be
introduced via the transport effluent inlet 796 to deliver the sample S
fragments to the
ion filter 798. After filtering, the fragments are then detected by the
detector 800. The
ionization source 802 may optionally be located in the fragmentation region
792.
Furthermore, as in the case of all of the previously described illustrative
embodiments,
the fragmentation source 806 may function additionally as a ionization source.
The
ionization source 804 may optionally be located in the ion filter 798.
Furthermore, the
ion filter 798 may also act as either a fragmentation source 8I0 or an
ionization source
804.
It should be noted that although the previously described embodiments refer to
separate ionization and fragmentation sources, in other illustrative
embodiments, a single
source may attend to both fragmentation and ionization. Additionally, any of
the
previously described fragmentation approaches may be employed in addition to
or in
replacement of the fragmentation sources of Figs. 21, 22 and 24. The
controller 821 may
switch fragmentation on and off as needed by activating or deactivating the
fragmentation source 806 or by introducing or not introducing a fragmentation
effluent
via fragmentation effluent inlet 794.
The foregoing fragmentation techniques and system implementing these
fragmentation techniques may be used to enhance the detection of a sample S,
such as
without limitation, Sarin gas, also known as:
GB
Zarin
-44-
CA 02551991 2006-07-05
WO 2005/067582 PCT/US2005/001867
~ Phosphonofluoridic acid, methyl-, isopropyl ester
~ Phosphonofluoridic acid, methyl-, 1- methylethyl ester
~ Tsopropyl methylphosphonofluoridate
~ Tsopropyl ester of methylphosphonofluoridic acid
~ Methylisoproposfluorophosphine oxide
~ Tsopropyl Methylfluorophosphonate
~ 0-Isopropyl Methylisopropoxfluorophosphine oxide
~ 0-Isopropyl Methylphosphonofluoridate
~ Methylfluorophosphonic acid, isopropyl ester
~ Isoproposymethylphosphonyl fluoride
Sarin, a colorless and odorless gas, has a lethal dose of 0.5 milligram for an
adult.
It is 26 times more deadly than cyanide gas and is 20 times more lethal than
potassium
cyanide. Just 0.01 milligram per kilogram of body weight in a pinprick sized
droplet will
kill a human.
Fig. 25 is a three-dimensional color dispersion plot 814 of the type described
above with respect to Figs.lSA-18 and illustrating detection of agent GA over
a range of
field voltages Vrf and field compensation voltages Vcomp with varying ion
intensity
presented in varying color according to an illustrative embodiment of the
invention. The
color dispersion plot 814 includes branches 816, 818, 820, and 822 that
represent the
detection of fragments of agent GA using, for example, DMS system 786 having a
Ni63
ionization source for fragmentation of the GA sample at 0.14 ng/1. The branch
840
represents an original peak before fragmentation.
Figs 26A-26H depict two-dimensional graphs 824, 826, 828, 830, 832, 834, 836,
and 838 of ion intensity (y-axis) versus Vcomp (x-axis), each at a particular
Vrf. As
described above with respect to Figs. 15A-18, the two-dimensional graphs 824,
826, 828,
830, 832, 834, 836, and 838 are aggregated into the three-dimensional color
dispersion
plot 814 of Fig. 25. As discussed previously, the color dispersion plot 814
improves the
analysis process of a particular species such as agent GA or GB, for example,
because it
takes into account peak shifts due to changes in Vrf, and because the color
nature of the
three-dimensional dispersion plot 814 makes more evident the signature
behavior of
particular ion species in relation to other ion~species, especially after
fragmentation.
- 45 -
CA 02551991 2006-07-05
WO 2005/067582 PCT/US2005/001867
As described above with respect to Figs. 15A, 16A, and 17, the dispersion plot
of
Fig. 25, may employ color saturation, gray scale variations, black and white
variations
and/or peak outlines in place of the color variations depicted.
The fragmentation techniques described herein are not limited to DMS systems
and may be employed with other mobility-based detection systems such as ion
mobility
spectrometry (IMS), time of flight (TOF) IMS, Fourier Transform (FT) 1MS, gas
chromatography (GC), Fourier transform infrared (FTIR) spectroscopy, mass
spectrometry (MS), liquid chromatography mass spectrometry (LCMS), surface
acoustic
wave (SAW) sensors, and the like.
Another techW que for improving ion species detection, identification and
analysis generally is operating the mobility-based detection system, such as
any of the
systems described herein, below atmospheric pressure. By operation below
atmospheric
pressure, the separation between ion intensity detection peaks is increased
and the width
of the peaks is narrowed. This provides improved resolution, resulting in
improved
system discrimination and sensitivity. By operating, for example a DMS system
at
various pressure conditions, the change in ion species behavior with respect
to pressure
may be measured and used as another characteristic for identifying ion
species.
According to various illustrative embodiments, the invention performs ion
scans at
pressures between about .2 and about .9 atmospheres, less than about .3
atmospheres,
less than about .4 atmospheres, less than about .5 atmospheres, Iess than
about .6
atmospheres, less than about .7 atmospheres, or less than about .8
atmospheres.
Fig. 27A is a graph 840 of background (RIP) ion intensity versus field
compensation voltage at a plurality of pressures fox a DMS system in positive
ion
detection mode according to an illustrative embodiment of the invention. The
graph 840
shows that the field voltage may be adjusted to maintain the ion intensity
peak within the
same compensation voltage position as the pressure within a DMS system is
adjusted.
More specifically, according to the graph 840, as the pressure decreases, the
field voltage
decreases to maintain the ion intensity peak for a species at the same
compensation
voltage. Furthermore, changes in pressure at lower pressures result in the
need for
greater changes in field voltage to maintain a constant compensation voltage.
For
example, when reducing the pressure by approximately 100 g from 760 mmHg to
655 mmHg, the reduction in field voltage is approximately 40 Vpeak from about
1050
-46-
CA 02551991 2006-07-05
WO 2005/067582 PCT/US2005/001867
Vpeak to about 1010 Vpeak. For approximately the same pressure reduction from
655
mmHg to 556 mmHg, the reduction in Vrf is approximately 90 volts from about
1100
Vpeak to about 920 Vpealc. Thus, the field voltage decrease is approximately
twice as
great for changes in pressure in the 600 mmHg range, which indicates that the
resolution
is improved at reduced pressure.
Figs. 27B is a graph 842 of background (RIP) ion intensity versus field
compensation voltage at a plurality of pressures for a DMS system in negative
ion
detection mode according to an illustrative embodiment of the invention. Like
positive
mode graph 840, the graph 842 shows that, in negative detection mode, the
field voltage
may be adjusted to maintain the ion intensity peals within the same
compensation voltage
position as the pressure within a DMS system is adjusted.
As shown by comparing the graph 840 with the graph 842, there is au offset in
the ion intensity peak between the positive mode ion intensity peaks of graph
840 and
negative mode ion intensity peaks of graph 842 at the same pressure and field
voltage.
This offset may indicate a difference in the alpha parameter between positive
and
negative mode detection for an ion species. The alpha parameter is discussed
in further
detail below. The DMS flow rate is approximately 300 cc/min in graphs 840 and
842.
Figs. 28A and 28B depict graphs 844 and 846, respectively, of ion intensity (y-
axis) versus pressure (x-axis) showing a quantifiable effect on positive and
negative
background spectra, respectively, caused by a decrease in pressure according
to an
illustrative embodiment of the invention. More specifically, the graph 844
shows that
field voltage is decreased by about 50% when pressure is decreased to about
0.3
atmosphere (atm). The graph 846 also shows a similar field voltage decrease of
about
50% when pressure is decreased to about 0.3 atm.
Figs. 29A and 29B depict graphs 848 and 850, respectively, showing ion
intensity
(y-axis) versus field compensation voltage (x-axis) for a plurality of
pressures and
showing the effect of varying pressure on negative and positive tert-
butyhnercaptan and
tert-butylithiol (TBM) spectra, respectively. While the graphs 848 and 850
show that
field voltage decreases as pressures decrease for a particular field
compensation voltage,
the graphs 848 and 850 also show that the ion intensity peak positions for TBM
spectra
shift in the opposite direction as the ion intensity peals shifts for the
background (RIP)
spectra of graphs 840 and 842. Furthermore, the level of change of the ion
intensity
-47-
CA 02551991 2006-07-05
WO 2005/067582 PCT/US2005/001867
peaks in graphs 848 and 850 for TBM spectra is less than the level of change
of the ion
intensity peaks in graphs 840 and 842 for background spectra.
Figs. 30A and 30B depict graphs 852 acid 854 showing ion intensity (y-axis)
versus pressure (x-axis) and showing the effect of varying pressure on
negative and
positive TBM ion peak parameters, respectively. More specifically, the graph
852
shows that the ion intensity peak remains relatively constant as the pressure
is varied for
negative ion spectra. The graph 854 shows that the ion intensity peak remains
relatively
constant with the level decreasing slightly at a lower pressure for positive
spectra.
Because changes in pressure impact the background (RIP) and analyte spectra
differently, pressure may be manipulated, regulated, or otherwise controlled
in such a
manner as to improve the ability of a DMS system to detect and identify ion
species with
better resolution while minimizing the negative effects of background spectra
interference.
In certain embodiments, it may be desirable to maintain uniform detection
results
by maintaining a constant ratio of electric field strength to~ gas density N
or pressure P
where the ratio is expressed as E/N or E/P. Thus, when the gas operating
pressure within
a DMS system is decreased, the field voltage is correspondingly lowered to
maintain a
constant E/N or E/P. This reduction in field voltage results in a reduction in
power
consumption which, in turn, results in smaller, lighter weight, and lower cost
detection
systems.
Fig. 31 is a graph 856 showing the effect of reduced pressure on analyte peaks
for
chemical warfare agents, such as DMMP, DIMP, and MS. The top graph 857 shows
the
ion intensity results at atmospheric pressure, while the bottom two graphs 859
and 861
show the results at 0.65 and 0.5 atm, respectively. At 1 atm with field
voltage at Vrf =
about 1000 Vpeak, the top spectra shows the overlap 858 of monomer and dimmer
cluster peaks for D1MP over a range of about 10 Vdc field compensation
voltage. But at
0.65 atm and Vrf = about 800 Vpeak, the monomer peak 860 and cluster peak 862
are
separated with the monomer peak 860 at Vcomp = about -3 Vdc and cluster peak
862 at
Vcomp = about +1 volt. At 0.5 atm and Vrf = about 650 Vpealc, the DI1VVIP
monomer
peals 864 and DllVg' cluster peak 866 are each narrower with the peaks 864 and
866 at
Vcomp = about -2.5 Vdc and about +1 Vdc, respectively. The narrower peaks 864
and
866 at 0.5 atm result in higher resolution for a DMS system.
-48-
CA 02551991 2006-07-05
WO 2005/067582 PCT/US2005/001867
Figs. 32A-32D depict graphs 868, 870, 872, and 874, respectively, showing ion
intensity (y-axis) versus Vcomp (x-axis). The graphs 868, 870, 872 and 874
show
improved detection resolution for agent GF at reduced pressures, according to
an
illustrative embodiment of the invention. The graphs 868 and 870 show the ion
intensity
spectra of agent GF at Vrf of 1500 and 1000 Vpeak, respectively, at 1 atm. The
graphs
872 and 874 show the ion intensity spectra of agent GF at Vrf of 1000 and 750
Vpeak,
respectively, at 0.5 atm. According to the graph 870, the monomer and dimer
peaks
overlap at peak 876 at Vrf = about 1000 Vpeak. According to the graph 868,
however,
the monomer peak 878 and dimer peak 880 are separated at Vrf = about 1500
Vpeak.
Thus, DMS system resolution may be increased by increasing the field voltage
(Vrf).
In the graph 872, the DMS system pressure is reduced to about 0.5 atm with Vrf
at about 1000 Vpeak. The graph 872 shows the monomer peak 882 clearly isolated
from
auy diner peak, because the cluster or diner RIP peaks are off scale of the
graph 872.
In the graph 874, the field voltage Vrf is reduced to about 750 Vpeak, with a
system
.pressure at about 0.5 atm. The graph 874 shows clear separation of the GF
monomer
peak 884 from the diner peaks 886 and RIP peak 888. Thus, GF may be detected
and
identified by the signature peaks illustrated in graph 874 in a DMS system
utilizing
reduced pressure, reduced field voltage, and, therefore, reduced power.
As described above, three-dimensional color dispersion plots may be used to
significantly enhance the ability of a DMS system to detect and identify ion
species of
interest by allowing a user or pattern recognition program to match the color
patterns
against a library of similar color pattern for known compounds.
Fig. 33 is a three-dimensional color dispersion plot 890 depicting intensity
of
positive ions of 0.005 mg/m3 DIMP at about 0.65 atm and over a range of field
strengths,
gas densities (Ells and field compensation voltages Vcomp. As shown, gas
density is
plotted on the x-axis, Vcomp is plotted on the y-axis, and variations in
intensity depicted
by variations in color. The plot 890 includes several prominent branches 892,
894, and
896.
Fig. 34 plots the same information as Fig. 33, except as obtained at a
decreased
pressure of about 0.50 atm. As shown in plot 898, the reduction in pressure in
relation to
plot 890 results in sigiuficantly more prominent branches 900, 902, and 904,
thus
providing enhanced resolution.
-49-
CA 02551991 2006-07-05
WO 2005/067582 PCT/US2005/001867
Fig. 3S is a graph depicting positive (906) and negative (908) mode three-
dimensional color dispersion plots for about 0.85 mg/m3 of agent GB RIP, at a
relative
humidity (RH) = about 87 %, in a DMS system operating at about O.S atm for a
fragmented sample. The negative mode plot 908 shows only a single strong RIP
branch
S 909, while the positive mode plot 906 shows two strong trace analyte peaks
901 and 903
to the right of the heavy background RIP branch 905. Thus, plotting three-
dimensional
graphs for both the positive and negative ion species of a sample provides
further
enhanced ion species identification over three-dimensional plots of positive
or negative
mode measurements alone.
The three-dimensional color dispersion plots 906 and 908, as illustrated
above,
may also show discontinuities in the branches, i.e., peak plots or traces,
that are also
useful for species identification. For example, the plot 906 includes a break
in the trace
or branch 901 that may be included as part of the stored signature for future
comparisons.
1 S As described above with respect to Figs. 1 SA, 16A, 17 and 25, the
dispersion
plots of Figs. 33 and 35, may employ color saturation, gray scale variations,
blaclc and
white variations and/or peak outlines in place of the color variations
depicted.
According to another feature, the identification above described analysis
approaches may be made device-independent. Figs. 36A and 36B show experimental
detection data for a homologous group of ketones, including: acetone,
butanone,
pentanone, hexanone, heptanone, octanone, nonanone, decanone. Figs. 37 and 38
are
tables showing monomers and clusters, respectively, for the above listed
keytone species.
As shown in Figs. 36A and 36B, each species has a unique mobility curve, and
thus a
unique mobility signature, for the given set of field conditions. As described
above, the
2S mobility signatures may be obtained and enhanced in any of a plurality of
ways.
However, the identification process can be further enhanced by making it
device-
independent. With device independence, signature data can be created that can
be used
on any device. According to one illustrative embodiment, the invention
accomplishes
this by determining the parameters of a function derived from the fundamental
mobility
coefficient associated with each species.
Therefore, for example, the multiple data represented in Figs. 36A, 36B, 37
and
48 each can be used to provide positive identification of a detected species
by the unique
-SO-
CA 02551991 2006-07-05
WO 2005/067582 PCT/US2005/001867
and inherent mobility characteristic that identifies that species. According
to one feature,
the comparison can be made to a lookup library specific to the device in
question, but
also can be made to a universal set of data that is device-independent. Thus,
in general,
one does not wish to only compare the plot of abundance curves versus
compensation
voltage individually, but rather generate a plot of observed peak locations
for specific
compensation voltages, so that curves, slopes, signs, and various details can
be discerned
for each of the detected ions for comparison to a library of lookup data.
More specifically, in computing mobility signatures, we have found that an
expression of the field-dependence of ion mobility, the so-called a
coefficient, expressed
as a function of field, can be used to generate a unique a function that is
inherent for that
species and is device independent. Thus the a function can be used as the
unique
signature of a species; this function expresses both a characteristic
signature for the ion
species and is device independent. In short, according to one feature, the
invention
recognizes that peaks change position in signature ways because they have
different
alpha signatures.
In one illustrative embodiment, the invention employs the a function as a
mobility signature for detected species. The signature can be determined for a
detected
unknown compound, based on the field conditions that are used, and then this
can be
used to make an identification according to a lookup table of stored known
signature data
associated with known compounds. More particularly, in practice of a preferred
embodiment of the invention, ion species are identified based on the mobility
dependence of the species under various field conditions. Data is collected
for the
sample under test for at least two field conditions, the data is processed,
and a
comparison of detection data computed as an a function for the sample under
test versus
the stored data enables identification of the compounds in the sample.
Refernng again to the discussion of the a parameter, Fig. 3 is a plot of
mobility
versus electric field strength for three examples of ions, with field
dependent mobility
(expressed as the coefficient of high field mobility, a) shown for species at
a greater,
equal to and less than zero. For any given set of field conditions, the field
strength and
compensation can be correlated with an a value. This is shown in the worlc of
Buryalcov
et. al., A New Method Of Sepay atiora Of Multi Atomic Ions By Mobility At
Atyraosplaeric
-51-
CA 02551991 2006-07-05
WO 2005/067582 PCT/US2005/001867
Pr~essune Using A High-Fy~equency Amplitude Asyynmets~ic StYOng Electric
Field, Intl J.
MassSpec and Ion Pr-oc. (1993), at p. 145.
We have observed that knowing the a parameter alone at a particular field
strength does not prevent false positives. This would occur at the
intersection of the two
plots in Fig. 4, at the point indicated by reference numeral 100. Without more
information, knowledge of the a parameter for the respective ion species at
that location
does not provide unique mobility signatures for both compounds. Thus, without
doing
more, any number of readings at this intersection is likely to result in a
detection error.
However, we have also found that we cm express an ion's differential field
mobility characteristic such as the a mobility characteristic, as a function
of field, i.e., as
a(E), and can define a unique mobility signature for the ion species which is
device- '
independent. This a(E) or "alpha function" relates the size, effective cross-
section,
shape, and mass of the ion to field conditions. It is understood that as the
applied electric
field increases, the increasing electric field tends to displace, stretch,
andlor break the
bonds of the ion such that the stronger the field, the greater the induced
dipole,
quadripole, or higher order moments of the ion. These, in turn, affect the
relative
mobility of the specific ion. The result of relating these aspects is to
define a unique
mobility signature for the ion species of interest. This also turns out to be
device-
independent. A differential field includes both high and low field strengths
which may
exist, for example, in a varying RF field. A differential field mobility
characteristic
relates to the mobility properties of ions that are exposed to varying RF
fields.
The relationship of the a(E) function to field conditions is~shown in the
following:
Y~ (~') _ < aEs.f (t) ~
1+<a>+< ~Esf(t)> (1)
where: Vcornp (peak position); Es-electric field strength; f(t)-waveform
parameters
(wave shape and so forth).
Thus, for each spectral detection, we can compute a as a function of field
conditions, i.e., cY(E). Specifically, the asymmetric waveform in a planar
field
-52-
CA 02551991 2006-07-05
WO 2005/067582 PCT/US2005/001867
asymmetric waveform mobility spectrometer, EmaX(t) = EmaXf(t), is designed to
satisfy the
following conditions:
T (3 a)
l l T f ES (t)dt =< ES f (t) >= 0
0
< f2"+~ (t) » 0
(3b)
where f (t) -is a normalized function which describes the waveform, and EmaX
is the
maximum amplitude of the waveform. The waveform is designed such that its
average
value is zero (equation 3a) while the polarity of the electric field during
one period is
both positive and negative. The addition of the compensation field, C, to the
waveform
ES(t) yields Equation 4:
E(t) = ES (t) + C = ES f (t) + C (4)
so the average ion velocity over a period of the asymmetric waveform can be
written as:
V =< Y(t) >_< K(E)E(t) > (5)
Only ions with average velocity of zero, v = 0, will pass through the gap
without
neutralization. An expression for the compensation field required to enable an
ion to
pass through the gap can be obtained by substituting Equations 2, 3, and 4
into Equation
5 as shown in Equation 6:
< aEs f (t) > (6)
C=
1+<a.>+<~~Esf(t>>
The value of this compensation electric field can be predicted precisely when
the alpha
parameter for the ion species, the waveform f (t) , and the amplitude of the
asymmetric
waveform En,ax are known.
A procedure for extraction of a(E) from experimental measurements of the
electric field dependence of the mobility scans is thus known. In this
section, some
additional considerations regarding the alpha parameter and methods to
determine this
-53-
CA 02551991 2006-07-05
WO 2005/067582 PCT/US2005/001867
parameter are described. First, emphasis must be given that the alpha
parameter is a
function (not a number) and the physical and chemical information about an ion
is
contained in the shape of the a(E) curve. The method of representing this
curve is
incidental to the topic. The only criterion critical in these methods is that
the calculated
values for the differential field mobility (i.e. K(E) = K° f 1+a(E)])
should be as close as
possible to the experimental values. The function for a(E) can be represented
as an even
power series or in complex form. In either instance, the curves of
experimental results
and calculations should agree closely. Thus, the quality of the approximation
is limited
by the accuracy of the experimental results and has been illustrated.
Discerning the
quality of a model based upon two parameters, three parameters, or a nonlinear
function
with five parameters was difficult. All approximations were located within the
error of
OCR (at ~9%).
In this work, a simple uniform method is described to represent the function
of
a(E), which will be suitable for comparison of results obtained under
different
experimental conditions. These methods could be used for differing asymmetric
waveforms or different designs of IMS drift tubes: linear, cylindrical, or
planar DMS. Tn
general then, the criteria for choosing the level of approximation of alpha is
first to
ensure that the method of extracting the alpha parameter uses the least number
of
individual parameters of the experimental device. Second, the result should
contain the
fewest number of adjustable parameters, and the approximation curves should be
within
the experimental error bars. In the next section, the general method to
extract the alpha
parameter is described and then applied in the subsequent section.
The function of a(E) can be given as a polynomial expansion into a series of
electric field strength E degrees as shown in Equation 7:
°° (7)
a (E) _ ~ a zn . E zn
n=I
' Substituting Equation 7 into Equation 6 provides a value of the compensation
voltage as
shown in Equation ~ where an uneven polynomial function is divided by an even
polynomial function. Therefore an odd degree polynomial is placed after the
identity
sign to approximate experimental results:
-54-
CA 02551991 2006-07-05
WO 2005/067582 PCT/US2005/001867
(8)
a Zrt S 2n+I ~ f 2rt+I (t))
n=I 2 n+I ~~ 2 n+1
C = ~ - ~ C2n+1S
.1 + ~ (2 fl + 1 )G2,' 2,t s 2 n ~ ~ Zrt (t )~ n=1
n=I
This allows a comparison of the expected coefficient (approximated) to be
compared to
the values of alpha parameter as shown in Equation 9:
r,-~ (9)
_ ~'2n+1 _ ~'2(n-k)
C2n+1 - a2n ~f > 2(y2 k) + 1~2k+la2(n-k) ~f
k=1
Alternatively, alpha parameters can be calculated by inverting the formula by
using an
approximation of the experimental results per Equation 10:
_ _ ~'z(r,-k) 10
a2n 2 :+1 ~CZn+1 + j~ (2(Yl k) + lkZk+la2(n-k) ~f
(. f ~ k=
Any number of polynomial terms (say 2n), in principle, can be determined from
Equation 10 though a practical limit exists as the number of polynomial terms
in the
experimental result of the approximation c2"+i should be higher than the
expected number
of alpha coefficients a2". Since the size of n depends on the experimental
error, the
power of the approximation of the experimental curves C(ES) ca~mot be
increased
without limit. Usually N experimental points of C;(ES;) exist for the same ion
species and
experimental data can be approximated by the polynomial using a conventional
least-
square method. Finally, the number series terms cannot exceed the number of
experimental points so increasing the number of series terms above the point
where the
fitted curves are located within the experimental error bars is unreasonable.
In practice,
two or three terms are sufficient to provide a good approximation shown in
prior
findings. The error in measurements must be determined in order to gauge the
order of a
polynomial for alpha. The sources of error in these experiments (with known or
estimated error) were:
1. Error associated with measurement and modeling of the RF-field amplitude
(~5%);
2. Error in C(ES) from a first-order approximation of Equation 4 (~3%), and
3. Error in measuring the compensation voltage (~5-8%).
An approximate error may be ~10% and there is no gain with approximations
beyond
two polynomial terms; thus, alpha can be expressed as
-55-
CA 02551991 2006-07-05
WO 2005/067582 PCT/US2005/001867
a(E l N) =1 + aI (E l N) 2 + a2 (E l N) 4 with a, level of accuracy as good as
permitted by
the measurements.
A standard least-square method (regression analysis) was used to approximate
or
model the experimental findings. For N experimental points with C;(ES;) and
for C =
c3S3 + c5S5 a function y = c3 + csx can be defined where y = C/S3; x = S2 so
c5 and c3 are
given by Equations 11 and 12, respectively:
N N N (11)
xr ~ Yt - N~ xaYr
C = f=I f=I f=I
5 N 2 N
~xi _N~xl
t=I f=I
1 N N , (12)
f=I t=I
Through substituting experimental value c3, c5, values for a2 and a4 can be
found per
Equations 13 and 14:
a2 = c3 ~ f3 ~ (13)
c5 +3c3a2~f2> (14)
In order to calculate a2", knowledge is needed for the approximations of
experimental
curves for C(ES) and for the function f (t) -which is a normalized function
describing the
asymmetric waveform.
For example, nine data points were identified for each of the eight lcetones
of
Figs. 36A, 36B, 37, and 38, based on the data collected in the tables of Figs.
37 and 38.
These can be used to compute the a curve for that species, such as with a
piecewise
linear approximation to the a curve. For example, two data points for butanone
are
a(Vcomp-a, Vrf a) and b(Vcomp-b, Vrf b). Between these two points, the slope
and sign
of the butanone curve can be computed. More complete characterization of the
curve,
such as with polynomial curve fitting, is also possible.
-56-
CA 02551991 2006-07-05
WO 2005/067582 PCT/US2005/001867
Now this data set becomes part of a data store for use in identification of
the
species of an unl~lown detected ion species for which two data points are
collected and
the corresponding curve data is computed. In short, in an illustrative
practice of the
invention, we collect data on at least two closely associated points (peaks)
for a given ion
sample and generate the curve data accordingly. Once we have the detected and
computed data, we assume this approximates the alpha curve and therefore do a
lookup
to our stored data. Upon finding a match, we can then positively identify the
sample.
In Figs. 39A and 39B (monomers and clusters, respectively) we computed unique
a curves for keytone ions (acetone, butanone, pentanone, hexanone, heptanone,
octanone, nonanone, decanone) based on data collected in the tables of Figs.
37 and 38,
plotting the percent change in a against the change of field strength for the
various data
collected. These plots of percent change in cx against field strength express
a unique
signature for each of these ion species. This is loaded in our data store for
later
comparison: the signature data includes the RF field strength and the
compensation
1S voltage at which the peak is detected. We also associate with it the
identifying data for
the known a function associated with that detected peak location and field
conditions for
each species.
Figs. 39A and 39B thus express the a function for individual ketones spanning
electric fields of 0 to 80 Td (~23 kV/cm), expressed as a percentage change in
alpha as a
function of field conditions. These plots are fundamental signature features
of these ion
species that are independent of the drift tube parameters and can be used in
other
mobility spectrometers. Thus, the a function can be favorably used in practice
of the
invention to provide a mobility identification data set that is device-
independent.
These results are surprising and demonstrate that for chemicals with the same
functional group, protonated monomers of a single type exhibit a broad range
of
behavior vis-a-vis the dependence of coefficients of mobility on electric
fields. This
difference in behavior fox a common moiety suggests that the effect from the
electric
field must be associated with other aspects of molecular structure. One
possible
interpretation is that ions are heated during the high field and the effect on
the protonated
monomer should be striking. These ions with structures of (H30)~ M (H20)n or
perhaps
(H30)+ M (H20)"(NZ)2, should be prone to dissociations with slight increases
in ion
-57-
CA 02551991 2006-07-05
WO 2005/067582 PCT/US2005/001867
temperature caused by the high field conditions. Thus, ion cross-sections and
mobilities
would accompany declustered small ions at high fields.
Refernng again to Fig. 39A, it should be noted that there is approximately a
20%
increase in a(E) for the protonated monomer of acetone with high fields. As
the
molecular weight of the keytone is increased, ion heating is less pronounced
and
reflected in the a(E) function. The a(E) function for proton bound dimers
(clusters) is
consistent with decreases in mobility under high field conditions.
Consequently, the
basis for the a(E) function differs from that of protonated monomers. Indeed,
the proton
bound dimer for decanone undergoes about a 5% decrease at high fields. The
cause for a
decrease in mobility at high fields has no existing model but should be due to
increased
collisional size or increased strength of interaction between the ion and the
supporting
gas.
Furthermore, if we were to do the same for the cyclohexane and DMMP in Fig. 4,
the computed alpha curves would differ accordingly. In this manner, the
invention can
distinguish ion species even when their mobility curves overlap, as long as we
have at
least a second detection data set to associate with each detected species in
question.
Therefore, the invention achieves a high level of assurance for the accuracy
of
identifications.
Thus we have shown that the fundamental dependence of mobility for ions in
high electric field can be obtained from field asymmetric ion mobility
spectrometry.
Functions of dependence can be extracted from experiments using known methods
to
treat imperfect waveforms. These findings show an internal consistency with a
homologous series of ketones, and also indicates a mass dependence not
previously
reported.
Focusing attention now on Figs. 40A-40F a specific sequence of steps is
described that may be carried out to perform species identification in several
of the
embodiments of the invention. These steps are provided by way of illustration
and not
limitation. In this illustration, the sequence of steps may be performed by
the
microprocessor 46 of the ion mobility spectrometer device 10 of Fig. S. The
microprocessor 46 provides digital control signals to the RF dispersion
voltage (Vrf)
generator 42 and compensation voltage (Vcomp) generator 44 to control the
drive
-58-
CA 02551991 2006-07-05
WO 2005/067582 PCT/US2005/001867
voltages for the filter 24. The voltage generators 42 and 44 may also include,
for
example, digital-to-analog converters, not shown in detail in Fig. 5.
The microprocessor 46 coordinates the application of specific RF dispersion
voltages Vrf and compensation voltages Vcomp, also taking into account the
function of
observing responses from the detector 26 as read through the analog to digital
converter
48. By detecting attributes (such as the peaks) of observed abundances of a
particular
ion species across a range of Vrf voltages, the microprocessor 46 can thus
take steps to
identify particular compounds. These may include, for example, comparing or
correlating particular "response curve" data against a library of response
curve data as
stored in the memory 47. They can also include computation of a curve
parameters. The
results of the comparison operation can be provided in the form of an
appropriate output
device such as a display or personal computer or the like, or maybe provided
by
electrical signals through an interface to other data processing equipment.
As shown more particularly in Fig. 40A, a state 1000 is entered into the
microprocessor 46 in which a compound is to be analyzed. Here, the compound is
known and identified, such as by a user supplying an identifying text string
to the
computer. A sequence of steps is then performed by which data is to be
acquired
concerning the known chemical compound. From this state 1000, a next state
1002 is
entered in which a range of dispersion voltages Vrf and compensation voltages
Vcomp
are determined by the processor 46. These ranges include a beginning voltage
(b) and an
end voltage (s) and step voltages) to be applied to each of the ranges Vrf is
thus varied
from an initial value Vrf(b) to a final value Vrf(e) by a step amount Vrf(s).
Similarly,
Vcomp is to be varied from Vcomp(b) to a final value Vcomp(e) by a step amount
Vcomp(s).
The voltage ranges are then applied in the following steps. Specifically, step
1004 is entered in which the Vrf is allowed to step through a range of values.
A state
1008 is entered next in which the compensation voltage Vcomp is also swept or
stepped
through a series of values or ranges. In state 1010, the response to each
applied voltage
is stored as a value, (a).
If the last compensation voltage has not yet been tested, then processing
returns
to state 1008 in which the next compensation voltage is applied. However, in
state 1012,
-59-
CA 02551991 2006-07-05
WO 2005/067582 PCT/US2005/001867
if all of the compensation voltages have been applied, then processing
proceeds to a state
1014 wherein a test is made to see if all of the dispersion has been applied.
The loop continues until all of the compensation and dispersion voltages have
been applied. The resulting set of data is then analyzed in a state 101 ~ to
identify
features of interest. hi the specific example being described, it is the peak
locations that
are of interest. For each such peak in an observed response for a given
applied
dispersion voltage Vrf, a response value for a specific Vcomp is determined
and its
corresponding amplitude (a) is detected and stored.
The response curve data, or certain attributes thereof such as the peak
locations
are then stored as a data object P (or table) as shown in Fig. 408. Such an
object
illustratively contains an identification of the tested compound such as a
text string. Also
stored are a set of the applied dispersion voltages Vrf. For each such
dispersion voltage
Vrf, a corresponding peak compensation voltage is stored. Specifically, at
least the
compensation voltage Vcomp at which a peak was observed, and preferably, the
corresponding amplitude of the response (abundance) observed at that peak is
stored.
As previously described in detail, for a given Vrf, there may be a set of
compensation voltages at which a number of "peaks" are observed. Fox example,
as was
described in connection with Fig. 14A, the sample analyzed can be made up of a
compound of specific ions, including monomers, cluster ions, and reactant ion
peaks.
Thus, illustratively, there is an accommodation in the structure of object P
to anticipate
that there will be more than one peak observed in any particular mobility
scan, and that
the number of peaks per response curve may not always be the same number.
An example, the illustrative object P of Fig. 40B, includes a data element,
where
for a single RF dispersion voltage Vrf 1, peaks may be observed at
compensation
voltages Vcll, ..., Vcmn having corresponding amplitudes al l, ..., amn. This
may
correspond,to the case of the lowest applied dispersion voltage in Fig. 14A,
where
numerous peaks 601-, 605-1, 60~-1 are detected. However, at another dispersion
voltage
Vrf m, only a single peak at Vcomp-m, am was detected. This might correspond
to a
case such as in the uppermost curve of Fig. 6A, where only a single peak 601-m
was
detected.
In an illustrative application, a library of data objects P (reference
vectors) is
developed by performing the steps of Fig. 40A for a plurality of known
compounds of
-60-
CA 02551991 2006-07-05
WO 2005/067582 PCT/US2005/001867
interest. This then permits an instrument to eventually enter a chemical
recognition state
1200 as shown in Fig. 40C. Next, a series of measurements are taken in states
1202-
1214. This series is similar to the measurements taken in Fig. 40A.
Specifically, a series
of measurements are taken for a specified compensation and RF voltages. It
should be
understood that an entire set of all of the same measurements need not be
taken in this
mode as were taken in the chemical data acquisition mode. Specifically, not
all points on
a relatively dense response curve need to be taken, only enough to identify
each
compound.
Once the measurements are taken, a state 1220 is entered in which features,
such
as peaks of the response are identified for each peak, a corresponding
compensation
voltage and amplitude may be identified, and these stored to a candidate
measurement
vector P'. The candidate vector P' thus represents a series of data that needs
to be tested
against a number of candidate compounds. The candidate vector P' is then
analyzed in
states 1230 and/or 1240 by looking up corresponding counterparts in the
library of
reference vector objects P, and scoring a match between P and P'. These steps
may be
iterated until such time as a match or a best match is determined in a state
1250.
It should be understood that any number of teclmuques may be used to determine
a degree of match between P and P'. For example, if the elements (Vcomp, a) of
P and
P' are considered to be data points in Euclidian geometry space, a distance
can be
computed. The comparison with the smallest Euclidian distance can then be
selected as
the best match. However, other recognition teclmiiques may be used to
determine an
identity of an unknown compound, for example, more sophisticated signal
processing
techniques such as correlation may be used to resolve peaks; or other lcnown
pattern
recognition algoritlmns, neural networks or artificial intelligence techniques
may be used
to find a best match for P'. This best match is then identified to a user,
such as by
looking up the compound identifier field and displaying it in state 1260.
Fig. 40D shows a series of steps, which may be added to the data acquisition
phase and the chemical recognition phase to talce advantage of second order
data
processing characteristics. For example, in the data acquisition state, a
series of states
1020, 1022, 1024 and 1026 may be added to curve-fit specific attributes of the
measured
response. Specifically, a state 1020 may be entered in which for each data
element of the
-61-
CA 02551991 2006-07-05
WO 2005/067582 PCT/US2005/001867
object P a vector, z, is formed consisting of the peals compensation voltages
vcl l,
vcl2,...vclm.
This vector is a vector of point locations for the peaks observed for a range
of
compensation voltages. Returning attention to Fig, 14A, briefly, this may
correspond,
for example, to locating the points 601-1,...601-m,...601-n corresponding to
peak height
and locations for the monomer ions of interest. A curve may then be fit
through these
peaks such as by applying a curve fitting algorithm, in state 1024. In the
illustrated
example it is assumed that a quadratic equation is fitting the peaks of the
form y2 = ~ix2 +
'y The ~3 and 'y coefficients can then be stored in the state 1026 associated
with the
vector. The chemical is thus identified by a curve fit to its peak locations
approximating
its mobility (a coefficient) behavior.
If this is done, a corresponding set of steps 1270, 1272 and 1274 can be added
to
the recognition process to identify peaks by performing a curve fit to observe
data, and
then, determining 'y and ~3 coefficients, rather than comparing raw data
values in states
1270 and 1272. In state 1274, the ~i and 'y coefficients are tested to
determine closest
matches in the P object library.
Fig. 40F shows a series of steps that may be used to identify or distinguish
peaks
in the acquisition phase. Here initial data may be added to the objects P by
identifying
peaks as a cluster peak or monomer peak. Specifically, if a peak shift over a
range of
field condition voltages (e.g., Fig. 14A) increases (i.e., shifts to the
right), then this may
be identified as a cluster peak'. If the peals does not meet specific shifting
criteria, it may
be identified as a monomer peak. States 1310, 1331, and 1332 may thus be added
to the
identification process. The results of these steps adds an additional
parameter L
associated with each data point in the object P to further identify each peak
as a
monomer cluster or other peak type, as shown in Fig. 40E.
Other approaches to this may be used to label peaks. For example, reactant ion
peaks (RIP) may also be identified by performing an analysis on a response of
the
instrument, with no sample S applied. In this mode, only the RIPs occur, and
in their
behavior across a range of compensation voltages can be stored. Information
concerning
the particular type of peals may be stored in pointer data in a state 1320, at
which such a
peak is detected. This information can then be added to the objects P,
specifically as
shown in Fig. 40E.
-62-
CA 02551991 2006-07-05
WO 2005/067582 PCT/US2005/001867
Fig. 40G shows additional processing steps, which may be performed in the
compound recognition state to take advantage of the situation of Figs. 36A-38
in which
monomer and cluster ion behavior is observed. Specifically, the steps of Fig.
40G may
be added as further steps 1280 in the recognition phase. Here, for every
candidate peak
P', a corresponding monomer peak in the reference array P is compared. A score
is then
associated with the closest of the match in state 1284. Similarly, in state
1286, a cluster
peak may be compared with its corresponding peak in the peak library P. A
score sc is
then determined in step 1288, depending on the closest of this match. In a
state 1290, a
final score sf can be associated with weighting the monomer peak score and the
cluster
peak score by weighting factors wm and wc. For example, in an instance where
cluster
peaks are expected to provide more information than monomer peaks, cluster
peaks may
be weighted highly and monomer peaks relatively low or zero factor. Using this
weighting, both monomer and cluster peak identification ca~i be combined to
further
refine compound analysis.
In various applications, the above described approaches to ion-based sample
analysis may be employed in relatively compact, such as handheld, analyzer
systems.
Fig. 41 is a conceptual diagram of such a compact DMS analyzer system 1400.
The
DMS system may be used, for example, to analyze compounds, such as chemical
warfare
agents (CWAs), and Toxic Industrial Compounds (TICS), and Toxic Industrial
Materials
(TIMs) according to an illustrative embodiment of the invention. By operating
the
compact DMS analyzer system 1400 at less than atmospheric pressure, e.g., 0.5
atm, as
described above, the system 1400 approximately doubles its resolution over
existing
state-of the-art systems, while reducing its power consumption and size. By
performing
sample fragmentation, as described above, sample analysis may be further
enhanced. By
utilizing three-dimensional color dispersion plots, as also described above,
analysis of
CWAs, TICS, and TIMs is further enhanced.
The DMS analyzer system 1400 may employ an electromechanical pump,
compressed gas or air, or the solid-state flow generator 1402, which includes
an ion
source 1404, an ion attractor 1406, and a constrained flow channel 1408 for
controlling
sample flow and/or pressure within the system 1400. The ion source 1404
provides a
source of ions and the ion attractor 1406 attracts either positive or negative
ions,
depending on an applied bias voltage. The ion flow created in the constrained
channel
- 63 -
CA 02551991 2006-07-05
WO 2005/067582 PCT/US2005/001867
1408 due to the ion flow generated by the interaction of the ion source 1404
with the ion
attractor 1406 creates a fluid, e.g., a sample effluent, flow. In some
illustrative
embodiments, the DMS analyzer system 1400 may be miniaturized, such that the
analyzer unit 1410 is included in application-specific integrated circuits
(ASICs)
embedded on a substrate 1412. A solid state flow generator of the type
employed by the
invention is described in further detail in co-pending and co-owned U.S.
Patent
Application Ser. No. 10/943,523, filed on 17 September 2004, the entire
contents of
which are incorporated above by reference.
The constrained channel 1408 includes an inlet end 1414 and an outlet end
1416.
The constrained channel 1408 also includes a sample introduction inlet 1418 to
enable
the analyzer 1410 to collect the sample gas for analysis. A pre-concentrator
1420 may be
employed at the sample introduction inlet 1418 to concentrate the sample and
improve
analysis accuracy. An ionizer 1422 provides ionization of the sample using,
for
example, a radioactive N163 foil, or non-radioactive plasma ionizer, or other
suitable
ionization source within ionization region 1424. A plasma ionizer has the
advantage of
enabling precise control of the energy imparted to the sample gas for
ionization. Ideally,
the ionizer 1422 imparts only enough energy to ionize the sample gas, without
producing
nitric oxides (NOx's) and ozone. A fragmentation region may also be included
in the
system 1400. NOx's and ozone are undesirable because they can form ion species
that
interfere with the ionization of CWA agents. Because diffusion and mobility
constants
generally depend on pressure and temperature, the DMS analyzer system 1400 may
include a temperature sensor 1426 and/or a pressure sensor 1428 for regulating
the
temperature and/or pressure of the sample gas within the analyzer unit 1410
for more
accuxate analysis. The analyzer 1410 may also include a humidity sensor. The
analyzer
1410 also includes an analytical region 1440 with filter plates 1442 and
detector plates
1444. A molecular sieve 1446 may be employed to trap spent analytes.
The controller 1446 provides control of filtering and detection while also
providing an output of the detection results. The power supply 1448 provides
power to
the filter plates 1442, solid-state flow generator 1402, and any other
component requiring
electrical power. The controller electronics 1446 for Vcomp, Vrf, the ion
heater
pumping, the DMS ion motion, and the pre-concentrator 1420 heater may be
located
with the analyzer unit 1410. Also, the detector 1444 electronics, pressure
1426 and
-64-
CA 02551991 2006-07-05
WO 2005/067582 PCT/US2005/001867
temperature 1428 sensors, and the processing algorithm for a digital processor
may
reside within analyzer 1410.
At atmospheric pressure, to realize the benefits of mobility nonlinearity, the
DMS
analyzer system 1400 illustratively employs RF electric fields of about 106
V/m, and a
Vrf of about 200 Vpeak at about a 200 x 10-6 ~,m gap. However, any suitable RF
electric
field parameters may be employed. The power supply 1448 may be remotely
located
relative to the analyzer unit 1410 to generate RF voltage for the filter
plates 1442. At
less than atmospheric pressure, the RF electric field may be reduced as
described above
to further reduce the power consumption and size of the DMS analyzer system
1400.
The DMS analyzer system 1400 may also interface with a personal computer
(PC) or controller 1446 to utilized signal-processing algorithms that convert
analyzer
1410 outputs into detection, identification, and/or measurement of analytes
and
concentration levels. The controller 1446 or an interfacing PC may also
facilitate control
and power management for the DMS analyzer system 1400. The supporting
electronics
for the DMS analyzer system 1400 may be implemented, for example, on an ASIC,
a
discrete printed circuit board (PCB), or System on a Chip (SOC).
In operation, the solid-state flow generator or electromechanical transport
pump
1402 draws samples into the DMS analyzer system 1400 at the inlet 1414 and
past a
CWA-selective chemical membrane concentrator 1420 having an integrated heater.
The
CWA-selective chemical membrane pre-concentrator 1420 may also serve as a
hydrophobic barrier between the analytical region 1440 of the analyzer system
1400 and
the sample introduction region 1450. The membrane of the pre-concentrator
1420,
illustratively, allows CWA agents to pass, but reduces the transmission of
other
interferants and acts as a barrier for moisture.
The pre-concentrator 1420 may use selective membrane polymers to suppress or
block common interferences (e.g., burning cardboard) while allowing CWA agents
or
CWA simulants to pass through its membrane. Although many selective membrane
materials are available, poly-dimethyl siloxane (PDMS) may be a preferred
membrane/concentrator/filter to reject water vapor and collect CWA analytes.
At high
concentration levels, water vapor molecules may cluster to the analytes,
altering the
analytes' mobilities. Membrane materials such as hydrophobic PDMS tend to
reduce the
vapor to acceptable levels while absorbing and releasing analyte atoms. The
thin
-65-
CA 02551991 2006-07-05
WO 2005/067582 PCT/US2005/001867
membrane of the pre-concentrator 1420 may also be heated periodically to
deliver
concentrated analytes to the ionization region 1424 and analytical region
1440.
Except for diffusion of analytes through the membrane/filter/pre-concentrator
1420, the analytical region 1440 is generally sealed to the outside
atmosphere. Thus, the
analyzer system 1400 may employ elements for equalizing the pressure inside
analytical
region 1440 with the atmospheric pressure outside the analyzer system 1400 or
maintain
pressure in the analytical region 1440 at less than atmospheric pressure for
improved ion
intensity peak resolution. Once the sample gas molecules are ionized, the ions
are driven
longitudinally in the direction indicated by the arrow 1452 through the ion
filter plates
1442 by static or traveling electrostatic fields, as opposed to being driven
by the carrier
gas. The filter plates 1442 apply transverse radio frequency (RF) field
voltages and do
excitation electric compensation fields to the ions moving through analytical
region 1440
to separate the species within a sample.
With water vapor removed, interferants (e.g., hydrocarbons and others)
typically
comprise roughly 0.10% of the incoming air volume by weight. Depending on the
collection efficiency of the pre-concentrator 1420, the molecular sieve 1446
may be
sized to support about 6, 9, 12 or more months of substantially continuous or
continuous
operation before saturating. The molecular sieve 1446 may also be configured
to allow
movement of air in a circulatory fashion through the ion filter electrodes
1442 and back
to the ionization region 1424.
The DMS analyzer system 1400 may be used for detecting low concentrations
(e.g., parts per trillion (ppt)) of CWAs, such as, without limitation, nerve
and blister
agents. In one illustrative embodiment, the DMS analyzer system 1400 includes
a high-
sensitivity, low-power, sample gas analyzer 1404 that builds on MEMS
technology, but
further miniaturizes the DMS analyzer system 1400 to achieve parts-per-
trillion
sensitivity, about 0.25 W overall power consumption (i.e., 1 Joule measurement
every 4
seconds), and a size of about 2-cm3 or less.
Because of the smaller analytical region 1440 and the resulting lower flow
rate
requirements, a low-power (e.g., mW) solid-state gas transport pump 1402,
using ionic
displacement, may be employed to draw an air sample into the DMS analyzer
system
1400 and onto the CWA-selective chemical membrane pre-concentrator 1420.
Compact
DMS analyzer systems according to the invention have shown very high
sensitivities to
-66-
CA 02551991 2006-07-05
WO 2005/067582 PCT/US2005/001867
CWA simulants. By way of example, a compact DMS analyzer system according to
the
invention has been shown to detect methyl salycilate at parts-per-trillion
(ppt) levels.
The DMS analyzer system 1400 has the ability to resolve CWA simulants from
interferants that cannot be resolved by current field-deployed detection
technologies.
Fig. 42 is a graph depicting a DMS spectra showing resolution of
dimethylmethylphosphonate (DMMP) from aqueous firefighting foam (AFFF) as
measured in a DMS analyzer system 1400. AFFF is one interferant that has
proved
extremely challenging for conventional IMS systems to resolve CWAs or other
simulants. The AFFF ion intensity peak tends to overlap with the agent peak
during
sample detection in DMS or IMS systems.
Fig. 42 is a graph of multiple plots showing experimental results for a series
of
CWA simulants selectively mixed with 1% headspace of AFFF. The top plot 1460
of
Fig. 42 shows RIP for a DMS analyzer system 1400 with background air but no
sample
present with the sensor at atmospheric pressure. In the next plot 1462 , the
AFFF
interferant is added. This results only in a slight shift to the left (more
negative
compensation voltage) of the RIP ion intensity peak. Then, in plot 1464, the
CWA
simulant DMMP is introduced into the spectrometer and the typical monomer and
dimmer peaks appear together with a corresponding reduction in the RIP peak
ion
intensity. When 1 % AFFF is added according to plot 1468, the DMMP peaks are
not
effected and only a slight leftward shift of the RIP is observed. The same
experiment
was repeated with DIMP in plots 1468 and 1470, and the effect of AFFF was
negligible.
In plot 1472, MS is introduced, and according to monitored negative ion peaks,
gives
similar data illustrating the lack of interference with AFFF. The conclusion
is that 1
AFFF has virtually no effect. Thus, Fig. 42 illustrates the ability of the DMS
analysis
system 1400 to resolve CWA simulants from interferants.
In one illustrative embodiment, the compact hand-held DMS analyzer system
1400 is achieved by combining the following design characteristics: (a) using
the
analyzer/filter/detector 1410 with improved sensitivity and size reduction;
(b) using the
solid-state flow generator or electromechanical pump as a gas transport pump
1402 to
sample and move analytes; (c) using the CWA-selective chemical membrane pre-
concentrator 1420 with integrated heater (in some configurations provided by
using a
solid-state generator or electromechanical pump to transfer heat from other
analyzer
-67-
CA 02551991 2006-07-05
WO 2005/067582 PCT/US2005/001867
system components to the pre-concentrator 1420) to remove water vapor and to
concentrate; and/or (d) using electric field propulsion of the ions 1454
through the
analytical region 1440 of analyzer 1410.
According to various illustrative embodiments, the invention improves the
resolution of species identification over conventional systems, while
decreasing size and
power to achieve parts-per-trillion sensitivity, a less than about 0.25 mW
overall power
dissipation, and a size of about a 2-cm3 or less in an entire system not
including a power
source or display, but including an RF field generator. According to some
embodiments,
an analyzer system of the invention has a total power dissipation of less than
about 15 W,
about 10 W, about 5 W, about 2.5W, about 1 W, about 500 mW, about 100 mW,
about
50 mW, about 10 mW, about 5 mW, about 2.5 mW, about 1 mW, and/or about .5 mW.
According to further embodiments, an analyzer system according to the
invention,
optionally including a display (e.g., indicator lights and/or an alphanumeric
display) and
a power source (e.g., a rechargeable battery) compartment, along with an RF
field
generator, may have a total package outer dimension of less than about .016
m3, .0125
m3, .O1 m3, .0056 m3, .005 m3, .002 m3, .00175 m3, .0015 m3, .00125 m3, .001
m3, 750
cm3, 625 cm3, 500 cm3, 250 cm3, 100 cm3, 50 cm3, 25 cm3, 10 cm~, 5 cm3, 2.5
cm3, with
the package being made, for example, from a high impact plastic, a carbon
fiber, or a
metal. According to further embodiments, an analyzer system, for example,
according to
the invention, including an RF generator, and optionally including a display,
keypad, and
power source compartment, may have a total package weight of about 5 lbs, 3
lbs, 1.75
lbs, 1 lbs, or .5 lbs.
Table 1 provides a comparison of drift tube (e.g., the constrained channel)
dimensions, fundamental carrier gas velocities, and ion velocities for a
various
illustrative embodiments of a DMS analyzer system 1400 depending on the flow
rate (Q)
available to the analysis unit. Designs 1-4 provide flow rates of varying
orders of
magnitude ranging from about 0.031/m to about 3.01/m. Table 1 illustrates that
as the
flow rate is decreased through the DMS analyzer system 1400, the filter plate
dimensions
and power requirements are reduced. Table 1 is applicable to a DMS analyzer
system
1400 using either a sample gas or longitudinal field-induced ion motion. The
time to
remove an unwanted analyte is preferably less than about the time for the
carrier to flow
through the filter region (tratio). Also, for a particular target agent, the
lateral diffusion
-68-
CA 02551991 2006-07-05
WO 2005/067582 PCT/US2005/001867
as the ion flows through the analyzer 1410 is preferably less than about half
the plate
spacing (difratio). Based on this criteria, the plate dimensions may be
reduced to about 3
x 1 mm2 or smaller, while the ideal flow power may be reduced to less than
about 0.1
mW. Thus, even for design 4, the number of analyte ions striking the detectors
is
sufficient to satisfy a parts-per-trillion detection requirement.
Descri tion UnitsS mbol Desi Desi n Desi Desi n
n 1 2 n 3 4
Q = 3 Q=0.3 1/m Q=0.31/mQ=0.03
I/m Base dimenscaled 1/m
Baseline
plate dimensions
*len th m L 0.025 0.025 0.005 0.001
*width m b 0.002 0.002 0.001 0.0004
*air ap m h 0.0005 0.0005 0.0005 0.0002
*volume flow1/minQf 3 0.3 0.3 0.03
rate
Flow veloci mls Vf SO 5 10 6.25
pressure Pa dPf 1080 108 43.2 33.75
drop
flow ower W Powf 0.054 0.00054 2.16E-041.69E.05
RF excitationV Vrf 650 650 650 260
desi n ratios
Time to remove
unwanted
analyte
divided by tratio 0.0128 0.0013 0.0128 0.0160
carrier
time s
wanted ions-lateral
diffusion
divided
by half ap s difratio0.200 0.632 0.200 0.283
ions to count- Nout 1.22E+071.22E+06 1.22E+061,22E+05
er cycle
Table 1. Illustrative DMS Analyzer System Design Specifications and
Characteristics
For sample/carrier gases, there does not appear to be an electromechanical
pump
that operates at the preferred flow characteristics with an efficiency better
than about
0.5%. With a 0.5% efficiency, an ideal flow loss of about 0.05 mW results in
an actual
power consumption of about 10 mW, about a factor of 100 greater than in the
above
discussed illustrative embodiment of the invention.
The DMS system 1400 may simultaneously detect both positive and negative ion
intensity peaks which further improves detection selectivity. The combination
of the
positive and negative ion channel information, the shift in spectral peals as
a function of
applied field strength or voltage, and the display is this information in a
three-
dimensional manner provide a novel mechanism for chemical identification.
Fig. 43 is a three-dimensional dispersion plot 1750 of the detection of
positive
ions of agent GA over a range of field voltages and field compensation
voltages with
varying intensity represented in varying color according previously described
illustrative
-69-
CA 02551991 2006-07-05
WO 2005/067582 PCT/US2005/001867
embodiments of the invention. The plot 1750 illustrates the enhanced
identification
(selectivity) of a compound using a three-dimensional dispersion plot by, for
example, a
DMS system 1400. In comparison, Fig. 25 is a three-dimensional dispersion plot
of
negative ions of GA over a range of RF voltage versus compensation voltage
with
varying intensity represented in varying color that illustrates the enhanced
identification
(selectivity) of a compound using a three-dimensional dispersion plot by, for
example,
DMS system 1400. Both measurements were performed with a concentration of GA
at
0.14 ng/l, a Ni63 source, 50% RH, 3 scan averaging, and 350 cc/min carrier gas
flow.
The differences between the three-dimensional plots 814 of Fig. 25 and 1750 of
Fig. 50
illustrate that performing both positive and negative ion mode detection
provides
enhanced signature identification of ion species
In certain illustrative embodiments, the compact DMS system 1400 of Fig. 41
and various other figures may employ features and/or be incorporated into
systems
described in further detail in U.S. Patents 6,495,823 and 6,512,224, the
entire contents of
both of which are incorporated herein by reference.
Figs. 44-53 are conceptual block diagrams of chemical and/or biological agent
detection systems using various configurations of a mobility detection
analyzer system
such as those depicted and described herein, a recirculation system, and other
components according to illustrative embodiments of the invention. More
particularly,
Fig. 44 is a conceptual block diagram of a CWA and/or biological agent
detection system
1476 according to an illustrative embodiment of the invention. The system 1476
employs a mobility detection system 1478, molecular sieve 1480, pump 1482 with
optional vent 1484, optional second molecular sieve 1486, circulating channel
1488,
sample inlet 1490, exhaust 1492, membrane 1494, and orifice 1496. The system
1476
may also employ filtered air or gas 1498 to circulate or transport a sample
through the
system 1476. The mobility analyzer system 1478 may be a compact DMS analyzer
system 1400 of Fig. 48, DMS system 10 of Fig. 5, an IMS, a TOF-IMS, a GC-IMS,
an
MS or the like. The system 1476, like all of the previously described
illustrative
systems, may employ one or more dopants such as, methylene bromide (CHaBra),
methylene chloride (CHZCIa), chloroform (CHC13), water (H20), methanol
(CH30H),
and/or isopropanol, introduced, mixed and/or flowed with the sample to enhance
analysis.
-70-
CA 02551991 2006-07-05
WO 2005/067582 PCT/US2005/001867
In operation, the system 1476 receives a sample S at inlet 1490 and passes it
through the membrane 1494 into the circulation channel 1498. The membrane 1494
may
filter out unwanted interferants, if desired, in the same or similar manner as
the pre-
concentrator 1420 of Fig. 48. The orifice 1496 may, in a fixed, controlled, or
adjustable
manner, regulate the gas andlor sample flow into the analyzer system 1478 and
thereby
regulate or control the pressure within the analyzer system 1478. Thus, the
analyzer
system 1478 may operate at atmospheric pressure, below atmospheric pressure,
or above
atmospheric pressure. The pump 1482 maintains gas flow in the analyzer system
1478
and pressure control either independently or in coordination with the orifice
1496. Thus,
in one example, the pump 1482 draws sample flow through the orifice 1496 into
the
analyzer system 1478 to enable detection and identification of selected ion
species. The
analyzer system 1478 may be a DMS system 1400 that tenably detects certain ion
species by adjusting its field lflow channel conditions, such as, its Vrf and
Vcomp,
parameters and in some configurations, controlling the pump 1484 and/or the
orifice
1496 to control pressure within the system 1400.
Once detection and identification are performed, the molecular sieve 1480 may
trap spent analytes from the analyzer system 1478. Again, the pump 1484,
whether
electromechanical or solid-state, propels the gas optionally through a second
molecular
sieve 1486, through the circulating channel 1488. The sample gas is then
expelled
through the membrane 1494 and the outlet 1492 or mixed and re-circulated with
more
sample S back into the orifice 1496.
Fig. 45 is a conceptual block diagram of a CWA andlor biological agent
detection
system 1500, configured for reduced pressure analysis, according to an
illustrative
embodiment of the invention. The system 1500 is similar to the system 1476
except that
an additional sample flow channel 1502 is employed instead of a membrane. The
system
1500 includes sample S inlet 1504, orifice 1506, ionization region 1508,
deflector plate
1510, attractor plate 1512, channel 1502 pump 1514, second channel 1516,
analyzer
system 1518, molecular sieve 1520, pump 1522, and optional second molecular
sieve
1524.
In operation, the system 1500 draws sample S through the sample inlet 1504 and
through the orifice 1506. The orifice 1506 may be controlled, fixed, or
adjustable to
regulate sample gas flow andlor pressure in the channel 1502. The pump 1514
may also
-71-
CA 02551991 2006-07-05
WO 2005/067582 PCT/US2005/001867
be used in coordination with the orifice 1506 to regulate gas flow and/or
pressure within
the channel 1502. The deflector plate 1510 may force, push, or selectively
separate ions
into the channel 1516 through the opening 1526 while the attractor 1512 may
attract ions
from the channel 1502 into the channel 1516. A pressure drop across the
opening 1526
may be adjusted so that only sample ions enter the channel 1516 while sample
neutrals
are prevented from entering. The sample ions may be directly introduced into
the
analyzer system 1518 or the ions may be neutralized and then re-ionized in the
analyzer
system 1518. The analyzer system 1518 may be a DMS system, M system, or the
like.
The analyzer system 1518 may include multiple DMS, IMS, or other like systems
or a
combination of such systems to perform sample detection and identification.
For
example, system 748 of Fig. 21 or system 754 of Fig. 22 may be employed to
apply
conventional DMS detection in combination with fragmentation to enhance sample
analysis.
The channel 1516 pump 1524 may then draw the sample S from the analyzer
system 1518 through the molecular sieve 1520 and then propel the sample S,
optionally
through the second molecular sieve 1524. The molecular sieves 1520 and 1524
will
capture most of the spent sample S a~ialytes. Any remaining sample S is mixed
with new
sample S gas and returned to the analyzer system 1518 via the channel 1516.
The outlet
1528 expels sample S gas from the channel 1502.
Fig. 46 is a conceptual block diagram of a cylindrical or coaxial CWA andlor
biological agent detection system 1530 according to an illustrative embodiment
of the
invention. The system 1530 includes a sample S inlet 1532, constrictor 1534,
inner
channel 1536, opening 1538, clean transport gas inlet 1540, outer channel
1542, analyzer
system 1544, channel 1542 outlet 1546, and channel 1536 outlet 1548.
In operation, the system 1530 draws the sample S into the channel 1536 through
the constrictor or orifice 1534. The constrictor 1534 may be adjustable,
controllable or
fixed to enable a pressure reduction below 1 atm, for example to 0.5, 0.65, or
0.85 atm,
in the channel 1536. The clean transport gas inlet 1540 receives clean
transport gas into
the channel 1542. The channel 1542 may operate at pressures below 1 atm. The
sample
S may be drawn or attracted into the channel 1542 through the opening 1538 by
a
pressure differential with the channel 1536, an ion attractor in channel 1542,
gas flow
into channel 1542, or other like technique. The analyzer system 1544 then
detects and
-72-
CA 02551991 2006-07-05
WO 2005/067582 PCT/US2005/001867
identifies the ion species of the sample S and expels the sample S through the
outlet
1546. The sample neutrals in the channel 1536 may be expelled through the
outlet 1548.
Fig. 47 is a DMS system 1550 including an orifice 1552 at the system 1550
inlet
to control pressure within the system 1550 in coordination with a pump 1554.
The
system also includes the molecular sieve 1556, ion source 1558, filter 1560,
and detector
1562. In operation, the pump 1554 has sufficient power to draw a sample S
through the
orifice 1552 to then enable detection of the sample at a reduced pressure.
Fig. 48 is a DMS system 1564 including an orifice 1566, ionization source
1568,
filter 1570, detector 1572, molecular sieve 1574, pump 1576, a second
molecular sieve
1578, a membrane 1580, an inlet 1582, and outlets 1584 and 1586. Because the
membrane 1580 is positioned upstream of the orifice 1566 and the sample flow
is in
direction 1588, the membrane 1580 operates at atmospheric pressure while the
ionization
source 1568, filter 1570, and detector 1572 operate below atmospheric pressure
due to a
pressure drop across the orifice 1566. It may be advantageous to operate the
membrane
1580 at atmospheric pressure to prolong its useful life.
Fig. 49 is a DMS system 1590 including an orifice 1592, ionization source
1594,
filter 1596, detector 1598, molecular sieve 1600, pump 1602, a second
molecular sieve
1604, a membrane 1606, an inlet 1608, and outlets 1610 and 1612. Because the
membrane 1606 is positioned downstream of the orifice 1592 and the sample flow
is in
the direction 1614, the membrane 1606 operates below atmospheric pressure
along with
the ionization source 1594, filter 1596, and detector 1598 due to a pressure
drop across
the orifice 1592. It may be advantageous to operate the membrane 1606 below
atmospheric pressure.
Fig. 50 is a DMS system 1616 including an orifice 1618, ionization source
1620,
filter 1622, detector 1624, molecular sieve 1626, pump 1628, a second
molecular sieve
1630, a membrane 1632, an inlet 1634, and outlets 1636 and 1638. Because the
membrane 1632 and the ionization source 1620 are positioned upstream of the
orifice
1618 and the sample flow is in direction 1640, the membrane 1632 and the
ionization
source 1620 operate at atmospheric pressure while the filter 1622 and detector
1624
operate below atmospheric pressure due to a pressure drop across the orifice
1618. It
may be advantageous to operate the membrane 1632 and ionization source 1620 at
atmospheric pressure.
-73-
CA 02551991 2006-07-05
WO 2005/067582 PCT/US2005/001867
Fig. 51 is a DMS system 1642 including a first channel 1644 and a second
channel 1646 operating at atmospheric pressure. The first channel 1644
includes an
ionization source 1648, deflector electrode 1650, pump 1652, inlet 1666, and
outlet
1668. The second channel 1646 includes a filter 1654, detector 1656, molecular
sieve
1658, pump 1660, and molecular sieve 1662. An opening 1664 provides fluid
communication between the channels 1644 and 1646.
In operation, the system 1642 receives a sample S at the inlet 1666 into the
channel 1644. The ionization source 1648 ionizes the sample S. The ionized
portions of
the sample S, e.g., the positive ions, are deflected through the opening 1664
into the
channel 1646 by the deflector 1650 having a positive charge. When the
deflector 1650 is
negatively charged, the deflector 1650 may deflect negative ions of sample S
through the
opening 1664 into the channel 1646. The neutrals and non-deflected ions of
sample S
are then drawn by the pump 1652 to the outlet 1668 and expelled from the
system 1642
while the ions in the channel 1646 are filtered by the filter 1654 and
detected by the
detector 1656. The pump 1660 creates circulation flow in the direction 1670
within the
channel 1646 to draw the sample S through the molecular sieve 1658 which
collects
spent analytes and then through a second molecular sieve 1662.
Fig. 52 is a DMS system 1672 including a first channel 1674 and a second
channel 1676 operating below atmospheric pressure without a membrane. The
first
channel 1674 includes an ionization source 1678, deflector electrode 1680,
pump 1682,
inlet 1684, outlet 1686, and orifice 1700. The second channel 1676 includes a
filter
1688, detector 1690, molecular sieve 1692, pump 1694, molecular sieve 1696,
and
orifice 1702. An opening 1698 provides fluid communication between the
channels
1674 and 1676.
In operation, the system 1672 receives a sample S at the inlet 1684 into the
channel 1674 and through the orifice 1700. The orifice 1700 provides a
pressure drop
within the channel 1674 caused by the gas and/or air flow generated by the
pump 1682.
The ionization source 1678 ionizes the sample S. The ionized portions of the
sample S,
e.g., the positive ions, are deflected through the opening 1698 into the
channel 1676 by
the deflector 1680 having a positive charge. When the deflector 1680 is
negatively
charged, the deflector 1680 may deflect negative ions of sample S through the
opening
1698 into the channel 1676. The neutrals and non-deflected ions of sample S
are then
-74-
CA 02551991 2006-07-05
WO 2005/067582 PCT/US2005/001867
drawn by the pump 1682 to the outlet 1686 and expelled from the system 1672
while the
ions in the channel 1676 are filtered by the filter 1688 and detected by the
detector 1690.
The pump 1694 creates circulation flow in the direction 1704 within the
channel 1676 to
draw the sample S through the molecular sieve 1692 which collects spent
analytes and
then through a second molecular sieve 1696.
Fig. 53 is a DMS system 1706 including a first channel 1708, a second channel
1710, and a third channel 1712 with the second channel 1710 and third channel
1712
capable of operating at or below atmospheric pressure using a membrane 1714.
The first
channel 1708 includes an inlet 1716 and an outlet 1718. The second channel
1710
includes an ionization source 1718, optional ionization source 1720, deflector
electrode
1722, filter 1724, and detector 1726. The third channel 1712 includes an
attractor
electrode 1728, filter 1730, and detector 1732. The combined circulation
channel 1734
includes the chemical filter 1736, pump 1738, and optional chemical filter
1740. An
opening 1742 provides fluid communication between the channels 1710 and 1712.
In operation, the system 1706 receives a sample S at the inlet 1716 into the
channel 1708. The sample S may be introduced from a GS column. The membrane
1714 may filter a portion of the sample S and provide a pressure barrier to
enable a
pressure below atmospheric pressure in the channels 1710 and 1712. The
channels 1710
and 1712, along with the combined circulation channel 1734, circulate filtered
and clean
carrier gas. The ionization source 1718 ionizes the sample S within this clean
carrier
gas. Optionally, a second ionization source 1720 may be employed in the
channel 1710
to enhance the ability of the deflector 1722 and attractor 1728 to transfer
selected ions
from the channel 1710 to the channel 1712. For example, the ionized portions
of the
sample S, e.g., the positive ions, are deflected through the opening 1742 into
the channel
1712 by the deflector 1722 when the deflector 1722 is positively charged. When
the
deflector 1722 is negatively charged, the deflector 1722 may deflect negative
ions of
sample S through the opening 1728 into the channel 1712.
The neutrals and non-deflected ions of sample S are then drawn by the pump
1738 through the chamzel 1710, filter 1724 and detector 1726 while the
selected ions are
drawn through the channel 1712, filter 1730, and detector 1732. The pump 1738
creates
circulation flow in the direction 1744 within the channels 1710, 1712, and
1734 to draw
the Garner gas from the channels 1710 and 1712 into the channel 1734 and
through the
75 _
CA 02551991 2006-07-05
WO 2005/067582 PCT/US2005/001867
chemical filter 1736.and, optionally, the second chemical filter 1740. The
chemical
filters 1736 and 1740 remove unwanted contaminants from the carrier gas. A
make up
gas may also optionally be introduced into the channel 1734 from an outside
system.
The deflector 1722 and the attractor 1728 may be activated in a controlled
manner to transport ions from the channel 1710 to the channel 1712. In the
channel
1710, the non-deflected ions are filtered by filter 1724 and detected by
detector 1726
while, in the channel 1712, the deflected and attracted ions are filtered by
the filter 1730
and detector 1732. The resulting detected measurements from the channels 1710
and
1712 can then be compared, added, or subtracted from each other to enhance the
identification of ion species. The controlled iouzation of the sample S which
is
performed in a clean carrier gas, the detection in the channel 1712 of monomer
or de-
clustered ions, and the detection of clustered ions in the channel 1710
provide enhanced
compound and ion species identification.
Other illustrative embodiments include systems, methods and devices for
improving sample analysis, generally, and detection sensitivity, specifically,
by
performing sample ion species pre-separation and/or sample amplification. Such
illustrative embodiments are discussed below.
Pre-separation of certain ion species of a sample reduces, and in some cases,
eliminates the problem of competitive ionization within ion based W obility
detection
analyzers. At any atmospheric pressure or conditions where ion and/or neutral
interactions have an effect on ion formation, atmospheric pressure chemical
ionization
(APCI) may occur. In such instances, compounds with the highest proton
affinity (PA)
and/or highest electron affinity (EA) preferentially capture or take up the
charge from an
ionization source. If there is a limited amount of charge 'available, for
example, in a
compact DMS system with limited power resources, the amount of available
charge may
not be sufficient to charge or ionize all of the molecules in a sample matrix.
Thus, if
only some of the molecules in a sample matrix are ionized, only that limited
amount of
molecules may be detected, resulting in erroneous analysis of a chemical
matrix.
Furthermore, certain compounds may not be.ionized due to competitive
ionization,
resulting in no detection of these compounds. The invention includes
embodiments that
eliminate or mitigate the effects of competitive ionization by separating ion
species
-76-
CA 02551991 2006-07-05
WO 2005/067582 PCT/US2005/001867
before sample analysis or detection to prevent one ion species from consuming
the
charge intended to be used to ionize another ion species.
One technique for reducing the effect of competitive ionization is to use a
gas
chromatograph (GC) to pre-separate a sample matrix. A GC column may be used to
separate multiple compounds, which may then be detected individually by a
mobility
based analyzer, such as a DMS. Even a compound with a relatively low proton
and/or
electron affinity may be subsequently ionized and detected. A GC, however, is
generally
more complex, expensive, and often adds significant analysis time to provide
sufficient
compound separation. Typical analysis times are longer than one minute for
sufficient
compound separation. Thus, the invention includes systems, methods and devices
for
pre-separating a sample in a fast, efficient, and robust manner. According to
other
aspects, the invention provides such sample pre-separation in a compact
package. Thus,
the invention includes systems, methods and devices for pre-separating a
sample in a
fast, efficient, and robust manner. According to other aspects, the invention
provides
such sample pre-separation in a compact package.
Where further sample characterization is desired, neutrals, i.e., molecules of
a
sample that are not ionized, may be mixed with a new supply of charge, e.g.,
reactant
ions or a plasma field, to enable further APCI reactions to occur. The newly
created ions
may then be removed for analysis or simply discarded. This process may be
repeated
until a desired compound type is ionized and detected using an analyzer.
In one embodiment of the invention, sample pre-fractionation is achieved by
direct ionization of a sample matrix, competitive ionization by compounds of a
certain
type in the sample matrix, and then removal of the ionized compounds. The
ionization
source may be, for example, an UV source, laser, corona discharge, plasma
source, soft
X-ray source, or a source of reactant ions. Repeated interrogation of chemical
compounds in a sample based on relative proton and electron affinities, using
competitive ionization and the reaction of residual and/or un-reacted neutrals
provides a
comprehensive measure of the chemical composition of a sample without the need
for
traditional GC techniques.
The process of competitive ionization and the removal of product ions may be
repeated, enabling incremental and selective isolation of product ions and
neutrals.
While chemical ionization involves the inj ection of fresh charge using
reactant ions, non-
_77_
CA 02551991 2006-07-05
WO 2005/067582 PCT/US2005/001867
chemical energy sources such as a laser or plasma or corona generator may
ionize
molecules of a sample.
In addition to being used for analysis, the invention may be used for
selectively
cleaning and/or conditioning samples, e.g., for removing selected molecules
from a
sample stream. For example, certain semiconductor industry or other process
control
applications require ultra pure or clean gasses. In these processes, water
molecules are
considered a contaminant in a gas stream of Nitrogen or Argon. In certain
embodiments
of the invention, water within a gas sample may be preferentially ionized and
then
removed from the gas stream while purified Argon or Nitrogen are then used in
a low
pressure chemical vapor deposition or for another semiconductor application.
Fig. 54A is a conceptual diagram showing a~z example of a pre-separation
process
1750 of a sample matrix 1752 including two types of compound molecules 1756
and
1758 according to an illustrative embodiment of the invention. The process
1750 begins
by mixing reactant ions 1754 with a sample matrix of the two types of compound
molecules 1756 and 1758 with a source of reactant ions 1754 to form a reactant
ion and
sample matrix mixture 1760.
This mixing may involve injecting (e.g., via an injection pulse) the sample
matrix
1752 into a re-circulating or circular flow of gas where the mixing of
reactant ions 1754
with neutral molecules 1756 and 1758 can be controlled. Also, the injection of
reactant
ions 1754 and subsequent extraction of product ions, e.g., product ions 1762,
can be
enabled using orifices in an ionization region, chamber, or gas flow path.
Alternatively,
a linear scheme may be employed where reactant ions 1754 are continuously
introduced.
In this scheme product ions, e.g., product ions 1762, are removed at discrete
or variable
distances from the injection point of sample matrix 1752 or the product ion
formation
point. In either case, the effluent flow (e.g., the flow of gas) may be used
to control or
adjust the residence or contact times between reactant ions 1754 and neutral
molecules
1756 and 1758 to control the formation of product ions such as product ions
1762 or
1764.
Because the compound molecules 1756 are preferentially ionized by the reactant
ions 1754, the mixture 1760 includes un-ionized compound molecules 1756 and
product
ions 1762. The product ions 1762 may be separated from the compound 1758 using
chemical, electrical, magnetic, and/or a mechanical separation technique to
remove the
_78_
CA 02551991 2006-07-05
WO 2005/067582 PCT/US2005/001867
product ions 1762. The ionized molecules or product ions 1762 may then be
analyzed
and characterized, for example, using a DMS, IMS, MS, or any suitable analyzer
system
or may be discarded.
Because the first type of compound molecules 1756 are preferentially ionized
to
form ionized molecules or product ions 1762, the second type of compound
molecules
1758 predominately are not ionized and retain a neutral charge. However, the
source of
reactant ions 1754 may be re-introduced to and mixed with the remaining
neutral
molecules 1758 to form ionized molecules or product ions 1764. These product
ions
1764 may then be separated and analyzed. The process 1750 may be repeated for
any
sample matrix with any number of compounds by repeatedly ionizing the sample
matrix
and removing the resulting product ions. Due to competitive ionization, the
process
incrementally removes different compounds with different ionization energies,
enabling
a comprehensive analysis of all compounds with a chemical sample.
Fig. 54B is a conceptual diagram showing the pre-separation process 1768 of a
sample matrix 1770 including two types of compound molecules 1772 and 1774
using an
ionization source 1778 and electric field 1776 according to an illustrative
embodiment of
the invention. In this case, an ionization source 1778, such as a plasma
corona, laser, UV
source, or the like, is used to ionize the sample matrix 1770. Due to
competitive
ionization, the molecules 1774 predominantly are ionized into product ions
1780. These
product ions 1780 are then exposed to the electric field,1776 which
substantially
removes the product ions 1780 from the ionized sample matrix 1782. The removed
product ions 1780 may be analyzed or discarded.
The remaining non-ionized neutral molecules 1772 may then be ionized using the
same ionization source 1778 or another ionization source to form product ions
1784.
The product ions 1784 may then be analyzed using a DMS or discarded. The
electric
field 1776 may be generated by any one of or combination of a deflector plate
deflector
array, attractor plate, attractor grid, and attractor array or various other
electrodes.
Alternatively, a magnetic field may be employed to remove selected product
ions.
Fig. 55 is a conceptual block diagram of a sample pre-separation system 1786.
The pre-separation system 1786 uses first and second ionization regions 1788
and 1790
and first and second deflector regions 1792 and 1794 to separate a sample
matrix S.
Sample matrix S includes at least two compounds according to an illustrative
-79-
CA 02551991 2006-07-05
WO 2005/067582 PCT/US2005/001867
embodiment of the invention. The sample pre-separation system 1786 includes an
inlet
1796, gas flow channel 1798, first ionization region 1788, first deflector
region 1792,
first deflector plate 1800, first attractor plates 1802, first exhaust 1804,
first optional
analyzer 1806, pump 1808, second ionization region 1790, second deflector
region 1794,
second deflector plate 1810, second attractor plates 1812, second exhaust
1814, second
optional analyzer 1816, and the exhaust channel 1818.
In operation, the sample matrix S is drawn into gas the flow channel 1798
through the inlet 1796 and then ionized in the first ionization region 1788.
The sample S
may be ionized using reactant ions or any of the non-reactant ion sources
described
previously. Due to the chemical properties of the molecules, the limited
supply of
charge leads to competitive ionization where predominantly certain types of
compound
molecules are ionized into product ions while other types of compound
molecules
predominantly remain neutral. The first deflector plate or electrode 1800 and
the first
attractor plates or electrodes 1802 generate an electric field that propels
the product ions
out of the gas flow channel 1798 and through first exhaust 1804. The first
exhaust 1804
may deliver the product ions to an analyzer for detection and identification
of the product
ion species. Otherwise, the first exhaust 1804 may simply discard the product
ions into
the surrounding environment or neutralize them.
The remaining neutral molecules continue to travel in the gas flow channel
1798
and may pass through the first optional analyzer 1806. The analyzer 1806 may
be a
DMS system that ionizes the remaining neutral molecules, performs a non-
destructive
detection and identification, and then neutralizes the molecules before
retuniing the
neutrals to the gas flow channel 1798. The neutral molecules then continue to
travel in
the gas flow channel 1798 in the direction 1819 toward pump 1808 which propels
the
neutrals to the second ionization region 1790. In the second ionization region
1790,
another type of compound molecule becomes predominantly ionized into product
ions
due to competitive ionization while one or more other compound molecules
remain
neutral in charge.
In the second deflector region 1794, second deflector plate 1810 and second
attractor plates 1812 generate an electric field that propels the product ions
out of the gas
flow channel 1798 and through the second exhaust 1814. The second exhaust 1814
may
deliver the product ions to an analyzer for detection and identification of
the product ion
-80-
CA 02551991 2006-07-05
WO 2005/067582 PCT/US2005/001867
species. Otherwise, the second exhaust 1814 may simply discard the product
ions into
the surrounding environment.
Again, the remaining neutral molecules continue to travel in the gas flow
channel
1798 and may pass through an optional analyzer 1816. The analyzer 1816 may be
a
DMS system that ionizes the remaining neutral molecules, performs a detection
and
identification, and then neutralizes the molecules before returning the
neutrals to the gas
flow channel 1798. The. neutral molecules may then continue to travel through
the
exhaust channel 1818 to yet further ionization regions and analyzers for
further analysis
or be discarded.
Fig. 56A is a conceptual diagram of a sample pre-separation process 1820
according to a second illustrative embodiment of the invention. In the sample
pre-
separation process 1820, a sample matrix 1822 may be re-circulated multiple
times to
interact with an ionization source such as reactant ions 1824. The sample pre-
separation
process 1820 may remove different compound product ions 1826 from the sample
matrix
1822 in each circulation. The process 1820 begins with the mixing of the
sample matrix
1822 in an interaction region with a source of reactant ions 1824 to form an
interaction
region mixture 1828. Due to competitive ionization, the types of compounds
within the
sample matrix 1822 with relatively higher proton and electron affinities tend
to become
ionized. Other types of compounds in the sample matrix 1822 with lower proton
and
electron affinities tend to remain neutral.
The ionized molecules, or product ions 1826, are then removed from the mixture
1828 using previously described techniques such as an electric or magnetic
field. The
remaining neutral molecules 1830 are re-circulated for further ionization.
Prior to further
ionization, the remaining neutral molecules 1830 may optionally be subjected
to
mobility-based analysis using, for example, a DMS system 1832. After the
analysis, the
neutral molecules 1830 are then delivered to an interaction region for further
mixing with
reactant ions 1824.
The resulting neutral molecules1830 may be re-circulated multiple times. Each
time, the sample 1822 or remaining sample matrix 1830 interacts with reactant
ions 1824
enabling the incremental removal of different compound molecules from the
sample
1822. The compound removed in each re-circulation tends to have a lower proton
or
electron affinity than the compounds removed in a previous re-circulation. The
-81-
CA 02551991 2006-07-05
WO 2005/067582 PCT/US2005/001867
remaining neutral molecules 1830 may also be delivered to an analyzer 1834
after a
sequence of iterations for detection and identification of a desired ion
species.
Fig. 56B is a conceptual diagram of a sample pre-separation process 1836
according to another illustrative embodiment of the invention. In the sample
pre-
y separation process 1836, a sample matrix 1838 including at least two types
of compound
molecules 1840 and 1842, are re-circulated multiple times to interact with an
ionization
source 1844 and an electric field 1846. As a result, the sample pre-separation
process
sequentially removes different compound product ions. In this case, the
ionization
source 1844, such as a plasma field, laser, UV source, or like, is used to
ionize the
sample matrix 1838 to create an ionized sample matrix 1850. Due to competitive
ionization, molecules 1842 tend to be ionized into product ions 1848 in favor
of
molecules 1840. These product ions 1848 are then exposed to the electric field
1846
which removes the product ions 1848 from the ionized sample matrix 1850. The
product
ions 1848 may be analyzed or discarded.
The remaining non-ionized neutral molecules 1840 may then be ionized by re-
circulating the molecules 1840 to the same ionization source 1844 to form
product ions
1852. The product ions 1852 may then be analyzed using a DMS or discarded. The
electric field 1846 may be generated by any one of or combination of a
deflector plate or
electrode, deflector array, attractor plate or electrode, attractor grid, or
attractor array.
Alternatively, a magnetic field may be employed to remove selected product
ions. This
process may be applied to a matrix with an undetermined number of compounds by
repeatedly re-circulating the sample through the same ion source to thoroughly
characterize and/or identify all of the sample's constituents. The sample
matrix may be
introduced into the pre-separator as a plug or as a continuous stream.
Fig. 57 is a conceptual block diagram of a sample pre-separation system 1854
according to another illustrative embodiment of the invention. The sample pre-
separation system 1854 re-circulates a sample matrix S through an ionization
region
1856 multiple times. During each iteration, the sample pre-separation system
1854
removes a different compound from the sample matrix S. The compound removed on
each iteration has a lower proton affinity or electron affinity than the
compound removed
in the prior iterations. The sample pre-separation system 1854 includes inlet
1858, inlet
valve 1876, gas flow channel 1860, ionization region 1856, ion
deflector/reflector region
_82_
CA 02551991 2006-07-05
WO 2005/067582 PCT/US2005/001867
1864, exhaust 1862, pump 1866, bleed valve 1868, analyzer valve 1870, flow
channel
valve 1872, and an optional analyzer 1874.
In operation, a sample matrix S is drawn into the gas flow channel 1860
through
the inlet 1858 and the inlet valve 1876. The sample matrix S is then ionized
in the
ionization region 1856. The ionization region 1856 may utilize an ionization
source such
as a reactant ion source, UV source, laser, and the like to ionize the sample
S. Due to
competitive ionization, certain types of compound molecules predominantly are
ionized
into product ions while other types of compou~id molecules remain neutral. The
deflector/reflector region 1864 includes a deflector and/or attractor
electrodes that
generate an electric field to propel the product ions out of the gas flow
channel 1860 and
through exhaust 1862. The first exhaust 1862 may deliver the product ions to
an
analyzer for detection and identification of the product ion species.
Otherwise, the first
exliaust 1862 may simply discard the product ions into the surrounding
environment.
The remaining neutral molecules continue to travel in the gas flow channel
1860
through pump 1866. Pump 1866 propels the neutral molecules toward the analyzer
valve
1870. The analyzer valve 1870 may be opened at certain times or in
predetermined
cycles to allow a portion of sample S through the valve 1870 to an analyzer.
This
controlled valve opening enables an analyzer such as a DMS, IMS, or MS to
analyze a
desired ion species without interference from undesired ion species. The gas
flow
channel 1860 may also include a bleed valve 1868 to enable makeup gas to be
added or
excessive gas to be removed from the gas flow channel 1860. Until the analyzer
valve
1870 is operated, the neutral sample S molecules will continue to flow through
flow
channel valve 1872 and may pass through an optional analyzer 1874. The
analyzer 1874
may be a DMS or like system that ionizes the remaining neutral molecules,
performs a
non-destructive detection and identification, and then neutralizes the
molecules before
returning the neutrals to the gas flow channel 1860. The neutral molecules
then continue
to travel in the direction 1875 through the gas flow channel 1860 and
eventually return to
the ionization region 1856. Another type of compound molecule becomes ionized
into
product ions due to competitive ionization while one or more other types of
compounds
molecules remain neutral in charge. This re-circulation process may be
continued until
an ion species is selected for analysis by operating the analyzer valve 1870.
-83-
CA 02551991 2006-07-05
WO 2005/067582 PCT/US2005/001867
Fig. 58A is a conceptual diagram of a sample pre-separation system 1878 where
pre-selected reactant ions are intermixed with a sample stream to enable the
pre-
separation of ions having a particular proton or electronic affinity according
to an
illustrative embodiment of the invention. The pre-separation system 1878
includes a
selected reactant ion type 1880, a sample stream 1882, a mixing unit 1884, a
controller
unit 1886, product ions 1888, and neutral molecules 1890.
In operation, a selected reactant ion species type 1880 is introduced to the
mixer
1884 along with a sample stream 1882. The reactant ion species can be, for
example,
oxygen ions or acetone ions. The mixer 1884 includes an interaction or mixer
region that
enables sample stream 1882 molecules of a relatively higher proton or electron
affinity to
be ionized into product ions 1888. Most molecules of a relatively lower proton
or
electron affinity remain neutral molecules 1890.
The controller 1886 is capable of regulating whether a single type or multiple
types of reactant ions 1880 may be introduced into the mixer 1884 and mixed
with the
sample stream 1882. The type of reactant ion species may be selected based on
a
particular property such as proton affinity, mobility, electron affinity,
and/or chemical
activity. By introducing a certain type of reactant ion or ions 1880, the
controller 1886
can determine which compound molecules or cluster of molecules of the sample
stream
1882 are ionized. Thus, the controller 1886 may more precisely target
particular
compounds of the sample stream 1882 for further analysis or removal from the
sample
stream 1882. The controller 1886 may also regulate effluent and/or gas flow
through the
mixing and/or ionization region to control the contact time between reactant
ions and
sample molecules and, thereby, control the amount of ionization that occurs.
This
technique also applies to other types of ionization sources such a lasers, W
source, and
plasma generators.
Fig. 58B is a conceptual diagram of a sample pre-separation system 1892 where
pre-selected reactant ions 1894, having been filtered and pre-selected, are
then
intermixed with a sample matrix 1896 to enable the pre-separation of ions
having a
particular proton or electronic affinity according to an illustrative
embodiment of the
invention. The pre-separation system 1892 includes pre selected reactant ions
1894, a
sample matrix 1896, an ion mixing region 1898, a product ion separator 1900,
optional
analyzer 1902, and an analyzer 1904.
- 84 -
CA 02551991 2006-07-05
WO 2005/067582 PCT/US2005/001867
In operation, pre-selected reactant ions 1894 of a particular species are
introduced
to the ion mixing region 1898 along with a sample matrix 1896. The reactant
ions 1894
may be filtered and pre-selected using a DMS, IMS, MS, or like system. The ion
mixer
region 1898 enables the sample matrix 1896 molecules having proton or electron
affinities above the proton and electron affinities of the pre-selected ions
1894 to be
ionized into product ions 1906 while molecules of a relatively lower proton or
electron
affinity remain neutral molecules 1908. As described previously, various
techniques
may be utilized to remove the product ions 1906. An optional analyzer 1902 may
be
employed to analyze the product ions 1906. The optional analyzer 1902 may also
include an array of mobility-based analyzers. The analyzer 1904, which may be
a DMS,
IMS, MS, or like, may be employed to analyze the remaining neutral molecules
1908.
For example, ionized molecules such as Acetone may be selectively introduced
as reactant ions and mixed with a sample matrix to remove substantially all
molecules
with proton affinities higher than Acetone's proton affinity (812 KJ/mol). By
mixing a
sample matrix with sufficient Acetone ions, charge will preferentially be
transferred to
molecules in the sample matrix with higher proton affinities than Acetone. The
ionized
molecules or product ions may then be separated form the sample matrix leaving
neutral
molecules having proton affinities less than Acetone's proton affinity. Thus,
by using a
particular reactant ion species to ionize a sample matrix, selected species of
a sample
matrix may be removed or isolated in a more precise and controlled manner.
W certain embodiment of the invention, multiple types of ionization sources or
alternating ionization sources may be employed together or in a sequential
flow
arrangement. Different ionization sources may be employed to selectively
remove ion
species having incrementally lower proton or electron affinities. Thus,
molecules with
higher proton or electron affinities will be removed first. For example, a
sample may
first be exposed to a low ionization source such as a UV source, laser, or
other photo-
ionization source to remove ion species with high affinities. Then, the sample
may be
exposed to a higher ionization source such as a radioactive Ni~3 ionization
source to
remove ions species with relatively lower affinities. Additional ionization
sources with
pre-determined ionization energies may be employed to remove additional ion
species
until a desired ion species remains for analysis using a DMS, IMS, MS, and
like
mobility-based analyzer.
-85-
CA 02551991 2006-07-05
WO 2005/067582 PCT/US2005/001867
Fig. 59A is a conceptual diagram of a sample pre-separation system 1910
including two flow channels wherein multiple ion separations are enabled by
multiple
ionization sources according to an illustrative embodiment of the invention.
The sample
pre-separation system 1910 includes an inlet 1916, gas flow channel 1912,
inlet 1918,
gas flow channel 1914, W ionization source 1920, first Ni63 ionization source
1922,
second Ni63 ionization source 1924, first opening 1926, second opening 1928,
third
opening 1930, outlet 1932, and outlet 1934.
W operation, a sample matrix S is introduced into gas flow channel 1912
through
inlet 1916. The UV ionization source 1920 then ionizes the sample S matrix at
a
relatively low energy. Due to competitive ionization, the compound molecules
of
sample S having the lowest ionization energies and highest affinities, e.g.,
ionization
energies at about or below the UV ionization energy level, are ionized to form
product
ions. These product ions are then deflected from gas flow channel 1912 andlor
attracted
into gas flow channel 1914 through the first opening 1926 by the electrode
1919. These
low energy product ions may then be delivered by gas flow channel 1914 through
outlet
1934 to an analyzer or discarded. The inlet 1918 accepts gas flow into gas
flow channel
1914 to enable the flow of product ions delivered from gas flow channel 1912.
For example, assume the sample matrix S includes nitric oxide species (NOx).
In such a case, NO and NOZ are formed by direct ionization because these are
the only
NOx species with ionization energies below the ionization energy of the UV
source.
Tables 2 arid 3 provide lists of positive and negative NOx ion species
equations
respectively. Also, Table 4 shows the ionization energy, proton affinity, and
electron
affinity for selected NOx ion species.
NO+hv ENO++e
NO+ + HZO + M --~ (H20)NOk + M
(HZO)NO+ + H20 + M -~ (H20)2N0+ + M
(Ha0)"_1NO+ + Ha0 + M --~ (H20)"NO+ + M
(HZO)3N0+ + HZO --~ HN02 + (Hap)3H+
Table 2. Positive NOx Ion Species Equations
-86-
CA 02551991 2006-07-05
WO 2005/067582 PCT/US2005/001867
N02 + hr --~ NO + O
NOa+O+M-~N03+M
NOz + a -~ NOi
NOi + N03 -~ NOZ + N03
NOi + N02 --~ NO + N03-
Table 3. Negative NOx Ion Species Equations
_87_
CA 02551991 2006-07-05
WO 2005/067582 PCT/US2005/001867
IonizationElectron Proton
Energy Affinity Affinity
EI (eV) EA (eV) PA
(KJ/mol)
NO 9.26 0.026 531.8
NOz 9.58 2.3 591
N03 12.57 3.9 n/a
Table 4. NOx Ionization Energy, Proton Affinity, and Electron Affinity
After ionization occurs with respect to the UV ionization source 1920, the non-
ionized or neutral molecules remaining in the gas flow channel 1912 proceed to
the first
Ni63 ionization source 1922. Due to the competitive ionization process, the
remaining
molecules of the sample matrix S with the highest affinities are ionized to
form product
ions. These product ions are then deflected from the gas flow channel 1912
and/or
attracted into the gas flow channel 1914 through the second opening 1928 by
the
electrode 1921. These product ions may then be delivered by the gas flow
channel 1914
through the outlet 1934 to an analyzer or discarded.
Assuming the sample matrix S includes NOx species, the negative polarity NOx
compounds with the highest electron. affinity such as N02 are NO3 are removed
as
product ions. Fig. 60 shows the electron affinities for N02 are N03
respectively.
After ionization occurs with respect to the first Ni63 ionization source 1922,
the
non-ionized or neutral molecules remaining in the gas flow channel 1912
proceed to the
second Ni63 ionization source 1924. Due to the competitive ionization process,
the
remaining molecules of the sample matrix S with the highest affinities are
ionized to
form product ions. These product ions are then deflected from the gas flow
channel
1912 and/or attracted into the gas flow channel 1914 through the third opening
1930 by
the electrode 1923. These product ions may then be delivered by the gas flow
channel
1914 through the outlet 1934 to an analyzer or discarded. Any remaining
neutral
molecules may be delivered through the outlet 1932 to an analyzer for
analysis.
_88_
CA 02551991 2006-07-05
WO 2005/067582 PCT/US2005/001867
Because the ionization process is dynamic and time dependent, the residence
time
for a sample matrix S within the proximity of an ionization source may be
adjusted to
form particular types of product ions. Thus, the interaction time between an
ionization
source and a sample matrix S may also be controlled to selectively remove
certain
product ion species. For example, with regard to the NOx ion species, the N03-
ion
species may be formed by direct photo-ionization using a UV ionization source
according to the equations listed in Table 3.
Fig. 59B is a conceptual diagram of a sample pre-separation system 1936 having
two flow channels wherein multiple ion separations are enabled by multiple
ionization
sources including a plasma ionization source 1950 according to an illustrative
embodiment of the invention. The sample pre-separation system 1936 includes an
inlet
1942, gas flow channel 1938, inlet 1944, gas flow channel 1940, W ionization
source
1946, Ni63 ionization source 1948, plasma ionization source 1950, first
opening 1952,
second opening 1954, third opening 1956, outlet 1958, and outlet 1960.
In operation, a sample matrix S is introduced into gas flow channel 1938
through
inlet 1942. The UV ionization source 1946 then iouzes the sample S matrix at a
relatively low energy. Due to competitive ionization, the compound molecules
of
sample S having the lowest ionization energies and highest affinities, e.g.,
ionization
energies at about or below the UV ionization energy level, are ionized to form
product
ions. These product ions are then deflected from gas flow channel 1938 and/or
attracted
into gas flow channel 1940 through the first opening 1952 by the electrode
1951. These
low energy product ions may then be delivered by the gas flow channel 1940
through the
outlet 1960 to an analyzer or discarded. The inlet 1944 accepts gas flow into
gas flow
channel 1940 to enable the flow of product ions delivered from the gas flow
channel
1938.
After ionization occurs with respect to the UV ionization source 1946, the non-
ionized or neutral molecules remaining in the gas flow channel 1938 proceed to
the Ni63
ionization source 1948. Due to the competitive ionization process, the
remaining
molecules of the sample matrix S with the highest affinities are ionized to
form product
ions. These product ions are then deflected from the gas flow channel 1938
and/or
attracted into gas flow channel 1940 through the second opening 1954 by the
electrode
-89-
CA 02551991 2006-07-05
WO 2005/067582 PCT/US2005/001867
1953. These product ions may then be delivered by the gas flow channel 1940
through
the outlet 1960 to an analyzer or discarded.
After ionization occurs with respect to the Ni63 ionization source 1948, the
non-
ionized or neutral molecules remaining in the gas flow channel 1938 proceed to
the
plasma ionization source 1950. Due to the competitive ionization process, the
remaining
molecules of the sample matrix S with the highest affinities are ionized to
form product
ions. These product ions are then deflected from gas flow channel 1938 andlor
attracted
into gas flow channel 1940 through the third opening 1956 by the electrode
1955. These
product ions may then be delivered by gas flow channel 1940 through outlet
1960 to an
analyzer or discarded. Any remaining neutral molecules may be delivered
through the
outlet 1958 to an analyzer for analysis.
Fig. 60 is a graph 1962 of ionization energies required for various NOx ion
species to form either positive or negative ions by direct photo-ionization in
air. The
NOx species NO and N02 have relatively high affinities as reflected by their
DMS and
mass spectra which are shown in Figs. 61A, 61B, and 61C. Fig. 61A is a graph
1964 of
relative intensity versus mass units showing the mass-spectra to positive NOx
ian NO.
Fig. 61B is a graph 1966 of relative ion intensity versus mass units showing
the mass-
spectra for positive NOx ion NO2. Fig. 61 C is a graph 1968 of ion intensity
versus field
compensation voltage showing the ion intensity peaks 1970 and 1972 for NO and
N02
respectively.
Fig. 62 is a conceptual diagram of a cylindrical sample pre-separation system
1974 including an integrated cylindrical DMS 1976 or other analyzer according
to an
illustrative embodiment of the invention. The sample pre-separation system
1974
includes an inlet 1978, gas flow channel 1980, Ni63 ionization source 1982,
ionization
region 1984, ionization region 1986, outlet 1988, and deflector outlets 1990,
1992, 1994,
1996, 1998, and 2000. The system 1974 also includes a deflector 2002,
deflector 2004,
voltage source 2006, voltage source 2008, insulator 2010, insulator 2012, and
surrounding space 2014.
In operation, a sample matrix S is drawn into the gas flow channel andlor path
1980 and ionized by the Ni63 ionization source. Due to competitive ionization,
certain
compounds within the sample matrix S within the highest affinities are ionized
into
product ions. These product ions are then deflected from the gas flow channel
1980 into
-90-
CA 02551991 2006-07-05
WO 2005/067582 PCT/US2005/001867
the surrounding space 2014 through deflector outlets 1990 and 1992. The
deflector 2002
resides within the center of the coaxial gas flow channel 1980 and holds an
electric
potential or voltage generated by the voltage source 2006. The deflector 2002
potential
is high enough to create an electric field of sufficient strength to propel
the product ions
from the gas flow channel 1980 into the surrounding space 2014. The
surrounding space
2014 may be an enclosed, substantially enclosed, or unenclosed path and/or
channel.
The surrounding space 2014 may be a second gas flow channel surrounding the
system
1974 that directs product ions propelled from the gas flow channel 1980 to an
analyzer or
other system for further analysis.
The remaining neutral molecules of the sample matrix S then travel to the
ionization region 1984. Due to competitive ionization, certain compound
molecules
within the remaining sample matrix S with the highest affinities are ionized
into a new
group of product ions. These product ions are then deflected from the gas flow
channel
1980 into the surrounding space 2014 through deflector outlets 1994 and 1996.
The
deflector 2002 potential is high enough to create an electric field of
sufficient strength to
propel the product ions from the gas flow channel 1980 into the surrounding
space 2014.
The remaining neutral molecules of the sample matrix S then travel to the
ionization region 1986. Due to competitive ionization, certain compound
molecules
within the remaining sample matrix S with the highest affinities are ionized
into a third
group of product ions. These product ions are then deflected from the gas flow
channel
1980 into the surrounding space 2014 through deflector outlets 1998 and 2000.
The
deflector 2004 resides within the center of the coaxial gas flow channel 1980
and holds
an electric potential or voltage generated by the voltage source 2008. The
deflector 2004
potential is high enough to.create an electric field of sufficient strength to
propel the
product ions from the gas flow channel 1980 into the surrounding space 2014.
An
insulator 2010 provides electrical separation and enables an electrical
potential difference
between deflector 2002 and deflector 2004.
The remaining molecules of the sample matrix S, which preferably include the
compound of interest for detection, are then delivered to the coaxial DMS
system 1976
for analysis. The insulator 2012 provides electrical separation between the
deflector
2004 and the DMS ion filter electrode 2016. The ionization regions 1984 and
1986 may
use any one of the previously described ionization sources to ionize the
sample matrix S.
-91 -
CA 02551991 2006-07-05
WO 2005/067582 PCT/US2005/001867
In certain illustrative embodiments, a variable and/or adjustable ionization
energy
source may be empl~yed by the forgoing pre-separation systems. For example, a
tunable
laser may be used as an adjustable ionization source. A sample may then be
repeatedly
exposed to the laser ionization source while the energy level of the laser is
changed for
each ionization. By adjusting the laser energy level and the resulting
ionization energy,
different molecules of a sample are ionized and separated from the sample
matrix. The
wavelength or frequency of a laser may be adjusted to enable the selective
removal of
molecules from a sample.
In certain illustrative embodiments, the sample matrix environmental
conditions
may be altered at various stages during the ionization and separation process.
For
example, the level of moisture may be set at one level during the ionization
process and
then adjusted to another level during the extraction or removal process. By
altering the
environmental conditions such as the moisture level at different stages of the
ionization
and separation process the extraction of particular ions from a sample may be
improved.
In other illustrative embodiments, dopants may be intermixed with a sample in
the mixing region of a pre-separation system to improve and/or control the
charge
transfer to sample molecules from reactant ions. Different dopants may be
added to a
sample at different times and/or at various stages of the ionization and
separation
process. The dopants may be added before, during, or after selected analytes
or product
ions are removed from a sample matrix. For example, an inkjet like printer
head may be
loaded with various types of dopants. The head may deploy one or more dopants
using
inj ection pulses at various times and/or stages of an ionization and
separation process.
Fig. 63 is a conceptual block diagram of a sample pre-separation system 2018
capable of mixing dopants with a sample matrix S in a controlled manner before
or after
reactant ions are added according to an illustrative embodiment of the
invention. The
sample pre-separation system 2018 includes the inlet 2020, gas flow channel
2022,
dopant sources 2024, ionization region 2026, ion deflector/reflector 2028, and
pumps
2030.
In operation, a sample matrix S is drawn through inlet 2020 into the gas flow
channel 2022. The dopant sources 2024 may include various types of dopants.
Any one
of the dopants or a combination of dopants may be added to the sample matrix S
in the
gas flow channel 2002. Each dopant source 2024 may include an injection
mechanism to
-92-
CA 02551991 2006-07-05
WO 2005/067582 PCT/US2005/001867
inject or pulse controlled amounts of dopant into the gas flow channel 2002.
When the
sample matrix S and dopant mixture enter the ionization region, certain types
of
compound molecules of the sample matrix S are ioi>ized due to competitive
ionization.
Upon leaving the ionization region 2026, the ionized molecules or product ion
are
deflected by the deflector/reflector 2028 through outlet 2032 to either an
analyzer or an
exhaust. The pumps 2030 re-circulate the remaining neutral molecules through
the gas
flow channel 2022. The dopant sources 2024 may again inject dopants into the
gas flow
channel 2022 to enable mixing of selected dopants with the remaining neutral
molecules
of the sample matrix S. This process may be repeated while the sample matrix S
is re-
circulated through the pre-separation system 2018 until a selected compound or
group of
compounds are extracted from the sample matrix S.
In one illustrative embodiment of the invention, a device and/or system may be
employed that uses multiple flow paths to combine various combinations of ions
to
control the formation and delivery of a particular type of reactant ion
species to a pre-
separation system. By controlling the type of reactant ion species introduced
into an
ionization and mixing region, the type of compound of a sample that is ionized
may be
controlled. For example, logic circuits may arranged from an array of DMS,
IMS, MS,
and the like filters to control the flow and combination of various ion
species into a pre-
separation system.
Fig. 64 is a conceptual diagram of an array of logic circuits 2034 including
an
"or" flow circuit 2036 and an "and" flow circuit 2038 used to form a desired
reactant ion
species according to an illustrative embodiment of the invention. The "or"
flow circuit
includes the sample inlet 2040, sample inlet 2042, carrier gas inlet 2044,
flow channel
2050, flow channel 2052, flow channel 2054, opening 2046, opening 2048, and
outlet
2056. The "and" flow circuit includes the sample inlet 2058, sample inlet
2060, Garner
gas inlet 2062, flow channel 2068, flow channel 2070, flow channel 2072,
opening 2064,
opening 2066, and outlet 2074.
In operation with regard to the "or" circuit 2036, a sample A is drawn into
the
flow channel 2050 through inlet 2040 while a sample B is drawn into the flow
channel
2052 through inlet 2042. Either the sample A or the sample B, but not both
sample A
and B is deflected from the flow channels 2050 or 2052 into the center channel
2054.
Other means such as a microvalve or electromechanical switch may be employed
to
- 93 -
CA 02551991 2006-07-05
WO 2005/067582 PCT/US2005/001867
control the flow of ions from either channel 2050 or 2052 into the center flow
channel
2054. The deflected sample A or B is then delivered through the outlet 2056 to
a target
such as the ionization or mixing region of a pre-separation system. .
In operation with regard to the "and" circuit 2038, a sample C is drawn into
the
flow cha~niel 2068 through inlet 2058 while a sample D is drawn into the flow
channel
2070 through inlet 2060. In this case both the sample C and D are deflected
from the
flow channels 2068 or 2070 into the center channel 2072. The deflected samples
C and
D are then delivered through the outlet 2074 to a target such as the
ionization or mixing
region of a pre-separation system.
The logic circuit 2034 may deliver multiple combinations of sample reactant
ions
such as the sample combinations A only, B only, ACD, and BCD. Other
combinations
of reactant ions may be enabled dependent on the configuration of the logic
circuit 2034
array. For instance, logic circuit may be arranged in parallel, in series, or
in a
combination of series and parallel in order to achieve a desired mixture.
Although only
two circuits are shown in Fig. 64, the number and types of circuits may be
increased to
facilitate the delivery of nmnerous combinations of reactant ions to a target.
In certain illustrative embodiments, arrays of analyzers may be employed for
detecting and characterizing various compounds within a sample matrix.
Fig. 65 is a conceptual diagram of a sample pre-separation and analysis system
2076 using multiple ionization zones and multiple analyzers to analyze various
ions of a
sample matrix according to an illustrative embodiment of the invention. The
pre-
separation and analysis system 2076 includes sample inlet 2078, gas flow
channel 2080,
ionization region 2082, ionization region 2084, ionization region 2086,
analyzer 2088,
analyzer 2090, analyzer 2092, and outlet 2094.
In operation, a sample matrix S is drawn into the gas flow channel 2080
through
inlet 2078 a~.id then ionized in ionization region 2082. Due to competitive
ionization,
certain compound molecules are ionized into product ions that are then
extracted from
gas flow channel 2080 using any of the various techniques described
previously. The
extracted ions are then analyzed by an analyzer 2088 such as a DMS, IMS, MS
and like
system.
The remaining neutral molecules of sample matrix S are then ionized in
ionization region 2084. Again, the product ions are extracted and analyzed by
an
-94-
CA 02551991 2006-07-05
WO 2005/067582 PCT/US2005/001867
analyzer 2090. The remaining neutral molecules of sample matrix S are then
ionized in
ionization region 2086. The product ions are extracted and analyzed by an
analyzer
2092. Any remaining neutral molecules exit the gas flow channel 2080 through
outlet
2094. An additional analyzer may be employed at the outlet 2094 for further
analysis of
the sample matrix S. The number of analyzers and ionization regions may be
varied
depending on the number of product ions to be analyzed.
Fig. 66 is a conceptual diagram of a sample pre-separation and analysis system
2096 using multiple ionization zones and DMS analyzers, including a DMS
analyzer
2116 with an arbitrarily curved drift tube and ion filter region 2122,
according to an
illustrative embodiment of the invention. The pre-separation and analysis
system 2096
includes sample inlet 2098, gas flow channel 2100, ionization region 2102,
ionization
region 2104, ionization region 2106, DMS analyzer 2116 with a curved drift
tube and ion
filter region 2122, analyzer 2118, analyzer 2120, deflector 2110, deflector
2112,
deflector 2114, and outlet 2124.
In operation, a sample matrix S is drawn into the gas flow channel 2100
through
inlet 2098 and then ionized in ionization region 2102. Due to competitive
ionization,
certain compound molecules are ionized into product ions that are then
deflected from
gas flow chamlel 2100 by deflector 2110 into DMS analyzer 2116. The extracted
ions
are then analyzed by the DMS analyzer 2116. The DMS analyzer 2116 may include
a
arbitrarily curved drift tube and ion filter 2122 so that the electric field
in the DMS is
non-uniform.
A portion of the remaining neutral molecules of sample matrix S are then
ionized
in ionization region 2104. The product ions are deflected by deflector 2112
from the gas
flow channel 2100 into the analyzer 2118 and analyzed. The remaining neutral
molecules of sample matrix S are then ionized in ionization region 2108. The
product
ions axe deflected by deflector 2114 into the analyzer 2120 and analyzed. Any
remaining
neutral molecules exit the gas flow channel 2100 through the outlet 2124. An
additional
analyzer may be employed at the outlet 2124 for further analysis of the sample
matrix S.
The number of analyzers and ionization regions may be varied depending on the
number
of product ions to be analyzed. Also, the spacing between the ionization
regions and
analyzers may not be uniform. Furthermore, while not shown in Figs. 65 and 66,
multiple flow channels, each with one or more analyzers, may be arranged in
parallel. In
- 95 -
CA 02551991 2006-07-05
WO 2005/067582 PCT/US2005/001867
yet a further configuration, multiple analyzers may be employed in series or
parallel after
each ionization region to enhance sample asialysis.
Fig. 67 is a conceptual diagram of a sample pre-separation and analysis system
2126 employing multiple ionization zones and analyzers along with a filtered
gas source
to control pressure within the analyzers according to an illustrative
embodiment of the
invention. The pre-separation and analysis system 2126 includes a sample inlet
2128,
gas flow channel 2130, iouzation region 2132, ionization region 2134,
ionization region
2136, analyzer 2138, analyzer 2140, analyzer 2142, analyzer flow channel 2139,
analyzer flow channel 2141, analyzer flow channel 2143, pressure channel 2144,
pressure channel 2146, pressure channel 2148, deflector 2150, deflector 2152,
deflector
2154, ion attractors 2156, exit port 2155, exit port 2157, exit port 2159, ion
attractors
2158, ion attractor 2160, outlet 2162, and gas flow channel 2164.
In operation, a sample matrix S is drawn into the gas flow channel 2130
through
inlet 2128 and then ionized in ionization region 2132. Due to competitive
ionization,
certain compound molecules are ionized into a group of product ions that are
then
deflected from gas flow channel 2130 by deflector 2150 and attracted by ion
attractors
2156 through exit port and/or opening 2155 into the analyzer 2138. The gas
flow
channel 2164 provides filtered andlor treated gas to the analyzer 2138 through
pressure
channel 2144 to establish a relatively higher pressure within the analyzer
2138. The
relatively higher and/or positive pressure within the analyzer 2138 and
analyzer flow
channel 2139 limits the entry of neutral molecules into the analyzer 2138. The
extracted
product ions are then analyzed by the analyzer 2138.
The remaining neutral molecules of sample matrix S are then ionized in
ionization region 2134. The product ions axe deflected by deflector 2152 and
attracted
by ion attractors 2158 from the gas flow channel 2130 through exit port 2157
into the
analyzer 2140 and analyzed. The gas flow channel 2164 provides filtered and/or
treated
gas to the analyzer 2140 through pressure channel 2146 to establish a
relatively higher
pressure within the analyzer 2140. The relatively higher and/or positive
pressure within
the analyzer 2140 and analyzer flow channel 2141 inhibits andlor limits the
entry of
neutral molecules from gas flow channel 2130 into the analyzer 2140.
The remaining neutral molecules of sample matrix S are then ionized in
ionization region 2136. The product ions are deflected by deflector 2154 and
attracted
-96-
CA 02551991 2006-07-05
WO 2005/067582 PCT/US2005/001867
by ion attractors 2160 through exit port 2159 into the analyzer 2142 and
analyzed. The
gas flow channel 2164 provides filtered and/or treated gas to the analyzer
2142 through
pressure channel 2148 to establish a relatively higher pressure within the
analyzer 2142.
The relatively higher and/or relatively positive pressure within the analyzer
2142 and
analyzer flow channel 2143 inhibits andlor limits the entry of neutral
molecules from the
gas flow channel 2130 into the analyzer 2142.
Any remaining group of neutral molecules exit the gas flow channel 2130
through the outlet 2162. An additional analyzer may be employed at the outlet
2164 for
further analysis of the sample matrix S. The number of analyzers and
ionization regions
may be varied depending on the number of product ions to be analyzed.
Furthermore,
the spacing between the ionization regions and analyzers may be non-uniform.
Fig. 68 is a flow diagram of a process showing the analysis of a sample matrix
including re-circulation of the sample according to an illustrative embodiment
of the
invention. First, a sample matrix, is mixed with reactant ions (Step 2166).
Then, the
reaction conditions are controlled to optimize the transfer of charge and ion
species
formation (Step 2168). Once the sample matrix is ionized to form product ions,
the
product ions are separated from the sample matrix (Step 2170). If desired, the
separated
product ions may be analyzed (Step 2172). Next, it is determined whether all
desired ion
species of the sample matrix have been removed (Step 2174). If all of the
desired or
selected ion species have been removed, the remaining neutral molecules of the
sample
matrix may be analyzed (Step 2178). If all of the desired ion species have not
been
removed, the remaining neutral molecules of the sample matrix are mixed with
the
reactant ions and the process is repeated (Step 2176).
Fig. 69 is a flow diagram of a process showing the analysis of a sample matrix
composed of multiple molecule species according to an illustrative embodiment
of the
invention. First, the reactant ions are produced (Step 2180). Then, a sample
matrix is
mixed with the reactant ions (Step 2182). The reaction conditions are
controlled to
optimize the transfer of charge and permit target ion species formation (Step
2184).
Once ionized, the product or target ions are separated from the sample matrix
(Step
2186). If desired, the separated product ions may be analyzed (Step 2190).
Then, the
remaining neutral molecules of the sample matrix are mixed with the reactant
ions
(2192). Next, it is determined whether all desired ion species of the sample
matrix have
-97-
CA 02551991 2006-07-05
WO 2005/067582 PCT/US2005/001867
been removed (Step 2194). If all of the desired or selected ion species have
been
removed, the remaining neutral molecules of the sample matrix may be analyzed
(Step
2196). If not all of the desired ion species have been removed, the process is
repeated.
Fig. 70 is a conceptual diagram of a sample pre-separation (neutrals removal)
system 2167 where the neutral molecules are removed from the ionized molecules
rather
than removing the ions from the neutral gas stream as described previously.
The sample
pre-separation system 2167 includes sample inlet 2169, clean gas inlet 2171,
clean
makeup gas inlet 2173, clean makeup gas inlet 2175, optional ionization source
2177,
gas flow channel 2179, electrodes 2181, flow permitting medium 2183, neutral
removal
region 2185, analyzer 2187, and neutrals flow outlet 2189.
In operation, a sample matrix S is drawn into the pre-separation device
through
sample inlet 2169 and ionized by reactant ions. The ions are transported by an
electric
field, generated by electrodes 2181, towards an analyzer 2187 while sample S
neutrals
are drawn away from the sample ions through a "flow permitting" medium 2183.
The
flow permitting medium 2183 may include a porous material or a region with
small
openings and/or holes to allow the neutrals to pass from the gas flow channel
2179
through the neutrals flow outlet 2189. The sample S neutrals may then be
removed from
the sample S ions in the neutral removal region 2185 using a vacuum pump that
creates a
vacuum in the neutral removal region 2185. The vacuum draws the neutrals out
of the
gas flow channel 2179, e.g., a transport tube, while the ions are moved
towards the
analyzer 2187 by the electric fields of the electrodes 2181.
The ions may move in direction 2191 counter to a clean gas flow-makeup stream
which is free of sample neutrals. A gas flow-makeup stream may originate from
a clean
makeup gas inlet 2173 and/or clean makeup gas inlet 2175. The sample pre-
separation
system 2167 may use discrete electrodes 2181, or resistive ink or semi-
conducting
coatings with suitable voltages and currents applied to induce the desired
electric fields.
The gas flow channel 2179 may be enclosed substantially by a substantially
circular
andlor rectangular housing. With a substantially circular housing, the
electrodes 2181
may be circular rings along the gas flow channel 2179. With a substantially
rectangular
housing, the electrodes 2181 may reside on opposing facing planar surfaces
with the gas
flow channel 2179 in between. The sample pre-separation system 2167 may be
planar in
form.
-98-
CA 02551991 2006-07-05
WO 2005/067582 PCT/US2005/001867
The sample pre-separation (neutrals removal) system 2167 may interface with a
DMS or IMS or MS or the like. In the illustrative embodiment of Fig. 70, the
sample S
may be mixed with reactant ions that are optionally introduced at inlet 2171
and ionized
by ionization source 2177. The mixture is transported into the separation
region 2185
where product ions and some reactant ions are separated from the sample
neutrals and
transported to an analyzer 2187. Alternatively, pre-ionized sample S molecules
may be
introduced into the gas flow channel 2179 at inlet 2169. The separation, or
neutral
removal, region 2185 may then use a clean gas flow in the direction 2193,
which is
transverse to the ion flow, to draw the neutral sample S molecules away from
the ions in
the gas flow channel 2179. The remaining sample S molecules are then delivered
to the
analyzer 2187 for analysis.
Fig. 71 is a conceptual diagram of a sample pre-separation system 2198
employing an ionization region 2200, ionization source inlet 2202, analyzer
flow channel
2221, DMS ion filter 2204, deflector 2206, ion attractors 2208, exhaust
opening 2210,
neutral molecules 2212, pump 2214, and valve 2216 to selectively filter ion
species for
analysis according to an illustrative embodiment of the invention. In
operation, a sample
matrix S is drawn through valve 2216 when the valve 2216 is positioned to
accept the
sample matrix S. The valve 2216 may alternatively be positioned to only allow
neutral
molecules 2212 to re-circulate to the DMS inlet 2218 and ionization region
2200. An
ionization inlet 2202 may be employed to enable the introduction of reactant
ions. The
reactant ions may then mix with the sample matrix S and ionize selected
compound
molecules.
The DMS ion filter 2204 and an optional detector electrode 2220 may remain
inactive until a sufficient amount of pre-separation iterations are performed
to remove
unwanted ion species from the sample matrix S. Once the sample matrix S is
ionized,
the deflector 2206 and ion attractors 2208 propel the product ions from the
analyzer flow
channel 2221 through the opening 2210. These product ions may be further
analyzed or
discarded.
The remaining neutral molecules 2212 of the sample matrix are then propelled
by
the pump 2214 through the valve 2216 baclc to the DMS inlet 2218. The
remaining
neutral molecules 2212 may be re-circulated until a desired type of compound
remains.
Then, the DMS filter 2204 and detector 2220 may be activated to analyze the
remaining
-99-
CA 02551991 2006-07-05
WO 2005/067582 PCT/US2005/001867
compound of the sample matrix S. Alternatively, the deflector 2206 and/or ion
attractors
2208 may function as detector during the DMS analysis.
Fig. 72 is a conceptual diagram of a sample pre-separation system 2222
employing an ionization region 2224, ion guiding region 2226, DMS ion filter
2228,
positive electrodes 2230, negative electrodes 2232, optional analyzers 2234,
flow
generator 2242, selective concentrator 2244 and valve 2248 for ion species
analysis
according to an illustrative embodiment of the invention. The pre-separation
system
2222 also includes DMS inlet 2250, DMS flow channel 2240, DMS outlet 2252,
flow
generator 2242, opening 2236, and opening 2238.
In operation, a sample matrix S is drawn through the valve 2248 and the DMS
inlet 2250 into the ionization region 2224. The sample matrix S is then
ionized using
one of the various ionization techniques previously described. Due to
competitive
ionization, certain compound molecules are ionized into product ions. The ion
guiding
region 2226 then concentrates the ions to the center of the DMS flow channel
2240. The
DMS ion filter 2228 may be activated at certain times to perform ion
filtering. Then, the
product ions are deflected from the DMS flow channel 2240 by either positive
electrodes
2230 or negative electrodes 2232. The positive electrodes 2230 act
simultaneous as an
attractor for negative product ions and as a deflector for positive product
ions. Also, the
negative electrodes 2232 act simultaneous as an attractor for positive product
ions and as
a deflector for negative product ions. Thus, both positive and negative
product ions may
be removed from the DMS flow channel 2240 simultaneously or at about the same
time.
The remaining neutral molecules of the sample matrix S pass through the DMS
outlet 2252 to the flow generator 2242. The flow generator 2242 establishes
gas flow in
the DMS flow channel 2240 from the DMS inlet 2250 toward the DMS outlet 2252.
The
flow generator 2242 may be a solid-state or electromechanical pump or the
like. The
flow generator 2242 then propels the neutral molecules through the selective
concentrator 2244 which further concentrate the sample matrix S by removing
unwanted
compounds. The concentrator controller 2246 may regulate the conditions within
the
concentrator to enable sample matrix S concentration.
The remaining concentrated and neutral molecules of the sample matrix S then
pass through the valve 2248 and return to the DMS inlet 2250 for further pre-
separation
if necessary. The valve 2248 may be positioned to allow an external sample
matrix S to
- 100 -
CA 02551991 2006-07-05
WO 2005/067582 PCT/US2005/001867
be collected, positioned to re-circulate only the neutral molecules, or
positioned to allow
both the external sample matrix S intake and re-circulation of the neutral
molecules.
The previous pre-separation systems may be improved by use of molecular
sieves, membranes, and the like, such as those described supra. For example, a
membrane may be employed at various openings to maintain the pressure and re-
circulated gas flow in a pre-separation system while allowing product ions to
be
removed. Also spectral changes may be monitored during the pre-separation
process to
provide an indication when adequate cleaning of a gas sample reached or when a
particular compound may be sampled.
While current mobility based analyzers are sensitive, there is a need to
detect
concentrations in ranges lower than parts-per-trillion (ppt). For instance, a
very small
number of anthrax spores may cause significant health effects. However,
existing
analyzers may not be sensitive enough to detect the charge generated by such a
small
number of spores. One technique for overcoming this limitation is
concentrating and/or
amplifying the number of molecules of a sample, in time, to enable an analyzer
to
produce a larger signal for detection.
In certain embodiments of the invention, chemical amplification is employed to
enable the detection of extremely low levels (e.g., concentrations of less
than a few ppt)
of analytes in a sample. The sample may be a fluid such as a vapor or liquid.
By
allowing selected molecules to circulate multiple times in an analyzer system,
the
concentration of an analyte may be increased to a detectable level.
Fig. 73A is a conceptual diagram of a sample amplification system 2254
employing a DMS filter 2256, detector and neutralizer 2258, transport gas
input 2260
and re-circulation loop 2262 for selected ion species analysis according to an
illustrative
embodiment of the invention. In operation, a sample S is drawn into the DMS
filter
2256 which filters out and exhausts unwanted ion species. The selected ion
species are
delivered to the detector and neutralizer 2258, which detects and neutralizes
the selected
ion species during the detection process. A transport effluent (e.g., a gas,
liquid or
vapor) input 2260 provides transport effluent (in the example a transport gas)
to flow the
neutralized ion species through the re-circulation loop 2262. Upon return to
the DMS
filter 2256, the neutralized ion species are mixed with more sample S
molecules and then
filtered by the DMS rilter 2256. The sample amplification process is repeated
for a
-101-
CA 02551991 2006-07-05
WO 2005/067582 PCT/US2005/001867
period of time until enough of the selected ion species are filtered by the
DMS filter
2256 for the detector and neutralizer 2258 to detect the ion species of
interest.
Fig. 73B is a conceptual diagram of a sample amplification system 2264
employing a DMS filter 2266, detector 2268, ionization source 2270, deflector
2272, an
attractor grid 2274, DMS flow channel 2276, re-circulation channel 2278, inlet
2280,
exhaust 2282, and an optional DMS 2284 for analysis of selected ion species
according
to an illustrative embodiment of the invention.
In operation, a sample S is drawn into the DMS flow channel 2276 through the
inlet 2280. The DMS filter 2266 filters out unwanted ion species while the
detector
electrodes 2268 detect the ion species of interest. Because the detected ions
may be
neutralized during detection, the ionization source 2270 then ionizes the
sample S,
including the neutralized ions. After ionization, the deflector 2272 propels
the product
ions through the attractor grid 2274 into the re-circulation channel 2278. The
unwanted
and filtered compounds are exhausted from the DMS flow channel 2276 through
exhaust
2282.
The product ions may optionally be analyzed by analyzer 2284 before being
circulated through re-circulation channel 2278 to inlet 2280 for mixing with
more sample
S molecules. Then, the mixture is circulated through the sample amplification
system
2264 for another stage of filtering and detection. At the completion of each
iteration of
filtering and detection, the concentration of the target or desired ion
species increases
until the detector electrodes 2268 are able to detect the target species of
interest.
Fig. 74 is a conceptual diagram of a sample amplification and analysis system
2286 employing a re-circulation channel according to an illustrative
embodiment of the
invention. The sample amplification and analysis system 2286 includes a inlet
2288,
ionization region 2290, ionization source inlet 2292, DMS filter region 2294,
deflection
plate 2296, guiding electrodes 2298, detector and neutralizer electrode 2300,
exhaust
2302, opening 2304, transport gas inlet 2306, re-circulation channel 2308, and
DMS
flow channel 2310.
In operation, a sample S is drawn into the DMS flow channel 2294 through the
inlet 2288. The sample S is ionized in the ionization region 2290. The
ionization source
inlet 2292 enables the injection of reactant ions into the ionization region
2290.
Alternatively, an ionization source may reside within the ionization regions
such as a
- 102 -
CA 02551991 2006-07-05
WO 2005/067582 PCT/US2005/001867
plasma generator, LJV source, or radioactive source. Once iouzed, the sample
is filtered
in the DMS filter region 2294 to allow only a desired or selected ion species
to reach the
deflector 2296. The unwanted, filtered, and neutralized ion species travel
through the
DMS flow channel 2310 and axe discarded through the exhaust 2302.
The selected ion species, however, are deflected by the deflector 2296 through
the opening 2304 into the re-circulation channel 2308. The guiding electrodes
2298
guide the selected ion species through the opening 2304 acid toward the
detector and
neutralizer electrode 2300. Once the selected ion species are detected and
neutralized by
electrode 2300, transport gas from transport gas inlet 2306 propels the
neutralized ions
through the re-circulation channel 2308 toward the ionization region 2292. In
the
ionization region 2292, the neutralized ions are mixed with new sample
molecules and
ionized. The new mixture is then circulated through the amplification and
analysis
system 2286 and so on over a period of time until the concentration of the
selected ion
species reaches level that can be detected.
Fig. 75 is a flow diagram of a process of amplification of a selected ion
species
using an analyzer such as a DMS. First, a sample is collected and introduced
(Step
2312). The sample is then passed through a DMS filter (Step 2314). The DMS
filter
may be controlled for designated time period to allow only a desired ion
species to pass
through the filter region without being neutralized (Step 2316). The compounds
that are
neutralized and/or not ionized are ejected from the DMS filter and analyzer
(Step 2318).
Next, the remaining filtered ions are collected and neutralized (Step 2320).
The
neutralized ions are then mixed with additional sample molecules andlor a
transport gas
(Step 2322). The mixture is passed through the DMS filter for second stage of
analysis
(Step 2324). The process is repeated until a sufficient concentration of the
desired ion
species or compound is present for detection and analysis (Step 2326).
Sample analysis may also be enhanced by combining DMS techniques with
sample detection using another type of device such as IMS, TOF IMS, FT 1MS,
MS,
electrochemical detector, or the like. In one illustrative embodiment of the
invention,
DMS detection is combined with IMS detection to enhance sample identification.
IMS technology uses the coefficient of mobility (K) to identify chemical
constituents of a sample by measuring the different values of mobility
associated with
-103-
CA 02551991 2006-07-05
WO 2005/067582 PCT/US2005/001867
different sample constituent ion species. The coefficient of mobility depends
on the
mass (,u) and cross section of an ion (S~ ) as described in Equation 15:
_ 3e 2~c 1
K 16N ,ukTe~ 1z ~1.'~Teff) (15)
The coefficient of mobility also depends on the electric field strength, the
coefficient of
mobility at low field conditions (K(0)), and the alpha parameter (a). The
dependence is
expressed in Equation 16:
K=K(0)~1+az(ElN)z+txa(ElN)4+....~=K(0)[1+a(ElN)] (16)
The coefficient of mobility K may alternatively be expressed as:
K(E) = K(0) [ 1-a(E)] .
Because a conventional TOF IMS operates at low field conditions, a TOF IMS
may be employed to plot and determine the K(0) of a particular ion species. As
described in further detail previously, because a DMS alternately operates at
high and
low field conditions, a DMS may be employed to plot and determine the alpha
parameter
a(E) of a particular ion species. Thus, by using a DMS in combination with a
TOF IMS,
the coefficient of mobility K(E) for a particular ion species may be plotted
over a range
of electric field strengths and, thereby, provide enhanced ion species
identification based
on the derived coefficient of mobility over a range of field strengths.
Also, by detecting a select ion species using multiple detection techniques,
improved analysis may be achieved where one detection technique, e.g., DMS,
provides
better ion species differentiation and identification than another detection
technique, e.g.,
TOF IMS, and visa versa.
Fig. 76 is a graph 2328 of ion intensity versus drift time in a conventional
IMS
for ions of benzene, acetone, and toluene respectively. In this instance, the
ion intensity
peaks for benzene, acetone, and toluene substantially overlap, inhibiting the
IMS
detector from distinguishing between the three possible compounds. Thus, an
alternative
detection technique, such as DMS detection, may be employed to provide
improved ion
species differentiation.
- 104 -
CA 02551991 2006-07-05
WO 2005/067582 PCT/US2005/001867
Fig. 77 is a graph 2330 of ion intensity versus field compensation voltage in
a
DMS for acetone, acetone and othoxylene, acetone and metaxyhene, acetone and
toluene,
and acetone and benzene respectively. The graph 2330 provides different
spectra plots
of ion intensity for acetone, acetone and benzene, and acetone and toluene
that, unlike
the graph 2328, enable the distinction between acetone, benzene, and toluene
ion species.
Thus, in this instance, the DMS detection graph 2330 enables the desired
distinction
between various ion species that was otherwise not possible based on the 1MS
graph
2328. There may be instances, however, where IMS detection in combination with
DMS detection enhances the distinction between ion species as opposed to
relying on
DMS detection alone.
Fig. 78 is a graph 2332 of ion intensity versus field compensation voltage in
a
DMS for ions of organo-phospates such as DEMP and DEEP respectively. The three
ion
peaks for DEMP occur at approximately the same field compensation voltages as
the ion
peaks for DEEP. While the DMS detection graph 2332 may adequately distinguish
between the ion intensity spectra for DEMP and DEEP, additional information
provided
by another analytical detection technique in combination with the DMS
analytical
detection technique may, in certain circumstances, enhance the identification
of one ion
species over the other species.
Fig. 79 is a graph 2334 of ion intensity versus drift time in a conventional
IMS
for DEMP and DEEP, respectively. The ion intensity peaks 2336 and 2338 for
DEMP
are shifted left with respect to the ion intensity peaks 2340 and 2342 for
DEEP, which
provides further distinction information between these organo-phosphate ion
species.
Thus, in this instance, the IMS detection graph 2334 enhances the distinction
between
the DEMP and DEEP ion species that was not as clearly distinguishable based on
the
DMS graph 2332 alone.
Fig. 80 is a graph 2344 of compensation voltage versus mass in a DMS, along
with drift time versus mass in an IMS. The graph 2344 illustrates the effect
of ion mass
on the type of detection method performed. As can be seen from the graph 2344,
DMS
detection provides better ion species differentiation for lighter ions while
IMS detection
provides better ion species differentiation for heavier ions. By performing
DMS and
IMS detection in combination, the detection of both lighter and heavier ions
may be
enhanced. Again, by performing both DMS and 1MS detection, the coefficient of
- 105 -
CA 02551991 2006-07-05
WO 2005/067582 PCT/US2005/001867
mobility of a particular ion species may be plotted to further enhance
chemical
identification within a sample.
Fig. 81A is a graph 2346 of the alpha parameter a(E) s~ersus electric field
strength
for two ion species with similar alpha parameters. Because the alpha
parameters of the
two ion species are approximately the same, DMS detection alone likely cannot
distinguish between them. However, even if the alpha parameters are
approximately the
same, K(0) may be different, resulting in a different K(E) for the two ion
species.
Fig. 81B is a graph 2348 of the coefficient of mobility K(E) versus electric
field
strength for two ion species having similar alpha parameters a(E) but
different low field
mobility parameters K(0). Interestingly, K(0) acts as an offset for the alpha
parameter,
shown in Fig. 81B by the upward shift of the K(E) plot 2350 for the first ion
species.
This shifting or offset is analogous to a direct current (DC) voltage offset
of an
Alternating Current (AC) in an electronic circuit. The graph 2348 shows that,
even when
alpha parameters are nearly identical, ion species may be distinguished by the
respective
K(E) due to differences in K(0). Again, by using a DMS to determine the alpha
parameter and an IMS to determine K(0), the K(E) may be plotted for enhanced
ion
species identification.
Fig. 82A is a graph 2352 of the alpha parameter a(E) versus electric field
strength
for two ion species with different alpha parameters. In this instance, DMS
detection
alone may be sufficient to identify the ion species. Fig. 82B is a graph 2354
of the
coefficient of mobility versus electric field strength for two ion species
with similar low
field mobility parameters K(0) but different alpha parameters a(E). Because
K(0) is
,approximately the same for both ion species, the offset of K(E) for both ion
species is
approximately the same. However, because the alpha parameters a(E) for both
ion
species are different, as shown in the graph 2354, the K(E) for both ion
species are
different and distinguishable.
If both parts of the coefficient of mobility, e.g., K(0) and a(E), are
different, then
any portion of the K(E) plot may be enough to distinguish one ion species from
another.
In certain embodiments of the invention, a detection system may perform both
DMS and
IMS detection to determine K(E) or selectively perform DMS or IMS detection
based on
the target ion species weight according to Fig. 80. It may further be possible
to combine
IMS detection with the previously described enhanced DMS detection techniques
such as
- 106 -
CA 02551991 2006-07-05
WO 2005/067582 PCT/US2005/001867
fragmentation, pre-separation, amplification, and dispersion plotting to even
further
enhance the detection of ion species within a sample.
The determination of the alpha parameter a(E) has been described previously
with regard to Equation 1. The low field coefficient of mobility K(0) may be
determined
directly by using a conventional TOF IMS. The K(0) is calculated by
determining the
drift time and peak position in the TMS ion intensity plot for certain DC
electric fields
levels applied to the drift region of the TOF IMS. The drift time enables the
determination of ion velocity which, in turn, reveals the low field
coefficient of mobility
K(0) based on the formula a = K * E.
Alternatively, K(0) may be determined by analyzing the frequency dependence of
detector current, for example, within a cylindrical detector. This is shown in
the work of
Puton, et al., Measuf°ement of Difference Ion Mobility Spectrum with
Simple Cylindrical
Detector, ISIMS 2003. By measuring the ion current vs. the RF frequency of the
modulated AC voltage applied to two cylindrical electrodes in the ionization
region of a
radioionization detector, the K(0) for positive and negative ions can be
determined. The
K(0) can be determined by computing the second derivative of the frequency
characteristic plot.
One deficiency with the Puton approach is that the ion current measurement is
an
average of all ions in a sample. Thus, it provides an average K(0) as opposed
to the K(0)
for a particular ion species.
According to one illustrative embodiment of the invention, this problem is
resolved by employing a DMS to filter and isolate a particular ion species of
interest
prior to plotting the ion current vs. frequency. The K(0) for the particular
ion species is
then determined by computing the second derivative of the frequency plot. This
approach supports the determination of K(0) for both positive and negative
ions of a
particular ion species, which may be concurrently or substantially
simultaneously filtered
by a DMS.
Fig. 83 is a conceptual diagram of a DMS - IMS detection system 2356 according
to an illustrative embodiment of the invention. The DMS - IMS detection system
2356
includes the DMS 2358 and IMS 2360. The DMS 2358 includes a sample S inlet
2362,
ionization region 2364, ionization source 2396, DMS filter region 2366, filter
electrodes
2368 and 2370, field compensation voltage source 2372, field voltage source
2374, DMS
- 107 -
CA 02551991 2006-07-05
WO 2005/067582 PCT/US2005/001867
flow channel 2398, detector electrodes 2376 and 2378, variable detector
voltage sources
2380 and 2382, and vents 2384 and 2386. The IMS 2360 includes a shutter 2388,
drift
region 2400, gradient electrodes 2390, optional shutter 2392, and collector
2394.
In operation, a sample S is drawn through the inlet 2362 into the ionization
region
2364 and then ionized by the ionization source 2396. The sample S is then
filtered in the
DMS filter region 2366 by applying a compensated high asymmetric RF field at
the filter
electrode 2370 while the filter electrode 2368 remains at a common or ground
potential.
The Vcomp is provided by the field compensation voltage source 2372 while Vrf
is
provided by the field voltage source 2374.
Depending on the selected field voltage and field compensation voltage applied
at
the electrode 2370, a selected portion of the ions of the sample S pass
through the DMS
filter region 2366 and are detected at the detector electrodes 2376 and 2378.
The sample
S ions may be transported through the DMS flow channel 2398 by a carrier gas,
electric
field gradient, and the like.
Once the filtered ions are detected at either or both detector electrodes 2376
and
2378, the neutrals may be re-ionized and delivered to the lMS 2360 for further
analysis.
As stated previously, the alpha parameter a(E) of the filtered ion species may
be
determined based on the detected ion intensity in the DMS 2358. Alternatively,
the
detector electrodes 2376 and 2378 may be turned off or driven with voltages by
the
variable detector voltage sources 2380 and 2382 to prevent DMS detection while
keeping the filtered ions within the DMS flow channel 2398 for delivery to the
TMS
2360.
Regardless of whether the filtered sample S ions are detected by the DMS 2358,
the filtered sample S ions are delivered from the DMS 2358 to the IMS 2360.
The vents
2384 and 2386 may be used to remove excess gas. Alternatively, the vents 2384
and
2386 may introduce reactant ions for re-ionization of the filtered and
detected ions that
were neutralized by the detector electrodes 2376 and 2378.
In the IMS 2360, the shutter 2388, depending on its polarity, forms packets of
the
filtered ions, either positive or negative, from the DMS 2358. The shutter
2388 may
include a shutter grid, one or more electrodes, and a like type of ion trap.
The shutter
2388 then injects or gates the filtered ion into the drift region 2400. The
filtered ions axe
then propelled through the drift region 2400 by a voltage gradient established
by the
- 108 -
CA 02551991 2006-07-05
WO 2005/067582 PCT/US2005/001867
gradient electrodes 2390. For positive ions, the voltage gradient created by
the gradient
electrodes 2390 becomes relatively more negative as the filtered ions move
toward the
collector 2394. For negative ions, the voltage gradient created by the
gradient electrodes
2390 becomes relatively more positive as the filtered ions move toward the
collector
2394. The time between the gating of the ions by the shutter 2388 and the
detection of
the ions at the collector 2394, e.g., the time of flight (TOF), may be used to
determine
the ion velocity and, subsequently, the low field coefficient K(0) of the
filtered ion
species. The gradient voltage within the IMS 2360 may be approximately 500
volts (V),
400 volts, 250 volts, 100 volts, 50 volts, or as required to flow the ions
across the drift
region 2400 to the collector 2394. Thus, the gradient field strength may be
approximately 10,000 V/cm, 8,000 V/cm, 5,000 V/cm, 2,000 V/cm, 1,000 V/cm, or
as
required to flow the ions across the drift region 2400 to the collector 2394.
The IMS 2360 may include an optional shutter grid 2392 for further filtering
ions
in the IMS 2360 by being gated at select times to allow certain ion species to
reach the
collector 2394. The optional shutter grid 2392 may act as the second gate when
and/or if
the IMS 2360 functions as a Fourier Transform IMS (FTIMS).
A FTIMS is an improved form of 1MS detection resulting in improved
sensitivity,
resolution, and processing time for sample detection and analysis. In a
conventional
IMS, ions are introduced into to drift region by pulsing open a gating grid
such as the
shutter grid 2388 of the IMS 2360. The shutter grid 2388 may be pulsed open
for
approximately less than 1% of the analysis time of the IMS. Thus, in a
conventional
IMS, more than 99% of the ions formed may be discarded and never reach the
collector,
e.g., collector 2394.
A FTIMS uses a two-gate desig~z and performs a Fourier transform of the
frequency domain ion mobility information, referred to as an interferogram, to
reconstruct the detected ion species spectra. The interferogram is generated
by the ions
that are pulsed into the IMS which then interact with the second synchronously
pulsed
exit gate. The ions that reach the second gate are delayed by the time-of
flight across the
IMS' drift region, e.g., drift region 2400. Thus, the stream of ions may be in
or out of
phase with the second gate, e.g., shutter 2392. An interference signal is
created that '
depends on the degree to which the second gate is open or closed. Ions with
velocities
that enable them to reach the second gate when the gate is open, e.g., at the
appropriate
- 109 -
CA 02551991 2006-07-05
WO 2005/067582 PCT/US2005/001867
frequency, provide maximal signal input. The gates are typically driven by a
square
wave. To identify a sample with multiple constituents having multiple ion
velocities, the
gates, e.g., input shutter gate 2388 and exit shutter gate 2392, may be pulsed
open using
a square wave having a continually increasing frequency from a few hertz up to
thousands of hertz.
A Fourier transformation of the interferogram enables the reconstruction of
ion
species spectra based on the relationship ion species velocity and the gating
frequency
applied the shutter grids 2388 and 2392. Unlike a conventional IMS that may
use an
entrance gate with a 1% duty cycle, the entrance gate, e.g., shutter 2388, for
an FTIMS
may operate with a 50% duty cycle which significantly increases the amount of
ions
introduced into the FT1MS and, thereby, significantly increases the
sensitivity of the
FT1MS analytical technique.
Instead of using an exit gate, e.g., shutter 2392, an external second gate may
be
implemented within the electronics and/or electronic processing of a
processor, e.g.,
MPU 46 of Fig. 5, to enable the Fourier transformation of the detected ion
signals in an
IMS with no second gate. Further details regarding the use of an external
second gate for
an FTIMS are described in the work of Edward E. Tarver, Extei°nal
Second Gate,
Fourier Tf°afasfo~m ~ofz Mobility Spect~omet~y: Par~ametYic
Optimization for Detection of
WeapofZS ofMass Dest~uctioya, SensoY 2004,'4, 1-13.
Fig. 84 is a conceptual diagram of a DMS - IMS detection system 2402 using a
shutterless IMS according to an illustrative embodiment of the invention. The
DMS -
IMS system 2402 includes a DMS 2404 and IMS 2406. The DMS 2404 includes a
sample S inlet 2408, ionization region 2410, ionization source 2412, DMS
filter region
2414, filter electrodes 2416 and 2418, field compensation voltage source 2422,
field
voltage source 2424, DMS flow channel 2420, detector electrodes 2426 and 2428,
detector voltage sources 2430 and 2432, and vents 2434 and 2436. The IMS 2406
includes a drift region 2444, gradient electrodes 2438, optional shutter 2440,
and
collector 2442.
Iii operation, a sample S is drawn through the inlet 2408 into the ionization
region
2410 and then ionized by the ionization source 2412. The sample S is then
filtered in the
DMS filter region 2414 by applying a compensated high asymmetric RF field at
the filter
electrode 2418 while the filter electrode 2416 remains at a common or ground
potential.
- 110 -
CA 02551991 2006-07-05
WO 2005/067582 PCT/US2005/001867
The field compensation voltage is provided by 'the field compensation voltage
source
2422 while the field voltage is provided by the field voltage source 2424.
Depending on the selected field voltage and field compensation voltage applied
at
the electrode 2418, a desired portion of the ions of the sample S pass through
the DMS
filter region 2414 and are detected at the detector electrodes 2426 and 2428,
The sample
S ions may be transported through the DMS flow channel 2420 by a carrier gas,
electric
field gradient, and the like.
Once the filtered ions are detected at either or both detector electrodes 2426
and
2428, the resulting neutral ions may be re-ionized and delivered to the M 2406
for
further analysis. As stated previously, the alpha parameter a(E) of the
filtered ion
species may be determined based on the detected ion intensity in the DMS 2404.
Alternatively, the detector electrodes 2426 and 2428 may be turned off or
driven with
voltages by the detector voltage sources 2430 and 2432 to prevent DMS
detection while
keeping the filtered ions within the DMS flow channel 2420 for delivery to the
IMS
2406.
Instead of using a shutter within the IMS 2406 to control the introduction of
filtered ions into the drift region 2444, the detector electrodes 2426 and
2428 may act as
detectors for the DMS 2404 during one cycle and then be set to the same
potential during
an another cycle. During the cycle when the detector electrodes 2426 and 2428
are set to
the same potential, the detector electrodes 2426 and 2428 act as an ion trap
or shutter.
The detectors electrodes 2426 and 2428 may then be used to control the
injection of
filtered ions from the DMS 2404 into the drift region 2444 of the IMS 2406.
The vents
2434 and 2436 may be used to remove excess gas and/or introduce reactant ions
for re-
ionization of the filtered and detected ions that were neutralized by the
detector
electrodes 2426 and 2428.
In the 1MS 2406, the filtered ions are propelled through the drift region 2444
by a
voltage gradient established by the gradient electrodes 2438. Fig. 84 shows a
voltage
gradient created by the gradient electrodes 2438 that is relatively more
positive as the
filtered ions move toward the collector 2442. Thus, negative ions are
propelled across
the drift region 2444 to the collector 2442 for IMS 2406 detection. Fox
positive ions, the
voltage gradient created by the gradient electrodes 2438 may be configured to
establish a
relatively more negative potential as the filtered ions move toward the
collector 2442.
- 111
CA 02551991 2006-07-05
WO 2005/067582 PCT/US2005/001867
The time between the gating of the ions by the detector electrodes 2426 and
2428 and the
detection of the ions at the collector 2442 may be used to determine the ion
velocity and,
subsequently, the low field coefficient K(0) of the filtered ion species.
The IMS 2406 may include an optional shutter grid 2440 for further filtering
ions
in the IMS 2406 by being gated at select times to allow certain ion species to
reach the
collector 2442. The optional shutter grid 2440 may act as a second gate for
the IMS
2406 if operating as an FTIMS. Otherwise,1MS 2406 may use an external second
gate
when acting as an FTIMS.
Fig. 85 is a conceptual diagram of a DMS - IMS detection system 2446 system
where the IMS is connected to the DMS in manner that reduces the introduction
of
neutral molecules into the IMS according to another illustrative embodiment of
the
invention. The DMS - IMS detection system 2446 includes a DMS 2472 and IMS
2474.
The DMS 2472 includes a sample S inlet 2448, ionization region 2450,
ionization source
2452, DMS filter region 2454, filter electrodes 2456 and 2458, field
compensation
voltage source 2460, field voltage source 2462, detector electrodes 2464 and
2466,
detector power source 2484, DMS flow channel 2468, and outlet 2470. The IMS
2474
includes a shutter 2476, gradient electrodes 2478, optional shutter 2480, and
collector
2482.
In operation, a sample S is drawn through the inlet 2448 into the ionization
region
2450 and then ionized by the ionization source 2452. The sample S is then
filtered in the
DMS filter region 2454 by applying a compensated high asymmetric RF field at
the filter
electrode 2458 while the filter electrode 2456 remains at a common or ground
potential.
The field compensation voltage is provided by the field compensation voltage
source
2460 while the field voltage is provided by the field voltage source 2462.
Depending on the selected field voltage and field compensation voltage applied
at
the electrode 2458, a desired portion of the ions of the sample S pass through
the DMS
filter region 2454 and are detected at the detector electrodes 2464 and 2466.
The
detector electrode 2464 includes an orifice 2486 that allows ions to pass into
the IMS
2474. The sample S ions may be transported through the DMS flow channel 2468
by a
carrier gas, electric field gradient, and the life.
Once the filtered ions are detected at either or both detector electrodes 2464
and
2466, the neutrals may be re-ionized and delivered to the IMS 2474 via the
orifice 2486
- 112 -
CA 02551991 2006-07-05
WO 2005/067582 PCT/US2005/001867
for further analysis. Otherwise, the neutral ion may be expelled through the
outlet 2470.
As shown in Fig. 85, the IMS 2474 is oriented in manner, e.g., perpendicular
to the DMS
flow channel 2468, that reduces the introduction of neutral molecules into the
IMS 2474
by allowing neutral molecules to be expelled through the outlet 2470 while
ions are
directed through the orifice 2486 into the IMS 2474. As stated previously, the
alpha
parameter a(E) of the filtered ion species may be determined based on the
detected ion
intensity in the DMS 2472. To propel the ions into the IlVIS 2474 through the
orifice
2486, the detector electrode 2466 may be biased with a like potential as the
filtered ions
while the detector electrode 2464 is biased with an opposite potential to
attract the
filtered ions to the orifice 2484.
The detector electrode 2464 may also have its potential configured to enable
detection of filtered ions while concurrently or substantially simultaneously
allowing a
portion of the filtered ions through the orifice 2486 into the IMS 2474 for
further IMS
detection. The potential at the detector electrodes 2464 and 2466 may be
selectively
adjusted to control the fields and biases at the orifice 2486 and, thereby,
determine the
amount of detection at the DMS 2472 and/or inj ection rate into the IMS 2474.
In the IMS 2474, the shutter 2476, depending on its polarity, forms packets of
the
filtered ions, either positive or negative, from the DMS 2472. The shutter
2476 may
include a shutter grid, one or more electrodes, and a like type of ion trap.
The shutter
2476 injects or gates the filtered ion into the drift region 2488. The
filtered ions are then
propelled through the drift region 2488 by a voltage gradient established by
the gradient
electrodes 2478. For positive ions, the voltage gradient created by the
gradient
electrodes 2478 becomes relatively more negative as the filtered ions move
toward the
collector 2482. For negative ions, the voltage gradient created by the
gradient electrodes
2478 becomes relatively more positive as the filtered ions move toward the
collector
2482. The time between the gating of the ions by the shutter 2476 and the
detection of
the ions at the collector 2482, e.g., the time of flight (TOF), may be used to
determine
the ion velocity and, subsequently, the low field coefficient K(0) of the
filtered ion
species.
The IMS 2474 may include an optional shutter grid 2480 for further filtering
ions
in the 1MS 2474 by being gated at select times to allow certain ion species to
reach the
collector 2394. The optional shutter grid 2480 may act as a second gate for
the IMS
-113-
CA 02551991 2006-07-05
WO 2005/067582 PCT/US2005/001867
2474 if operating as an FTIMS. Otherwise, the IMS 2474 may use an external
second
gate when acting as an FT1MS.
Fig. 86 is a conceptual diagram of a DMS - IMS detection system 2490 using a
shutterless IMS which is connected to the DMS in a manner that reduces the
introduction
of neutral molecules into the IMS according to an illustrative embodiment of
the
invention. The DMS - IMS detection system 2490 includes a DMS 2492 and 1MS
2494.
The DMS 2492 includes a sample S inlet 2496, ionization region 2498,
ionization source
2500, DMS filter region 2502, filter electrodes 2504 and 2506, field
compensation
voltage source 2508, field voltage source 2510, detector electrodes 2514 and
2516,
detector power source 2518, DMS flow channel 2512, orifice 2520, and outlet
2522.
The IMS 2494 includes gradient electrodes 2524, optional shutter 2526, drift
region
2530, and a collector 2528.
In operation, a sample S is drawn through the inlet 2496 into the ionization
region
2498 and then ionized by the ionization source 2500. The sample S is then
filtered in the
DMS filter region 2502 by applying a compensated high asymmetric RF field at
the filter
electrode 2506 while the filter electrode 2504 remains at a common or ground
potential.
The field compensation voltage is provided by the field compensation voltage
source
2508 while the field voltage is provided by the field voltage source 2510.
Depending on the selected field voltage and field compensation voltage applied
at
the electrode 2506, a selected portion of the ions of the sample S pass
through the DMS
filter region 2502 and are detected at the detector electrodes 2514 and 2516.
The
detector electrode 2514 includes an orifice 2520 that allows ions to pass into
the IMS
2494. The sample S ions may be transported through the DMS flow channel 2512
by a
carrier gas, electric field gradient, and the like.
Once the filtered ions are detected at either or both detector electrodes 2514
and
2516, the neutrals may be re-ionized and delivered to the IMS 2494 via the
orifice 2520
for further analysis. Otherwise, the neutral ions may be expelled through the
outlet 2522.
As shown in Fig. 86, the IMS 2494 is oriented in manner, e.g., perpendicular
to the DMS
flow channel 2512, that reduces the introduction of neutral molecules into the
IMS 2494
by allowing neutral molecules to be expelled through the outlet 2522 while
ions are
directed through the orifice 2520 into the IMS 2494. As stated previously, the
alpha
- 114 -
CA 02551991 2006-07-05
WO 2005/067582 PCT/US2005/001867
parameter a(E) of the filtered ion species may be determined based on the
detected ion
intensity in the DMS 2492.
Instead of using a shutter within the IMS 2494 to control the introduction of
filtered ions into the drift region 2530, the detector electrodes 2514 and
2516 may act as
detectors for the DMS 2492 during one cycle and then act as guiding electrodes
during
another cycle. During the cycle when the detector electrodes 2514 and 2516 are
acting
as guiding electrodes, the detectors electrodes 2514 and 2516 may then be used
to
control the injection of filtered ions from the DMS 2492 into the drift region
2530 of the
IMS 2494. To propel the ions into the IMS 2494 through the orifice 2520, the
detector
electrode 2516 is biased with a like potential as the filtered ions to repel
the ions while
the detector electrode 2516 is biased with an opposite potential to attract
the filtered ions
to the orifice 2520. This cycling of the functionality of the detector
electrodes 2514 and
2516 enables the detector electrodes 2514 and 2516 to alternately act like a
shutter for
the TOF measurement in the IMS 2494.
In the IMS 2494, the filtered ions are propelled through the drift region 2524
by a
voltage gradient established by gradient electrodes 2524. For positive ions,
the voltage
gradient created by the gradient electrodes 2524 becomes relatively more
negative as the
filtered ions move toward the collector 2528. For negative ions, the voltage
gradient
created by the gradient electrodes 2524 becomes relatively more positive as
the filtered
ions move toward the collector 2528. The time between the gating of the ions
by the
detector electrodes 2514 and 2516 and the detection of the ions at collector
2528 may be
used to determine the ion velocity and, subsequently, the low field
coefficient K(0) of the
filtered ion species.
The IMS 2494 may include an optional shutter grid 2526 for further filtering
ions
in the IMS 2494 by being gated at select times to allow certain ion species to
reach the
collector 2528. The optional shutter grid 2526 may act as a second gate for
the IMS
2494 if operating as an FTIMS. Otherwise, the IMS 2494 may use an external
second
gate when acting as an FTIMS.
Fig. 87 is a conceptual diagram of a DMS - IMS detection system 2532 using two
IMS detectors according to an illustrative embodiment of the invention. The
DMS -
IMS detection system 2532 includes a DMS 2534, IMS 2536, and IMS 2538. The DMS
2534 includes a sample S inlet 2540, ionization region 2542, ionization source
2544,
- 115 -
CA 02551991 2006-07-05
WO 2005/067582 PCT/US2005/001867
DMS filter region 2546, filter electrodes 2548 and 2550, field compensation
voltage
source 2554, field voltage source 2556, DMS flow channel 2552, detector
electrodes
2558 and 2560, detector power sources 2572 and 2574, orifices 2562 and 2564,
and
outlet 2566. The IMS 2536 includes a shutter 2568, gradient electrodes 2576,
drift
region 2582, optional shutter 2578, and collector 2580. The IMS 2538 includes
a shutter
2570, gradient electrodes 2584, drift region 2590, optional shutter 2586, and
collector
2588.
In operation, a sample S is drawn through the inlet 2540 into the ionization
region
' 2542 and then ionized by the ionization source 2544. The sample S is then
filtered in the
DMS filter region 2546 by applying a compensated high asymmetric RF field at
the filter
electrode 2550 while the filter electrode 2548 remains at a common or ground
potential.
The field compensation voltage is provided by the field compensation voltage
source
2554 while the field voltage is provided by the field voltage source 2556.
Depending on the selected field voltage and field compensation voltage applied
at
the electrode 2550, a desired portion of the ions of the sample S pass through
the DMS
filter region 2546 and are detected at the detector electrodes 2558 and 2560.
The
detector electrodes 2558 and 2560 include the orifices 2562 and 2564 that
allow ions to
pass into the IMS 2536 and IMS 2538 respectively. The sample S ions may be
transported through the DMS flow channel 2552 by a carrier gas, electric field
gradient,
and the like.
The detector electrode 2558 may be negatively biased by the detector power
source 2572 to attract positive ions into the IMS 2536 via the orifice 2562
and to repel
negative ions toward the orifice 2564. The detector electrode 2560 may be
positively
biased by the detector power source 2574 to attract negative ions into the IMS
2538 via
the orifice 2564 and to repel positive ions toward the orifice 2562. Thus,
both positive
and negative ions may be detected concurrently or substantially simultaneously
by the
DMS - IMS detection system 2532.
Once the filtered ions are detected at either or both detector electrodes 2558
and
2560, the neutrals may be re-ionized and delivered to either or both the IMS
2536 via the
orifice 2562 or the IMS 2538 via the orifice 2564 for further analysis.
Otherwise, the
neutral ion may be expelled through the outlet 2566. As shown in Fig. 87, the
IMS 2536
and lMS 2538 are oriented in manner, e.g., perpendicular to the DMS flow
channel 2552,
- 116 -
CA 02551991 2006-07-05
WO 2005/067582 PCT/US2005/001867
that reduces the introduction of neutral molecules into both the IMS 2536 and
IMS 2538
by allowing neutral molecules to be expelled through the outlet 2566 while
ions are
directed through the orifices 2562 and 2564 into the IMS 2536 and IMS 2538
respectively.
A portion of the filtered ions may be detected and neutralized by the
detectors
2558 and 2560, allowing the remaining ions to enter the IMS 2536 and IMS 2538
for
further analysis. The potential at the detector electrodes 2558 and 2560 may
be
selectively adjusted to control the fields and biases at the orifices 2562 and
2564 to
determine the amount of detection at the DMS 2534 and/or the ion injection
rate into the
IMS 2536 and IMS 2538 respectively. As stated previously, the alpha parameter
a(E) of
the filtered ion species may be determined based on the detected ion intensity
in the
DMS 2534.
In the IMS 2536, the shutter 2568, depending on its polarity, forms packets of
the
filtered ions, either positive or negative, from the DMS 2534. The shutter
2568 may
include a shutter grid, one or more electrodes, and a like type of ion trap.
The shutter
2568 injects or gates the filtered ion into the drift region 2582. The
filtered ions are then
propelled through the drift region 2582 by a voltage gradient established by
the gradient
electrodes 2576. For positive ions, the voltage gradient created by the
gradient
electrodes 2576 becomes relatively more negative as the filtered ions move
toward the
collector 2580. For negative ions, the voltage gradient created by the
gradient electrodes
2576 becomes relatively more positive as the filtered ions move toward the
collector
2580. The time between the gating of the ions by the shutter 2568 and the
detection of
the ions at the collector 2580, e.g., the time of flight (TOF), may be used to
determine
the ion velocity and, subsequently, the low field coefficient K(0) of the
filtered ion
species. The TOF may also be used to identify the ion species directly.
The IMS 2536 may include an optional shutter grid 2578 for further filtering
ions
in the IMS 2536 by being gated at select times to allow certain ion species to
reach the
collector 2580. The optional shutter grid 2578 may act as a second gate for
the 1MS
2536 if operating as an FTIMS. Otherwise, the IMS 2536 may use an external
second
gate when acting as an FTIMS.
In the IMS 2538, the shutter 2570, depending on its polarity, forms packets of
the
filtered ions, either positive or negative, from the DMS 2534. The shutter
2570 may .
- 117 -
CA 02551991 2006-07-05
WO 2005/067582 PCT/US2005/001867
include a shutter grid, one or more electrodes, and a life type of ion trap.
Tlie shutter
2570 injects or gates the filtered ion into the drift region 2590. The
filtered ions are then
propelled through the drift region 2590 by a voltage gradient established by
the gradient
electrodes 2584. For positive ions, the voltage gradient created by the
gradient
electrodes 2584 becomes relatively more negative as the filtered ions move
toward the
collector 2588. For negative ions, the voltage gradient created by the
gradient electrodes
2584 becomes relatively more positive as the filtered ions move toward the
collector
2588., The time between the gating of the ions by the shutter 2570 and the
detection of
the ions at the collector 2588, e.g., the time of flight (TOF), may be used to
determine
the ion velocity and, subsequently, the low field coefficient K(0) of the
filtered ion
species. The TOF may also be used to identify the ion species directly.
The IMS 2538 may include an optional shutter grid 2586 for further filtering
ions
in the IMS 2538 by being gated at select times to allow certain ion species to
reach the
collector 2588. The optional shutter grid 2586 may act as a second gate for
the IMS
2538 if operating as an FTIMS. Otherwise, the IMS 2538 may use an external
second
gate when acting as an FTIMS. The IMS 2536 and IMS 2538 are connected to the
DMS
2534 in an adjacent manner respectively to substantially reduce and/or
eliminate the
introduction of neutral ions into either IMS.
Fig. 88 is a conceptual diagram of a DMS -1MS detection system 2592 using
two shutterless IMS detectors according an illustrative embodiment of the
invention.
The DMS - IMS detection system 2592 includes a DMS 2594, shutterless IMS 2596,
and shutterless IMS 2598. The DMS 2594 includes a sample S inlet 2600,
ionization
region 2602, ionization source 2604, DMS filter region 2606, filter electrodes
2608 and
2610, field compensation voltage source 2614, field voltage source 2616, DMS
flow
channel 2612, detector electrodes 2618 and 2620, detector power sources 2628
and 2630,
detector orifices 2622 and 2624, and outlet 2626. The IMS 2596 includes
gradient
electrodes 2632, drift region 2638, optional shutter 2634, and a collector
2636. The IMS
2598 includes gradient electrodes 2640, drift region 2646, optional shutter
2642, and a
collector 2644.
In operation, a sample S is drawn through the inlet 2600 into the ionization
region
2602 and then ionized by the ionization source 2604. The sample S is then
filtered in the
DMS filter region 2606 by applying a compensated high asymmetric RF field at
the filter
- 118 -
CA 02551991 2006-07-05
WO 2005/067582 PCT/US2005/001867
electrode 2610 while the filter electrode 2608 remains at a common or ground
potential.
The field compensation voltage is provided by the field compensation voltage
source
2614 while the field voltage is provided by the field voltage source 2616.
Depending on the selected field voltage and field compensation voltage applied
at
the electrode 2610, a desired portion of the ions of the sample S pass through
the DMS
filter region 2606 and are detected at the detector electrodes 2618 and 2620.
The
detector electrodes 2618 and 2620 include the orifices 2622 and 2624 that
allow ions to
pass into the IMS 2596 and TMS 2598 respectively. The sample S ions may be
transported through the DMS flow channel 2612 by a carrier gas, electric field
gradient,
and the like.
The detector electrode 2618 may be negatively biased by the detector power
source 2628 to attract positive ions into the IMS 2596 via the orifice 2622
and to repel
negative ions toward the orifice 2624. The detector electrode 2620 may be
positively
biased by the detector power source 2630 to attract negative ions into the IMS
2598 via
the orifice 2624 and to repel positive ions toward the orifice 2622. The
detector
electrodes 2618 and 2620 may alternately act as shutters for IMS 2596 and IMS
2598
respectively.
During one cycle, e.g., the DMS cycle, the electrodes 2618 and 2620 may be
biased to act as DMS detectors. During another cycle, e.g., the shutter cycle,
the detector
electrodes 2618 and 2620 may be set to equal potentials or potentials that
encourage the
introduction of ions into the IMS 2596 and IMS 2598 respectively. At one
cycle, strong
negative and positive potentials may be applied to detector electrodes 2618
and 2620
respectively to facilitate DMS detection of positive and negative ions. At the
next cycle,
a neutral or common bias may be placed on both detector electrodes 2618 and
2620 to
allow ions to pass through the orifices 2622 and 2624 into IMS 2596 and IMS
2598
respectively for further analysis. Again, both positive and negative ions may
be detected
concurrently or substantially simultaneously by the DMS - IMS detection system
2532.
Once the filtered ions are detected at either or both detector electrodes 2618
and
2620 during a detection cycle, the neutrals may be re-ionized and delivered to
either or
both the IMS 2596 via the orifice 2622 or the 1MS 2598 via the orifice 2624
during the
shutter cycle for further analysis. Otherwise, the neutral ion may be expelled
through
outlet 2626. As shown in Fig. 88, the IMS 2596 and 1MS 2598 are oriented in
manner,
- 119 -
CA 02551991 2006-07-05
WO 2005/067582 PCT/US2005/001867
e.g., perpendicular to the DMS flow channel 2612, that reduces the
introduction of
neutral molecules into both the IMS 2596 and IMS 2598 by allowing neutral
molecules
to be expelled through the outlet 2626 while ions are directed through the
orifices 2622
and 2624 into the IMS 2596 and IMS 2598 respectively.
A portion of the filtered ions may be detected and neutralized by the
detectors
2618 and 2620, allowing the remaining ions to enter the IMS 2596 and IMS 2598
during
the shutter cycle for further analysis. The potential at the detector
electrodes 2596 and
2598 may be selectively adjusted to control the fields and biases at the
orifices 2622 and
2624. As stated previously, the alpha parameter a(E) of the filtered ion
species may be
determined based on the detected ion intensity in the DMS 2594.
In the IMS 2596, the filtered ions are received from the orifice 2622 during
the
shutter cycle of the detector electrode 2618. The filtered ions are then
propelled through
the drift region 2638 by a voltage gradient established by the gradient
electrodes 2632.
For positive ions, the voltage gradient created by the gradient electrodes
2632 becomes
relatively more negative as the filtered ions move toward the collector 2636.
For
negative ions, the voltage gradient created by the gradient electrodes 2632
becomes
relatively more positive as the filtered ions move toward the collector 2636.
The time
between the gating of the ions by the detector electrode 2618 and the
detection of the
ions at the collector 2636, e.g., the time of flight (TOF), may be used to
determine the
ion velocity and, subsequently, the low field coefficient K(0) of the filtered
ion species.
The TOF may also be used to identify the ion species directly.
The IMS 2596 may include an optional shutter grid 2634 for further filtering
ions
in the IMS 2596 by being gated at select times to allow certain ion species to
reach the
collector 2580. The optional shutter grid 2634 may act as a second gate for
the IMS
2596 if operating as an FTIMS. Otherwise, the IMS 2596 may use an external
second
gate when acting as an FTIMS.
In the IMS 2598, the filtered ions are received from the orifice 2624 during
the
shutter cycle of the detector electrode 2620. The filtered ions are then
propelled through
the drift region 2646 by a voltage gradient established by the gradient
electrodes 2640.
Fox positive ions, the voltage gradient created by the gradient electrodes
2640 becomes
relatively more negative as the filtered ions move toward the collector 2644.
For
negative ions, the voltage gradient created by the gradient electrodes 2640
becomes
- 120 -
CA 02551991 2006-07-05
WO 2005/067582 PCT/US2005/001867
relatively more positive as the filtered ions move toward the collector 2644.
The time
between the gating of the ions by the detector electrode 2620 and the
detection of the
ions at the collector 2644, e.g., the time of flight (TOF), may be used to
determine the
ion velocity and, subsequently, the low field coefficient K(0) of the filtered
ion species.
S The TOF may also be used to identify the ion species directly.
The IMS 2598 may include an optional shutter grid 2642 for further filtering
ions
in the IMS 2598 by being gated at select times to allow certain ion species to
reach the
collector 2644. The optional shutter grid 2642 may act as a second gate for
the IMS
2598 if operating as an FTIMS. Otherwise, the IMS 2598 may use an external
second
gate when acting as an FTIMS.
Fig. 89 is a conceptual diagram of a DMS - IMS detection system 2648 that
supports a DMS mode and an IMS mode according to an illustrative embodiment of
the
invention. The DMS -1MS detection system 2648 includes a sample S inlet 2650,
ionization region 2652, ionization source 2654, DMS filter region 2656, filter
detectors
2658 aaZd 2660, field compensation voltage source 2662, field voltage source
2664, DMS
flow chaimel 2668, detector electrodes 2670 and 2672, detector power sources
2674 and
2676, and outlet 2678.
In the DMS operating mode, a sample S is drawn through the inlet 2650 into the
ionization region 2652 and then ionized by the ionization source 2654. The
sample S is
then filtered in the DMS filter region 2656 by applying a compensated high
asymmetric
RF field at the filter electrode 2660 while the filter electrode 2658 remains
at a common
or ground potential. The field compensation voltage is provided by the field
compensation voltage source 2662 while the field voltage is provided by the
field voltage
source 2664.
Depending on the selected field voltage and field compensation voltage applied
at
electrode 2660, a desired portion of the ions of the sample S pass through the
DMS filter
region 2656 and are detected at the detector electrodes 2670 and 2672. The
sample S
ions may be transported through the DMS flow channel 2668 by a carrier gas,
electric
field gradient, and the like.
Once the filtered ions are detected at either or both detector electrodes 2670
and
2672, the neutral ion may be expelled through the outlet 2678. As stated
previously, the
- 121 -
CA 02551991 2006-07-05
WO 2005/067582 PCT/US2005/001867
alpha parameter a(E) of the filtered ion species may be determined based on
the detected
ion intensity at the detector electrodes 2670 and 2672.
The IMS mode of operation is used to determine the low field mobility K(0)
based on analyzing the frequency dependence of detector current within a
simple
cylindrical detector as described in the work of Puton, et al.,
Measur°ement of Difference
Ion Mobility Spectrurra with Simple Cylindrical Detector; ISIMS 2003.
In the IMS mode of operation, a sample S is filtered in the DMS filter region
2656 such that a select ion species is delivered to the detector electrodes
2670 axed 2672.
A modulated AC voltage is then applied by detector power source 2676 to
detector
electrode 2672 to expose the filtered ions to a modulated AC field. The ion
current of
detector electrodes 2670 andlor 2672 is then plotted versus the RF frequency
of the
modulated AC voltage applied to the detector electrode 2672. Based on the
plot, the low
field mobility K(0) may then be determined for the filtered ion species.
i
Thus, the alpha parameter may be determined during the DMS mode and the low
field mobility K(0) during the IMS mode which may be combined to determine the
i
coefficient of mobility K(E) for the selected ion species. With the K(E), the
detected ion
species may be identified with a high degree of confidence.
Fig. 90 is a conceptual diagram of a DMS - IMS detection system 2680 where
IMS and DMS detection occur concurrently and/or neax simultaneously according
to an
illustrative embodiment of the invention. The DMS - IMS detection system 2680
includes a DMS 2722 and IMS 2720. The DMS 2722 includes a sample S inlet 2682,
ionization source inlet 2684, ionization region 2686, DMS filter region 2686,
detector
electrodes 2688 and 2690, field compensation voltage source 2692, field
voltage source
2694, DMS flow channel 2696, detector electrodes 2698 and 2700, detector power
sources 2702 and 2704, and DMS outlet 2706. The IMS 2720 includes a shutter
2708,
gradient electrodes 2710, optional shutter 2712, collector 2714, drift region
2718, and
IMS outlet 2716.
In operation, a sample S is drawn through the inlet 2682 into the ionization
region
2686 and ionized. The ionization inlet 2684 may introduce reactant ions into
the
ionization region 2686 to facilitate the sample S ionization. Alternative
ionization
sources may be employed as described previously to enable sample S ionization.
The
- 122 -
CA 02551991 2006-07-05
WO 2005/067582 PCT/US2005/001867
ionized sample S may then be drawn concurrently or near-simultaneously into
both the
DMS 2722 and the IMS 2720 for DMS and IMS analysis.
In the DMS 2722, the sample S is filtered in the DMS filter region 2686 by
applying a compensated high asymmetric RF field at the filter electrode 2690
while the
filter electrode 2688 remains at a common or ground potential. The field
compensation
voltage is provided by the field compensation voltage source 2692 while the
field voltage
is provided by the held voltage source 2694.
Depending on the selected field voltage and field compensation voltage applied
at
the electrode 2690, a desired portion of the ions of the sample S pass through
the DMS
filter region 2686 and are detected at the detector electrodes 2698 and 2700.
The sample
S ions may be transported through the DMS flow channel 2696 by a carrier gas,
electric
field gradient, and the like.
Once the filtered ions are detected at either or both detector electrodes 2698
and
2700, the neutrals may are expelled through the DMS outlet 2706. As stated
previously,
the alpha parameter a(E) of the filtered ion species may be determined based
on the
detected ion intensity in the DMS .
In the IMS 2720, the shutter 2708, depending on its polarity, forms packets of
the
sample S ions, either positive or negative, from the ionization region 2686.
The shutter
2708 may include a shutter grid, one or more electrodes, and a like type of
ion trap. The
shutter 2708 then injects or gates the ions into the drift region 2718. The
filtered ions are
then propelled through the drift region 2718 by a voltage gradient established
by the
gradient electrodes 2710. For positive ions, the voltage gradient created by
the gradient
electrodes 2710 becomes relatively more negative as the filtered ions move
toward the
collector 2714. For negative ions, the voltage gradient created by the
gradient electrodes
2710 becomes relatively more positive as the filtered ions move toward the
collector
2714. The time between the gating of the ions by the shutter 2708 and the
detection of
the ions at the collector 2714, e.g., the time of flight (TOF), may be used to
determine
the ion velocity and, subsequently, the low field coefficient K(0) of the
filtered ion
species. The TOF may also be used to identify the ion species directly.
The IMS 2720 may include an optional shutter grid 2712 that may further filter
ions in the IMS 2720 by being gated at select times to allow certain ion
species to reach
the collector 2714. The optional shutter grid 2712 may act as a second gate
for the IMS
-123-
CA 02551991 2006-07-05
WO 2005/067582 PCT/US2005/001867
2720 if operating as an FTIMS. Otherwise, the IMS 2720 may use an external
second
gate when acting as an FTIMS.
It should be understood that Figs. ~3 -90 provide various exemplary
combinations of DMS and IMS detection which are not exhaustive of the possible
combinations of ion mobility based analyzers and detection techniques. Ion
mobility
based analyzers of one type may be combined in parallel, in series, in a
combination of
series and parallel. One or more analyzers of one type, e.g., DMS, may be
employed in
series andlor parallel with one or more analyzers of another type, e.g., IMS,
to identify
an ion species and/or sample constituent. It may not be necessary to use one
type of
analyzer before using another type of analyzer or to use multiple analyzers
and/or
analyzer types in a particular order. While the only two types of analyzers in
combination have been featured, more than two types of ion mobility based
analyzers
may be employed in combination to identify sample constituent if necessary.
Although the invention has been described with regard to particular
illustrative
embodiments, it should be appreciated that the invention is broader in scope.
For
example, although the above described illustrative embodiments are directed to
DMS-
IMS and DMS-FTIMS combinations, in other illustrative embodiments, a DMS may
be
combined in a similar fashion with one or more GCs, FTIRs, MSs, andlor LCMS.
Additionally, the invention may be employed with any system for identification
of unknown species of ions traveling through a varying controlled excitation
field, the
identification being based on the known characteristic travel behavior of the
species
under the varying field conditions. The ion or ions to be identified may be
traveling
alone or in a group of ions of same or differing characteristic travel
behavior.
Additionally, the ion or ions to be identified may be transported through the
systems and
devices of the invention by any suitable effluent, including transport gasses,
liquids
andlor vapors. The filter field may be compensated in any of various mamzers
as long as
a species of interest is returned to the center of the flow and permitted to
pass through the
filter while all other species are retarded or neutralized. Identification is
made based on
known field-dependent differential mobility behavior of at least one species
of ions
traveling in the field at known field conditions.
It should also be appreciated that, in various practices, the invention
provides
improved systems, methods and devices for ion species identification.
According to
- 124 -
CA 02551991 2006-07-05
WO 2005/067582 PCT/US2005/001867
some features, the invention varies one or more filter field / flow channel
conditions to
improve species discrimination. For example, according to some illustrative
embodiments, the invention determines changes in ion mobility, based, for
example, on
changes in: Vrf; Vcomp; field strength; Vrf duty cycle; Vrf wavelength; Vrf
frequency;
and/or flow channel temperature, pressure, humidity, flow rate, doping and/or
carrier gas
CG composition. According to other features, the invention takes multiple
scans of the
sample S, for example, by recirculating the sample S and/or processing the
sample S in
parallel and/or in series with one or more additional DMS, IMS, TOFIMS, FTIMS,
GC,
FTIR, MS, or LCMS, at differing flow channel / filter field conditions.
According to further features, the invention employs approaches, such as,
fragmenting, lowering pressure, three-dimensional dispersion plotting, ion pre-
separation, and/or ion amplification to enhance detection resolution.
According to other
features, the invention stores a library of signatures for known compounds and
pattern
matches data from unknown compounds with the stored library to identify the
unknown
compounds. It should be understood that the invention is applicable not only
to planar
DMS systems, but may be applied in general to ion mobility spectrometry
devices of
vaxious types, including various geometries, ionization arrangements, detector
arrangements, and the like, and brings new uses and improved results even as
to
structures that are all well known in the art.
Thus, the invention is not limited to configurations of the illustrative
embodiments and may be practiced in any other suitable configurations,
including radial
and cylindrical DMS devices. Additionally, various modifications and
variations may be
made to the invention without departing from the spirit and scope herein.
What is claimed is:
-125-