Note : Les descriptions sont présentées dans la langue officielle dans laquelle elles ont été soumises.
CA 02570861 2013-03-07
WO 2006/007442 PCT/US2005/021539
SYSTEMS AND METHODS FOR GEOGRAPHIC POSITIONING USING RADIO
SPECTRUM SIGNATURES
1. FIELD OF INVENTION
The present invention relates to the determination of the location of a radio
receiver by comparing a measured radio signature to a lookup table comprising
a plurality
of radio signatures from known locations. The present invention further
relates to the use
of transmitters that simultaneously transmit multiple programs, each with
unique location
codes.
2. BACKGROUND OF INVENTION
2.1 Systems and Methods for Identifying the Geographic Location of an
Electronic Device
Present techniques for locating electronic devices (e.g., cellular phone,
personal
digital assistants, computer, etc.) require technology such as (i) satellite
signals (global
positioning signals "GPS"), (ii) UPS and assistance via cellular signals to
penetrate
building structures, or (iii) triangulation using a cellular system. Each of
these
techniques, while useful in their own right, has the drawback of requiring
relatively
expensive equipment and/or a subscription to an expensive data service. What
are needed
in the art are cheaper systems and methods for locating the global position of
an electronic
device.
2.2 Digital Information Broadcasting Technologies
Radio standards that carry more information than traditional FM signals have
been
proposed and are widely used to provide enhanced information such as the names
of
songs currently playing or general traffic information. However, to date, such
radio
30
CA 02570861 2006-12-15
WO 2006/007442 PCT/US2005/021539
standards have not been used to communicate geographically sensitive data to
devices in a
satisfactory manner.
2.2.1 In-Band On-Channel Digital Audio Broadcasting
In-Band On-Channel (IBOC) Digital Audio Broadcasting systems bring the
benefit of digital audio broadcasting to today's radio while preventing
interference to the
"host" analog stations on adjacent channels. Referred to as high definition
radio (RD
radio), this technology delivers new digital services simultaneously with
existing analog
broadcast. These digital signals are broadcasted as "sideband" transmissions
bracketing
the top and bottom of the "host" analog signal in order to make optimal usage
of current
spectrum allocations. With more than half of current radio stations currently
facing
interference from adjacent stations, this approach delivers redundant
information on both
sides of the current channel location in order to ensure optimal performance
in all
listening environments.
IBOC technology further addresses interference through first adjacent
canceller
(FAC) technology. FAC differentiates between the digital sideband transmission
and
other analog signals that might be closely adjacent to the channel in order to
suppress the
interfering station.
IBOC technology overcomes multipath interference and sources of noise through
the use of coding and power combining techniques. This approach to error
correction
utilizes digital processors running algorithms that compare the quality of the
two digital
sideband transmissions, and combine them to deliver additional power gain
whenever
possible. Furthermore, when not possible, such algorithms seamlessly switch to
the more
powerful sideband of the two.
In much of the same way that a portable CD player digitally stores a short
passage
of music in order to overcome any momentary interruptions, the interleaver
approach
incorporated into IBOC technology further enhances performances. By "caching"
or
storing the broadcast into short-term memory, the interleaver allows for the
uninterrupted
transition between analog and digital signal within the same channel in order
to avoid the
dropoff that might occur due to a bridge or other obstruction. In order to
deliver
instantaneous tuning, the interleaver also seamlessly enables the initial
selection of the
analog signal and subsequent transition to the digital signal once properly
cached.
Compression of the audio data will increase transmission without losing sound
quality.
By employing the above techniques incorporating multiple digital signal
techniques, such as redundant sidebands, blend, first adjacent cancellation,
and code and
2
CA 02570861 2006-12-15
WO 2006/007442
PCT/US2005/021539
power sharing, IBOC technology is designed to capture a robust signal within a
station's
coverage area in order to ensure delivery of the benefits of HD Radio
technology.
IBOC provides a unique opportunity for broadcasters and consumers to
transition
from analog to digital broadcasting without service interruption while
maintaining the
current dial positions of existing radio stations. Consumers who purchase
digital radios
will receive their favorite AM and FM stations with superior digital quality,
free from the
static, hiss, pops, and fades associated with analog radio reception. In
addition to offering
digital audio quality and clear reception, IBOC offers the broadcaster a low
entry cost into
the wireless data industry. Through careful attention to the equipment
decisions made
today, broadcasters can significantly reduce the cost of conversion.
2.2.2 Radio Data System
The use of more and more frequencies for radio programs in the VHF/FM range
makes it increasingly difficult to tune a conventional radio to a desired
program. This
kind of difficulty is addressed by the Radio Data System (RDS), which has been
on the
market since 1987, and whose evolution is still continuing. "RDS" is the Radio
Data
System in Europe and "RBDS" is the slightly enhanced Radio Broadcast Data
System
used in the United States. As used herein, both the U.S. and European Radio
Data System
standards are referred to as "RDS."
The standards for RDS are described in the "United States RDBS Standard," by
the National Radio Systems Committee of the National Association of
Broadcasters.
The development of RDS started some twenty years ago in the European
Broadcasting
Union, EBU. The developers aimed at making radio receivers user-friendly,
especially
car radios in the context of a transmitter network where a number of
alternative
frequencies (AF) are present. In addition the initial standards contemplated
that listeners
should be enabled to see the program service name (PS) on an multi-character
alpha-
numerical display. All this has become possible by the using microprocessor
controlled
PLL tuner technology that permits a radio to be retuned within milliseconds.
During this
retuning process the audio signal is muted, which because of the short tuning
time, is
usually not detected by the ear. Thus, the RDS enabled radio is able to choose
the
transmitter frequency, among a number of alternative frequencies, giving the
best quality
reception. It also ensures that the switch-over is made to exactly the same
program
service by performing a kind of identity check using the program (PI) code.
3
CA 02570861 2006-12-15
WO 2006/007442 PCT/US2005/021539
2.2.3. Digitally Broadcasted Real-Time Traffic Information
In the prior art, travel information broadcasted using RDS is possible using
the
travel program (TP) and travel Announcement (TA) flags. Information is
broadcasted to
motorists, and is identified in parallel with broadcasting systems such as the
ARI system
with the corresponding RDS features TP/TA. But, ARI is being replaced in
Europe. A
more recent RDS development is the digitally coded Traffic Message Channel
(TMC) that
is now planned to be introduced in Europe. However, present RDS radios are not
yet
suitable for RDS-TMC for use in the United States.
Consequently, a need has been felt for providing a method of providing real
time
traffic infonnation via data messaging that utilizes an FM based real time
data messaging
systems and existing RDS receivers as well as text messaging that utilizes HD
radio based
on real time text messaging system and In-Band On-Channel (IBOC) Digital Audio
Broadcasting systems.
3. SUMMARY OF INVENTION
The present invention addresses the shortcomings found in the prior art. The
present invention provides a mechanism for an improved radio based data
messaging
system that can provide location specific information to electronic devices
through a
novel means of determining the geographic position of an electronic device
using radio
signals. One embodiment of the present invention provides a method of
localizing a
geographic position of a radio receiver. In the method, a current radio
signature is
obtained. This current radio signature comprises a plurality of measured
signal qualities
that collectively represent a frequency spectrum. Each measured signal quality
in the
plurality of measured signal qualities corresponds to a portion of the
frequency spectrum.
The current radio signature is compared to a plurality of reference radio
signatures. Each
reference radio signature in the plurality of reference radio signatures is
associated with a
global position. When the comparing identifies a unique match between the
current radio
signature and a reference radio signature in the plurality of reference radio
signatures, the
radio receiver is deemed to be localized to the global position associated
with the
reference radio signature.
In some embodiments, the frequency spectrum is all or a portion of the FM
frequency spectrum, all or a portion of the AM frequency spectrum, all or a
portion of the
spectrum between 300 KHz and 3 MHz, all or a portion of the spectrum between 3
MHz
and 30MHz, or a portion of the spectrum between 30 MHz and 300 MHz, or all or
a
portion of the spectrum between 300 MHz and 3000 MHz. In some embodiments, a
4
CA 02570861 2006-12-15
WO 2006/007442 PCT/US2005/021539
measured signal quality in the plurality of measured signal qualities is a
decibel rating of
a frequency in the frequency spectrum. In some embodiments, the measured
signal
quality in the plurality of measured signal qualities is a voltage
representing a frequency
in the frequency spectrum.
In some embodiments, the portion of the frequency spectrum corresponding to a
first measured signal quality in the plurality of measured signal qualities is
a first
frequency window. In some embodiments, this first frequency window comprises a
frequency spectrum that has a spectral width that is between 1 KHz and 200 KHz
or
between 200 KHz and 400 KHz. In some embodiments, the portion of the frequency
spectrum corresponding to a second measured signal quality in the plurality of
measured
signal qualities is a second frequency window and a spectral width of the
first frequency
window and the second frequency window is the same or different.
In some embodiments, the first measured signal represents a strongest
observable
signal in the portion of the frequency spectrum corresponding to the first
measured signal
quality. In some embodiments, a second measured signal quality also
corresponds to the
first frequency window. In some embodiments the first measured signal quality
and the
second signal quality are each independently selected from the group
consisting of an
RDS quality, an FM multipath reading, FM level, AM level, or a phase lock.
Another aspect of the invention provides a device comprising instructions for
accessing a radio signature lookup table. The radio signature lookup table
comprises a
plurality of reference radio signatures that collectively represent a
frequency spectrum.
Each reference radio signature in the plurality of reference radio signatures
is associated
with a global position. The device further comprises a radio signature
measurement
model for localizing a geographic position of a device. The radio signature
measurement
model comprises instructions for obtaining a current radio signature. The
current radio
signature comprises a plurality of measured signal qualities. Each measured
signal
quality in the plurality of measured signal qualities corresponds to a portion
of the
frequency spectrum. The device further comprises a radio signature comparison
module
having instructions for comparing the current radio signature to the plurality
of reference
radio signatures.
In some embodiments, the device further comprises instructions for accessing a
radio display table. This radio display table comprises information for each
global
position in a plurality of global positions. Such embodiments further include
a radio
display module for obtaining information from the radio display table as a
function of an
identity of a reference radio signature uniquely identified by the
instructions for
5
CA 02570861 2006-12-15
WO 2006/007442 PCT/US2005/021539
comparing. In some embodiments, the device further comprises a table update
module.
The table update module comprises instructions for updating information in the
radio
display table. In some embodiments, the device further comprises a table
update module.
The table update module comprises instructions for updating a reference radio
signature
in the radio signature lookup table. The instructions for accessing a radio
signature
lookup table and the radio signature measurement model is embedded in one or
more
application specific integrated circuits (ASICs), one or more field-
programmable gate
arrays (FPGAs), or any combination thereof. In some embodiments, the device
comprises
an ASIC or FPGA. In some embodiments, the device is a component of an RDS or
an
HD radio.
Another aspect of the invention is a radio comprising means for accessing a
radio
signature lookup table. The radio signature lookup table comprises a plurality
of
reference radio signatures. Each reference radio signature in the plurality of
reference
radio signatures is associated with a global position. The radio further
comprises means
for localizing a geographic position of the radio. The radio signature
measurement model
further comprises instructions for obtaining a current radio signature. This
current radio
signature comprises a plurality of measured signal qualities that collectively
represent a
frequency spectrum. Each measured signal quality in the plurality of measured
signal
qualities corresponds to a portion of the frequency spectrum. The radio
further comprises
means for comparing the current radio signature to the plurality of reference
radio
signatures.
An aspect of the present invention provides a method for enabling a data
messaging system using a transmitter that transmits a wireless signal. The
method
comprises enabling information for use by converting the information to
transmission
data. The transmission data comprises a plurality of programs. Each program in
the
plurality of programs is associated with a location code. The method further
comprises
broadcasting the transmission data from the transmitter using the wireless
signal such that
the plurality of programs are simultaneously transmitted on the wireless
signal each with
its associated location code.
In some embodiments, the wireless signal is transmitted at a frequency in the
FM
spectrum, a frequency in the AM frequency spectrum, a frequency in the medium
frequency (MF) spectrum, a frequency in the high-frequency (HF) spectrum, or a
frequency in the very high-frequency spectrum. In some embodiments, the
transmitter
that transmits the wireless signal is an IBOC Digital Audio Broadcasting
system, an FM
transmitter, an AM transmitter, an RDS system, a satellite radio transmitter
(e.g., XM or
6
CA 02570861 2006-12-15
WO 2006/007442
PCT/US2005/021539
Sirius), or a short-range wireless transmitter (e.g., an IrDA, Bluetooth, Wi-
Fi, Zigbee, or
UWB). In some embodiments, a program in the plurality of programs comprises
travel
and traffic information, weather information, emergency notification
information, amber
alert information, a recall notice, or an advertisement. In some embodiments,
the method
further comprises receiving the transmission data and parsing location codes
in the
transmission data in order to select a program in the plurality of programs.
In some embodiments, the method further comprises obtaining a current radio
signature at a radio receiver. The current radio signature comprises a
plurality of
measured signal qualities that collectively represent a frequency spectrum,
each measured
signal quality in the plurality of measured signal qualities corresponding to
a portion of
the frequency spectrum. The method further comprises comparing the current
radio
signature to a plurality of reference radio signatures. Each reference radio
signature in the
plurality of reference radio signatures is associated with a global position.
When the
comparing identifies a unique match between the current radio signature and a
reference
radio signature in the plurality of reference radio signatures, the radio
receiver is deemed
to be localized to the global position associated with the reference radio
signature. In
some embodiments, the method further comprises receiving the transmission data
comprising a plurality of programs each with a corresponding location code and
comparing (i) the global position associated with the radio to (ii) the
location codes in the
transmission data to thereby select a program in the plurality of programs.
Another aspect of the invention comprises an information grid comprising a
central server and a transmitter that transmits a wireless signal. The central
server
includes computer readable media comprising instructions for enabling
information for
use by converting the information to transmission data. This transmission data
comprises
a plurality of programs. Each program in the plurality of programs is
associated with a
location code. The computer readable media further comprises instructions for
broadcasting the transmission data from the transmitter using the wireless
signal such that
the plurality of programs are simultaneously transmitted on the wireless
signal each with
its own associated location code.
In some embodiments, the wireless signal is a frequency in the FM spectrum, a
frequency in the AM frequency spectrum, a frequency in the medium frequency
(MF)
spectrum, a frequency in the high-frequency (HF) spectrum, or a frequency in
the very
high-frequency (VHF) spectrum. In some embodiments, the transmitter that
transmits a
wireless signal is an IBOC Digital Audio Broadcasting system transmitter, an
RDS
transmitter, a satellite radio transmitter, or a short-range wireless
transmitter. In some
7
CA 02570861 2006-12-15
WO 2006/007442 PCT/US2005/021539
embodiments, the satellite radio transmitter is an XM or Sirius radio
transmitter. In some
embodiments, the short-range wireless transmitter is an IrDA transmitter, a
Bluetooth
transmitter, a Wi-Fi transmitter, a Zigbee transmitter, or a UWB transmitter.
Still another aspect of the invention provides a radio comprising a display
and a
computer readable media. The computer readable media comprises a radio
signature
comparison module that, in turn, comprises (i) instructions for obtaining a
current radio
signature, wherein the current radio signature comprises a plurality of
measured signal
qualities that collectively represent a frequency spectrum, each measured
signal quality in
the plurality of measured signal qualities corresponding to a portion of the
frequency
spectrum, and (ii) instructions for comparing the current radio signature to a
plurality of
reference radio signatures, each reference radio signature in the plurality of
reference
radio signatures associated with a global position. When the instructions for
comparing
identifies a unique match between the current radio signature and a reference
radio
signature in the plurality of reference radio signatures, the radio receiver
is deemed to be
localized to the global position associated with the reference radio
signature.
In this aspect of the invention, the computer readable media further comprises
instructions for receiving wireless transmission data comprising a plurality
of programs,
each program in the plurality of programs having a corresponding location
code. The
computer readable media further comprises instructions for comparing (i) the
global
position associated with the radio as determined by the radio signature
comparison ,
module to (ii) a location code in the transmission data to thereby select a
program in the
transmission data.
In some embodiments, the wireless transmission data is transmitted at a
frequency in the FM spectrum, a frequency in the AM frequency spectrum, a
frequency
in the medium frequency (MF) spectrum, a frequency in the high-frequency (HF)
spectrum, or a frequency in the very high-frequency spectrum. In some
embodiments, a
transmitter that transmits the wireless transmission data is an IBOC Digital
Audio
Broadcasting system, an FM transmitter, an AM transmitter, an RDS system, a
satellite
radio transmitter (e.g., XM or Sirius), or a short-range wireless transmitter
(e.g., a
Bluetooth transmitter, a Wi-Fi transmitter, a Zigbee transmitter, or a UWB
transmitter).
In some embodiments, a program in the plurality of programs comprises travel
and traffic
information, weather information, emergency notification information, amber
alert
information, a recall notice, or an advertisement.
8
CA 02570861 2006-12-15
WO 2006/007442 PCT/US2005/021539
The present invention further provides real time (traffic) digital message
control
delivered using In-Band On-Channel (IBOC) Digital Audio Broadcasting systems
or FM
based radio data system (RDS) data messaging systems. In such embodiments, a
data
messaging system is provided utilizing the FM based radio system (RDS) with
existing
RDS hardware or In-Band On-Channel (IBOC) Digital Audio Broadcasting systems
enabled to receive location specific traffic, weather or other digital
information. In some
embodiments, an extensible markup language (XML) is used to enable the
existing
hardware capabilities of HD IBOC and RDS capable FM radios. Utilization of XML
technology allows RDS or HD display of various applications that are language
independent, particularly, real time data messages generated as XML output.
In accordance with one embodiment of the present invention, a radio based data
messaging system is created using HD IBOC receivers or existing RDS receivers
for
receiving location specific information. An advantage of the present invention
is that it
can be adapted for use with a variety of location specific information, such
as weather,
traffic, or other information without any hardware modification. Yet another
advantage
of the present invention is that it can process text messages from any
existing third party
information stream. Yet another advantage of the present invention is that it
can utilize
XML technology that allows transmission of text from various applications in a
language
independent manner. Still another advantage of the present invention is that
it can be
used to enable a new information transmission grid. Yet another advantage of
the present
invention is that it is capable of being nationally coordinated, but locally
distributed.
Further, a preferred embodiment of the present invention has the capability of
being the
foundation for a more specific data messaging system implemented using a
vehicle
located FM receiver as the text display mechanism.
Start here
4. BRIEF DESCRIPTION OF THE FIGURES
The advantages and features of the present invention will become understood
with
reference to the following more detailed descriptions and claims taken in
conjunction with
the following more detailed description and claims taken in conjunction with
the
accompanying drawings in which:
Fig. 1A illustrates a radio receiver capable of determining geographical
position in
accordance with an embodiment of the present invention.
9
CA 02570861 2006-12-15
WO 2006/007442 PCT/US2005/021539
Fig. 1B illustrates data structures that are measured by a radio receiver
capable of
determining geographical position in accordance with an embodiment of the
present
invention.
Fig. 2 illustrates a method for determining geographic position in accordance
with
an embodiment of the present invention.
Fig. 3 illustrates a method for assigning a global position to a current radio
signature in accordance with an embodiment of the present invention.
Fig. 4 illustrates a circuit diagram for an exemplary system for measuring
signal
strength across a spectrum of wavelengths for use in populating a radio
signature lookup
table in accordance with an embodiment of the present invention.
Fig. 5 illustrates a system component diagram for an exemplary system for
measuring signal strength across a spectrum of wavelengths for use in
populating a radio
signature lookup table in accordance with an embodiment of the present
invention.
Fig. 6 illustrates a graphical user interface for monitoring data used to
populate a
radio signature lookup table in accordance with an embodiment of the present
invention.
Fig. 7 illustrates measurements taken in a drive test in the Waterloo area of
Canada for an empirical model in accordance with the present invention.
Fig. 8 illustrates measurements taken in a drive test in the Waterloo area of
Canada for an empirical model, after normalization, in accordance with the
present
invention.
Fig. 9 illustrates FM frequency distribution for Canada and the continental
United
States.
Fig. 10 illustrates signal strength plotted against distance from the
transmitter at
the FM frequency 104.5 using a J2 elliptical model for the Earth to calculate
the absolute
distance between the transmitter and receiver based on recorded GPS
coordinates.
10
CA 02570861 2006-12-15
WO 2006/007442 PCT/US2005/021539
Fig. 11 illustrates signal strength plotted against distance from the
transmitter at
the FM frequency 97.3 using a J2 elliptical model for the Earth to calculate
the absolute
distance between the transmitter and receiver based on recorded GPS
coordinates.
Fig. 12 illustrates measurements taken for a particular frequency in a
stationary
test conducted in the Waterloo area, in a relatively flat area with very
little visible terrain
variation and almost no ground clutter in the immediate area.
Fig. 13 illustrates an unnormalized stationary FM signature for a test
location.
Fig. 14 illustrates a normalized stationary FM signature for a test location.
Fig. 15 illustrates a block diagram of a data messaging system that uses HD or
and/or IBOC to transmit location specific information to HD or RDS receivers,
in
accordance with an embodiment of the present invention.
Fig. 16 is a functional schematic diagram of the system illustrated in Fig.
15, in
accordance with an embodiment of the present invention.
Like reference numerals refer to corresponding parts throughout the several
views =
of the drawings.
5. DETAILED DESCRIPTION OF THE INVENTION
The present invention provides cost effective systems and methods for
determining the location and direction of motion of a radio receiver. In the
present
invention, radio signal reception is polled across a spectrum of frequencies.
These
measurements are collectively termed a radio signature. This measured radio
signature is
then compared to a plurality of reference radio signatures. Each reference
radio signature
corresponds to a known location. For example, a first reference radio
signature in the
plurality of radio signatures corresponds to a first location and a second
reference radio
signature in the plurality of radio signatures corresponds to a second
location. Direction
can be obtained as the radio receiver moves across boundaries between
locations with
different reference radio signatures.
11
CA 02570861 2006-12-15
WO 2006/007442 PCT/US2005/021539
5.1 Exemplary Radio Receiver
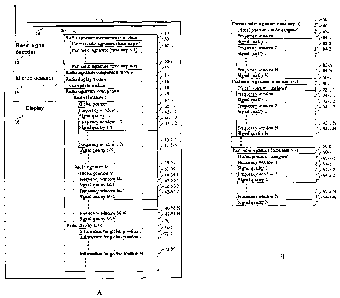
Reference will now be made to Fig. 1A, which shows an exemplary radio receiver
in accordance with an embodiment of the present invention. Many aspects of
radio
receiver 10 are conventional and will not be discussed so that the inventive
aspects of the
5 present invention can be emphasized. In typical embodiments, radio
receiver 10 includes
a radio signal decoder 12. In preferred embodiments, radio signal decoder 12
can be
controlled by a microprocessor 14 to scan a predetermined range of frequencies
in order
to measure signal strength across the range of frequencies.
A commercial example of a radio signal decoder 12 is the Microtune MT1390 FM
10 module (Plano, Texas). The MT1390 chip can be electronically tuned to
any given
frequency in the FM band through instructions sent to the chip by a
microprocessor
through an I2C port. The MT1390 chip reports signal strength at the FM
frequency to
which it is tuned. The MT1380 chip is designed to scan all available
frequencies to allow
for continuous reception of data from information systems such as Radio Data
System
(RDS). The RDS radio signal combines an audio feed with small amounts of text
and
data that can be picked up and processed by radios that have an RDS decode,
such as the
MT1390, built-in. Such radio receivers can display this information. The
information
commonly transmitted is station name (e.g., an 8-digit radio station name,
such as "BBC
R.4" or "Jazz FM"), program type (e.g. pop, rock, etc), a 'TA flag' that is
switched on
when a radio station starts a travel report, and switched off at the end (used
to
automatically swith the RDS radio to a station carrying travel news, or in a
car, pause a
cassette or a CD, when local travel news is broadcast), radio text
(information that 'scrolls'
across RDS radio displays, providing information that's sent from the radio
station, an
Enhanced Other Networks flag (EON flag) that allows an RDS radio to know about
other
associated stations, so a radio can know that when listening to a first radio
program, it
should monitor a second radio station, in case there's some travel news, an
alternative
frequency (AF) flag that contains information about a station's other FM
frequencies, so
that the radio can switch to a better signal while driving, time and date (CF
flag) that
carries the current date and time, resetting for daylights saving time, etc.
Another
example of an RDS radio is the Sony ICF-M33RDS, and the Roberts R9929, R9940,
and
R861. In other embodiments, radio signal decoder 12 is a high definition (HD)
radio
decoder. Commercial examples of the HD radio decoder include, but are not
limited to,
the Kenwood KTC-HR100 HD Radio tuner.
In typical embodiments, radio signal decoder 12 serves as an auxiliary radio
tuner
that functions as the 'background' tuner within radio receiver 10, scanning
all available
12
CA 02570861 2013-03-07
WO 2006/007442
PCT/US2005/021539
frequencies and allowing for continuous reception of data from information
systems such
as Radio Data System (RDS). As such, radio signal decoder 12 is typically
combined
with a primary radio tuner such as Microtune's MT1383/1384 companion AM/FM
tuners
for a dual-tuner AM/FM apparatus. The primary radio tuner is tuned by the user
to the
desired radio frequency while the auxiliary radio tuner is used to perform
sweeps in
accordance with the present invention and obtain information from sources such
as the
Radio Data System.
In the present invention, radio signal decoder 12 can be used to scan any
portion
of the FM frequency spectrum and/or the AM frequency spectrum in order to
measure a
radio signature. In the United States, the FM frequency spectrum is 88
megahertz (MHz)
and 108 MHz. The AM frequency spectrum is generally between 520 kilohertz
(KHz)
and 1500 KHz. As such, radio signal decoder 12 can be used to scan any portion
(or all)
of the frequency spectrum between 520 KHz and 1500 KHz and/or between 88 MHz
and
108 MHz. In some embodiments, radio signal decoder 12 can be used to scan any
portion
(or all) of the medium-frequency (MF) band, which has a frequency range of
between 300
KHz and 3 MHz, the high-frequency (HF) band, which has a frequency range of
between
3 MHz and 30MHz, the very-high frequency band (VHF) which has a frequency
range of
between 30MHz and 300 MHz, and/or the ultra-high-frequency (UHF) band, which
has a
frequency range of 300MHz to 3000MHz. For more information on the possible
bands
that can be polled in order to construct a radio signature in accordance with
the present
invention, see Sinclair, 1997, How Radio Signals Work, McGraw-Hill, New York.
Microprocessor 14 can be a component of radio signal decoder 12 or a
standalone
component. In some embodiments, the functionality of radio signal decoder 12
and/or
microprocessor 14 is embedded in one or more application specific integrated
circuits
(ASICs) and/or field-programmable gate arrays (FPGAs). In some embodiments,
microprocessor 14 is implemented as one or more digital signal processors
(DSPs). In
these embodiments, microprocessor 14 is considered any combination of chips,
including
any combination of ASICs, FPGAs, DSPs, or other forms of microchips known in
the art.
In general, any type of microarchitecture that can store or access from memory
approximately one megabyte of data and has about one megaflop or greater of
computing
power is suitable for implementing preferred embodiments of the present
invention.
Radio receiver 10 includes a display 16 for displaying the RDS data feed
and/or
navigational information provided by the present invention. In some
embodiments,
display 16 is an 8 to 16 character alphanumeric display. In other embodiments,
display
13
CA 02570861 2006-12-15
WO 2006/007442 PCT/US2005/021539
16 supports between 8 and 100 characters. In still other embodiments, display
16 is a
graphical display.
Memory 20 can be random access memory (RAM). All or a portion of this RAM
can be on board, for example, an FPGA or ASIC. In some embodiments, the RAM is
external to microprocessor 14. Alternatively, memory 20 is SDRAM available to
a DSP
or a FPGA that has an embedded SDRAM controller. In some embodiments, memory
20
is some combination of on-board RAM and external RAM. In some embodiments
memory 20 includes a read only memory (ROM) component and a RAM component.
Memory 20 includes software modules and data structures that are used by
microprocessor 14 to implement the present invention. While it is well known
in the art
that software modules and data structures can be structured in many different
ways in
order to implement a particular algorithm or method, one exemplary structure
has been
provided in Fig. 1 in order to convey certain aspects of the present
invention. This
exemplary structure includes a radio signature measurement model 30 for
measuring a
radio signature. In some embodiments, this measured radio signature is stored
in memory
as current radio signature 50.
In some embodiments, memory 20 stores past radio signatures 60 in addition to
the current radio signature 50. Past radio signatures 60 can be used in the
methods of the
present invention to establish the direction or to facilitate geographic
positioning.
20 Memory 32 further comprises a radio signature comparison module 32 for
comparing the
current measured radio signature (and possibly past measured radio signatures
60) to
reference radio signatures.
Memory 20 further comprises a radio display module 34 for displaying
information as a function of geographic position. For example, consider the
case in which
radio signature comparison module 32 determines that radio 10 is in geographic
position
one. In such instances, radio display module 34 will display information on
display 16
associated with geographic position one. Then, when radio signature comparison
module
32 determines that radio 10 is in geographic position two, module 34 will
display
information on display 16 associated with geographic position two.
Memory 20 further comprises a table update module 36 for updating radio
signatures and global position specific information. Table update module 36
typically
receives updates to such signatures from radio signals decoded by radio signal
decoder
12. Such updates are typically incremental in fashion. For example, if the
radio signature
for a specific geographic location has changed because a radio transmitter has
gone on
line (or off line), a data feed in the radio signal decoded by radio signal
decoder 12
14
CA 02570861 2006-12-15
WO 2006/007442 PCT/US2005/021539
transmits the updated radio signature and table update module 36 updates
memory 20
accordingly.
In addition to the above-identified software modules, memory 20 comprises a
radio signature lookup table 38. Radio signature lookup table 38 includes a
plurality of
radio signatures 39. Each radio signature 39 corresponds to a predetermined
global
position 62 (e.g., Chicago Illinois). In preferred embodiments, each radio
signature 39
corresponds to a geo-polygon that represents a region with a distinct FM
signature that
has been generated by analyzing overlapping transmitter broadcast regions.
Each radio
signature 39 includes a plurality of frequencies windows 40 and, for each such
frequency
window 40, a signal quality 42. In typical embodiments, frequency windows 40
are used
to circumvent the effects of phenomenon such as spectral leakage that occurs
at
frequencies close to those of certain transmitters. Since FM transmitters in a
region are
usually separated by more than 200 kHz, the occurrence of an FM signal with
two
adjacent FM peaks is usually representative of such spectral leakage. Such
spectral
leakage can be observed by tuning a radio to the next possible FM channel and
discerning
the sounds of an adjacent FM channel. Here, the term spectral leakage is used
loosely
because it has not been determined whether or not such effects are due to
transmitter
properties or to receiver properties. That is, it is possible that tuner
specific hardware
limitations cause this apparent problem. Radio signatures 39 can be referred
to as
reference radio signatures, and signal qualities 42 can be referred to as
reference signal
qualities.
In some embodiments, only the maximum value within a given frequency window
40 is considered the signal quality of the window. The size of each frequency
window 40
is chosen to reflect the typical separation between active transmitter
frequencies so that
true signal peaks are not removed from the signature. Thus, in some
embodiments, each
frequency window 40 represents a predetermined range of frequencies (window of
frequencies) and the signal quality 42 corresponding to the frequency window
40
represents the strongest observable signal in the range of frequencies. In
some
embodiments, radio signature 39 spans all or a portion of the FM frequency
band and
each frequency window 40 represents a range of 200 KHz. For example, a first
frequency
window 40 may represent all frequencies between 88.0 MHz and 88.2 MHz, a
second
frequency window 40 may represent all frequencies between 88.2 MHz and 88.4
MHz
and so forth. In this example, the signal quality 42 corresponding to the
first frequency
window 40 is a value representing the strongest measured signal between 88.0
MHz and
88.2 MHz for the corresponding geographical location, the signal quality 42
CA 02570861 2006-12-15
WO 2006/007442 PCT/US2005/021539
corresponding to the second frequency window 40 is a value representing the
strongest
measured signal between 88.2 MHz and 88.4 MHz for the corresponding
geographical
location, and so forth. In fact, FM signal strength (level) alone can
potentially yield one
hundred plus frequency windows 40 of binning and 87.7 to 107.9Mhz by 200 KHz
is a
well accepted frequency raster spacing.
In some embodiments, each frequency window 40 represents a frequency
spectrum other than 200 KHz. In fact, the size of the spectrum represented by
a
frequency window 40 is application dependent. For example, in some
embodiments, each
frequency window 40 represents any frequency spectrum between 1 KHz and 200
KHz.
In other words, the frequency window 40 has a spectral width anywhere between
1 KHz
and 200 KHz. In some embodiments, each frequency window 40 represents any
frequency spectrum between 200 KHz and 400 KHz. In still other embodiments,
each
frequency window 40 represents any frequency spectrum between 400 KHz and
800KHz.
However, in cases where the frequency band represented by radio signature 39
is the FM
band, frequency windows 40 representing a frequency spectrum of 200KHz is
preferred.
In some embodiments, each frequency window 40 in radio signature 39 is
uniform. That is, each frequency window 40 has the same spectral width (e.g.,
200KHz).
In other embodiments, there is no requirement that each frequency window 40 in
radio
signature 39 have uniform spectral width. For example, in some embodiments, a
radio
signature 39 includes both AM and FM frequencies. In such embodiments,
frequency
windows 40 centered on AM frequencies will have one spectral width whereas
frequency
windows 40 centered on FM frequencies will have a second spectral width. For
instance,
in a preferred embodiment, the spectral width for frequency windows 40 in the
FM band
is 200 KHz whereas the spectral width for frequency windows 40 in the AM band
is 10
kHz.
In preferred embodiments, the plurality of frequency windows 40 in a given
radio
signature 39 define a contiguous spectral region (e.g., all or a portion of
the FM band). In
some embodiments, the plurality of frequency windows 40 in a given radio
signature 39
define two noncontiguous spectral regions (e.g., all or a portion of the FM
band plus all or
a portion of the AM band). In preferred embodiments, each radio signature 39
in lookup
table 38 has the same frequency windows 40 as radio signature 50 and optional
radio
signatures 60, thereby facilitating direct comparison of radio signatures. In
preferred
embodiments, each frequency window 40 uniquely represents a particular
frequency
spectrum. In less preferred embodiments, there is overlap in the frequency
windows 40 of
a radio signature 39. In some embodiments, there are between five (5) and ten
thousand
16
CA 02570861 2006-12-15
WO 2006/007442 PCT/US2005/021539
(10,000) frequency windows 40 in a radio signature 39. In more preferred
embodiments,
there are between ten and five hundred frequency windows 40 in a radio
signature 39. In
still more preferred embodiments there are between 50 and 500 frequency
windows 40 in
a radio signature 39.
Signal quality 42 is any measure of signal quality. Nonlimiting examples of
signal
quality 42 includes a decibel rating and a voltage. In some embodiments,
signal quality
42 is represented in binary form where a first binary value represents a
signal quality 42
greater than some predetermined threshold value and a second binary value
represents a
signal quality 42 that is less than some predetermined threshold value.
In some embodiments, there are between five and one million radio signatures
39
in radio signature lookup table 38. In more preferred embodiments, there are
between one
hundred (100) and fifty thousand (50,000) radio signatures 39 in radio
signature lookup
table 38. In still more preferred embodiments, there are between five hundred
and
twenty-five thousand radio signatures 39 in radio signature lookup table 38.
In some
embodiments, each radio signature 39 corresponds to a unique global position
(geographical position) 62 in the United States, Canada, and/or Mexico. In
some
embodiments, each radio signature 39 corresponds to a unique global position
in any
combination of countries in the world.
In some embodiments, there are more than one radio signatures 39 corresponding
to the same unique global position 62 in lookup table. Certain embodiments
include more
than one radio signature for a given global position to account for different
conditions
(e.g., night time and day time, etc.).
In some embodiments, each frequency window includes more than just one signal
quality 42 attribute. For example, a generic RDS radio receiver can yield the
following
output:
FM Frequency (e.g., float 87.5 to 108.0 ) MHz
RDS Quality (e.g., float 0.0000 to 5.0000 ) volts
FM Multipath (e.g., float 0.0000 to 5.0000 ) volts
FM Level (e.g., float 0.0000 to 5.0000 ) volts
In such a device, any combination of RDS quality (e.g., 0 to 5 volts), FM
multipath (e.g.,
0 to 5 volts) and FM signal strength (FM level) (e.g., 0 to 5 volts) can be
used as a metric
to assess quality in a given frequency window 40. In some HD specific
embodiments,
atomic (GPS) time synchronized high density (HD) signal markers present in the
HD
signal can be used, when such signal markers become available.
17
CA 02570861 2006-12-15
WO 2006/007442 PCT/US2005/021539
Moreover, some devices that can serve as radio signal decoder 12 and
microprocessor 14 can measure additional variables that are useful for
establishing a
metric that represents signal quality in a given frequency window 40 (e.g.,
phase lock).
Thus, in some embodiments, signal quality 42 actually consists of measurements
for
several different variables (e.g., RDS quality, FM Mulipath, FM level, AM
level, phase
lock). In some embodiments, each of these variables are combined to form a
single
representation of signal quality for a given frequency window 40. In other
embodiments,
each of these variables independently serves as a unique representation of
signal quality.
In such embodiments, signal quality 42 for a given frequency window 40 is
multidimensional.
In some embodiments, radio signature comparison module 32 determines the
global position 62 of radio 10 at a given point in time and radio display
module 34 (which
may be a subset of radio signature comparison module 32) displays this global
position 62
on display 16. In some optional embodiments, radio display module 34 uses the
newly
determined global position 62 to see if there is any information for the
position 62 stored
in optional radio display table 70. Radio display table 70 includes records 72
for a
plurality of global positions. If radio display module 34 finds a match
between the newly
identified global position 62 and a record 72 (i.e., the record 72 corresponds
to the global
position 62), then module 34 displays record 72 on display 16. In some
embodiments,
record 72 provides traffic or weather information for the global position
corresponding to
record 72. In some embodiments, record 72 provides a detailed street map for
the global
position corresponding to record 72. Radio display table 70 is updated by
table update
module 36 using information provided by radio waves decoded by radio signal
decoder
12. Such updates can include, for example, updated traffic information and/or
updated
weather information for specific global positions.
5.2 Exemplary Data Structures
Referring to Fig. 1B, as a result of measurements obtained by radio signal
decoder
12, elements of a current radio signature 50 data structure are populated.
That is, for each
of a plurality of frequency windows 82, one or more signal quality parameters
84 are
determined. As in the case of signal quality parameters 42 of Fig. 1A, there
may be more
than one signal parameter for each frequency window 82 and the signal quality
may
represent a maximum value for a given frequency window. In preferred
embodiments
there is a one to one correspondence between respective frequency windows 82
of Fig. 1B
and frequency windows 40 of Fig. 1A. In other words, for each respective
frequency
18
CA 02570861 2006-12-15
WO 2006/007442 PCT/US2005/021539
window 82 of radio signature 50, there is a corresponding frequency window 40
that
represents the same frequency spectrum as the respective frequency window 82.
5.3 Exemplary Method for Localizing a Radio Receiver
Now that an overview of a radio receiver 10 in accordance with one embodiment
of the present invention has been described with reference to Fig. 1, a method
of using the
radio receiver 10 to identify the global position of the radio receiver in
accordance with
one embodiment will be described in conjunction with Fig. 2.
Step 202. In step 202, a determination is made of the current radio signature
50.
This is accomplished by scanning a predetermined range of frequencies. As
discussed
above, the present invention envisions a broad spectrum of different possible
predetermined frequency ranges. However, in a preferred embodiment, the
predetermined
range of frequencies is the FM band. The predetermined range of frequencies is
divided
into a plurality of predetermined frequency windows 82 that collectively
represent the
predetermined range of frequencies. For each frequency window 82 in the
predetermined
range of frequencies, a signal quality is measured and saved as the
corresponding signal
quality 84 for the frequency window. In some embodiments, this signal quality
represents
the maximum field/signal strength measured in the frequency window. For
example, in
some embodiments, radio signal decoder 12 is a generic programable RDS radio
module
that reports FM signal quality as an analog value within a voltage range
(e.g., 0 to 5
volts). In some embodiments, metrics in addition to or instead of FM signal
quality are
used to assess a given frequency window 82. For example, in some embodiments
an FM
multipath signal is measured in addition to FM signal quality. In some
embodiments an
RDS quality is measured in addition to FM signal quality. For example, a
generic RDS
radio receiver can report the RDS signal quality as analog values in a
predefined voltage
range (e.g., 0 to 5) volts. In other embodiments, phase lock and other
statistical
information provided by radio signal decoder 12 are recorded for each radio
signature 39
in step 202. For those variables that vary as a function of frequency, the
variables are
recorded for each frequency window 82. For those variables that do not vary as
a
function of frequency, a signal measurement of such variables is recorded for
the radio
signature 39.
In some embodiments, for each frequency in the predetermined range of
frequencies, the parameter of interest (e.g., FM radio signal strength) is
measured several
different times. For each measurement, the value assigned to the parameter of
interest at
the given frequency is the average, median, or mean of the individual values
measured for
19
CA 02570861 2006-12-15
WO 2006/007442 PCT/US2005/021539
the parameter of interest at the given frequency. In some embodiments, such
measurements are performed in a sweep. For example, in some embodiments, the
predetermined range of frequencies is measured in a sweep. The sweep begins at
one end
of the predetermined range of frequencies and finishes at the other end of the
predetermined range. Measurements of the parameters needed to asses signal
quality are
performed at each frequency in the predetermined range of frequencies. For
example, in
some embodiments, the predetermined range of frequencies is the entire FM
band.
Step 202 begins at one end of the band (e.g., 88.0 MHz) and takes samples at
that
frequency for a period of time, moves to the next frequency in the band (e.g.,
88.2 MHz)
and takes samples at that frequency for a period of time, and so forth. In
some
embodiments, the period of time spent at each frequency (or frequency window
82) is one
second. In some embodiments, the period of time spent at each frequency (or
frequency
window 82) is less than 1 second, less than 0.5 seconds, or less than 100
milliseconds. In
still other embodiments, the period of time spent at each frequency (or
frequency window
82) is more than 1 second, more than 2 seconds, or more than 5 seconds). In
some
embodiments, 1000 samples of the parameter of interest are taken per second.
Thus, in an
embodiment in which the period of time spend at each frequency (or frequency
window
40) is 1 second, 1000 samples (measurements) are taken of the parameter of
interest per
second. In some embodiments, more than one parameter is measured
simultaneously. In
many instances, the capabilities of the radio signal decoder 12 will dictate
whether or not
parameters can be concurrently sampled, which parameters can be sampled, and
how
frequently such parameters can be sampled. However, at a minimal level, a
parameter
that is indicative of signal strength is measured at each frequency or
frequency window.
In some embodiments, between 10 and 10,000 samples per second are taken of a
parameter of interest during a sweep. In more preferred embodiments, between
100 and
5,000 samples per second are taken of a parameter of interest during a sweep.
In some embodiments, successive instances of step 202 are performed at timed
intervals. For example, step 202 is performed every second, every minute, half
hour, or
some longer interval. When step 202 is repeated, the values for current radio
signature
may change subject to new measurements from radio signal decoder 12. Referring
to Fig.
1B, in some embodiments, the current radio signature 50 is saved as a past
radio signature
60 prior to saving new values for current radio signature 50. Past radio
signatures 60 may
or may not have a global position 90 assigned to them. However, in all
instances past
radio signatures 60 have frequency windows 92 that exactly correspond to
frequency
windows 82 of current radio signature 50. Thus, to save a current radio
signature 50 as a
CA 02570861 2006-12-15
WO 2006/007442 PCT/US2005/021539
past radio signature 60, signal quality values 84 are simply mapped onto and
saved to the
corresponding signal quality value 94 fields.
Step 204. Close to a transmitter, it is often the case that the observed
signal
strength of the transmitter appears to be saturated. For example, consider the
case in
which a radio receiver reports an FM quality value in the range of 0 to 5
volts. Thus,
when receiver reports an FM quality value of five volts for a given FM
frequency, the
frequency window that bounds the measured frequency is flagged as saturated
and is not
used in subsequent comparisons. While not intending to be limited to any
particular
theory, the perceived saturation is likely due to limitations in presently
available radio
signal decoders 12. While this perceived saturation has no adverse affect on
measured
signature 50, little information about the noise characteristics of the signal
can be gleaned
at close distances to a transmitter. Thus, in some embodiments, only non-
saturated values
from step 202 are considered. In such embodiments, frequency windows 82 in
which a
signal quality is saturated are removed from the radio signature. For example,
in some
embodiments, this removal process entails designating the saturated frequency
window 82
for nonuse. Frequency windows 82 that are designated for nonuse are not
compared to
corresponding frequency windows 40 in radio signature lookup table 38 in
subsequent
processing steps.
Step 206. It has been observed that, for some radio signal decoders 12, the
signal
quality value never falls to the lowest possible value in the range of allowed
values. In
particular, it has been observed that even at frequencies at which there is no
transmitter, a
radio signal decoder 12 outputs a basal radio signal quality voltage rather
than outputting
a reading of 0 volts. While not intending to be limited to any particular
theory, it is
believed that this basal voltage is caused by a DC offset in the radio signal
decoder 12.
While such receiver limitations have no known adverse affects on measured
signature 50,
they do not contribute to the global position determination. Therefore, in
some
embodiments, the current radio signature 50 is normalized by removing the
offset from
each signal quality measurement 84 in radio signature 50. The purpose of such
normalization is to improve the stability of subsequent comparison methods. In
one
embodiment, signal quality 84 is FM quality and normalization 206 involves the
removal
of an offset that appears in the FM quality signal.
In some embodiments, normalization 206 comprises amplifying measured signal
quality values to increase separation between data peaks in the radio
signature 50. Such
21
CA 02570861 2006-12-15
WO 2006/007442 PCT/US2005/021539
amplification can be accomplished by multiplying each signal quality 94 by a
constant in
embodiments in which there is only a one signal quality 94 parameter measured
per
frequency window 92 (e.g., multiplication of signal strength by a constant).
While this
has the effect of amplifying noise in addition to true signals, it has been
found that such
amplification increases the stability of the comparison method by reducing its
required
sensitivity.
Methods for obtaining a current radio signature 50 have been provided. It will
be
appreciated that the methods by which current radio signature 50 were obtained
can be
used to measure each of the radio signatures 39, typically at some time prior
to execution
of steps 202 through 206. Such measurements are typically made by a radio
receiver that
is coupled with a GPS system as described in the exemplary systems below
and/or some
other mechanism for determining global position. The radio receiver used to
make the
measurements for radio signature 39 can be the same radio receiver used to
make the
measurements for radio signature 50. However, in more typical embodiments,
different
radio receivers are used. Each radio signature 39 can be processed to exclude
saturated
frequencies and to normalize to remove any form of basal voltage in the same
manner in
which radio signature 50 is optionally processed in steps 204 and 206.
Step 208. In most instances, a comparison of the current measured radio
signature
50 to signatures 38 in lookup table 38 is sufficient to uniquely identify the
global position
of radio receiver 10. However, past radio signatures 60 can be used to break
any ties that
may arise. For example, consider the case in which radio receiver 10 is in a
car heading
North along a highway. At time point one, a current radio signature 50 is
measured.
Comparison of current radio signature 50 to each radio signature 39 in lookup
table 38
identifies a clear best match, say radio signature 39-1. Now, at point two,
current radio
signature 50 is again measured. However, comparison of current radio signature
50 to
each radio signature 39 in lookup table 38 identifies two radio signatures 39
that match
the new current radio signature 50. To break the tie, the radio signature 39
in the set of
two matching radio signature 39 that is geographically proximate to the most
recent past
radio signature (e.g., radio signature 60-1 Fig. 1B) is selected. Selection of
the
geographically proximate radio signature is selected on the premise that radio
receiver 10
could not have traversed too far between time step 1 and time step 2. This
example
illustrates the use of a single past radio signature 60. However, in practice,
any number of
past radio signatures can be used to break ties.
22
CA 02570861 2006-12-15
WO 2006/007442 PCT/US2005/021539
Step 210. Once a current radio signature 50 has been measured and optionally
processed (e.g., saturated values removed and the signature normalized),
signature 50 is
compared to one or more radio signatures 39 in radio signature lookup table
38.
In some embodiments, a brute force approach is applied in which a comparison
score is generated for each such comparison. In some embodiments this
comparison
score is simply an indication as to whether the two signatures match. In one
embodiment,
a declining threshold method is used. In the declining threshold method, the
frequency
window 82 with the strongest signal quality 84 is first considered. Only those
respective
radio signatures 39 that have a measured signal in the corresponding frequency
window
40 that is stronger than the measured signal in any other frequency window of
the
respective radio signature 39 are considered. For example, consider the case
in which a
current radio signature 50 includes a measured signal at frequencies 96.7,
98.5, and 100.3
and that the signal for 96.7 is the strongest. Only those respective radio
signatures 39 that
include a signal for 96.7 (or the frequency window 40 that encompasses this
signal) that is
larger than any other signal in the respective signature 39 are considered
candidates. If
this comparison does not limit the candidate signatures 39 to a single
candidate signature,
then the second strongest signal in current radio signature 50 is considered
and so forth
until a single candidate signature 39 is identified. Comparison of just a
single frequency
in many instances is a powerful indicator of the geographical location of
radio signature
measurement model 30. Review of FM transmitter reference sources registered
with the
Federal Communications Commission (FCC) in the United States and the Canadian
Radio-television and Telecommunications Commission (CRTC) in Canada reveals
that
there are relatively low upper bounds on the number of transmitters for each
FM
frequency in Canada and the United States. That is, based on a single
frequency, the
location of the receiver can be determined to within less than 200 (maximum)
locations
within all of Canada and the United States. Therefore, comparison of two,
three or four
different frequencies using the above identified declining threshold method
is, in most
instances, sufficient to identify a single matching radio signature 39 in
radio signature
lookup table 38.
In some embodiments, the signal strength of at least one frequency is used to
assign current radio signature 50 a global location using the systems and
methods of the
present invention. In more preferred embodiments, the signal strengths of two
or more
frequencies are used to assign current radio signature 50 a global location.
In some
embodiments, between two and ten frequencies are used to assign current radio
signature
50 a global location. In some embodiments, between three and twenty
frequencies are
23
CA 02570861 2006-12-15
WO 2006/007442 PCT/US2005/021539
used to assign current radio signature 50 a global location. In any of these
embodiments,
one or more additional signal quality parameters is optionally used to
facilitate the
assignment of a global location to current radio signature 50.
In some embodiments, rather than the declining threshold method, a "decision
tree" approach is used to identify a match in signature lookup table 38. In
some
embodiments of the "decision tree" approach, the most powerful signals
(frequencies or
corresponding frequency windows) in current radio signature 50 are matched
against
candidate radio signatures 39 in signature lookup table 38. Then candidate
radio
signatures 39 are assessed based on the likeliness that such candidates
represent the
correct location. For example, in cases where past radio signatures 60 with
assigned
global positions 90 are available, candidate radio signatures 39 having global
positions 62
that are proximate to assigned global positions 90 are given more weight than
distal
signatures 39. This process continues until a single geo-polygon target (radio
signature
39) is reached with the highest probability as the solution. In some
embodiments, other
parameters in addition to signal strength are used in the "decision tree"
approach. For
example, in some embodiments, signal strength in addition to available
information about
RDS signal quality is used. In fact, any combination of signal quality 42
metrics that are
stored in memory 20 can be used.
In some embodiments, the signal quality metrics 84 Measured in the current
radio
signature are reduced to a searchable expression. For example, consider the
case in which
current radio signature 50 includes a measured signal at frequencies 96.7,
98.5, and 100.3.
This can be represented as an array that is zero everywhere except for the
three values in
the array that represent frequencies 96.7, 98.5, and 100.3. In alternative
embodiments, the
three values respectively representing frequencies 96.7, 98.5, and 100.3 can
be binary
(e.g., be assigned the value "1 ). In such embodiments, the array can be
represented as:
96.8 97.0 97.2 98.4 98.6 100.4
1 0 0 0 1 1
In this array, frequencies are assigned to frequency windows. For example, the
number
96.8 in the first row of the array represents the frequency window spanning
96.6 to 96.8.
Thus, 96.7 is placed in this frequency window and assigned a value of "1." In
some
embodiments, rather than assigning a first binary value (e.g., "1 ) when a
signal is
observed, a value representative of signal strength is provided (e.g., a real
value between
0 and 5). Thus, for example, in the case where 3.7 volts is measured for
frequency 96.7,
24
CA 02570861 2006-12-15
WO 2006/007442 PCT/US2005/021539
4.2 volts is measured for frequency 98.5, and 2.4 volts is measured for
frequency 100.3,
the array can be represented as:
96.8 97.0 97.2 98.4 98.6 100.4
3.7 0 0 0 4.2 2.4
In embodiments in which a real value is assigned, error tolerances can be
added. For
example, consider the case in which the signal strength for frequency 96.7 is
3.7 volts.
An error value of, for example, 0.2 volts can be applied to the signal
strength. Thus, in
an embodiment where an error value of 0.2 volts is applied, the array can be
represented as
96.8 97.0 97.2 98.4 98.6 === 100.4
3.7 0.2 0 0 0 4.2 0.2 2.4 0.2
In principle, in embodiments in which error bars are provided, the present
invention
encompasses a broad range of possible error bars. An example where a constant
error is
applied to all measured signals has been illustrated above. In other examples,
the error
bar for each measured signal is a function of the magnitude of the measured
signal. For
example, consider the case where an error of ten percent is allowed. In such
an
embodiment, the array can be represented as:
96.8 97.0 97.2 === 98.4 98.6 100.4
3.7 0.4 0 0 0 4.2 0.4 2.4
0.2
Upon review of the above disclosure, those of skill in relevant arts will
appreciate that
there are many different error schemes that could be applied in order to
represent the
signal quality of a current radio signature 50 and all such schemes are within
the scope of
the present invention. In practice, some calibration of the error algorithm is
needed in
order to achieve a sufficient probability that there is only one radio
signature 39 in radio
signature lookup table 38 that matches a given current radio signature 50.
In some embodiments, more than one type of signal quality metric 84 can be
found in the current radio signature 50 besides signal strength as a function
of signal
frequency. In general, such additional signal quality metrics 84 can be
divided into two
categories: (i) those that have been measured as a function of frequency
(e.g.. RDS signal
CA 02570861 2006-12-15
WO 2006/007442
PCT/US2005/021539
quality) and (ii) those in which only a single value is measured for the
entire frequency
spectrum under consideration. Each metric in the former class of additional
signal quality
metrics can be assigned an additional row in the arrays illustrated above
whereas each
metric in the latter class of additional signal quality metrics can simply be
added as
another column to the arrays described above.
The signal quality metrics 42 of radio signatures 39 can be represented in an
array
format just like the signal quality metrics 84 of current radio signature 50.
In fact, in
some embodiments, error bars are applied to signal qualities 42 (the reference
signal
qualities of Fig. 1A) rather than signal qualities 84 (the measured signal
qualities of Fig.
1B). This is because the reference signal qualities can be measured at a given
global
position 62 using more sensitive equipment, different types of equipment
(e.g., different
antenna configurations) or under various different conditions (time of day,
time of year,
weather, etc.) in order to obtain a realistic determination in the variance in
signal quality
42 across such conditions. This variance can then be formulated into specific
error values
for each signal quality value. As an example, consider the case in which
frequencies 96.7,
98.5, and 100.3 are measured at a given global position 62. In constructing a
radio
signature 39 for this global position 62, frequencies 96.7, 98.5, and 100.3
can be
measured at global position 62 at different times of day, under different
weather
conditions, with different radio signal decoders 12 and/or different antenna
configurations. Suppose that when this is done, it is found that the signal
strength for
frequency 96.7 has a signal strength of 3.0 0.4 volts whereas the signal
strength for
frequency 98.5 has a signal strength of 3.0 0.001 volt. In this case,
frequency 96.7 will
be assigned a much larger error bar in the corresponding radio signature 39
than
frequency 98.5.
The arrays described above can then be compared using any of a wide range of
comparison techniques. For example, the strongest signals in current radio
signature 50
can be compared first in the declining threshold or decision tree approaches,
etc.
However, the representation of current radio signature 50 in the array format
shown above
(and the description of radio signature 39 having the same format) is meant to
aid in the
visualization of what data is used to identify a matching radio signature 39
in radio
signature lookup table 38. In practice, it is not necessary to represent
signal quality
metrics 84 (or signal quality metrics 42) in the array format described above
in order to
find matching radio signatures 39.
In some embodiments, enough quality metrics are used and radio signature
lookup
table 38 is sufficiently populated with radio signatures 39 to ensure that
radio receiver 10
26
CA 02570861 2013-03-07
WO 2006/007442
PCT/US2005/021539
is localized to a specific global position. In some embodiments in which this
is the case,
radio signature lookup table 38 is arranged as a tree. For example, in some
embodiments,
=
radio signatures 39 are organized into a tree in which parent nodes
representing certain
radio signatures 39 point to daughter nodes representing radio signatures 39
that are
5 geographically proximate to the signatures represented by parent nodes
and/or have a
signature that is similar to the signatures represented by parent nodes. There
are several
trees data structures known in the art and any such tree data structure can be
used to
organize radio signature lookup table 38. Representative examples include, but
are not
limited to, binary trees, red-black trees, splay trees, and B-trees. See, for
example,
10 Binstock and Rex, 1995, Practical Algorithms for Programmers, pp. 245-
231, Addison
Wesley, Reading Massachusetts; Adel'son-Vel'skii and Landis, 1962, "An
algorithm for
the Organization of Information," Soviet Math 3, pp. 1259-1263; Bayer and
McCreight,
1972, "Organization and Maintenance of Large Ordered Indexes," Acta
Informatica I, pp.
173-189; Corner, 1979, "The Ubiquitous B-tree," Computing Surveys, Vol. II,
pp. 121-
15 137; Knuth, 1973, the Art of Computer Programming, Vol. 3: Sorting and
Searching,
Addison Wesley, Reading Massachusetts; Melhorn, 1984, Data Structures and
Algorithms I: Sorting and Searching, Springer-Verlag, Berlin, Germany; Sleator
and
Tarjan, 1985, "Self-Adjusting Binary Search Trees," Journal ACM 32, pp. 652-
686;
Tarjan and Van Wyk, 1988, "An 0(n log log n)-Time Algorithm for Triangulating
a
20 Simple Polygon," Siam J. Comput 17, pp. 143-178.
In some embodiments in which enough quality metrics are used and radio
signature lookup table 38 is sufficiently populated with radio signatures 39
to ensure that
radio receiver 10 is localized to a specific global position, radio signature
lookup table 38
is encoded as a hash table. In such embodiments the quality metrics (quality
metrics 42 in
25 the case of radio signatures 39; quality metrics 84 in the case of
measured radio signature
50) are used as input to a common hash function. In such embodiments, a search
for a
match between measured ratio signature 50 and a radio signature 39 is
implemented as a
hash table lookup. Hashing is a well known algorithm. For exemplary hashing
techniques that can be used in accordance with the present invention see, for
example,
30 Binstock and Rex, 1995, Practical Algorithms for Programmers, pp. 63-93,
Addison
Wesley, Reading Massachusetts; Aho et al., 1986, Compilers: Principles,
Techniques,
and Tools, Addison-Wesley, Reading, Massachusetts; Holub, 1990, Compiler
Design in
C, Prentice Hall, Englewood Cliffs, New Jersey; Kruse et al.; 1991, Data
Structures and
Program Design in C, Prentice Hall, New Jersey; and UNIX Press, 1990, System V
27
CA 02570861 2013-03-07
WO 2006/007442
PCT/US2005/021539
Application Binary Interface - Unix System, Prentice Hall, Englewbod Cliffs,
New Jersey.
Step 212. In step 212, a global position 80 is assigned to radio receiver 10
based
on the respective radio signature 39 in radio signature lookup table 38 that
best matches
current radio signature 50 as determined by step 210. In cases where a
plurality of hits
(plurality of candidate radio signatures 39) are found in step 210 rather than
a unique
match, previously measured radio signatures 60 can be used to identify the
appropriate
radio signature among the candidates. For instance, those candidate radio
signature that
represent global positions most proximate to the global positions identified
for previously
measured radio signatures 60 can be upweighted.
In some embodiments global position 80 is localized in step 212 to a geometric
polygon that encompasses 50 contiguous square miles or less. In more preferred
embodiments, global position 80 is localized in step 212 to a geometric
polygon that
encompasses 5 contiguous square miles or less. In still more preferred
embodiments,
global position 80 is localized in step 212 to a geometric polygon that
encompasses I
contiguous square mile or less. In still more preferred embodiments, global
position 80 is
localized in step 212 to a geometric polygon that encompasses 0.5 contiguous
square
miles or less. In still more preferred embodiments, global position 80 is
localized in step
212 to a geometric polygon that encompasses five contiguous acres or less. In
still more
preferred embodiments, global position 80 is localized in step 212 to a
geometric polygon
that encompasses one acre or less. In some embodiments, global position 80 is
localized
in step 212 to within twenty-five, twenty, ten, or five contiguous city blocks
of the actual
location of radio receiver 10.
In some embodiments, a comparison of the global position 80 identified in step
212 to the global positions 90 assigned in past radio signatures 60 is used to
determine
whether radio receiver 10 is moving and, if so, the direction radio receiver
10 is moving.
For example, consider the case in which step 212 determines that radio
receiver is at
global position I. And past radio signature 60-1 reports a global position 2.
Suppose that
position 2 is directly South of position I. This indicates that between the
current
measurement and the last measurement, radio receiver 10 has moved directly
North. In
some embodiments, the current radio signature 50 is polled sufficiently
frequently and
global positions assigned to the radio signatures are sufficiently precise to
establish not
only the direction that radio receiver 10 is traveling, but also the speed at
which the
receiver is traveling.
28
CA 02570861 2006-12-15
WO 2006/007442 PCT/US2005/021539
Step 214. In typical embodiments, steps 202-212 are performed by radio
signature
comparison module 32. As such, by the time step 214 is reached, an accurate
determination of the global position of radio receiver 10 has been
accomplished without
any need for a conventional satellite global positioning feed. All that is
needed is a
program radio signal decoder 12 and programmable circuitry that can search a
radio
signal lookup table 38 for matching radio signatures 39. Furthermore, in some
embodiments, the direction and even the speed at which radio receiver 10 is
moving can
be determined.
In step 214, the information obtained using the novel methods of the present
invention is used for any of a number of purposes. For example, in some
embodiments,
newly assigned global position 80 is displayed on display 16. In some
embodiments,
processing step 214 is accomplished by radio display module 34. In some
embodiments,
radio display module 34 and radio signature comparison module are part of a
common
software module.
In some embodiments, step 214 comprises using newly assigned global position
80 to perform a table lookup in optional radio display table 70. Radio display
table 70
includes data records 72 for select global positions. To illustrate, consider
the case in
which global position 80 is geographic position 1012. In step 214, a
determination is
made as to whether radio display table 70 includes a record 72 for
geographical position
1012. When this is the case, radio display module 34 optionally displays all
or a portion
of the contents of the corresponding record on display 16. In some embodiments
information 72 includes information not only for display 16 but also audible
information,
such as an alarm, a sound, an audible message, audible instructions, a song,
etc. In such
instances, the audible information is sounded using the amplification system
(not shown)
of radio receiver 10.
In some embodiments, information 72 is updated by table update module 36 on a
regular or irregular basis using information received by radio signal decoder
10. For
example, in some embodiments radio signal decoder 10 receives a wireless
signal (e.g., a
Radio Data System or high definition HD) signal that carries geographic
specific traffic,
weather, or general news updates. Table update module 36 parses this
information into
appropriate records 72. Then, in step 214, this information is displayed on
display 16
and/or audibly sounded.
In some embodiments, exemplary radio receiver 10 receives data that includes
at
least one event code and at least one corresponding location code. In such
embodiments,
29
CA 02570861 2006-12-15
WO 2006/007442 PCT/US2005/021539
exemplary radio receiver 10 includes a lookup table to translate the event
code into a
meaningful display message or other form of communication signal (e.g., an
audible
alarm, music, voice message, etc.). The purpose of such event codes is to make
efficient
use of the radio signal bandwidth. Such event codes are advantageously much
smaller in
size then the events represented by such codes. For example, the code "01 can
represent
the event "traffic accident." In some embodiments, radio receiver 10 does not
have a
radio display table 70. Rather, in such embodiments, the location specific
information is
used to filter a radio stream comprising messages having event codes and
location codes.
Only those messages that have a location code that matches the location of
radio receiver
10, as determined, for example, by the process illustrated in Figure 2, are
communicated
to the radio listener.
5.4 Specific Comparison Method
An overview of systems and methods for pinpointing the geographic position of
a
radio receiver using radio signals has been provided in conjunction with Figs.
1 and 2.
Central to such systems and methods is a process for matching signal quality
metrics 84
of a current radio signature 50 to signal quality metrics 42 of a plurality of
radio
signatures 39. This comparison is embodied as step 210 in Fig. 2. Fig. 3 shows
one
detailed way of implementing step 210 of Fig. 2.
Step 302. In step 302, a variable N is set to one.
Step 304. In step 304, the Nth largest signal 84 in current radio signature 50
is
selected.
Step 306. In step 306, radio signature 50 is compared to radio signatures 39
in
radio signature lookup table 38. Radio signatures 39 are eliminated from
further
consideration if they do not have a signal 42 at the same frequency (or
frequency window)
as the frequency of the Nth largest signal selected in step 304. Moreover, in
some
embodiments, radio signatures 39 are eliminated from further consideration if
they do not
have a corresponding signal 42 with the same relative magnitude as the Nth
largest signal
84 selected in step 304. To illustrate, consider the case in which the Nth
largest signal 84
selected in step 304 has a frequency of 96.7. Each respective radio signatures
39 that
does not have a frequency window 40 encompassing the frequency 96.7 in which
the
corresponding signal quality 42 is higher than the signal quality 42 of any
other frequency
window 40 in the respective radio signature 39 is eliminated from further
consideration.
30
CA 02570861 2006-12-15
WO 2006/007442 PCT/US2005/021539
Step 308. In step 380 a determination is made as to whether elimination step
306
has eliminated so many radio signatures 39 from consideration that there is
now only one
possible signature 39 remaining in lookup table 38. When such a determination
is
affirmative (308-Yes), process control passes to step 310. When such a
determination is
not affirmative (308-No), process control passes on to step 312.
Step 310. Step 310 is reached if a unique radio signature 39 has been
identified as
matching current radio signature 50. In such instances, global position 80 is
assigned the
value of the global position 62 of the matching unique radio signature 39 and
the process
is terminated.
Step 312. Step 312 is reached when a unique radio signature 39 has not been
identified. In step 312, a determination is made as to whether there are
remaining peaks
(frequencies) in current radio signature 50. If so, process control passes to
step 314. If no
peaks in current radio signature 50 remain, process control either terminates
unsuccessfully (not shown) or passes on to step 316.
Step 314. In step 314 counter N is incremented by "1 , indicating that the
next
most significant peak in radio signature 50 is to be selected for evaluation.
Then, process
control returns to step 304 where the Nth largest peak in current radio
signature 50 is
selected for evaluation. Process control then proceeds once again to step 306.
In step 306
those radio signatures 39 that do not have the Nth largest peak registered as
the Nth largest
peak are eliminated. To illustrate, consider the case in which the Nth largest
signal 84
selected in the first instance of step 304 has a frequency of 96.7. Each
respective radio
signatures 39 that does not have a frequency window 40 encompassing the
frequency 96.7
in which the corresponding signal quality 42 is higher than the signal quality
42 of any
other frequency window 40 in the respective radio signature 39 is eliminated
from further
consideration. However, this was not sufficient to uniquely match a radio
signature 39 to
radio signature 50. Suppose that five radio signatures 39 in radio signature
lookup table
38 remained after the first instance of elimination process 306. Thus, a
second instance of
step 304 is run in which the second largest peak is selected. Suppose that the
second
largest frequency is 98.5. In the second instance of elimination process 306,
each
respective radio signatures 39 in the set of five remaining radio signature 39
that do not
have a frequency window 40 encompassing the frequency 98.5 in which the
corresponding signal quality 42 is the second highest signal quality 42 in the
respective
31
CA 02570861 2013-03-07
WO 2006/007442
PCT/US2005/021539
radio signature 39 is eliminated from further consideration. The loop defined
by processing
steps 304 through 314 continues until there is only a single radio signature
remaining or there are no further peaks in radio signature 50 to analyze.
Step 316. In some embodiments, the geographic positions assigned to past radio
signatures 60 are used to help eliminate candidate radio signatures 39. For
instance, if
there are two candidate radio signatures 39 remaining and one of the two
signatures is
proximate to the geographic positions assigned to past radio signatures 60 and
the other is
not, the proximate signature 39 is selected and the other signature is
eliminated.
5.5 Building radio signature lookup table 38
The present invention uses efficient, reliable means for populating radio
signature
lookup table 38. Such techniques can be classified into three types of models
(i) fully
predictive, (ii) fully empirical ("brute-force"), and (iii) empirical-
predictive hybrid. As
waves travel from a transmit antenna to a receive antenna, they suffer
attenuation due to
propagation loss. Fully predictive models predict signal strengths based on
known
transmitter locations and attenuation models. In contrast, fully empirical
models rely on
reference measurements of signal strengths taken from known reference
locations
throughout a supported geographic region. In the empirical-predictive hybrid
approach,
empirical data is used to verify and/or calibrate a predictive model.
5.5.1 Fully predictive models. Radio propagation in land mobile environments
is
subjected to degradation due to the combination of three main effects: (i)
large scale path
loss (area mean variation), (ii) large scale shadowing (local mean variation),
(iii) and
small scale multi-path fading (instantaneous variation).
The large scale path loss, or area mean variation, is caused by signal
attenuation
due to the distance between transmitter and receiver and its variation follows
the inverse
of the nth power of this distance, where n is commonly referred to as the path
loss
exponent. The value of n typically lies between 2 and 5. A value of 2 refers
to free space
propagation in which the variation of the received signal follows the Friis
formula. See
de P. Rolim, Telecomunicacoes 4, December 2001, pp. 51-55; and Rappaport,
"Wireless
Communications - Principles and Practice," IEEE Press, Inc., New York and
Prentice
Hall, Inc., New Jersey, 1996. A value greater than 2 indicates the influence
of structures
on the earth surface. Dense urban environments always have values of n on the
order of 4
or even 5. Suburban ones have n ranging from 2 to 4.
32
CA 02570861 2006-12-15
WO 2006/007442
PCT/US2005/021539
Large scale shadowing is caused by the terrain contour and other obstructions
between the transmitter and receiver, in the local sense. It corresponds to
variations about
the area mean value and typically follows a log-normal probability density
independent of
the distance between transmitter and receiver.
Small scale multi-path fading has to do with the fact that signals received by
a
mobile terminal come from an infinitely large number of propagation paths.
These
multiple propagation paths are caused by reflection, diffraction and/or
scattering of the
radio wave in natural structures (hills, vegetation, etc.) and in human-made
structures
(buildings, poles, etc.). The composite signal at the receiver antenna suffers
magnitude
and phase variations due to the multiple propagation paths that interfere with
each other
constructively and destructively, depending on the spatial position of the
receiver. These
variations are termed multi-path fading and they occur at a rate that depends
directly on
the speed of motion of the receiver and/or of the objects around the receiver.
Thus, propagation mechanisms are very complex and diverse. First, because of
the separation between the receiver and the transmitter, attenuation of the
signal strength
occurs. In addition, the signal propagates by means of complex phenomena such
as
diffraction, scattering, reflection, transmission, refraction, etc. A
propagation model is a
set of mathematical expressions, diagrams, and algorithms used to represent
the radio
characteristics of a given environment. In the present invention, they are
used to generate
geopolygons (radio signatures 39) based on the intersections of transmitter
broadcast
areas and compensates for signal attenuation that arises, inter alai, as a
result of one or
more of the factors discussed above. Table 1 provides exemplary propagation
models that
can be used to facilitate such calculations. However, it will be appreciated
that the
present invention is not limited to the use of these models.
Table 1. Exemplary propagation models used to calculate signal quality 42 for
radio
signatures 39.
Operating Frequency Range Terrain
Terrain
Propagation Model
(MHz) (km) Elevation Type
Not
Free Space Unlimited Unlimited Not applicable
applicable
30-250
Rec. ITU-R P.370-7 0-1000 Yes Some
450-1000
Rec. ITU-R P.1146 1000-3000 0-500 Yes Some
Okumura Hata 150 - 1500 0 - 20 Not applicable Some
CRC-PREDICT 30-3000 Unlimited Yes Yes
33
CA 02570861 2006-12-15
WO 2006/007442
PCT/US2005/021539
Operating Frequency Range Terrain Terrain
Propagation Model
(MHz) (km) Elevation Type
v.2.07
CRC-PREDICT
30-3000 Unlimited Yes Yes
v.2.08r2
CRC-PREDICT
30-3000 Unlimited Yes Yes
v.3.21
Longley Rice 20-20000 1-2000 Yes No
TIREM 20-20000 Unlimited Yes No
Not
Egli Unlimited Unlimited Not applicable
applicable
While most of these models can provide a fairly accurate representation of the
desired
geographic discretization, more accurate propagation models lead to more
accurate signal
quality parameters 42 in table update module 36. The CRC-PREDICT model (e.g.,
CRC-
PREDICT v.2.08r2) takes into account terrain and clutter effects. Because of
this, it
reportedly produces more accurate results than the other propagation models
(e.g., five dB
standard deviation with sufficient map data). In addition to accuracy
advantages, a fully
predictive model is attractive because of the relatively low overhead
(compared to the
"brute-force" method) in development and maintenance time, the possibility for
inclusion
of calibration data in the signature database itself, and the geographic
completeness
possible. Because predictive models involve irregular geographic regions, an
efficient
means of geo-referencing the transmitter locations and broadcast regions is
desirable, and
a means of geo-encoding transmitted data for dissemination by region is also
desired.
5.5.1.1 Free space propagation model. The free space propagation model
assumes the ideal propagation condition that there is only one clear line-of-
sight path
between the transmitter and receiver. As such, in the absence of any
reflections or
multipaths, radio wave propagation can be modeled using the free space
propagation
model which says:
2
Sr =
47-cd
where,
Sr is Received Power in Watts
St is Transmitted Power in Watts
Gt is Transmit Antenna Gain (isotropic)
34
CA 02570861 2013-03-07
WO 2006/007442 PCT/US2005/021539
Gr is Receive Antenna Gain (isotropic)
X is Wavelength
d is Tx/R, Separation in the same units as wavelength
The equation can be expressed in dB units by taking the logarithm (logio) of
both sides to
obtain:
A
Sr(dBW) = St(dBW) + Gt(dBi) + Gr(dBi) + 201og10 (-47r) ¨ 201og10(d)
The last two terms of this equation combined are called Path Loss (PL) for
free space
propagation. This is the channel's loss in going from the transmitter to the
receiver
expressed in decibels. The first two right hand terms combined is called
Effective
Isotropic Radiated Power or EIRP. EIRP is the equivalent transmitter power
required if
an isotropic (0 dBi) antenna were used. Using these definitions the following
equation is
obtained where, for free space propagation; PL (dB) = -201og10(1/4pd):
Sr = (dBW)-- EIRP(dBW)+ Gr.(dBi) - PL(dB)
For non free space propagation conditions, PL might be described by PL=A+B
log10 (R).
For more information on the free space propagation model see Friis, "A note on
a simple
transmission formula," Proc. IRE, 34, 1946; and United States Patent Nos.
6,700,902;
6,542,719; and 6,360,079.
5.5.1.2 Other exemplary predictive propagation models. Rec. ITU-R P.370-7
and Rec. ITU-R P.1146 are recommendations promulgated by the International
Telecommunications Union and can be ordered from the URL
http://www.itu.int/publicationsau-r/. The Okumaru Hata propagation model is
described in
the article Okumura et al., 1968, "Field Strength and Its Variability in VHF
and UHF Land-
Mobile Radio Service," Review of the Electrical Communications Laboratory 16,
Nos. 9-
10.
CRC-PREDICT (e.g., CRC-PREDICT v.2.07, CRC-PREDICT v.2.08r2, and
CRC-PREDICT v.3.21) is used for estimating radio signal strengths on
terrestrial paths at
VHF and UHF, given a transmitter location, power, and a receiver location.
Since
surface codes; recorded at regular intervals (e.g. 500 meter intervals). CRC-
PREDICT
CA 02570861 2013-03-07
WO 2006/007442 PCT/US2005/021539
can also be used without such a database, either by manually entering path
profiles or by
using a general description of the terrain. When a path profile is present,
the main
calculation is that of diffraction attenuation due to terrain obstacles. These
obstacles are
primarily hills, or the curvature of the earth, but can also include trees
and/or buildings.
The presence and particular location of trees and buildings are considered in
the
calculation. However, their height and structure are not considered. The
diffraction
calculation is done by starting at the transmitting antenna and finding the
radio field at
progressively greater distances. At each step, the field at a point is found
by a numerical
integration over the field values found in the previous step. For long paths,
tropospheric
scatter becomes important. CRC-Predict combines the tropospheric scatter
signal with the
diffraction signal. For more information on CRC-Predict, see "Review of the
Radio
Science Branch of the Communications Research Centre Canada - Final Report,"
Performance Management Network Inc., March 2001 which can be found at the URL
http://www.ic.gc.ca/cmb/welcomeic.nsf/vRTF/AuditJan2004E/
$file/RadioScienceReview
FinalReport.pdf.
The Longley-Rice error propagation algorithm is reported in Longley and Rice,
July 1968, 'Prediction of Tropospheric radio transmission over irregular
terrain, A
Computer method-1968," ESSA Tech. Rep. ERL 79-ITS 67, U.S. Government Printing
Office, Washington, D.C. The Terrain Integrated Rough Earth Model (TIREM) is
described in IEEE Vehic. Tec. Society, Special Issue on Mobile Radio Prop.,
IEEE Trans.
Vehic. Tech., vol. 37, 1988, pp. 3 72. The Egli error propagation model is
described in
"Radio Propagation Above 40MC Over Irregular Terrain," Proceedings of the IRE,
Vol.
45, Oct. 1957, pp.1383-1391. Additional propagation models that can be used to
populate
table update module 36 include the Carey model from FCC Report No. R-6406,
"Technical
Factors affecting the assignment of facilities in the domestic public land
mobile radio
service," by Roger B. Carey, June 24, 1964, and Part 22 of the FCC Rules; the
Bullington
model from "Radio Propagation for Vehicular Communications," by Kenneth
Bullington,
IEEE Transactions on Vehicular Technology, Vol. VT-26, No.4, November 1977;
the
Hata/Davidson model from "A Report on Technology Independent Methodology for
the
Modeling, Simulation and Empirical Verification of Wireless Communications
System
Performance in Noise and Interference Limited Systems Operating on Frequencies
between
30 and 1500MHz," TIA TR8 Working Group, IEEE Vehicular Technology Society
Propagation Committee, May 1997; the Rounded Obstacle
36
CA 02570861 2013-03-07
WO 2006/007442 PCT/US2005/021539
model from Section 7 "Diffraction Over a Single Isolated Obstacle" and Section
9
"Forward Scatter" of Tech Note 101 ("Transmission Loss Predictions for
Tropospheric
Communication Circuits", 1967, NTIS) and the National Radio Astronomy
Observatory
QZGBT program. Additional discourse on error propagation models, including the
physics
considered in such models, is found in Neskovi et al., "Modern Approaches in
Modeling
of Mobile Radio Systems Propagation Environment," IEEE Communications Surveys,
Third Quarter 2000.
5.5.1.3 Input data for error propagation models. Many of the error propagation
models that can be used in the present invention work in conjunction with
information on
terrain (hills, elevation, etc.) There are numerous sources for such terrain
data including,
but not limited to, the United States Geological Survey (http:
//edu.usgs.gov/geodata for
United States map data and the Ministry of Natural Resources for Canadian map
data.
Such information is available through distributors such as GEOREF Systems Ltd.
(http://www.georef.comr, and GeoBase Ltd. (http://www.geobase.cal).
Furthermore, such error propagation models require the location of
transmitters.
FM transmitter reference sources include official registration bodies such as
the Federal
Communications Commission (FCC) (Washington, D.C.) and the Canadian Radio-
television and Telecommunications Commission (Ottawa, Ontario). Data obtained
from
these sources is preferably verified both with commercially available
information, station
engineers and with actual field measurements. FCC FM transmitter information
can be
accessed by commercially available databases and/or cooperation agreements
with
companies such as Navteq (Chicago, Illinois). Navteq provides digital map
information
and related software and services used in a variety of navigation, mapping and
geographic-related applications.
5.5.2 Empirical models. Empirical models compare current radio signature 50 to
radio signatures 39 measured at predetermined locations using the techniques
described
above in conjunction with Figures 1 through 3. Typically, the use of empirical
models is
unable to match exact signatures. Rather, the approach determines the "closest
match,"
thus giving an approximate location within acceptable error bounds.
For the empirical model to be useful, a large set of measured data is produced
so
that an accurate reflection of all geographies in the eNav application area is
available.
This model lacks the geographic completeness of the predictive model. However,
for
37
CA 02570861 2006-12-15
WO 2006/007442 PCT/US2005/021539
smaller geographies (e.g. a state, a city, or town) it can provide
comprehensive support.
Since the empirical approach will generate a database of known "real"
signatures, terrain
and clutter calibration, if any, is done at the sensing end of the system (in-
vehicle) before
signature comparison is possible. A possible advantage of the empirical
approach is the
potential regularity of the geographic regions encompassed by each radio
signature 39.
With a predictive model, broadcast areas may be irregular and small anomalous
regions
can be created by irregular terrain. The irregularity of the regions and the
possibility for
many smaller regions with distinct signatures might require much more complex
encoding and decoding methods for the dissemination of location-sensitive
information.
The possibility of regularly spaced regions using an empirical model is more
conducive to
efficient and simple encoding schemes. It should also be noted that an
empirical model
does not require knowledge of transmitter locations or broadcast areas. This
does not
mean that transmitter changes will not affect the system. On the contrary, an
empirical
model of this nature requires significant resources to accurately maintain, as
updates to
table update model 36 (under the empirical approach) will require both man
power and
travel time.
5.6 Exemplary System
To test the methods of the present invention, an exemplary system was built.
The
system includes a generic RDS radio receiver FM Module, implemented on a
breadboard
(e.g., a Wish board no. 204-1). This fully integrated FM module provides a way
to access
an analog FM quality reading (as well as a multipath rating and RDS quality
reading) at
any given frequency. The FM quality signal is used as a good indicator of
field/signal
strength (signal quality 42 Fig. 1A) across the FM frequency band at any given
position.
The module is also flexible in that it provides electronic tuning and
parameter control
through an I2C interface (which can be accessed by the laptop through an
interface board
on the printer port). A circuit diagram of this breadboard is shown in Fig. 4.
The generic
RDS radio receiver requires very little external hardware for implementation,
but power
was supplied by a 12 volt Compaq power supply (Series PS2022). One other
external in
the exemplary system is an FM band antenna that is of the simple automotive
whip type.
The case of a PC was used to as a mounting point for all of the other
equipment, such as
the breadboard and the Weidmuller terminal block, in the exemplary system. The
Weidmuller terminal block provides a physically sturdy connection for the
analog outputs
of the radio receiver to the data capture unit. The data capture unit resides
in a 12 bit
250Ksps, 16 channel ADC Elan Digital Systems (Segensworth West, Fareham,
United
Kingdom) AD132 DAQ PCMCIA card that is installed in slot one of a Dell (Austin
38
CA 02570861 2006-12-15
WO 2006/007442 PCT/US2005/021539
Texas) PPI Inspiron 7500 personal computer. The analog-to-digital capabilities
of this
card are used to record the FM Quality, Multipath output and RDS Quality
signals from
the radio receiver, all of which originate from the radio receiver as voltages
in the range
of zero to five volts. After conversion, all the digital values are both
displayed on the
laptop graphical interface and stored on the hard drive.
In order to provide a baseline or context from which to develop a model, a
Garmin
GPS unit 35-USB (Garmin International Inc., Olathe, Kansas) was used to gather
the
various positional and velocity coordinates and the accurate time when the
analog
readings are taken. This unit provides approximately 10-meter accuracy without
correction, which is more than sufficient for the granularity of the exemplary
system. The
GPS coordinates and time are stored with the analog reading values on the
laptop hard
drive. The GPS unit communicates with and is powered by the USB interface. A
system
diagram of this setup is illustrated in Fig. 5.
A variety of software modules were run on the laptop computer in order to
collect
the desired date. One low level software module was an I2C control module. The
I2C
control module provides the ability to set values on the RDS radio receiver
through the
I2C interface board. The I2C interface board was obtained from demoboard.com.
The
I2C board allows the I2C control module software to electronically tune the
radio receiver
to any given frequency in the FM band. The I2C board and corresponding control
module
also provide access to FM demodulation parameters used inside the radio
receiver. Such
parameters could be used as additional signal quality characteristics 42.
Another software module installed on the laptop computer is a data capture
module. The data capture module interfaces with the AD132 PCMCIA at the
Windows
DLL level to allow for configurable sample rate and sampling time (which taken
together
give a fixed number of samples). Although other values could be used, the
internal
settings were set to sweep at 1000 samples/second for a length of one second
per FM
frequency. The data capture includes routines to perform evenly weighted
averages and
output the average value to higher-level modules. The process is adaptable to
multiple
inputs and is set by default for three analog inputs.
Another low level software module implemented on the laptop computer is a GPS
Unit Interface Module. The GPS unit interface module decodes a serial stream
provided
by the USB-to-Serial driver into geo-position variables like latitude,
longitude, speed,
heading and time, placing them in internal variables for display and data-
logging. Analog
readings that are taken by the Data Capture Module are related back to reality
by
combining them with a position and time. The GPS values provide this baseline.
A
39
CA 02570861 2006-12-15
WO 2006/007442 PCT/US2005/021539
limitation of this experimental system is that updates are only available from
the hardware
every second. Because the experimental model's granularity in time and
position will be
much larger, this did not affect results significantly.
In addition to the low level modules, higher level modules were also
implemented
on the lap top computer. Such modules included a data logging module. Given
any set of
internal variables (which is completely configurable) this module will log
those data
values to a comma-separated file each time a trigger is activated. Internally,
this occurs
after the GPS position and time are collected and the analog values are
recorded for the
current FM frequency. It also provides the facility to give a "name tag" to
the current
GPS location and log it to a separate file for later reference. Another high
level interface
was a user interface module providing a graphical user interface (GUI) to the
other
modules in the system. The GUI displays current values of all internal
variables of the
program (GPS, analog readings, and FM frequency). The GUI can configure which
list of
FM frequencies to sweep and change the target log file. It has the ability to
produce
independent geo-code/time tags with text descriptions with button click.
Controls are
available to start and stop the automatic frequency sweep/data-capture process
or to
generate FM quality, multipath and RDS quality readings at one specific
frequency. A
screenshot of this exemplary GUI is illustrated in Fig. 6.
5.7 Signature Uniqueness
A preliminary signature uniqueness study was conducted using transmitter
registration data and the equipment described above and depicted in Figs. 4-6.
It was
found that, in Canada and the United States, the majority of signatures
containing more
than a single FM signal (that is, more than one transmitted frequency), are
unique. In
fact, of all signatures that have more than a single signal, there are, at
most, three cities
that have the same signature. It should be noted that this is not an
exhaustive uniqueness
study for several reasons. First, transmitter locations do not necessarily
correspond to
registration cities. Second, the signature at any given location often depends
on
transmitters in surrounding cities as well as the current one. That is,
broadcast areas do
not correspond to city boundaries). Third, the signature within a given city
can vary due
to low power transmitters (e.g., with broadcast areas smaller than the city
boundaries) and
due to terrain and clutter effects (e.g., there can be more than one signature
per city).
Another important observation that can be made based on this registration data
is
that, regardless of the correspondence between transmitter locations and city
boundaries,
there are relatively low upper bounds on the number of transmitters for each
frequency in
Canada and the United States. That is, based on a single frequency, the
location of the
CA 02570861 2006-12-15
WO 2006/007442 PCT/US2005/021539
receiver can be determined to within less than 200 (maximum) possible
locations within
all of Canada and the United States. These findings provide clear support for
the systems
and methods of the present invention.
5.8 Experimental Model Development
Several drive tests in the Waterloo area were used to determine whether or not
generating baseline data for an empirical model was viable. The measured
signature for a
moving drive test in and around a portion of the Waterloo area is shown in Fig
7 before
normalization and in Fig. 8 after normalization. The figure shows the
approximate
variation of the various FM frequencies within the target area, indicating
that of a sensed
FM signature with signal peaks at 96.7, 98.5, 100.3, and 105.3 should
correspond to this
geographic region. To verify this, a comparison to transmitter registration
data was done.
While there are 110 cities with transmitters for 96.7, 81 cities with
transmitters for 98.5,
and 89 cities with transmitters for 105.3 (see Fig. 9), there is only one city
with all three
frequencies: Kitchener, Ontario. The presence of 100.3 effectively subdivides
the
broadcast regions for the Kitchener-based transmitters, as there is only a
signal for this
frequency in a portion of the test locations. It turns out that the
transmitter for this
frequency is a low power transmitter used for the University of Waterloo radio
station.
Thus, within the broadcast area of the Kitchener-based transmitters, only
those areas
within a certain distance of the University of Waterloo would yield FM
signatures that
include 100.3 FM. This is clear evidence that the systems and methods of the
present
invention can uniquely determine receiver location with a granularity smaller
than a
single broadcast region. This drive test also indicates that the systems and
methods of the
present invention will function using an empirical model by comparing sensed
FM
signatures to baseline data (such as the data collected for the Waterloo
region). The use
of empirical model such as that described in this example is only practical in
small target
areas. For larger areas, predictive models are preferable.
5.9 Signature Comparison
A declining threshold method can be used with either an empirical model or a
predictive model, as not all sources of error can be accounted for in either
model. Using a
declining threshold method on the data obtained from the Waterloo drive test
yields a set
of comparisons. First 98.5 and 105.3 are considered, because they are the
maximum
peaks. Already this places the receiver in a limited number of regions. As the
threshold
declines, 100.3 may or may not be considered depending on how close the
receiver is to
the University of Waterloo. The inclusion of 100.3 places the receiver in the
41
CA 02570861 2006-12-15
WO 2006/007442 PCT/US2005/021539
Waterloo/Kitchener region. Already, by considering three peak frequencies, the
receiver
position has been uniquely determined. If the frequency 100.3 is not included
in the
signature, then 96.7 is the next peak to cross the declining threshold. Use of
the
frequencies 96.7, 98.5, and 105.3, places the receiver within the Kitchener
broadcast
region. As the threshold continues to decline, the additional peaks of 88.3,
89.9, 91.5,
92.1, and 95.3 place the receiver in a subsection of the Kitchener broadcast
area where
these signals can be sensed.
At this point it should be noted that 98.7 and the multitude of signals in the
higher
portion of the FM band (above 102.5) were not considered in the declining
threshold
method. The higher portion of the FM band was not included in the declining
threshold
method because none of the frequencies (with the exception of 105.3, which was
included
in the comparison) are obvious peaks above their neighboring frequencies. This
illustrates the point that the declining threshold method of comparison only
considers
peak data. While the signature in Fig. 8 is locally normalized, only the
global FM floor
(that is, the floor common to all frequencies in the FM band) is removed in
order to
produce this normalization. A better method of normalization, such as a
windowing
method, would be more useful for differentiating between strong signals and
signal peaks.
5.10 Sources of noise
Several sources of noise affect the FM signature sensed by a receiver. To
isolate
the various kinds of noise, several targeted drive tests were conducted.
First, a test run
was performed from Waterloo to Toronto by measuring a few select frequencies
for =
which there is decent signal reception while on route from Waterloo to
Toronto. The
results of these measurements are shown in Figs. 10 and 11, with signal
strength plotted
against distance from the transmitter (using a J2 elliptical model for the
Earth to calculate
the absolute distance between the transmitter and receiver based on recorded
GPS
coordinates). These figures illustrate several important trends. Close to the
transmitter,
the recorded signal levels appear to be saturated, most likely due to
limitations in the test
hardware (representative of limitations that might be present in production
receivers).
While this has no ill effect on the FM signature at these locations, very
little information
about the noise characteristics of the signal can be gleaned at these
distances. Figures 10
and 11 also illustrate the general trend of the signal declination with
distance from the
transmitter, although the signal does not drop off as one might expect
(1/distance2 in free
space). This illustrates the importance of a correlation between the resulting
geopolygons
generated with a predictive model and the sensed signals using receiver
hardware. In
42
CA 02570861 2006-12-15
WO 2006/007442 PCT/US2005/021539
other words, the "signal level" recorded by the test hardware, representative
of production
receiver hardware, does not necessarily have a direct correspondence to the
Electromagnetic Field Levels that will be generated by a predictive model.
This reaffirms
the utility of a simple comparison methods, such as the declining threshold,
whereby the
location of the receiver is determined using only the most prevalent data
trends (e.g.,
signal peaks). The general trend observed in Figs. 10 and 11 also show how
that signals
degrade gradually with distance as opposed to sudden loss of reception. This
phenomenon significantly aids in the determination of location and direction,
as the
method of comparison can use weaker signal peaks to resolve the receiver
location within
a parent region defined by stronger signal peaks. If signal reception
terminated suddenly,
such granularity would not be obtainable.
Another observation that can be made from the results of the Waterloo-Toronto
drive test is related to sources of noise. Between 20 km and 100 km from the
transmitter,
the noise displays two main trends. Higher order noise, most likely
corresponding to
local clutter (both fixed and moving), transmitter variations, varying
antennae gain
characteristics, and local weather conditions can be observed at all
distances. Lower
frequency noise can also be observed, and is more obvious at distances further
from the
transmitters. As the transmitters selected are located in Toronto, distances
further away
correspond to areas with less ground clutter (hence less high frequency
noise), thus
making the low frequency effects more visible. This suggests that the lower
frequency
noise corresponds to more prevalent sources of error such as terrain effects.
A full
spectral analysis of the data shown in Figs. 9 and 10 could be used to provide
appropriate
error bounds that can be applied to the signal at any distance from the
transmitter.
More isolated tests have been conducted to verify the relationship between the
various frequencies of noise and their sources. A stationary test was
conducted in the
Waterloo area, in a relatively flat area with very little visible terrain
variation and almost
no ground clutter in the immediate area. The purpose of the test was to
determine the
error associated with variations in the radiated power from the transmitters,
with variable
antennae gain characteristics, and with weather conditions between transmitter
and
receiver. It should be noted that it is difficult to distinguish between these
sources of
noise with real-time data tests. From an operational perspective, there is no
need to
distinguish between them, as long as the error bounds are considered
reasonable. Thus,
these sources of error can be considered as one. It should also be noted that,
even in such
a remote location, local traffic was not completely absent. Fig. 12
illustrates the
measurements that were made. The few spikes present in Fig. 12 correspond to
times
43
CA 02570861 2006-12-15
WO 2006/007442 PCT/US2005/021539
when vehicles passed by. This leads to an important observation, the effects
of
transmitter, antennae, and weather variations are much smaller than those due
to local
clutter. Figures 13 (before normalization) and 14 (after normalization) show
the stationary
FM signature for this test location. It is clear from these plots that the
average signal error
is much less than that shown in figures 7 and 8 (corresponding to moving
tests),
reaffirming the observation that signal variations due to transmitter,
antennae, and
weather effects are much less than those associated with ground clutter and
terrain. As a
point of interest, it is also noted that the signature for the stationary
location (further
outside of town than for the moving test) is slightly different from that
obtained from the
moving Waterloo drive test (Figs. 7 and 8).
Some receiver-dependent characteristics also affect the sensed FM signature.
In
particular, the signal floor resulting from hardware limitations (DC offset,
settling time)
or from ambient noise in the FM band can significantly affect the form of the
FM
signature. As shown in Fig. 7, the un-normalized signature for the Waterloo
region
suggests signal reception from a wide variety of FM channels for which there
are no
transmitters present. Using the declining threshold method, only the peaks of
the
signature are important defining characteristics (and in Fig. 7, the peaks of
96.7, 98.5,
100.3, and 105.3 seem to be the most prevalent). A normalized version of the
FM
signature with the floor offset removed is shown in figure Fig. 8. This local
normalization emphasizes the defining peaks as relative values to all other
frequencies.
Again, it is clear that FM frequencies 96.7, 98.5, 100.3, and 105.3 are the
most important
defining frequencies, but the normalized plot also makes several other useful
results more
apparent. In particular, 88.3, 89.9, 91.5, 92.1, and 95.3 are displayed as
peaks above the
nominal values in the lower FM band. Based on transmitter registration data,
the
frequency 92.1 is broadcast from Brantford, Ontario; the frequency 88.3 is
broadcast from
Paris, Ontario; and the frequency 95.3 is broadcast from Hamilton, Ontario.
Since
Brantford, Paris, and Hamilton are all within broadcast range of the Waterloo
region, it
makes sense that their signals would appear as peaks in the Waterloo FM
signature. Since
89.9 and 91.5 are both broadcast from Windsor and Ottawa, both of which are
too far
from Waterloo for there to be a signal included in Waterloo's FM signature,
and since a
manual radio tuning to these frequencies resulted in audio radio reception, it
is evident
that the database of transmitters relied upon must not be complete. Building a
database of
signature-based regions from an incomplete list of transmitters would result
in an
incomplete or inaccurate database.
44
CA 02570861 2006-12-15
WO 2006/007442
PCT/US2005/021539
It should also be noted that the normalized data also emphasizes the error
associated with the various signals while driving around the Waterloo region.
This error,
along with those obtained through other targeted drive tests can be used as a
calibration
source. In this particular case, the major peaks corresponding to transmitters
in the
Waterloo/Kitchener region are sufficient to place the receiver within
Waterloo, and the
inclusion of the low-power University of Waterloo radio station (100.3)
subdivides this
region into two areas. The inclusion of additional signals from surrounding
regions will
most likely serve to subdivide the region further (distinguishing the southern
reception
areas for Waterloo/Kitchener transmitters from their northern regions).
Another
important observation relevant to signal calibration is the presence of
spectral leakage for
frequencies close to those of certain transmitters. Since transmitters in a
larger (parent)
region are usually separated by more than 200 kHz, the occurrence of an FM
signature
with two adjacent FM peaks is usually representative of spectral leakage
(easily observed
by tuning the radio to the next possible FM channel and being able to make out
the
sounds of the adjacent FM channel). The term "spectral leakage" is used
loosely here
because it is not clear whether or not this effect is due to transmitter
properties or due to
receiver properties. That is, it is possible that hardware limitations on the
FM tuner cause
this apparent problem. In some embodiments, this phenomenon is taken into
consideration in the method of comparison, so that signatures with and without
adjacent
signals are considered for matching with known signatures.
In preferred embodiments, the various sources of noise are accounted in order
to
improve the accuracy of the comparisons that are made. As described above,
several tests
(both stationary and moving) were performed to identify and isolate the
various sources
of noise. These tests resulted in the following observations.
Sources of noise include receiver limitations and variations (DC offset,
settling
time, saturation); atmospheric (cloud cover, precipitation, pressure);
multipath due to
fixed objects (terrain, stationary obstacles); multipath due to moving objects
(other
vehicles); and transmitter limitations and variations (power fluctuations).
Wherever
possible, noise should be taken into consideration in the development of the
radio
signatures 39 so that computation is minimized in the receiver. Only fixed
sources of
noise can be accounted for in this manner (terrain and stationary objects).
Receiver limitations will vary from receiver to receiver, and so must be taken
into
account locally (if any attempt is made to account for such effects).
Preferably, a method
of sensing that removes (or minimizes) this error should be used before signal
processing
is done so that one method of comparison can be used for all receivers.
CA 02570861 2006-12-15
WO 2006/007442 PCT/US2005/021539
For sample data that isn't saturated (due to receiver limitations), the noise
displays
two main trends. Higher order noise, most likely corresponding to local
clutter (both
fixed and moving), transmitter variations, varying antennae gain
characteristics, and local
weather conditions. Lower frequency noise can also be observed, and is more
obvious at
distances further from the transmitters. As the transmitters used for the
testing described
above are located in Toronto, distances further away correspond to areas with
less ground
clutter (hence less high frequency noise), thus making the low frequency
effects more
visible. This suggests that the lower frequency noise corresponds to more
prevalent
sources of error such as terrain effects.
It is extremely difficult to distinguish between noise due to transmitter
variations,
antennae limitations, and weather variations in a live environment.
Additionally,
stationary tests revealed that the effects of transmitter, antennae, and
weather variations
are much smaller than those due to local clutter. Several methods for dealing
with the
various sources of noise are presented below.
5.11 Sampling rate
Through the use of the test hardware described above (used to represent the
limitations of existing tuner modules), it was determined that the effects of
settling time,
as a result of frequency switching, can be minimized simply by using the
average values
of a large set of sample data. Thus each recorded value is the average of many
sampled
values. Both the sampling rate and the sampling interval can be selected to
minimize this
source of noise.
5.12 Normalization
It is desirable to remove (or reduce) the noise associated with receiver
limitations
before signal processing (or comparison) is done, so that the same algorithm
can be used
for all receivers. Through the various drive tests, it was observed that,
close to a
transmitter (typically within 20 km for high power transmitters), the recorded
signal
appeared to be saturated. It was also noted that there appeared to be a signal
floor
(minimum value higher than 0), most likely corresponding to a DC offset in the
tuner
module. While these receiver limitations have no real ill effect on the FM
signature at a
particular location, very little information about the noise characteristics
of the signal can
be gleaned in these ranges. Normalizing the data (removing the DC offset, and
only
considering non-saturated values) with receiver specific configuration values
provides a
receiver-independent data set that can then be analyzed. This data set was
then amplified
(as part of the normalization process) to increase the separation between data
peaks. This
46
CA 02570861 2006-12-15
WO 2006/007442 PCT/US2005/021539
was done to improve the quality of the signal processing. It should be noted
that, while
this amplification also served to exaggerate the effect of noise in the
signature, it most
likely increased the stability of the comparison method by reducing its
required
sensitivity.
5.13 Windowing (peak isolation)
Another important observation relevant to signal calibration is the presence
of
spectral leakage for frequencies close to those of certain transmitters. Since
transmitters
in a larger (parent) region are usually separated by more than 200 kHz, the
occurrence of
an FM signature with two adjacent FM peaks suggests spectral leakage (easily
observed
' 10 by tuning the radio to the next possible FM channel and being able to
make out the
sounds of the adjacent FM channel). The term "spectral leakage" is used
loosely here
because it is not clear whether or not this effect is due to transmitter
properties or due to
receiver properties. That is, it is possible that hardware limitations on the
FM tuner cause
this apparent problem. In preferred embodiments, this phenomenon is taken into
consideration in the method of comparison, so that signatures with and without
adjacent
signals are considered for matching with known signatures.
Only signal peaks are used in signature comparison in preferred embodiments of
the present invention. For example, in the experiments described above, a
simple
windowing method was used to remove the apparent "spectral leakage", and to
isolate the
true signal peaks. As this processing must be done in real time, in-vehicle,
the simplest
possible windowing method was used. For a particular window size, only
consider the
maximum value within the window. The size of the window is chosen to reflect
the
typical separation between active FM transmitter frequencies (so that the true
signal peaks
are not removed from the signature).
5.14 Peak detection
A declining threshold method (Fig. 3) can be used with either an empirical
model
or a predictive model, as not all sources of error can be accounted for in
either model.
The declining threshold method also has the advantage of simplicity, requiring
minimal
computation by effectively ignoring all but the most pertinent data. This
method also
provides for various levels of granularity, with very course predictions given
almost
instantly, and a more refined prediction after each iteration, until an exact
match is found.
Through drive tests, especially in the Waterloo area (described above),
various
observations were made that illustrate the benefits of the methods implemented
in the
present invention. First, the tests indicate that peak data is sufficient for
the unique
47
CA 02570861 2006-12-15
WO 2006/007442 PCT/US2005/021539
determination of the receiver's location within the target area (Canada and
the Continental
United States). Second, the general trend of recorded signal declination with
distance
from the transmitter is not necessarily as one might expect (1/distance2 in
free space).
That is to say, the signal level recorded by the test hardware (representative
of production
receiver hardware) does not necessarily have a direct correspondence to the
Electromagnetic Field Levels that will be generated by a predictive model.
Thus, with the
use of a predictive model that determines what the Electromagnetic Field
strength should
be at particular locations, a simple method of comparison could be used that
is, more or
less, independent of the particular unit of measure used. The declining
threshold method
is useful in this respect, as it can serve to compare to similar, but not
identical, entities.
Third, signals degrade gradually with distance (as opposed to sudden loss of
reception). This will significantly aid in the determination of location and
direction, as
the method of comparison will use weaker signal peaks to resolve the receiver
location
within the parent region (determined using stronger signal peaks). While a
direct binary
comparison (the signal is either present or not present) might return the same
signature for
two similar regions, the declining threshold method will provide the order in
which
individual signals should be considered, thereby differentiating between two
similar
regions with slightly different signal strengths.
Fourth, the method of comparison cannot be done algorithmically using
transmitter registration information alone, as there are currently no defined
relationships
between the registrations for different cities. That is, until the
transmitters are displayed
geographically and the broadcast regions are geo-encoded (or until a
sufficiently granular
set of empirical baseline data points are generated), there is no way to
determine that the
transmitter information data for two cities can be combined to form a single
signature (as
there is no way to algorithmically determine whether or not two cities are
close to each
other based on transmitter registration data).
5.15 Advanced error propagation models
As discussed earlier, wherever possible, fixed sources of noise should be
taken
into account when generating radio signatures 39 so that the amount of real-
time
computation (comparison) can be minimized.
It is not entirely clear how well empirical models account for the sources of
noise.
While the signatures at the exact recorded locations reflect the actual
signature that will
be received at that particular location, the signatures received within the
same region, but
not at that particular location, may not be identical. To illustrate, assume
that reference
data is collected in a grid-like manner, at points separated by 10 km. Each
reference
48
CA 02570861 2006-12-15
WO 2006/007442 PCT/US2005/021539
signature, then, would represent a 10 km by 10 km area. All received
signatures in that
area will not be identical (especially in an urban environment where there is
significant,
varying ground clutter). Two ways to avoid this problem with an empirical
model
include: reducing the grid size to improve accuracy, or using averages values
in a region
to determine a single representative FM signature. Reducing the grid size
could yield
extremely accurate results, but with significant cost in terms of development
and
maintenance. Using averaged values makes the inclusion of noise in the model
less clear.
What sort of processing would be required on a receiver to match such an
averaged
reference signature is, as yet, unknown.
Ideally, a model that includes specific sources of noise accurately, and other
sources of noise not at all, would provide for a robust system of comparison
in which the
receiver is responsible for filtering out only particular sources of noise. An
empirical
model with a very small grid size would be ideal for such a system, but very
impractical
to implement.
A predictive model that takes into account the effects of terrain and fixed
clutter is
suitable. This leaves the receiver with the following sources of noise to
filter out: receiver
limitations (which can be accounted for as described in the previous
sections),
atmospheric and transmitter variations (which have minimal effects, as
discussed
previously), and moving objects. In addition to helping minimize the effects
of receiver
limitations, using time-averaged values can also help to reduce the error
associated with
moving objects. Thus, a predictive model that can account for terrain and
fixed clutter
effects is a preferred in some embodiments of the present invention.
5.16 Alternative Signature Comparison: FM-Space Vector Comparison
As described previously, the set of frequencies 40 in, for example, the FM
radio
spectrum uniquely define a radio signature 39 that can then be correlated to a
geographic
location. Each frequency 40 in the radio signature 39 is independent of every
other
frequency 40. In other words, the field strength 42 for one frequency 40 in
the radio
signature 39 does not affect the field strength 42 for any other frequency 40
in the radio
signature 39. Therefore, it can be said that the set of frequencies define a
frequency
space, with each frequency representing an orthogonal basis vector. The
combination of
these basis vectors with scalar multipliers constitutes a vector (distance and
orientation)
within this frequency-space. That is, each radio signature 39 can be thought
of as a
unique vector in the frequency-space.
49
CA 02570861 2006-12-15
WO 2006/007442 PCT/US2005/021539
By treating the radio signatures 39 as vectors in frequency-space, normal
algebraic
functions can be applied to the radio signatures 39, herein called "position
vectors".
Thus, two position vectors can be quantitatively compared by determining the
angle
between them. In one embodiment, for example, this is done by finding the
scalar
product of the two position vectors, and dividing the result by the L-2 norm
of each of the
individual position vectors. The final result represents an angle between the
two position
vectors. The smaller the angle, the closer the two vectors are to each other
(meaning that
the two radio signatures represented by the two position vectors are closely
matched).
For illustrative purposes, a position vector compared to itself in this manner
yields an
angle of zero degrees. Such a result means that the two position vectors used
in the
comparison are identical. It should also be noted that the angle between two
position
vectors is independent of the magnitudes of the individual position vectors.
That means
that systematic errors resulting in constant amplification or attenuation of
all frequencies
in a radio signature 39 have no bearing on the comparison between two vectors.
Using this method of comparison, comparing the sensed radio signature to a set
of
predetermined signatures yields a 'closest match' result, meaning that the
current location
of radio 10 is geographically closest to the location corresponding to the
selected
predetermined signature. That is, each position vector @redetermined or not)
corresponds
to a single geographic location, and the comparison of two position vectors
corresponds
directly to the comparison of those two locations.
Further, larger geographic regions can correspond to regions in frequency-
space.
Thus, a sensed position vector can be used to determine placement in a larger
geographic
area, as well as closeness to a specific known location. Using this, not all
frequencies are
required for determination of location based on this method of comparison.
That is, a
smaller set of basis vectors (channels) can be used to determine a location
locally within a
smaller region of frequency-space. It has been found through experimentation
that the
statistical variance of each individual channel within the geographic region
in question is
a good indicator of whether or not a particular basis vector will be useful in
the
comparison. Particularly, channels with very little variance throughout a
geographic
region indicate that the region in frequency-space is more or less constant in
the direction
of that basis vector, while channels with large variances throughout the
geographic region
indicate that the region in frequency-space varies significantly in the
directions of those
basis vectors. The consequence of this is that the same (or close to the same)
result can be
achieved at a much lower cost (in terms of sampling time and required
computation).
CA 02570861 2006-12-15
WO 2006/007442 PCT/US2005/021539
It is important to note that this method is best used when each of the basis
vectors
(e.g., individual FM channels or, more generally, frequencies 40) is
independent. That is,
spectral leakage between adjacent FM channels should be accounted for before
this
method is applied to yield exact results. This requirement is more of an issue
in densely
populated urban areas where the FM band is heavily occupied. Regardless, the
amount of
spectral leakage can be accounted for based on the requirements set forth by
the FCC
regarding the overlapping of FM signals. A relatively accurate prediction can
be made
without taking this into consideration, as the amount of spectral leakage is
typically very
small, but even more accurate results can be obtained by accounting for this
error.
5.17 Radio Based Data Messaging Systems and Receivers
Referring now to Fig. 15, a data messaging system 10A is generally described.
In
some embodiments, system 10A uses an In-Band On-Channel (IBOC) Digital Audio
Broadcasting system, or a FM based radio data system (RDS). When system 10A
transmits using IBOC, receiver 12A is an HD Radio. Alternatively, when system
10A
transmits using RDS, receiver 12A is an RDS receiver. In other embodiments,
system
10A uses satellite radio or short-range wireless transmitters to transmit data
messages.
Although receiver 12A is anticipated as already being enabled to receive
digital
"sideband" transmission signals simultaneously with existing analog broadcast
or data
transmitted, in typical embodiments of the present invention receiver 12A is
modified so
that is can recognize and process location-specific data transmissions.. This
modification
is described in greater detail below.
The origin of the data that functions as the initial source for the eventual
text
message is anticipated as being a data stream such as third party information
stream 14A.
Data standards currently exist for the characterization and provision of
traffic information.
However, it is anticipated that other similar data streams can be substituted
analogously,
such as weather data, emergency notification information such as "amber alert"
information, or other third party applications or the like. The advantage of
the present
invention is that such data streams can be seamlessly integrated into an
existing radio
station format. This integration can be in a soft-context without interrupting
existing
programming, or in the case of an emergency, in a hard-context in which
existing
programming is interrupted. Another advantage of the present invention is
information
stream such as third party information stream 14Aincludes location identifiers
used by
receivers 12A to filter stream 14A. In this way, only those portions of stream
14A that
are relevant given the geographical position of the receiver are used. In some
51
CA 02570861 2006-12-15
WO 2006/007442 PCT/US2005/021539
embodiments, filter stream 14A comprises multiple programs, each associated
with a
location code.
In step 16A, raw or previously processed information from the third party
information stream 14A is enabled for use by converting it from generic
content to a
series of data packets 17 each comprising a location code 17a and a
corresponding event
code 17b. Location code 17a is fixed to a specific geographic reference, and
is linked to
an event code 17b that corresponds to a specific event relevant to a specific
location. For
example, event code 17b could be weather or traffic conditions at the location
represented
by the corresponding location code. In another example, the event code 17b is
an
advertisement that is target to listeners in the location represented by the
corresponding
location code. In some embodiments event code 17b corresponds to a specific
reportable
event of interest to a specific location. In some embodiments, in step 16A,
raw or
previously processed information is enabled for use by converting it from
generic content
to a plurality of programs each associated with a unique location code 17a.
By way of example, but not as a limitation, in a traffic reporting scenario a
location code representing the interchange of Interstate 95 and Interstate 295
is given a
fixed location code, with reportable events corresponding to real-time
activity at that
location selected from a pre-determined table of reportable events (e.g., lane
closures,
accidents, a disabled vehicle warning, or other types of obstructions, as well
as link
impedance determinations such as "traffic at 30% capacity" or "traffic moving
at 45 mph"
type of standard Traffic and Traveler Information). Once the data is enabled
for use by
formatting it with linked location codes, it is optionally reformatted for use
in the
transport infrastructure (step 18A). In some embodiments such reformatting is
not
necessary. Next the reformatted data is inserted into the radio transmission
stream in step
20A for transmission. In some embodiments, this transmission occurs using an
HD radio
or RDS transmitter. In other embodiments, this transmission occurs using a
transmitter
that transmits an FM frequency spectrum (e.g., a frequency within 88-108 MHz),
an AM
frequency spectrum (e.g., a frequency within 520-1500 KHz), a medium frequency
(MF) band (e.g., a band within 300 KHz-3 MHz), a high-frequency (HF) band
(e.g., a
band within 3-30 MHz), or a very high-frequency (VHF) band (e.g., a band
within 30-
300 MHz). Furthermore, in some embodiments this data will be transmitted by a
satellite radio transmitter, such as an XM or Sirus radio transmitter, or a
short-range
wireless transmitter, such as an IrDA, Bluetooth, Wi-Fi, ZigBee, or UWB
transmitter, or
any other wireless data transmitter.
52
CA 02570861 2006-12-15
WO 2006/007442 PCT/US2005/021539
Furthermore, in some embodiments, multiple data messages, each containing an
event and location code, are transmitted simultaneously at a common frequency
by a
wireless data transmitter. In some embodiments, each event is in fact a
program. An
exemplary program is text messages associated with a unique location. For
example,
consider the case of Disney World which has multiple theme parks. A visitor
arrives at
Disney World. Disney would like to provide information and other programming
information to the visitor. However, to enhance the value of the programming
information, Disney would like to customize the programming based upon the
actual park
in Disney World that the visitor is located. For example, if the visitor is in
Epcot center,
Disney would like to broadcast information related to that theme park and if
the visitor is
in the Magic Kingdom, Disney would like to broadcast information related to
that theme
park. Using the systems and methods of the present invention, Disney can
accomplish
this goal by operating a single channel that is able to broadcast several
different data
message programs over a single wireless frequency. Each of the message
programs is
associated with a unique location code. Then, for instance, visitors with
radios such as
radio 10 of Fig. 1 that enter the Epcot parking lot will be able to tune into
Disney's
wireless frequency (e.g., a dedicated FM channel or other frequency as
disclosed herein)
and receive only parking information and park hours related to Epcot Center.
This is
because, in this example, the location code associated with Epcot center is
the only code
that matches the global position associated with the visitor's radio.
Likewise, visitors
entering the Magic Kingdom parking lot will be able to tune into the same
wireless
frequency operated by Disney, but these Magic Kingdom visitors will receive
parking
information and park hours for the Magic Kingdom using the same processing
techniques.
The present invention is highly advantageous because of the use of data with
location codes that allow for the geographic targeting of data signals. Such
location codes
can be used in two ways, in accordance with the present invention. First, they
can be used
by a central server to selectively send the data to only those transmitters
that are in the
geographic region that encompasses the geographic location corresponding to
such
location codes. Second, they can be used by radio receivers to selectively
process the
data.
The transmitters of the present invention can be used with any type of radio
that
(i) can process an RDS, HD, satellite radio, or short-range wireless signal
and (ii) has
availability to a global positioning feed or some other source of geographical
position
information. In some embodiments, the needed source of geographical position
information is provided in the receiver's memory in the form of a lookup table
storing a
53
CA 02570861 2006-12-15
WO 2006/007442 PCT/US2005/021539
pre-determined required list of location codes. This lookup table can be
provided to the
radio in many different ways. In some embodiments, the lookup table is
programmed into
a programmable logic device. In some embodiments, the lookup table is provided
in the
form of computer readable media such as a CD, DVD, RAM, ROM, or flash memory.
In
some embodiments, the radio further includes a table of event codes that
equate signals
for certain events. In some embodiments, the global positioning feed is not
provided in a
predetermined lookup table. For example, in some embodiments, the location
information is obtained using a conventional global positioning system. In
still other
embodiments, receiver 12A of Fig. 15 is in fact exemplary radio receiver 10 of
Figure 1A.
For example, the event code "01 can stand for a traffic accident and the like.
In some embodiments, the radio receiver uses the radio signature comparison
module 32 to determine the global position of the radio receiver at a given
point in time.
The receiver then compares this newly determined global position 62 to the
location
codes transmitted within a wireless signal and received by the radio receiver.
If the
receiver finds a match between the newly found global position 62 and the
transmitted
location code, then the radio display module 34 identifies the event code
corresponding to
the location code. Display module 34 then performs a table lookup using the
stored
lookup table of event codes in order to find the event information that
matches the
identified event code.
In some embodiments, the event code relates to traffic or weather information.
In
some embodiments, the event code is associated with a detailed street map of
the
geographic area represented by its corresponding location code. Now that an
overview of
the process by which a central server reformats third party data with location
codes and
event codes has been presented, in conjunction with Fig. 15, an exemplary
radio
transmitter architecture will be presented in conjunction with Fig. 16. The
system
illustrated in Fig. 16 can be used for a third party information stream such
as weather
50A, traffic 52A, or any other specialized third party, or proprietary data
that can be
specialized for a particular purpose 54A. Such third party data is
distinguished by the fact
that it is not the main featured radio programming data. For example, the
third party data
is typically not a DJ voice over, music, or other programs. Rather, the third
party data is
typically text messages that convey, for example, weather information, traffic
information, recall notices, advertisements, or alarms that signify important
events.
However, in some embodiments, the third party data can in fact interrupt the
main
featured broadcasting. Such an interrupt can occur when there is a natural
disaster or
other form of emergency.
54
CA 02570861 2006-12-15
WO 2006/007442 PCT/US2005/021539
In some embodiments, third party data (e.g., weather 50, traffic 52, third
party
data 54, etc.) is conveyed to a server 60A in an XML based format. Such a
format is
particularly advantageous because of it allows for the encoding of a
comprehensive set of
commands for controlling the third party data. For example, the XML feed can
include
location information, event information, and priority information. Priority
information
can instruct the server to interrupt main programming if necessary. In some
embodiments, current standards that utilize an extensible markup language
(XML) can be
used, thereby allowing the present invention to become immediately deployable.
However, in some embodiments future changes or additions, such as changes in
event
terminology, as well as migration of existing terminology to various language
translations
is necessary. In any event, the third party data source (e.g. 50A, 52A, 54A)
is
communicated to central server 60A via any traditional communications means
62A. For
instance, the information can be communicated by a serial or LAN connection
62A and/or
a secure socket connection 63A or any other wire based or wireless based
communication
system known the art.
Central server 60A receives the third party content (generic content) (Fig.
15, step
14A) enables it for use (Fig. 15, step 16A), and forwards the content to a
distributed
network server 64A, after performing some general functions. First, central
server 60A
validates the general information. For instance, the general. information is
checked for
quality and consistency. Further, not all the generic data that is received by
central server
60A will necessarily be broadcasted. In some instances, for example, central
server 60A
will remove unqualified data or events. In some embodiments, central server
60A
performs this filtering function by looking at the priority information that
is optionally
encoded in the third party data. In some embodiments, central server 60A
performs this
filtering function by looking at the location based information that is
encoded in the third
party data. In some embodiments the third party data is embedded in XML
commands
and such location information and/or priority information is also found within
the XML
command.
Central server 60A reformats the generic data for broadcast. In some
embodiments such reformatting involves linking the data with proper event
codes and
location codes. In some embodiments the third party data already has the
proper location
codes and event codes and such reformatting in not necessary.
Optionally, central server 60A also filters the third party data for use by
specific
distributed network servers. The basis for such a filtering step is the
recognition that, in
some instances, the generic data does not need to be transmitted to every
distributed
CA 02570861 2013-03-07
WO 2006/007442
PCT/US2005/021539
network server 64A. For instance, in some embodiments central server 60A will
filter the
entire pool of third party data and sort by the relevant distributor network
server's general
location. Then, the validated, formatted and filtered data 66A is transmitted
to one of the
potentially many distributed network servers 64A as a function of location.
For example,
consider the case in which there are two network servers 64A, one located in
state A and
the other located in state B. In this example, central server 60A will
transmit data to the
network server 64A in state A when such data has location codes consistent
with state A.
Central server 60A will transmit data to the network server 64A in state B
when such data
has location codes consistent with state B. Each network server 64A, in turn,
reformats
the data consistent with the applicable transport infrastructure (Fig. 15,
18A) and insert
the data into the radio transmission stream 20A for transmission within the
corresponding
HD radio or RDS envelop associated with the network server 64A. This can be
done at
the local radio station level through the use of an In-Band On-Channel (IBOC)
Digital
Audio Broadcasting system converter, an e-Radio TIC-XML converter 70A, or
equivalent. In some embodiments, such formatting is done at the central server
60A level
and network servers 64A are not required.
6. CONCLUSION
The present invention can be implemented as a computer program product that
comprises a computer program mechanism embedded in a computer readable storage
medium. For instance, the computer program product could contain the program
modules
shown in Fig. I. These program modules may be stored on a CD-ROM, DVD,
magnetic
disk storage product, or any other computer readable data or program storage
product.
The software modules in the computer program product can also be distributed
electronically, via the Internet or otherwise, by transmission of a computer
data signal (in
which the software modules are embedded) on a carrier wave.
56