Note : Les descriptions sont présentées dans la langue officielle dans laquelle elles ont été soumises.
CA 02581466 2007-03-12
1
TITLE OF THE INVENTION
A method and a system for automatic evaluation of digital files
FIELD OF THE INVENTION
[0001] The present invention relates to a method and a system for
automatic evaluation of digital files. More specifically, the present
invention is
concerned with a method for dynamic hit scoring.
BACKGROUND OF THE INVENTION
[0002] A number of files classification or prediction methods have
been developed over the years.
[0003] Li et al. (US 2004/0231498) present a method for music
classification comprising extracting features of a target file; extracting
features
of a training set; and classifying music signals.
[0004] Blum et al. (US 5,918,223) describe a method for classifying
and ranking the similarity between individual audio files comprising supplying
sets containing the features of classes of sound to a training algorithm
yielding
a set of vectors for each class of sound; submitting a target audio file to
the
same training algorithm to obtain a vector for the target file; and
calculating the
correlation distance between the vector for the target file and the vectors of
each class, whereby the class which has the smallest distance to the target
file
is the class assigned to the target file.
CA 02581466 2007-03-12
2
[0005] Alcade et al. (US 7,081,579, US 2006/0254411) teach a
method and system for music recommendation, comprising the steps of
providing a database of references, and extracting features of a target file
to
determine its parameter vector using a FTT analysis method. Then the distance
between the target file's parameter vector and each file's parameter vector of
the database of references is determined to score the target file according to
the target file's distance with each file of database of references via a
linear
regression method.
[0006] Foote et al. (US 2003/0205124), Platt et al. (US
2006/0107823), Flannery et al. (US 6,545,209) present methods for classifying
music according to similarity using a distance measure.
[0007] Gang et al. (US 2003/0089218) disclose a method for
predicting musical preferences of a user, comprising the steps of building a
first
set of information relative to a catalog of musical selection; building a
second
set of information relative to the tastes of the user; and combining the
information of the second set with the information of the first set to provide
an
expected rating for every song in the catalog.
[0008] There is a need in the art for a method for dynamic hit
scoring.
SUMMARY OF THE INVENTION
[0009] More specifically, there is provided a method for automatic
evaluation of target files, comprising the steps of building a database of
reference files; for each target file, forming a training set comprising files
from
the database of reference files and building a test set from features of the
CA 02581466 2007-03-12
3
target file; dynamically generating a learning model from the training set;
and
applying the learning model to the test set, whereby a value corresponding to
the target file is predicted.
[0010] There is further provided a method for automatic evaluation
of songs, comprising the step of building a database of hit songs; for each
song
to be evaluated, forming a training set comprising songs from the database of
hit songs and building a test set from features of the song to be evaluated;
dynamically generating a learning model from the training set; and applying
the
learning model to the test set; whereby a score corresponding to the song to
be
evaluated is predicted.
[0011] Other objects, advantages and features of the present
invention will become more apparent upon reading of the following non-
restrictive description of embodiments thereof, given by way of example only
with reference to the accompanying drawings.
BRIEF DESCRIPTION OF THE DRAWINGS
[0012] In the appended drawings:
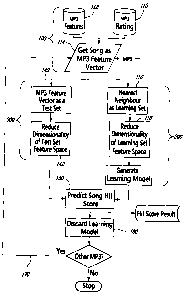
[0013] Figure is a flow chart of an embodiment of a method
according to an aspect of the present invention; and
[0014] Figure 2 illustrates a class separating hyperplane in a
Support Vector Model technique used in the method of Figure 1.
CA 02581466 2007-03-12
4
DESCRIPTION OF EMBODIMENTS OF THE INVENTION
[0015] An embodiment of the method according to an aspect of the
present invention generally comprises an analysis step (step 100) and a
dynamic scoring step (step 200).
[0016] The method will be described herein in the case of music files
for example, in relation to the flowchart of Figure 1.
[0017] In the analysis step (step 100), a database of reference files
is built. In the case of music files, the database of reference files
comprises hit
songs for example.
[0018] A number of files, such as MP3 files or other digital format,
for example, of songs identified as hits are gathered, and numerical features
that represent each one of them are extracted to form n-dimensional vectors of
numerical features that represent each file, referred to as feature vectors,
as
well known in the art.
[0019] A number of features, including for example timbre, rhythm,
melody frequency etc, are extracted from the files to yield feature vectors
corresponding to each one of them. In a hit score method, a number of 84
features were extracted for example.
[0020] The feature vectors are stored in a database along with
relevant information, such as for example, artist's name, genre etc (112).
Each
MP3 file is rated, according to a predefined scheme, and also stored in a
database (113).
CA 02581466 2007-03-12
[0021] The references files, here exemplified as hit songs MP3, are
selected according to a predefined scheme of rating. In the case of hit songs,
scoring may originate from a number of sources, including for example,
compilation of top 50 rankings, sales, air play etc.
[0022] For each target file, i.e. each song to be assessed in the
present example, numerical features that represent the target file are
extracted
to form corresponding feature vectors (114).
[0023] The dynamic scoring step (step 200) generally comprises a
learning phase and a predicting phase.
[0024] In the learning phase, files from the reference database in
regards to which the target file will be assessed are selected in a training
set.
The training set is built by finding n closest feature vectors of the target
file's
feature vector in the database of feature vectors of the hits (116). The
distance/similarity between the target file's feature vector and each feature
vector of the database of hits may be determined by using the Euclidian
distance, the cosine distance or the Jensen-Shannon distribution similarity,
as
well known to people in the art.
[0025] The training set is then simplified by reducing its dimension
(118), but using either Principal Component Analysis (PCA) or Singular Value
Decomposition (SVD) for example or non linear regression techniques known
in the art such as (but not limited to): Neural Networks, Support Vector
Machines, Generalized Additive Model, Classification and Regression Tree,
Multivariate Adaptative Regression Splines, Hierarchical Mixture of Experts,
Supervised Principal Component Analysis.
CA 02581466 2007-03-12
6
[0026] PCA is an orthogonai linear transformation that transforms
the data to a new coordinate system such that the greatest variance by any
projection of the data comes to lie on the first coordinate (called the first
principal component), the second greatest variance on the second coordinate,
and so on. PCA can be used for dimensionality reduction in a data set while
retaining those characteristics of the data set that contribute most to its
variance, by keeping lower-order principal components and ignoring higher-
order ones. Such low-order components often contain the "most important"
aspects of the data. But this is not necessarily the case, depending on the
application.
[0027] The main idea behind the principal component analysis is to
represent multidimensional data with less number of variables retaining main
features of the data. It is inevitable that by reducing dimensionality some
features of the data will be lost. It is hoped that these lost features are
comparable with the "noise" and they do not tell much about underlying
population.
[0028] PCA is used to project multidimensional data to a lower
dimensional space retaining as much as possible variability of the data. This
technique is widely used in many areas of applied statistics. It is natural
since
interpretation and visualization in a fewer dimensional space is easier than
in
many dimensional space. Especially, dimensionality can be reduced to two or
three, then plots and visual representation may be used to try and find some
structure in the data.
CA 02581466 2007-03-12
7
[0029] PCA is one of the techniques used for dimension reductions,
as will now be briefly described.
[0030] Suppose M is an m-by-n matrix whose entries come from the
field K, which is either the field of real numbers or the field of complex
numbers.
Then there exists a factorization of the form
M= UEV*
where U is an m-by-m unitary matrix over K, the matrix I is m-by-n with
nonnegative numbers on the diagonal and zeros off the diagonal, and V
denotes the conjugate transpose of V, an n-by-n unitary matrix over K. Such a
factorization is called a singular-value decomposition of M.
[0031] The matrix V thus contains a set of orthonormal "input" or
"analysing" basis vector directions for M. The matrix U contains a set of
orthonormal "output" basis vector directions for M. The matrix F contains the
singular values, which can be thought of as scalar "gain controls" by which
each corresponding input is multiplied to give a corresponding output.
[0032] A common convention is to order the values 7;,; in non-
increasing fashion. In this case, the diagonal matrix 7- is uniquely
determined by
M (though the matrices U and V are not).
[0033] Assuming zero empirical mean (the empirical mean of the
distribution has been subtracted from the data set), the principal component
w,
of a data set x can be defined as:
CA 02581466 2007-03-12
8
w, = arg max i var {w'x} = a.rg ~mi E I (wTx) 2
i ~
W~.~ ~ =1
[0034] With the first k - 1 components, the k-th component can be
found by subtracting the first k - 1 principal components from x:
k-1
lik-1 = X - ~ WiT-'4T'TX
i=1
and by substituting this as the new data set to find a principal component in
:~
Wk = aY~ 1~~1~. E (WTJ~I~-1) 1 =
IIWII=r
[0035] The PCA transform is therefore equivalent to finding the
singular value decomposition of the data matrix X,
X = ~EVT )
and then obtaining the reduced-space data matrix Y by projecting X down into
the reduced space defined by only the first L singular vectors, WL:
y = WLTX = EI,VL3'
[0036] The matrix W of singular vectors of X is equivalently the
matrix W of eigenvectors of the matrix of observed covariance C = X XT,
CA 02581466 2007-03-12
9
.~X'T = WE 2 w T
[0037] It is often the case that different variables have completely
different scaling. For examples one of the variables may have been measured
in meters and another one in centimeters (by design or accident). Eigenvalues
of the matrix is scale dependent. If one column of the data matrix X is
multiplied
by some scale factor (say s) then variance of this variable is increase by S2
and
this variable can dominate whole covariance matrix and hence the whole
eigenvalues and eigenvectors. It is necessary to take precautions when dealing
with the data. If it is possible to bring all data to the same scale using
some
underlying physical properties then it should be done. If scale of the data is
unknown then it is better to use correlation matrix instead of the covariance
matrix. It is in general a recommended option in many statistical packages.
[0038] It should be noted that since scale affects eigenvalues and
eigenvectors then interpretation of the principal components derived by these
two methods can be completely different. In real life applications care should
be
taken when using correlation matrix. Outliers in the observation can affect
covariance and hence correlation matrix. It is recommended to use robust
estimation for covariance (in a simple case by rejecting of outliers). When
using
robust estimates covariance matrix may not be non-negative and some
eigenvalues might be negative. In many applications, it is not important since
only the principal components corresponding to the largest eigenvalues are of
interest.
[0039] In either case, the number of significant variables (principal
axis or singular axis) is kept to a minimum. There are many recommendations
for the selection of dimension, as follows.
CA 02581466 2007-03-12
[0040] i) The proportion of variances : if the first two components
account for 70%-90% or more of the total variance then further components
might be irrelevant (See problem with scaling above).
[0041] ii) Components below certain level can be rejected. If
components have been calculated using a correlation matrix, often those
components with variance less than 1 are rejected. It might be dangerous.
Especially if one variable is almost independent of others then it might give
rise
to the component with variance less than 1. It does not mean that it is
uninformative.
[0042] iii) If the uncertainty (usually expressed as standard
deviation) of the observations is known, then components with variances less
than that, certainly can be rejected.
[0043] iv) If scree plots (scree plot is the plot of the eigenvalues, or
variances of principal components, against their indices) show elbow then
components with variances less than this elbow can be rejected.
[0044] According to a cross-validation technique, one value of the
observation is removed (x;j) then, using principal components, this value is
predicted and it is done for all data points. If adding the component does not
improve prediction power, then this component can be rejected. This technique
is computer intensive.
[0045] PCA was described above as a technique, in Step 118, for
reducing dimensionality of the learning set feature space, the learning set
comprising nearest neighbors from the target file.
CA 02581466 2007-03-12
11
[0046] Based on these n closest feature vectors, a learning model is
dynamically generated (130), using a well-known theoretical algorithm called
Support Vector Model (SVM) for example, as will now be described, using a
software MCubixTM developed by Diagnos Inc. for example.
[0047] SVM is a supervised learning algorithm that has been
successful in proving itself an efficient and accurate text classification
technique. Like other supervised machine learning algorithms, an SVM works
in two steps. In the first step - the training step - it learns a decision
boundary in input space from preclassified training data. In the second step -
the classification step - it classifies input vectors according to the
previously
learned decision boundary. A single support vector machine can only separate
two classes - a positive class (y = +1) and a negative class (y = -1).
[0048] In the training step the following problem is solved. A set of
training examples S, ={(xj,yj),(x2,y2),...,(xj,y~)} of size 1 from a fixed but
unknown
distribution p(x,y) describing the learning task is given. The term-frequency
vectors x; represent documents and y; = 1 indicates whether a document has
been labeled with the positive class or not. The SVM aims to find a decision
rule h c: x-+ {-1,+1} that classifies the documents as accurately as possible
based on the training set Si.
[0049] An hypothesis space is given by the functions f(x) = sgn(wx +
b) where w and b are parameters that are learned in the training step and
which determine the class separating hyperplane, shown in Figure 2.
Computing this hyperplane is equivalent to solving the following optimization
problem:
CA 02581466 2007-03-12
12
1 '
t '(w. b. 2, ww 4' C57;,
minimize: 71
t'(W, b. ~ vt~w-- ~:"
subject to: [0050] The constraints require that all training examples are
classified correctly, allowing for some outliers symbolized by the slack
variables
i; ;. If a training example lies on the wrong side of the hyperplane, the
corresponding i; ; is greater than 0. The factor C is a parameter that allows
for
trading off training error against model complexity. In the limit C---). - no
training error is allowed. This setting is called hard margin SVM. A
classifier
with finite C is also called a soft margin Support Vector Machine. Instead of
solving the above optimization problem directly, it is easier to solve the
following dual optimisation problem:
+ 2-
minimize:
0
subject to:
[0051] All training examples with a; > 0 at the solution are called
support vectors. The Support vectors are situated right at the margin (see the
solid circle and squares in Figure 2) and define the hyperplane. The
definition
of a hyperplane by the support vectors is especially advantageous in high
dimensional feature spaces because a comparatively small number of
parameters - the a in the sum of equation - is required.
CA 02581466 2007-03-12
13
[0052] SVM have been introduced within the context of statistical
learning theory and structural risk minimization. In the methods one solves
convex optimization problems, typically quadratic programs. Least Squares
Support Vector Machines (LS-SVM) are reformulations to standard SVM. LS-
SVM are closely related to regularization networks and Gaussian processes but
additionally emphasize and exploit primal-dual interpretations. Links between
kernel versions of classical pattern recognition algorithms such as kernel
Fisher
discriminant analysis and extensions to unsupervised learning, recurrent
networks and control also exist.
[0053] In order to make an LS-SVM model, two hyper-parameters
are needed, including a regularization parameter y, determining the trade-off
between the fitting error minimization and smoothness, and the bandwidth ul,
at least in the common case of the RBF kernel. These two hyper-parameters
are automatically computed by doing a grid search over the parameter space
and picking the minimum. This procedure iteratively zooms to the candidate
optimum.
[0054] As the learning model is thus generated (130), in the
predicting phase (300), a test set is built from the features of the target
file
(140), and the test set feature space dimensionality is reduced (142) as known
in the art, by using a technique such as Principal component analysis (PCA) or
Singular Value Decomposition (SVD), keeping the same number of significant
variables (principal axis or singular axis) as the number of significant
variables
used in the learning set, as described hereinabove.
[0055] Then, the learning model generated in step 130 is applied to
the test set, so as to determine a value corresponding to the target song
(150).
CA 02581466 2007-03-12
14
The rating of the target file is based on the test set and the learning set,
the
target file being assessed relative to the training set.
[0056] A storing phase may further comprise storing the predicted
values in a result database.
[0057] The learning model is discarded after prediction for the target
file (160), before the method is applied to another file to be evaluated
(170).
[0058] As new files (hit songs) in the database of reference file
appear, the training set is rebuilt by updating the closest neighbours and
hyper-
parameters are automatically updated, resulting in a dynamic scoring method.
[0059] As people in the art will appreciate, the present method
allows an automatic learning on a dynamic neighbourhood.
[0060] As exemplified hereinabove, the method may be used for
pre-selecting songs in the contest of a hit contest for example, typically
based
on the popularity of the songs.
[0061] Depending on a nature of the scale used for evaluation, the
present adaptative method may be applied to evaluate a range of type of files,
i.e. compression format, nature of files etc... with an increased accuracy in
highly non-linear fields, by providing a dynamic learning phase.
[0062] Although the present invention has been described
hereinabove by way of embodiments thereof, it may be modified, without
CA 02581466 2007-03-12
departing from the nature and teachings of the subject invention as defined in
the appended claims.