Note : Les descriptions sont présentées dans la langue officielle dans laquelle elles ont été soumises.
CA 02630411 2008-05-20
WO 2007/058662 PCT/US2005/042470
METHOD FOR FIELD SCALE PRODUCTION OPTIMIZATION
2
3
4 TECHNICAL FIELDS
6 The present invention relates generally to methods for controlling
hydrocarbon
7 production from a field of wells, and more particularly, to methods for
8 optimizing production by enhancing fluid flow rate allocations among the
9 wells.
11 BACKGROUND OF THE INVENTION
12
13 Field scale optimization is known which attempts to optimize or enhance
the
14 production of production fluids, including hydrocarbons, from a field
containing
one or more subterranean reservoirs. Wells or well bores connect the
16 reservoirs with surface facilities which collect and process the
captured
17 production fluids. Typically, these production fluids include the
components of
18 oil, gas and water. Chokes or flow control devices are used to adjust
the
19 allocation of flow rates among the well bores in a field. The relative
quantities
and ratios of production of the different components of oil, gas and water for
21 an individual well bore can be controlled by adjusting a choke to change
the
22 pressure in a well bore.
23
24 Surface facilities are needed to produce and process the production
fluids.
These facilities may include apparatus such as separators, pumps, storage
26 tanks, compressors, etc. Ideally, the capital expenditures on these
facilities
27 are minimized by employing the smallest and least expensive surface
facilities
28 possible. However, fluid handling capacity should be sufficiently large
so as
29 not to unduly limit the production rate of the economically desirable
oil and/or
gas. Hence, the allocation of fluid flow in the well bores is ideally
optimized to
31 maximize monetary return while meeting production constraints such as
those
32 imposed by the fluid handling capacities of the surface facilities.
-1-
CA 02630411 2008-05-20
WO 2007/058662 PCT/US2005/042470
Optimization techniques are used predict the optimal allocation of fluid flows
2 in well bores for a given set of production constraints. First, a
reservoir
3 simulator is used to mathematically model the flow of fluids throughout a
field
4 including the reservoirs and well bores. The simulated flow is used to
establish component flow rate curves or rate equations for each well bore
6 which describe how the flow rate of one component, such as water, relates
to
7 the flow rate of another component, i.e., oil. Typically, an objective
function is
8 created which seeks to optimize an objective such as maximizing oil
9 production or minimizing water production. The objective function
incorporates the flow rates from the well bores which are predicted by the
11 reservoir simulation. A set of production constraints, such as oil
production
12 targets or gas or water production limitations for the field, are
specified.
13 Constraint equations are generated to meet these production constraints.
14 The fluid flow among the well bores must adhere to these production
constraints. The objective function is then optimized by a subroutine,
referred
16 to as an optimizer, to determine the optimal allocation of flow rates
among the
17 well bores. The optimizer utilizes the well bore component flow rate
equations
18 and constraint equations in the optimization process.
19
A first shortcoming of typical field scale optimization schemes is that
feasible
21 solutions to an optimization may not be possible for specified
production
22 constraints. For example, a certain level of oil production may be
desired
23 while not producing more than a specified quantity of water. A feasible
24 solution to the objective function with this set of constraints may not
be
possible. In this event, one or more of the constraints must be adjusted and
26 the reservoir simulator and optimizer run again to determine when a
feasible
27 solution is possible. Such iterative runs in solving numerous
optimizations of
28 the objective function are computationally intensive and undesirable.
29
A second problem in some optimization schemes is that while a feasible
31 solution to the optimization of the objective function may be achieved,
the
32 results may not be practical. For example, in a first run or time step,
the
33 optimizer may determine that a first well bore should produce at a high
level
-2-
CA 02630411 2008-05-20
WO 2007/058662 PCT/US2005/042470
1 while a second well bore is substantially closed down. In the next time
step,
2 the optimizer may suggest that the second well bore produce at a high
level
3 while the first well bore is substantially shut down. Therefore,
production from
4 the well bores may oscillate if the suggested allocations from the
optimizer are
followed. Generally, it is more practical if the production from well bores
6 having similar fluid flow characteristics are at a consistent level. This
would
7 minimize the oscillations in production from the related well bores over
time
8 steps.
9
A third shortcoming is that creating component flow rate curves or equations
11 for the production of fluids from a well bore can be computationally
intensive.
12 One method of calculating these rate curves is to create a sub model of
the
13 well bores and surrounding reservoirs and iteratively solve for the
production
14 rates of the components, i.e., oil, gas and water, as the chokes are
opened
and the pressure draw downs between the reservoirs and the well bores are
16 increased. Typically, several Newton iterations must be performed to
produce
17 each data point relating the production of one component relative to
another
18 component for a given pressure draw down in a well bore. Again, the
19 pressure draw down in a well bore is related to how open is a choke
controlling the well bore. This process is repeated many times until enough
21 data points, perhaps as many as 30-50 data points, have been calculated
22 such that an overall flow rate curve or equation can be developed. The
23 optimizer then uses the rates curves or equations during the
optimization of
24 the objective function. Generating data points using these many Newton
iterations to create rate curves or equations is computationally costly.
26
27 The present invention provides solutions to the above described
shortcomings
28 of conventional field scale optimization schemes. First, an objective
function
29 and associated constraint equations are generated which can be solved in
a
single run of an optimizer to produce a feasible solution. Second, constraint
31 equations may be created which requires the rates of production from
similar
32 well bores to be related to prevent significant oscillation of well
rates between
33 time steps of a reservoir simulation. Finally, an efficient method of
generating
-3-
CA 02630411 2008-05-20
WO 2007/058662
PCT/US2005/042470
well bore component flow rate curves or equations relating production rates
2 between fluid components of a well bore is described.
3
4 SUMMARY OF THE INVENTION
6 The present invention includes a method for enhancing the allocation of
fluid
7 flow rates among a plurality of well bores in fluid communication with at
least
8 one subterranean reservoir. Fluid flow is simulated, using a numerical
9 reservoir simulator, in at least one subterranean reservoir and in a
number of
well bores in fluid communication with the subterranean reservoir.
11 Component flow rate equations are generated from the simulated flow in
the
12 well bores. Production constraints are selected with at least one of the
13 production constraints ideally being a soft constraint which may be
violated if
14 necessary during an optimization process to provide a feasible solution.
Constraint equations corresponding to the production constraints are also
16 generated.
17
18 An objective function is generated which corresponds to the fluid flow
in the
19 well bores. The objective function may also include constraint violation
penalties which correspond to the soft constraints and soft constraint
21 equations. The objective function is then optimized utilizing the
component
22 flow rate equations and the constraint equations to determine an
enhanced
23 allocation of fluid flow rates among the well bores. If necessary, soft
24 constraints may be violated to achieve a feasible solution to the
optimizing of
the objective function. The presence of the constraint violation penalties
26 allows the soft constraints to be violated while still satisfying a
corresponding
27 constraint equation. The fluid flow rates are then allocated among the
well
28 bores as determined by the optimizing of the objective function.
29
The soft constraints may be prioritized as to which of the soft constraints
31 should be most difficult to violate if necessary to achieve a feasible
solution to
32 the optimization of the objective function. Weighting scale factors may
be
33 associated with the constraint violation penalties in the objective
function.
-4-
CA 02630411 2009-03-25
1 The weighting scale factors may be weighted in accordance with the
2 prioritization of the soft constraints to make higher priority soft
constraints
3 more difficult to violate than lower priority soft constraints.
4 Flow rates between select well bores may have their flow rates related.
In
particular, well bores exhibiting similar flow characteristics, such as gas-to-
oil
6 ratio (GOR) or water-to-oil ratio (WOR), may have their well rates
related to
7 one another. Again, constraint equations can be generated for these
related
8 well bore flow rates. The enhanced allocation of flow rates among the
related
9 well bores will then be related or tied to one another.
In another aspect of this invention, the simulated well bores include a
plurality
11 of completion elements and the reservoir or reservoirs include a
plurality of
12 reservoir elements. The reservoir simulator is run to determine
pressures in
13 the reservoir elements and in the completion elements and to determine
fluid
14 flows in the completion elements of at least two components, i.e., oil
and
water, due to the pressure draw down between the reservoir elements and the
16 completion elements. Fluid flow component rate data points are then
17 generated over a range of fluid flows for each well bore. The data
points are
18 ideally generated by scaling and summing the fluid flows in the
completion
19 elements based upon the component flow rates determined by an initial
simulator run and in relation to an incremented range of pressure draw downs
21 between the reservoir and completion elements.
22 It is an object of an aspect of the present invention to provide a
method
23 wherein an objective function is created which includes at least one
constraint
24 violation penalty corresponding to a soft constraint which allows the
objective
function to be optimized wherein the soft constraint may be violated if
26 necessary to arrive at a feasible solution for the optimization.
27 It is another object of an aspect to generate an objective function
which
28 incorporates weighted constraint violation penalties which may be
29 appropriately weighted so that soft constraints may be violated in a
prioritized
order.
-5-
CA 02630411 2014-06-26
1 It is yet another object of an aspect to relate production rates of well
bores
2 in an optimization so that the flow rates among those well bores will
have
3 related flow rates after an optimization has been performed resulting in
4 limited flow rate oscillations of those well bores between time steps in
a
reservoir simulation.
6 It is still another object of an aspect to generate component flow rate
7 equations which are generated by scaling component flow rates in
individual
8 completions elements based upon flow rates originally determined in a
9 reservoir simulation run and a range of changing pressure profiles within
the
well bores.
11 According to another aspect of an embodiment, there is provided a method
12 for enhancing the allocation of fluid flow rates among a plurality of
well
13 bores in fluid communication with at least one subterranean reservoir,
the
14 method comprising:
(a) simulating fluid flow of a fluid containing multiple components in at
least
16 one subterranean reservoir and in a plurality of well bores which are in
fluid
17 communication with the at least one subterranean reservoir;
18 (b) selecting production constraints including at least one hard
constraint
19 wherein the at least one hard constraint is observed and at least one
soft
constraint wherein the at least one soft constraint may be violated;
21 (c) generating system equations including component flow rate equations
22 corresponding to the simulated fluid flow in the well bores including
23 comparing characteristics of fluid flow in at least two well bores and
if the
24 characteristics are within a predetermined range of one another, then
relating the fluid flow rates of the at least two well bores together by
26 generating rate relating equations in the system equations so that the
at
27 least two well bores will have related allocated flow rates and
constraint
28 equations including at least one soft constraint equation associated
with the
29 at least one soft constraint, the at least one soft constraint equation
-6-
CA 02630411 2014-06-26
1 including a constraint violation penalty (CVP) which allows the at least
one
2 soft constraint equation to satisfy the soft constraint;
3 (d) generating an objective function corresponding to the fluid flow in
the
4 well bores and to the constraint violation penalty;
(e) optimizing the objective function utilizing an optimizer and the system
6 equations to determine an enhanced allocation of fluid flow rates among
the
7 plurality of well bores wherein the at least one soft constraint may be
8 violated if necessary to achieve a physically deployable solution to the
9 optimization and violating the at least one hard constraint causes the
optimization to be physically non-deployable; and
11 (0 allocating the fluid flow rates among the plurality of well bores as
12 determined in step (e) by adjusting well control devices to control
fluid flow
13 in the plurality of well bores.
14 According to yet another aspect of an embodiment, there is provided a
method for enhancing the allocation of fluid flow rates among a plurality of
16 well bores in fluid communication with at least one subterranean
reservoir,
17 the method comprising:
18 (a) simulating fluid flow of a fluid containing multiple components in a
19 plurality of well bores and in at least one subterranean reservoir, the
well
bores including a plurality of completion elements and the at least one
21 subterranean reservoir including a plurality of reservoir elements which
are
22 in fluid communication with the completion elements, and determining
23 pressures in the reservoir elements and in the completion elements and
24 determining the corresponding component flow rates in the completion
elements due to the pressure draw down between the reservoir elements
26 and the completion elements;
27 (b) selecting production constraints including at least one hard
constraint
28 wherein the at least one hard constraint is observed and at least one
soft
29 constraint wherein the at least one soft constraint may be violated;
-6a-
CA 02630411 2014-06-26
1 (c) generating component rate data points for the well bores over a range
of
2 fluid flows by scaling and summing the component fluid flows in the
3 completion elements based upon component flow rates determined in step
4 (a) and changing pressure draw downs between the reservoir and
completion elements;
6 (d) generating component flow rate equations for the well bores based
upon
7 the data points for the respective well bores including comparing
8 characteristics of fluid flow in at least two well bores and if the
9 characteristics are within a predetermined range of one another, then
relating the fluid flow rates of the at least two well bores together by
11 generating rate relating equations in the component flow rate equations
so
12 that the at least two well bores will have related allocated flow rates;
13 (e) generating constraint equations corresponding to production
constraints
14 including at least one soft constraint equation associated with the at
least
one soft constraint, the at least one soft constraint equation including a
16 constraint violation penalty (CVP) which allows the at least on soft
17 constraint equation to satisfy the soft constraint;
18 (f) generating an objective function corresponding to the fluid flow in
the well
19 bores;
(g) optimizing the objective function utilizing an optimizer and the
constraint
21 and component flow rate equations to determine an enhanced allocation of
22 fluid flow rates among the plurality of well bores wherein the at least
one
23 soft constraint may be violated if necessary to achieve a physically
24 deployable solution to the optimization and violating the at least one
hard
constraint causes the optimization to be physically non-deployable; and
26 (h) allocating the fluid flow rates among the plurality of well bores as
27 determined in step (f) by adjusting well control devices to control
fluid flow in
28 the plurality of well bores.
-6b-
CA 02630411 2014-06-26
1 According to yet another aspect of an embodiment, there is provided a
2 computer readable medium having stored thereon instructions which, when
3 executed by a processor cause the processor to implement the methods
4 described above.
BRIEF DESCRIPTION OF THE DRAWINGS
6 These and other objects of aspects, features and advantages of the
present
7 invention will become better understood with regard to the following
8 description, pending claims and accompanying drawings where:
9 FIG. 1 is a schematic drawing of an exemplary hydrocarbon producing field
containing subterranean reservoirs which are fluidly connected by well
11 bores to the surface of the field with chokes being used to control well
bore
12 pressures and flow rates so that production from the field may be
optimized;
13 FIG. 2 is a flowchart of an exemplary method for field scale
optimization
14 made in accordance with this invention;
FIGS. 3A and 3B illustrate component flow rates curves generated using a
16 "quick rates" method made in accordance with the present invention and
17 component flow rate curves generated using a computationally intensive
18 iterative Newton method;
19 FIGS. 4A and 4B are graphs showing how well rates are related between a
pair of well bores having similar fluid characteristics;
-6c-
CA 02630411 2009-03-25
1 FIGS. 5A-D illustrate oil, gas and water production from individual
completion
2 elements of a well bore as the pressure profile in a well bore is allowed
to
3 increase due to the simulated closing of a well bore choke;
4
FIG. 6 illustrates that well bore pressure profiles are allowed to change by a
6 pressure change "c" while the pressure profile in an adjacent reservoir
7 remains static during a calculation used to generate component flow rate
8 curves for a well bore;
9
FIGS. 7A and 7B illustrate a respective line segment and a pair of line
11 segments which are used to construct a piecewise linear function;
12
13 FIG. 8 shows a flowchart for a method of selecting an optimal number of
14 breakpoints in creating a piecewise linear function;
16 FIG. 9 depicts a graph showing that breakpoints should fall within a
first
17 quadrant in order to prevent negative rates; and
18
19 FIG. 10 illustrates a piecewise linear function.
21 DETAILED DESCRIPTION OF THE INVENTION
22
23 A. Overview
24
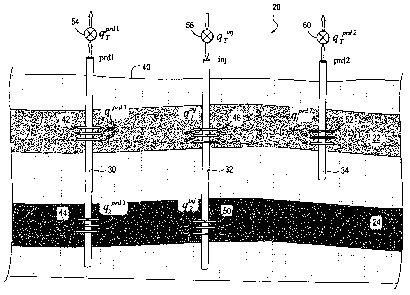
FIG. 1 schematically illustrates an exemplary hydrocarbon producing field 20.
26 Field 20 includes first upper and second lower reservoirs 22 and 24.
Field 20
27 has a number of well bores 30, 32 and 34 which fluidly connect
reservoirs 22
28 and 24 to the surface 40 of field 20. In this exemplary embodiment, well
29 bores 30 and 34 are producing wells which provide production fluids
containing components such as oil, gas and water. Well bore 32 is an
31 injection well which may be used to inject water or other fluids for
reservoir
32 pressure maintenance or fluid disposal. Completions 42, 44, 46, 50, and
52
-7-
CA 02630411 2008-05-20
WO 2007/058662
PCT/US2005/042470
provide fluid communication between reservoirs 22 and 24 and well bore 30,
2 32 and 34. Well bore 34 only connects with upper reservoir 22.
3
4 Chokes or well control devices 54, 56, and 60 are used to control the
flow of
fluid into and out respective well bores 30, 32 and 34. As will be described
6 more fully below, chokes 54, 56 and 60 also control the pressure profiles
in
7 respective well bores 30, 32 and 34. Although not shown, well bores 30,
32
8 and 34 will fluidly connect with surface facilities such as oil/gas/water
9 separators, compressors, storage tanks, pumps, pipelines, etc. The rate
of
flow of fluids through well bores 30, 32 and 34 may be limited by the fluid
11 handling capacities of these surface facilities.
12
13 FIG. 2 shows a flowchart illustrating the general steps used in
accordance
14 with the field scale optimization method of the present invention.
Persons
skilled in the art of reservoir simulation could easily develop computer
16 software for performing the method outlined in FIG. 2 based on the
teachings
17 contained in this description of the invention.
18
19 A reservoir simulator is used to model the fluid flow in field 50 which
includes
the reservoirs and well bores (step 110). Generally, such a reservoir model
21 will include thousands or even millions of discrete elements to carry
out a
22 numerical simulation. These discrete elements comprise reservoir
elements
23 and well bore elements. The well bore elements include specific
completion
24 elements which transfer fluid back and forth between adjacent reservoir
elements and other well bore elements which are in fluid communication with
26 the choke and the surface facilities (not shown).
27
28 Initial and boundary conditions are specified on the field model. These
initial
29 and boundary conditions include, by way of example and not limitation,
the
initial pressures and flow rates in the reservoir elements and well bore
31 elements, fluid compositions, viscosities, etc.
-8-
CA 02630411 2008-05-20
WO 2007/058662
PCT/US2005/042470
1 Next, a simulation run (step 120) is performed on the field model to
calculate
2 reservoir and fluid flow characteristics for a time step. In particular,
fluid flow
3 rates between the reservoirs and the well bores are determined as are the
4 pressures in the reservoir and well bore elements. Producing well bores
will
receive producing fluids from the reservoirs, including oil, water and gas,
6 which are delivered to the surface facilities of the field. Injection
wells may be
7 used to pressurize one or more of the reservoirs and/or to dispose of
water.
8 Also, gas may be injected into the well bores to provide gas assisted
fluid
9, production. Those skilled in the art will appreciate that many other
operations
affecting production may be modeled with a reservoir simulator and these
11 operations are included within the scope of this invention.
12
13 Component fluid flow rates may be determined in terms of oil, gas and
water
14 flow. Alternatively, the fluid components for which flow is to be
optimized
could be compositional components such as light (C3-C4), medium (C5-C8)
16 and heavy (>C9) hydrocarbons. By way of example, and not limitation,
other
17 possible component combinations might include non-hydrocarbon
18 components such as H2S and CO2.
19
Component flow rate equations for each of the well bores are next calculated
21 (step 130.) These component flow rate equations describe the estimated
flow
22 of one fluid component relative to that of another fluid component over
the
23 anticipated range of flow rates for a well bore. Physically, the chokes
on the
24 well bores may be opened or closed to increase or decrease the overall
fluid
output or input relative to a well bore. Because of changing pressure profiles
26 in the well bores, the relative ratios of oil, gas and water produced
from a well
27 bore may change with the opening and closing of a choke.
28
29 Examples of component flow rate curves for a well are shown in FIGS. 3A
and
3B. In FIG. 3A, the rate of production of gas in MSCF/D (million square cubic
31 feet per day) is plotted against the rate of production of oil in STB/D
(stock
32 tank barrels/day). In FIG. 3B, the rate of production of water (STB/D)
is
33 plotted against the rate of production of oil in STB/D. The rate of
production
-9-
CA 02630411 2008-05-20
WO 2007/058662
PCT/US2005/042470
1 of gas versus oil is relatively linearly over a wide range of possible
oil
2 production rates. However, the rate of water production is non-linear
relative
3 to the production rate of oil. Much more water is produced at higher
outputs
4 of oil production than at lower rates of oil production. High production
outputs
correspond to a wide open choke position.
6
7 In the preferred embodiment of this invention, a "quick-rates" method is
used
8 to generate individual component rate data points which can then be used
to
9 quickly construct graphs or generate component flow rate equations. More
details on the "quick-rates" method will be described below. Those skilled in
11 the art will appreciate that other methods may be used in generating
12 estimates of how the production of one component versus the rate of
13 production of another component may vary over the overall output range
of a
14 well bore.
16 A user will specify production constraints (step 140) to be used in
conjunction
17 with the field model. By way of example and not limitation, examples of
18 production constraints include (1) producing oil at a target level; (2)
producing
19 gas at a target level; (3) limiting gas production below a predetermined
limit;
(4) limiting water production below a predetermined limit; (5) limiting water
21 injection to an amount related to the water produced from the well
bores; and
22 (6) limiting gas injection above a predetermined limit to provide gas
assisted
23 lift. Further, these targets and limitations may be combined or scaled
relative
24 to one another as well.
26 The production constraints may include hard or soft constraints. Hard
27 constraints are constraints which will not be allowed to be violated.
Soft
28 constraints are constraints which may be violated if necessary to
produce a
29 feasible solution to an optimization problem. Optionally, the order in
which the
soft constraints are preferably allowed to be violated, if necessary to
achieve
31 a feasible solution, may also be specified.
-10-
CA 02630411 2008-05-20
WO 2007/058662
PCT/US2005/042470
1 Another aspect of the present invention includes optionally specifying
2 (step 150) whether the well bore flow rates of certain well bores are to
be
3 related. For example, well bores having similar fluid characteristics
such as
4 gas-to-oil ratio (GOR) or water-to-oil ratio (WOR), may be related to one
another. The relating of production rates between well bores will insure that
6 rates of production (or injection) between these well bores will not
arbitrarily
7 oscillate between time steps.
8
9 Constraint equations are then generated (step 160) from the production
constraints and the related well bore rates. Hard constraint equations are
11 created for those constraints which are not allowed to be violated. Soft
12 constraint equations corresponding to the soft constraints are generated
13 which include constraint violation penalties. The constraint violation
penalties
14 allow the soft constraint equations to be satisfied even when the soft
constraints must be violated so that an optimization may produce a feasible
16 solution. The generation of this set of constraint equations will be
described
17 in further detail below.
18
19 An objective function is created in step 170 which seeks to optimize an
objective, such as oil production from field 50. The objective function
ideally
21 includes the component flow rates of the well bores and also the
constraint
22 violation penalties associated with the soft constraint equations.
Weighting
23 scale factors may be associated with the soft constraint penalties in
the
24 objective function. By appropriately weighting these weighting scale
factors,
the order in which related soft constraints may be violated, may be
prioritized.
26 The objective function is then optimized (step 180) by an optimizing
27 subroutine (optimizer) to produce an optimized allocation of fluid flow
rates
28 among the well bores. The optimizer uses the component flow rate
equations
29 calculated in step 130 and the constraint equations set up in step 160
to
optimize the objective function.
31
32 The optimized fluid flow rates, and other fluid flow characteristics
determined
33 from the optimizer such as constraint violation penalties, may then be
-11-
CA 02630411 2008-05-20
WO 2007/058662 PCT/US2005/042470
I allocated among the well bores and reservoir (step 190). These optimized
2 flow rates and characteristics may then be imposed (step 200) as
3 initial/boundary conditions in the next iterative time step in the
reservoir
4 simulation. Steps 120-200 are then repeated to provide enhanced field
scale
production over many time steps until a satisfactory period of time has
6 elapsed and the simulation is then ended. More details on the above
7 aforementioned steps will now be described.
8
9 B. Creation of the Objective Function and Constraint Equations
11 1. System of Constraint Equations
12
13 A linear programming (LP) system is a set of linear equations and linear
14 constraints. A mixed integer programming (MIP) system is a set of linear
or
non-linear equations and constraints. In the present invention, preferably a
16 MIP system augments a LP system when a set of non-linear equations or
17 constraints, represented by piecewise linear functions, needs to be
solved to
18 achieve an optimized objective. An open source software package, which
19 uses LP and MIP techniques, is used in this exemplary embodiment to
optimize the objective function. In particular, the present invention uses a
21 package entitled LP-Solve, which is available from
22 http://packages.debian.orq/stable/math/lp-solve. An alternative
commercial
23 solver is also utilized entitled XA which is available from Sunset
Software
24 Technology Corporation, of San Marino, California. Those skilled in the
art
will appreciate that other commercial LP/MIP optimizer packages may be
26 used to optimize the objective function using fluid flow rates and
constraint
27 conditions.
28
29 The constraint equations, component flow rate equations, and the
objective
function are input into the optimizer. The optimizer then outputs a feasible
31 solution to the optimization problem including enhanced allocation of
well bore
32 flow rates. Values for the violation of any soft constraints necessary
to
33 achieve a feasible solution to the optimization are also ideally output.
A user
-12-
CA 02630411 2008-05-20
WO 2007/058662
PCT/US2005/042470
1 may then make appropriate changes to production constraints or to the
2 capacity of surface facilities to reflect the value of the violation of
the soft
3 constraints.
4
An extrema of an objective function is sought. A simple LP system may have
6 the following form:
7
8 OBJ = max E cix, subject to constraints in the form of: (1)
9 E =10
11 where
12
13 index
14 C. = weighing scale factor
xi = parameters being optimized
16 a. = multiplicative constant and;
17 = additive constant
18
19 In one embodiment of this invention, the main variables are well bore
rates.
That is, the rates at which components of fluid production, i.e., oil, water
and
21 gas, are produced from a well bore. Component flow rate equations are
22 preferably generated using a "quick rates" method which will be
described
23 below. The component rate equations describe how much of one component
24 is transported through a well bore as compared to another fluid
component.
The rates of production of the components may remain linear with respect to
26 one another or may be non-linear over the potential range of well bore
27 production outputs. The present invention ideally handles nonlinear
scaling
28 between component or phase rates through piecewise linear functions by
29 formulating the system as a MIP problem. Production constraints are set
up
as hard constraints, which are not allowed to be violated, and/or as soft
31 constraints, which are allowed to be violated when necessary to achieve
a
-13-
CA 02630411 2008-05-20
WO 2007/058662 PCT/US2005/042470
1 solution. The constraints may include target objectives and production
2 limitations. The objective function is setup from information provided by
a
3 user.
4
2. Setting up the Objective Function
6
7 In general, the objective function comports with the mathematical
8 expression:
9
OBJ = E wi. E - E wkCVPõ (2)
j
11 where
12
13 OBJ = objective to be optimized;
14 i = number of fluid components in a well bore fluid;
w1 = weighting scale factor for production of the ith fluid
16 component in a well bore;
17 j = the number of well bores;
18 qu quantity of the ith component produced by the ith well;
19 k = number of constraint violation penalties associated with
the production constraints;
21 Wk = weighting scale factor for the kth constraint
22 violation penalty; and
23 CVPk = kth constraint violation penalty.
24
A more specific exemplary objective function for the LP/MIP system might
26 consist of the weighted sum of total production rates of oil, water and
gas for a
27 selected set of well bores. In the present invention, the objective
function may
28 also include constraint violation penalty variables ( CVP/c ) to
accommodate the
29 use of soft constraints. A typical objective function may be expressed
in the
following mathematical form:
-14-
CA 02630411 2008-05-20
WO 2007/058662 PCT/US2005/042470
1 OBJ = wo qoi + wgZggi + ¨ wk CVPk (3)
2
3 where
4
OBJ = objective to be optimized;
6 wo = weighting scale factor for oil production;
7 got = quantity of oil produced by the ith well;
8 W = weighting scale factor for gas production;
9 ggi = quantity of gas produced by the ith well bore;
w = weighting scale factor for water production;
11 = quantity of water produced by the ith well bore;
12 Wk= weighting scale factor for the Oh; and
13 C VPic = kth constraint violation penalty.
14
The weighting scale factors wi or well rate parameters may be specified by a
16 user. For example, a user might specify:
17
18 w0 = 1.0; wg = -0.1; and wn, = -0.2.
19
These weighting scale factors correspond to the maximization of oil
21 production rate while trying to minimize gas and water rates. In this
case, the
22 objective function is incremented by 1.0 for each stock tank barrel/day
23 (STB/D) of oil produced ( w011 = 1.0) and penalized by 0.2 for every
million
24 standard cubic feet/day (MSCF/D) of gas and 0.1 for every STB/D of water
produced. In this case, the units of the objective function are a combination
of
26 STB/D and MSCF/D units. Normalization of the objective function
27 components is ideally carried out to render the objective function
28 non-dimensional.
-15-
CA 02630411 2008-05-20
WO 2007/058662
PCT/US2005/042470
1 Another preferred way of handling this unit mismatch in the objective
function
2 is to make use of economical information, if available. For example, if
oil
3 revenues are 22$/STB/D, gas revenues are 3$/MSCF/D and every STB/D of
4 water costs $3.5 to handle, then:
6 w0 = 22.0; wg = 3.0; and w= -3.5.
7
8 In this case, the units of the objective function are monetary ($) and
are
9 consistent. It is preferred to scale the weighting scale factors so that
w, is
1.0, hence the previous well rate parameter values would be normalized by
11 22.0 to give:
12
13 wo = 1.0; wg =0.136; and wõ= -0.159.
14
3. Production Constraints
16
17 Constraints may be based on physical limitations such as well
18 production limits, injection rate limits or gas lift rate limits.
Alternatively,
19 constraints may be determined to meet engineering preferences such as
production/injection targets for a group of wells. Other constraints by
21 way of example and not limitation might include Gas to Oil Ratios
22 (GOR), Water to Oil Ratios (WOR), and constraints on a subset of wells
23 or completions.
24
The LP/MIP system constraints are classified as hard and soft constraints.
26 For example, hard constraints may be imposed on a pair of wells such
that
27 the combined maximum oil production is 5,000 STB/D. These hard
28 constraints are translated into the following LP/MIP constraints:
29
q pw=piROD1
< 5,000 (4)
-16-
CA 02630411 2008-05-20
WO 2007/058662
PCT/US2005/042470
,w=PROD2
p=oil 5,000
2
3 where
4
,w=PROD1
p=oil the
quantity of oil produced from a first well; and
6wPROD2
q p==oil the
quantity of oil produced from a second well.
7
8 4. Prioritization of Soft Constraints
9
Soft constraints are constraints that are allowed to be violated if-and-only-
if
11 there is no other way to honor the soft constraints while obtaining a
feasible
12 solution for the system. Ideally, this violation of constraints will be
the
13 minimum possible necessary for obtaining a solution. Constraint
violations
14 may occur when the system has conflicting limits/targets. Consider the
following situation where the field has constraints including an oil
production
16 target and a water handling limit on a group of wells as follows:
17
18 Oil Production Target = 7,500 STB/D (5)
19 Water Production Limit > 5,000 STB/D
21 There might, and most probably, will be a point in the simulation where
the
22 group of wells will not be able to produce 7,500 STB/D of oil without
producing
23 more than 5,000 STB/D of water. Wells tend to produce more water as they
24 age or mature. In such a case, the optimizer will not report a no-
solution but
instead will allow the violation of one of the soft constraints. Preferably, a
flag
26 will be raised indicating that the constraint has been violated. Which
27 constraint is chosen to be violated first may be determined by the user
as well
28 in this preferred embodiment of this invention.
29
These oil target and water limit conditions are translated into the following
31 three soft constraint equations:
-17-
CA 02630411 2008-05-20
WO 2007/058662 PCT/US2005/042470
constraint-1: qpw=iorDi ^ qpw=zoD2 c-r-
7,500 (6)
2
3 constraint-2: qpw=zom ^ qpw=z0D2 _CVP2 <7,500
4
constraint-3: qpw=wpaRtocip. 2 _ CVP3 <5,000
6
7 Constraint violation penalty CV/Dk variables are appended to the
objective
8 function:
9
OBJ ...¨w1CVPI¨w2CVP2¨w3CVP3 (7)
11
12 subject to: wk >0 where wk is the kth weighting scale factor
13 associated with the kth constraint violation
14 penalty; and
CVPk 0 where Cr/Pk is the kth constraint violation
16 penalty which is associated with the kth
17 constraint equation.
18
19 Note that this setup forces the GYP variables to be zero since they have
negative weights in the objective function which makes them equivalent to
21 hard constraints whenever they can be met, i.e., when oil production is
equal
22 to 7,500 STB/D and water production is less then 5,000 STB/D.
23
- 24 Suppose the reservoir conditions are such that in order to
produce
7,500 STB/D of oil, 5,100 STB/D of water has to be produced. In this case,
26 there are two options:
27
28 = scale back production and meet the water limit but disregard the oil
29 target; or
31 = meet the oil target but produce more water than the water limit.
-18-
CA 02630411 2008-05-20
WO 2007/058662 PCT/US2005/042470
I Whether the LP/MIP system chooses to scale back production or meet the
2 water limit depends on the coefficients or weighting scale factors wk of
the
3 CV/3k variables. Suppose the water capacity limit is absolute and that
the oil
4 production is allowed to be scaled back to meet the water limit. In this
case,
suppose 14/1 =1, w2 =1 and w3 = 2 which corresponds to constraint-3 (water
6 production limit) having more priority than the other two constraints
(oil
7 production target). Note that the weighting scale factor w3 is given
greater
8 weight than the other two weighting scale factors w1 and w2 associated
with
9 the oil production. When the well rates are scaled back to meet the water
production limit, suppose the oil production drops to 7,400 STB/D when water
11 production is exactly 5,000 STB/D. In this case, CV/Di will have to be
non-zero
12 to satisfy constraint 1, to be exactly CV/1 = 100. In this setting, the
LP/MIP
13 system will choose to scale back the rates rather than produce more
water
14 due to the specific values of CVP coefficients Wk. The objective
function
entries will appear as follows for these two cases.
16
17 If the oil production target is disregarded and oil production is
allowed to be
18 scaled back to meet the water limit, then:
19
20w=PROD1 w=PROD2
qp=oi/ qp=od = 7,400 (8)
21
22,w=PROD1 ,w=PROD2
p=water ' `.1 p=water 5,000
23
24 CVEI =100 C VF2 =0 CVF, =0
26 OBJ = ...-1CVF1-1CVF2-2CVF3 =...-100 (9)
27
28 If the oil production target is enforced but the limit on the water
production
29 limit is allowed to be violated, then:
-19-
CA 02630411 2008-05-20
WO 2007/058662 PCT/US2005/042470
w=PROD1 w=PROD2
proll p=011 = 7,500 (10)
2
3,w=PROD1 ,w=PROD2
p=water 11 p=water = 5,100
4
CVF1 =0 C VF2 =0 C VF3 = 100
6
7 OBJ = ¨1CVF2 ¨2CVF3 = 200 (11)
8
9 Since, everything else being the same, scaling back rates results in a
higher
objective function value (+100), the LP/MIP optimizer will prefer to scale
back
11 the rates. The same approach may be used to handle n soft constraints
and
12 put them in a desired priority order of violation.
13
14 If the order in which the soft constraints are to be violated is not
specified and
remains unprioritized, then all of the weighting scale factors wk are equal
and
16 no preference is given as to which constraint is allowed to be violated
first. In
17 this event, w1 = w, = w3 = 1. Alternatively, a first soft constraint may
be given
18 the lowest priority, a second soft constraint is given a slightly higher
priority,
19 and a third soft constraint is given the highest priority. In this
exemplary
embodiment of the invention, the weighting scale factors \At; are then given
21 values corresponding to 10 x 10P where p is order of priority in which
the soft
22 constraints may be violated. For example,
23
24 wi= 10 x 101; w2 = 10 x 102; and w3 = 10 x 103
26 The general equation for the objection function is:
27
28 OBJ = w1CVIDI ¨ w2CVP2¨ w3CVP3 (12)
29
The objective function with weighting scale factors then becomes:
-20-
CA 02630411 2008-05-20
WO 2007/058662
PCT/US2005/042470
OBJ = ...-10x101 CVF ¨10x102 CVF2-10x103 CVF3 (13)
2
3 Preferably, these coefficients are normalized to give values of between
4 0 and 1. The normalization is partially based upon the potential range of
a
constraint violation penalty.
6
7 Constraint1 0<= CVP normi <=1
8
9 CVP normi = CVP- CVP min)/( CVP max ¨CVP min) (14)
11 Or, since CVPrnin is always zero:
12
13 W1 = 10 x 10P/( CVPmax)) (15)
14
CVPk parameters are optimized along with the other parameters in the
16 optimization system (production/injection rates). Since any positive
value of
17 CVPk imposes a penalty through the objective function, the system tries
to
18 keep CVPk values as zero. CVPk gains a positive value if and only if
there is
19 no other way to achieve a feasible solution.
21 Note that if there are no conflicting objectives for optimization, all
of the CVP
22 variables will be zero and soft constraints will be equivalent to hard
23 constraints.
24
The operators used with the soft constraints are translated into LP/MIP
26 equations as follows:
-21-
CA 02630411 2008-05-20
WO 2007/058662 PCT/US2005/042470
1
Soft constraint
op op LP/MIP equation
criteria
WATPR > 5,000 becomes 5,000
GAS PR < 10,000 becomes > qg 5,000
q, 7,500 and
OILPR = 7,500 becomes and
g 7,500
2
3 Note that the (=) operator is the target operator and would satisfy a
condition
4 (thus trigger an action) if the criteria left-hand-side is not equal to
the criteria
right-hand-side.
6
7 5. Relating Well Rates
8
9 LP/MIP systems are strictly mathematical and thus have no notion of the
physics underlying the variables, equations and constraints. Therefore, in
11 some cases, the LP/MIP results, although mathematically sound, may make
12 little practical sense. Such a case may occur when the LP/MIP optimizer
13 decides to significantly choke back only one well bore in a group of
well bores
14 that all have insignificant differences in their properties. This might
result in
large rate oscillations for individual wells between time steps. To prevent
16 such an occurrence, the present invention provides the option that well
rates
17 of well bores with close characteristics be related.
18
19 If it is determined that the well rates should be related, in addition
to the
existing constraint equations, further constraints equations that relate
certain
21 well bore flow rates are setup. For example, if well bores which have
fluid
22 characteristics which are within a predetermined range of one another,
such
23 as gas-to-oil ratios (GOR) and/or water-to-oil ratios (WOR), then the
flow
24 rates of these well bores may be related. Similar to the soft constraint
equations described above, these rate relating equation may have weighting
26 scale factors which are close to one another and include constraint
violation
27 penalties.
-22-
CA 02630411 2008-05-20
WO 2007/058662
PCT/US2005/042470
1 Referring now to FIG. 4A, for instance, given the flow rate of a well
bore with
2 the maximum GOR (q1), the flow rate of the related well (q2) is allowed
to be
3 in the shaded area. This is achieved by adding the following constraints
to
4 the system:
6q2f
q2 _____________ = a ¨ RVP 0 (16)
qlf
7 q2f
q2 ______________ = qi¨RVP_O
qlf
8
9 where
11 q1,q2 = rates that are being related to one another
12 qlf 'q2f maximum possible value of rates
13 RVP = Rate Violation Penalty
14 a = value determining "strictness" of relation
16 all RVP s are added to the objective function with a negative weight:
17
18 OBJ (17)
19
where wi is chosen to be -10 in this particular example.
21
22 a is given by:
23
( ¨
24 a= fGOR,GOR2 q2f (18)
GORi
26 This means that when q1=qi* , q2 needs to be in the range C7
2*min '72* max 1" The
27 function f is a simple linear function as shown in FIG. 4B.
-23-
CA 02630411 2008-05-20
WO 2007/058662 PCT/US2005/042470
The present invention allows a user to change a threshold value t, however,
2 t = 1.0 should work for most cases. With this setting, given t = 1.0, a
well with
3 GOR2 0.0 will not be related, and will have an independent rate scaling
4 factor, whereas on the other extreme when GOR2= GORi , the shaded area in
FIG. 4A will collapse into a line as shown in FIG. 4B and the second well bore
6 will be forced to have the same scaling factor as well bore 1.
7
8 Another way to relate flow rates is through scaling flow rates in a group
of well
9 bores by the same factor. For example, the injection rates of all the
injectors
in a first injector well group and the production rates of all the producers
in a
11 first production group of well bores may be related. This relation is
not based
12 on GOR or WOR in this case; the relation simply implies that when the
rate of
13 a well bore is scaled by a factor, the other wells in the related group
will be
14 scaled with the same factor.
16 For instance, if a well bore in a first production group needs to cut
production
17 by half (to satisfy another constraint perhaps), then all the well bores
in a first
18 production group will cut production by half. Ideally, the default for
this
19 relation is to have less weight in the LP/MIP system than the specified
constraints. This means that rate-relations may be broken for the sake of
21 satisfying the constraints. Parameters can be used to determine the
relative
22 weights of the constraints and rate-relations in the LP/MIP system. The
23 smaller (more negative) these coefficients, the more influence these
24 coefficients will have on the system.
26 C. Generation of Rate Curves and Component Flow Rate Equations
27
28 1. Quick Rates Method
29
The following "quick rates" method is preferably used in generating fluid flow
31 component flow rate curves and equations. A rate curve relates how the
32 production of one component compares with the production of another. For
33 example, as a choke or valve is opened on a well, oil, water and gas
-24-
CA 02630411 2008-05-20
WO 2007/058662 PCT/US2005/042470
1 production will generally increase. The increase between any two of the
2 components may be linear or non-linear over the range of overall fluid
3 production. Referring again to FIGS. 3A and 3B, gas and oil production
are
4 shown to be generally linear while water and oil production are generally
non-
linear. The rate curves are generated from a series of data points. Data
6 points generated using an iterative Newton-Raphson procedure in
conjuction
7 with a sub-portion of the reservoir model are indicated by "x" marks.
Data
8 points indicated by "diamond" indicia were created using a "quick rates"
9 method. Note that both methods provide similar results. However, the
"quick
rates" method is much more computationally efficient.
11
12 The quick-rates method utilizes the fact that at a fixed point in time,
production
13 from individual completion elements is generally linearly proportional
to
14 pressure draw down. Pressure draw down is the pressure differential
between the pressure in a well bore completion element and adjacent
16 reservoir elements. It is this pressure differential which drives fluids
into and
17 out of the completion elements during respective production and
injection
18 operations. Using a number of different pressure draw down profiles for
each
19 well bore, a set of data points is generated. Then, a piecewise linear
function
that best fits these points is ideally constructed. A component flow rate
21 equation is then generated from this piecewise linear function which is
to be
22 used by the optimizer.
23
24 The oil-water total component flow rate curve is piecewise linear, which
is not
a linear function. FIGS. 5A-D show the flow rates of individual completion
26 elements for four different overall production outputs for a well bore.
Also
27 shown are the pressure profiles for the reservoir and well bore elements
for
28 these different production rates. FIGS. 5A-D illustrate cases where oil
29 production is being sequentially reduced, such as occurs when a well
head
choke valve of a well bore is being closed. Note as oil production is reduced,
31 water production is reduced until almost no water is produced.
-25-
CA 02630411 2008-05-20
WO 2007/058662 PCT/US2005/042470
While the rate of production is decreased, the well bore pressure profile of
the
2 well bore will increase. The pressure profile of the reservoir is assumed
to
3 remain constant at a given time step. This will result in the pressure
draw
4 down in the well decreasing as the well bore pressure profile increases
toward
the reservoir pressure profile. Note that the pressure at deeper completions
6 will be greater than at shallower depth completions due to pressure
7 head/gravity effects. Consequently, pressure draw down will be lower at
8 greater depths where denser water underlies less dense layers of oil and
gas.
9
The present invention exploits the linear rate scaling for individual well
bore
11 completions. The total production rate of component p, i.e., oil, water
or gas,
12 from a well is the sum of rates from its flowing completions:
13
ncomp
14 gpT = E qpi (19)
16 where
17
18 gpT= total quantity of flow from a well;
19 = number of completion elements s in a well; and
comp
qPi quantity of flow of a component from the ith well bore.
21
22 The baseline flow rate of each component at each individual completion
is
23 extracted from the reservoir simulation run at a particular time step
and well
24 production level. It is assumed that at a fixed point in time the
completion rate
for each individual well completion element is linearly proportional to the
26 pressure draw down. Thus, if the pressure draw down in a well is reduced
by
27 an amount, c, individual completion rates will be scaled back
accordingly and
28 the new total rate will be given by:
-26-
CA 02630411 2008-05-20
WO 2007/058662 PCT/US2005/042470
ncomp AP, ¨c
1 qpT __________ qpi (20)
i=1 ar,
2
3 where
4
qpr new total quantity of flow from a well;
6 c = reduction in pressure draw down;
7ncon2p number of completion elements in a well;
8 AP, = original pressure draw down in the ith completion element;
9 and
qPi = quantity of flow of a phase from the ith well bore;
11
12 Thus, the amount of pressure shift, c, required to reduce the well oil
rate from
13 q to q* is given by:
14
= goT ¨go"' (21)
ncomp q oi
E ,
16
17 This pressure shift dictates a parallel shift in the well bore pressure
profile, as
18 illustrated in FIG 6. Having calculated C, equation 20 can be used to
19 calculate the well rates of other components flowing in the well bore.
The
same procedure can be used for injection rates as well. Repeating this
21 process, a number of component flow data points may be generated and a
22 curve may be generated as has been considered previously with respect to
23 FIGS. 3A and 3B.
24
2. Piecewise Linear Function Construction
26
27 Piecewise linear functions are generated which best represent these data
28 point sets generated by the "quick-rates" method for each of the well
bores.
-27-
CA 02630411 2008-05-20
WO 2007/058662 PCT/US2005/042470
1 The piecewise linear functions include a number of line segments and
2 breakpoints. The number and location of the breakpoints are ideally
selected
3 using a least squares fit to the data set generated by the "quick-rates"
4 method. In this exemplary embodiment, a Levenberg-Marquardt least
squares fit method is preferably used to locate breakpoints. Those skilled in
6 the art will appreciate other curve or equation generating techniques may
be
7 used to represent the generated data points which is to be used by the
8 optimizer.
9
Referring now to FIGS. 7A and 7B, given a segment k, the coordinates of the
11 end points of the segment is given by:
12
13 (a2k-15 a2k ) and (a2k+1,a2k+2) (22)
14
Least square methods, such as the Levenberg-Marquardt, require the
16 derivatives of this function, y, be determined with respect to the
parameters,
17 a. These derivatives are:
18
19 ay
2 k +2 a2k ) _________________________
(23)
aa2k-1 a2k+1 a2k-1 )2
21
aa2k a2k+1 ¨ a2k-1
22
Oy
23 (x a2k-0(a2k+2 a2k )
Oa2k+1 (a2k+1 a2k-1 )2
24 OY x¨ a2k-1
'aa2k+2 a2k+1 a2k-1
26 In the preferred embodiment, ideally an appropriate number of
breakpoints as
27 well as their optimum locations are determined. The algorithm shown in
28 FIG. 8 is used for the selection of the number of breakpoints.
-28-
CA 02630411 2008-05-20
WO 2007/058662 PCT/US2005/042470
1 The first step is to start with a linear function (i.e. a single segment,
two end
2 points, hence i=2. The e for this linear function is calculated (x). Then
a
3 break point is added to the linear function making it a piecewise linear
function
4 with two segments and three end points (1=i+1, i.e., i=3). The breakpoint
coordinates is optimized for minimum If the fit is
improved by more than a
6 factor off from the initial fit, then a new breakpoint is added and the
process is
7 repeated until the improvement is not significant. This algorithm keeps
adding
8 more breakpoints only if this improves the fit by the fraction f.
9
A better fit can be made by decreasing the value of fat the expense of having
11 a larger number of segments. This approach is generally robust. A check
12 may be made to make sure that the breakpoints are always in the feasible
13 region (first quadrant). This is ensured by penalizing (P) the solutions
that fall
14 into infeasible areas, as shown in FIG. 9.
16 3. Incorporation of Piecewise Linear Functions Into the Linear
17 Programming
18
19 Incorporation of piecewise linear curve to the LP setup requires the
introduction of binaries, additional continuous parameters and some
21 constraints. Following is the set of equations and variables that need
to be
22 added:
23
24 Breakpoints:
26 (xbi,Ybi) i = 1,2,...,n (24)
27
28 Replace rate term with:
29
q = ziybi+22yb2+...+znybn
31
32 Add constraints:
-29-
CA 02630411 2008-05-20
WO 2007/058662
PCT/US2005/042470
1 Y1 Z2 +Y2 Z3 +3 "" Z7-1 === Y n-2 + Y n-1 Zn Y n-1
2 Yi +3/2 + = = = + .Y,1-1 =1 (25)
4 qi zlxbi+ z2xb.2.1_ = = = + znxbi,
E {0,1} i =1,2,..., n ¨1
6 2.1 ?_ 0 n
7
8 Here, q is the dependent rate and q1 is the controlling rate. Now it will
be
9 demonstrated why such a setup results in the correct behavior with a
simple
piecewise linear function with the two segments. Suppose the function
11 appears as in FIG. 10. The value for the function at x =15 is to be
12 determined. The formulation corresponding to this problem would be:
13
14 f(x)= z10+z23+ z39 (26)
x 71 0+z2 20+z330
-
16 z1 yi z2 yl+ y2 z3 y,
17 Y1+ Y2 =1
18 +z2+z3 =1
19 y e {0 ,1} i=1,2
zi 0 i=1,2,3
21
22 The binary y indicates the segment that x belongs to. In this case, y1
should
23 be one and y2 should be zero. First, check to see if y2 can ever be one.
If
24 y2 was one, then y1 has to be zero, which means z1 is zero and z2 and z3
are non-zero. However, if z2 and z3 are non-zero, x =15 for the second
26 equation can never be satisfied, thus y2 cannot be 1. Thus if yl is one,
then
27 solving for z obtains:
-30-
CA 02630411 2008-05-20
WO 2007/058662
PCT/US2005/042470
1 zi 0.25
2 f (x) = 2.25.
3 z2 0.75
4
Incorporation of the equations and variables in equation 24 force the LP/MIP
6 optimizer to honor the component flow rate curves.
7
8 While in the foregoing specification this invention has been described in
9 relation to certain preferred embodiments thereof, and many details have
been set forth for purpose of illustration, it will be apparent to those
skilled in
11 the art that the invention is susceptible to alteration and that certain
other
12 details described herein can vary considerably without departing from
the
13 basic principles of the invention.
-31-