Note : Les descriptions sont présentées dans la langue officielle dans laquelle elles ont été soumises.
CA 02645596 2008-12-02
TITLE
WELDABLE OXIDATION RESISTANT
NICKEL-IRON-CHROMIUM-ALUMINUM ALLOY
Field of Invention
The invention relates to nickel base corrosion resistant alloys containing
chromium
aluminum and iron.
Background of the Invention
There are many corrosion resistant nickel-base alloys containing chromium and
other
elements selected to provide corrosion resistance in particular corrosive
environments. These
alloys also contain elements selected to provide desired mechanical properties
such as tensile
strength and ductility. Many of these alloys perform well in some environments
and poorly in
other corrosive environments. Some alloys which have excellent corrosion
resistance are
difficult to form or weld. Consequently, the art has continually tried to
develop alloys having a
combination of corrosion resistance and workability which enables the alloy to
be easily formed
into vessels, piping and other components that have a long service life.
British Patent No. 1,512,984 discloses a nickel-base alloy with nominally 8-
25%
chromium, 2.5-8% aluminum and up to 0.04% yttrium that is made by electroslag
remelting an
electrode that must contain more than 0.02% yttrium. United States Patent No.
4,671,931
teaches the use of 4 to 6 percent aluminum in a nickel-chromium- aluminum
alloy to achieve
outstanding oxidation resistance by the formation of an alumina ri ch
protective scale. Oxidation
resistance is also enhanced by the addition of yttrium to the alloy. The iron
content is limited to
8% maximum. The high aluminum results in the precipitation of Ni3Al gamma
prime precipitates
which offers good strength at high temperature, especially around 1400 F.
United States Patent
No. 4,460,542 describes an yttrium-free nickel-base alloy containing 14-18%
chromium, 1.5-8%
CA 02645596 2008-12-02
iron, 0.005-0.2% zirconium, 4.1-6% aluminum and very little yttrium not
exceeding 0.04%. with
excellent oxidation resistance. An alloy within the scope of this patent has
been commercialized
as HAYNES 214 alloy. This alloy contains 14-18% chromium, 4.5% aluminum, 3%
iron,
0.04% carbon, 0.03% zirconium, 0.0 1% yttrium, 0.004% boron and the balance
nickel.
Yoshitaka et al. in Japanese Patent No. 06271993 describe an iron-base alloy
containing 20-
60% nickel, 15-35% chromium and 2.5-6.0% aluminum which requires less than
0.15% silicon and
less than 0.2% titanium.
European Patent No. 549 286 discloses a nickel-iron-chromium alloy in which
there must be
0.045-0.3% yttrium. The high levels of yttrium required not only make the
alloy expensive, but
they can also render the alloy incapable of being manufactured in wrought form
due to the
formation of nickel-yttrium compounds which promote cracking during hot
working operations.
United States Patent No. 5,660,938 discloses an iron-base alloy with 30-49%
nickel, 13-
18% chromium, 1.6-3.0% aluminum and 1.5-8% of one or more elements of Groups
IVa and Va.
This alloy contains insufficient aluminum and chromium to assure that a
protective aluminum
oxide film is formed during exposure to high temperature oxidizing conditions.
Further,
elements from Groups IVa and Va can promote gamma-prime formation which
reduces high
temperature ductility. Elements such as zirconium can also promote severe hot
cracking of
welds during solidification.
United States Patent No. 5,980,821 discloses an alloy which contains only 8-
11% iron
and 1.8-2.4% aluminum and requires 0.01-0.15% yttrium and 0.01-0.20%
zirconium.
Unfortunately, the alloys disclosed in the aforementioned patents suffer from
a number of
welding and forming problems brought on by the very presence of aluminum
particularly when
present as 4 to 6 percent of the alloy. The precipitation of Ni3AI gamma prime
phase can occur
quickly in these alloys during cooling from the final annealing operation,
resulting in relatively
high room temperature yield strengths with corresponding low ductility even in
the annealed
2.
CA 02645596 2008-12-02
condition. This makes bending and forming more difficult compared to solid
solution
strengthened nickel base alloys. The high aluminum content also contributes to
strain age
cracking problems during welding and post-weld heat treatment. These alloys
are also prone to
solidification cracking during welding, and, in fact, a modified chemistry
filler metal is required
to weld the commercial alloy, known as HAYNES 214 alloy. These problems have
hindered
the development of welded tubular products and have restricted the market
growth of this alloy.
Summary of this invention:
The alloy of the present invention overcomes these problems by reducing the
negative impact
of the gamma-prime on high temperature ductility through large additions of
iron in the 25-32%
range and reductions in the aluminum + titanium levels to the 3.4-4.2% range.
Further, yttrium
additions are not required and can be substituted by additions of misch metal.
We overcome disadvantages the Ni-Cr-Al-Y alloys described in the background
section
by modifying the prior art compositions to displace nickel with a much higher
level of iron. In
addition, we lower the aluminum level, preferably to about 3.8% from the
current 4.5% typical
amount of 214 alloy. That lowering reduces the volume fraction of gamma-prime
that could
precipitate in the alloy and improves the alloy's resistance to strain-age
cracking. This enables
better manufacturability for the production of tubular products as well as
better weld fabricability
for end-users. We also increased the chromium level of the alloy to about 18-
25% to ensure
adequate oxidation resistance at the reduced aluminum level. Small amounts of
silicon and
manganese are also added to improve oxidation resistance.
We provide a nickel base alloy containing by weight 25-30% iron, 18-25%
chromium,
3.0-4.5% aluminum, 0.2-0.6% titanium, 0.2-0.4% silicon and 0.2-0.5% manganese.
The alloy
may also contain yttrium, cerium and lanthanum in amounts up to 0.01%. Carbon
may be
present in an amount up to 0.25%. Boron may be in the alloy up to 0.004%,
zirconium may be
3.
CA 02645596 2011-07-29
present up to 0.025%. The balance of the alloy is nickel plus impurities. In
addition, the total content
of aluminum plus titanium should be between 3.4% and 4.2% and the ratio of
chromium to aluminum
should be from about 4.5 to 8.
We prefer to provide an alloy composition containing 26.8-31.8% iron, 18.9-
24.3%
chromium, 3.1-3.9% aluminum, 0.3-0.4% titanium, 0.2-0.35% silicon, up to 0.5%
manganese, up to
0.005% of each of yttrium, cerium and lanthanum, up to 0.06% carbon, less than
0.002% boron, less
than 0.00 1% zirconium and the balance nickel plus impurities. We also prefer
that the total aluminum
plus titanium be between 3.4% and 4.3% and that the chromium to aluminum ratio
be from 5.0 to 7Ø
Our most preferred composition contains 27.5% iron, 20% chromium, 3.75%
aluminum,
0.25% titanium, 0.05% carbon, 0.3% silicon, 0.3% manganese, trace amounts of
cerium and
lanthanum and the balance nickel plus impurities.
In one aspect, the invention relates to a weldable, high temperature,
oxidation resistant alloy
consisting essentially of, by weight percent, 25% to 32% iron, 18 to 25%
chromium, 3.0 to 4.5%
aluminum, 0.2 to 0.6% titanium, 0.2 to 0.4% silicon, 0.2 to 0.5% manganese, up
to 2.0% cobalt, up to
0.5% molybdenum, up to 0.5% tungsten, up to 0.01% magnesium, up to 0.25%
carbon, up to 0.025%
zirconium, up to 0.01% yttrium, up to 0.01 % cerium, up to 0.01% lanthanum,
and the balance nickel
plus impurities, AI+Ti content is from 3.4% to 4.2% and chromium and aluminum
are present in
amounts so that a Cr/Al ratio is from 4.5 to 8.
In another aspect, the alloy has a weight percent of 26.8% to 31.8% iron,
18.9%-24.3%
chromium, 3.1%-3.9% aluminum, 0.3%-0.4% titanium, 0.25-0.35% silicon, 0.2 to
0.4% manganese,
up to 0.005% of each of yttrium, cerium and lanthanum, up to 0.06% carbon,
less than 0.004% boron,
less than 0.01 % zirconium and the balance nickel plus impurities.
In yet another aspect, the AI+Ti content is from 3.8% to 4.2%, preferably from
3.9% to 4. 1%.
In still another aspect, the alloy has a Cr/Al ratio from 5.0 to 7.0,
preferably from 5.2 to 7Ø
In yet still another aspect, niobium is present as an impurity in an amount
not greater than
0.15%.
In a further aspect, the invention relates to a weldable, high temperature
oxidation resistant
alloy comprising in weight percent 27.5% iron, 20% chromium, 3.75% aluminum,
0.25% titanium,
0.05% carbon, 0.3% silicon, 0.25% manganese and the balance nickel plus
impurities.
4
CA 02645596 2011-07-29
Other preferred compositions and advantages of our alloy will become apparent
from the
description of the preferred embodiments and test data reported herein.
Brief Description of the Figures
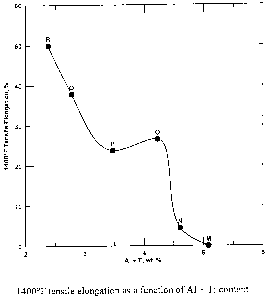
Figure 1 is a graph showing tensile elongation at 1400 F as a function of
AI+Ti content.
Figure 2 is a graph showing tensile elongation 1400 F as a function of Cr/Al
ratio.
Figure 3 is a graph showing the average amount of metal affected as a function
of Cr/Al ratio
in static condition test at 1800 F.
Figure 4 is a graph showing the effect of silicon content on 1400 F tensile
elongation.
Description of the Preferred Embodiments
Five fifty-pound heats were VIM melted, ESR remelted, forged and hot rolled at
2150 F to
0.188" plate, cold rolled to 0.063 thick sheet, and annealed at 2000 F.
(VIM: vacuum induction melting; ESR: electroslag remelting)
The five alloys had the chemical compositions shown in Table I:
4a
CA 02645596 2008-12-02
Table I. Comp osition, weight
Heat A Heat B Heat C Heat D Heat E
Ni 52.39 61.44 55.84 60.07 50.00
Fe 24.63 14.00 20.04 15.19 25.05
Al 3.0 3.28 3.49 4.06 3.86
Cr 19.50 19.67 19.72 19.86 19.51
C 0.047 0.049 0.046 0.05 0.051
B 0.004 0.004 0.003 0.005 0.004
Zr 0.02 0.05 0.05 0.02 0.02
Mn 0.23 0.23 0.23 0.23 0.24
Si 0.009 0.003 0.015 0.010 0.028
Y 0.001 0.008 0.005 0.007 0.006
We evaluated samples of these alloys and a commercial heat of 214 alloy using
static
oxidation testing at 1800 F, and a controlled heating rate tensile (CHRT) test
to measure
mechanical properties. The controlled heating rate test was intended to be a
tool to discern
susceptibility of an alloy to strain age cracking. Alloys which result in very
low percent
elongation at the mid-range ductility minimum are deemed more prone to strain
age cracking.
The results of the tests are presented in Tables II and III. The results of
testing alloys A
through E, lead to the conclusion that the E alloy best exemplified an alloy
having properties
close to what we desired. For example, it possessed l) 1800 F oxidation
resistance equal to 214
alloy, and 2) 1400 F CHRT ductility was six times greater than the 214 alloy.
The only major
deficiency was 1400 F yield strength (as measured in the CHRT test). It was
well below 214
alloy (44.2 ksi vs. 71.9 ksi).
Table II. Results of 1800 F oxidation tests in flowing air (1008 hours),
214 alloy
Heat A Heat B Heat C Heat D Heat E control
sample
Metal loss 0.06 0.07 0.05 0.05 0.04 0.04
Mils/side
Avg. internal 0.16 0.45 0.33 0.35 0.15 0.19
penetration, mils
Avg Metal affected, 0.22 0.52 0.38 0.40 0.19 0.23
mils
5.
CA 02645596 2008-12-02
Table III. 1400 F Controlled Heatin Rate Test (CHRT) tensile test results
Heat A Heat B Heat C Heat D Heat E 214 alloy
0.2% YS, 32.2 48.5 47.2 53.2 44.2 71.9
ksi
UTS, ksi 32.9 55.5 51.3 61.4 48.9 87.1
elongation, 104 35 40 23.5 49.3 7.2
Three more experimental heats were melted and processed to sheet in order to
develop
methods of improving the 1400 F yield strength by the addition of small
amounts of Group Vb
elements to refine the grain size. The experimental heats were processed to
0.125" thick sheet
which was annealed at 2050 F in order to obtain a finer grain size than the
heats of Example 1.
The three alloy nominal compositions are shown in Table IV.
Table W. Com osition of experimental heats, weight %.
Element Heat F Heat G Heat H
Ni 45.86 45.68 45.6
Fe 29.61 30.32 29.87
Al 3.66 3.69 3.91
Cr 19.73 19.53 19.81
C 0.056 0.059 0.054
B 0.004 0.004 0.004
Zr 0.02 0.02 0.02
Mn 0.20 0.20 0.19
Si 0.27 0.27 0.27
Y <0.005 <0.005 <0.005
Ti - 0.26 -
V - - 0.20
Alloy F had no addition of a grain refiner, alloy G had a titanium aim of 0.3%
and alloy
H contained a vanadium addition (0.3% aim). An intentional silicon addition
was also made to
these alloys. The alloys were tested in a manner similar to alloys A-E except
standard 1400 F
tensile tests were conducted in lieu of the more time consuming CHRT testing.
The results are
shown in Tables V and VI.
6.
CA 02645596 2008-12-02
Table V. Results of 1800 F oxidation tests in flowing air (1008 hours)
Heat F Heat G Heat H 214 alloy
Metal loss
Mils/side 0.10 0.05 0.08 0.04
Avg. internal 0.66 0.38 0.58 0.39
penetration, mils
Avg. Metal 0.75 0.43 0.63 0.43
affected, mils
Table VI. 1400 F tensile test results.
Heat F Heat G Heat H 214 alloy
0.2% YS, ksi 45.9 57.8 50.1 80
U.T.S., ksi 57.4 70.9 59.8 102
Elongation, % 60.3 30.8 49.0 17
The results for the alloys indicated greater 1800 F oxidation attack than for
alloy E, and
the 1400 F yield strength of alloy G was greater than that of alloy E. None of
these alloy
compositions had all of the desired properties.
Another series of experimental compositions with a base chemistry between
alloy E and
alloy G were melted and processed to sheet in a manner similar to the prior
examples. The basic
compositional aim was an alloy consisting ofNi-27.5Fe-19.5Cr-3.8A1.
Intentional yttrium
additions typically added to the alloy disclosed in United States Patent No.
4,671,931 for
enhanced oxidation resistance were not made. All experimental heats in this
group, however, did
have a fixed addition of misch-metal to introduce trace amounts of rare earth
elements
(principally cerium and lanthanum). Titanium was added in small amounts to
alloy G and
showed promise as a way to boost 1400 F yield strength. For three of the four
alloys in example
3, the titanium was increased from about 0.25% to 0.45%. The silicon level was
also varied.
Two of the heats had no intentional silicon addition, while the other heats
had intentional silicon
contents of about 0.3%. The compositions of the experimental heats are given
in Table VII.
Results of the evaluations are presented in Tables VIII, IX and X.
7.
CA 02645596 2008-12-02
Table VII. Compositions of experimental heats, eight
%.
Element Heat I Heat J Heat K Heat L
Ni 49.02 49.11 48.34 49.05
Fe 27.73 27.38 27.52 27.28
Al 3.80 3.99 3.87 4.00
Cr 19.22 19.31 19.42 19.00
C 0.05 0.048 0.051 0.051
B <0.002 <0.002 <0.002 0.004
Zr <0.01 <0.01 <0.01 0.02
Mn 0.20 0.21 0.18 0.20
Si 0.31 0.02 0.29 0.02
Ti 0.03 0.46 0.43 0.41
Y <0.005 <0.005 <0.005 <0.005
Ce 0.006 <0.005 <0.005 <0.005
La <0.005 <0.005 <0.005 <0.005
Table VIII. Results of 1800 F oxidation tests in flowin air 1008 hours)
214 alloy
Heat I Heat J Heat K Heat L control
Avg. internal 0.29 0.06 0.11 0.51 0.39
-penetration, mils
Avg. Metal 0.29 0.09 0.14 0.54 0.43
affected, mils
Table IX. 1400 F tensile test results.
Heat I Heat J Heat K Heat L 214 alloy
0.2% YS, 43.8 59.0 59.9 61.8 80
ksi
U.T.S, 56.4 69.2 71.0 72.0 102
ksi
Elongation, % 38.8 8.4 16.4 15.9 17
The 1400 F tensile data reveal some significant effects. The ductility dropped
from 38%
for alloy 1(3.8% Al and no titanium) to levels of 8 to 16 % for the other 3
alloys (J,K and L),
containing about 3.9 to 4.0% Al plus 0.45% titanium. This indicated that the
Ni-Fe-Cr-Al alloy
of this invention was sensitive to the total aluminum plus titanium content
(gamma prime
forming elements). Low ductility values in the 1400 F range are indicative of
gamma prime
precipitation.
8.
CA 02645596 2008-12-02
The 1800 F oxidation test results were encouraging. The average metal affected
results
indicated that the oxidation resistance was generally better than alloy G.
Alloy J, for example,
had very scant internal oxidation and had the best 1800 F oxidation
performance (0.09 mils) of
all the experimental alloys tested.
Samples of the experimental heats were also tested in a dynamic oxidation test
rig. This
is a test in which the samples are held in a rotating carousel which is
exposed to combustion
gases with a velocity of about Mach 0.3. Every 30 minutes, the carousel was
cycled out of the
combustion zone and cooled by an air blower to a temperature less than about
300 F. The
carousel was then raised back into the combustion zone for another 30 minutes.
The test lasted
for 1000 hours or 2000 cycles. At the conclusion of the test, the samples were
evaluated for
metal loss and internal oxidation attack using metallographic techniques. The
results are
presented in Table X. Surprisingly, under dynamic test conditions, alloy J
behaved poorly and in
fact had to be pulled from the test after completion of 889 hours. The test
samples showed signs
of deterioration of the protective oxide scale as did samples from alloy L.
Recalling the
experimental design of alloys I through L, the addition of silicon (0.3%) was
one of the
variables. Alloys J and L were melted without any intentional silicon
addition, whereas alloys I
and K had an intentional silicon addition. It would appear then, that there is
a distinct beneficial
effect of silicon addition on dynamic oxidation resistance. In static
oxidation, all the results were
less than 0.6 mils, and the test was less discerning than the dynamic test.
Furthermore, the
results for alloys I and K had average metal affected values less than the 214
alloy control
sample in the same test run. Only alloy K possessed all of the properties we
are seeking.
9.
CA 02645596 2008-12-02
Table X. Results of dynamic oxidation testing at 1800 F/1000 hours.
Heat I Heat J Heat K Heat L 214 alloy
control
Metal loss 1.0 2.3 0.9 1.4 1.3
Mils/side
Avg internal 0.7 5.2 0.0 2.0 1.1
en., mils
Avg Metal 1.7 7.5(1) 0.9 3.4 2.4
affected, mils
(1) wide variation observed in the duplicate samples (e.g. 11.1 and 3.9 mils)
both samples began to
deteriorate and were pulled after 889 hours
A series of six experimental alloys were melted and processed to explore the
effect of
increasing chromium levels while simultaneously decreasing the aluminum levels
at a constant
iron level. A seventh heat was melted to explore high levels of iron and
chromium. These alloy
compositions were cold rolled into sheet form and given an annealing treatment
at 2075 F/15
minutes/water quench. The aim compositions are shown in Table XI. Results of
the evaluations
are shown in Tables XII and XIII. The yield strength tended to increase with
AI+Ti, which was
not unexpected. It would appear that the optimum alloy would require greater
than about 3.8%
AI+Ti in order to achieve 1400 F strength levels greater than 50 Ksi, but a
total of as low as 3.4
is acceptable as evidenced by the performance of alloy P. Alloys 0, P and S
all had the
properties we were seeking.
10.
CA 02645596 2008-12-02
Table XI. Comp ositions of the experimental alloys, weight %.
Element Heat M Heat N Heat 0 Heat P Heat Q Heat R Heat S
(wt%)
Ni 51.07 49.61 47.18 47.13 45.58 44.08 39.32
Cr 15.98 18.04 20.2 21.86 23.94 25.9 24.26
Fe 26.78 26.92 27.55 26.86 26.95 26.86 31.8
Al 4.73 4.27 3.87 3.12 2.45 2.06 3.53
Ti 0.36 0.34 0.35 0.34 0.32 0.32 0.32
Mn 0.26 0.25 0.26 <0.01 0.27 0.26 0.26
Si 0.32 0.28 0.32 0.33 0.33 0.31 0.27
C 0.054 0.06 0.06 0.06 0.06 0.05 0.05
Y <0.002 <0.002 <0.002 <0.002 <0.002 <0.002 <0.002
Ce <0.005 0.006 <0.005 <0.005 0.005 0.008 0.008
AI+Ti 5.09 4.61 4.22 3.46 2.77 2.38 3.85
Cr/Al 3.4 4.2 5.2 7.0 9.8 12.6 6.9
Table XII. Results of 1400 F tensile tests.
Heat M Heat N Heat 0 Heat P Heat Q Heat R Heat S
0.2% YS, ksi 66.1 63.0 58.2 52.3 47.0 43.4 54.9
U TS, ksi 78.9 73.4 69.8 62.7 56.5 52.7 64.6
Elongation, % 0** 4.4 26.6 23.8 37.9 50.0 38.8
** both samples broke in the gauge marks, the adjusted gauge length values
averaged 3.7%
The 1400 F tensile ductility data for six experimental alloys (increasing
chromium with
decreasing aluminum) with a constant iron level is plotted in Figure 1 versus
combined
aluminum and titanium content. The 1400 F tensile elongation tended to
decrease with
increasing AI+Ti with a rapid drop off in ductility when AI+Ti exceeded about
4.2%. Hence, a
critical upper limit of 4.2% AI+Ti is defined for the best balance in elevated
temperature
properties (i.e. high strength and good ductility). From alloy S we conclude
that the optimum
alloy would require greater than about 3.8% Al+Ti in order to achieve adequate
1400 F yield
strength, but less than 4.2% AI+Ti, in order to maintain adequate ductility. A
plot of 1400 F
tensile ductility versus Cr/Al ratio for the experimental alloys in Table XI
is shown in Figure 2,
illustrating the effect of increasing Cr/Al ratio. Good ductility is indicated
when the Cr/Al ratio
is greater than about 4.5. This ratio appeared to apply to alloy S as well
even though it had a higher
level of iron.
11.
CA 02645596 2011-07-29
The 1800 F static oxidation test results are shown in Table XIII and plotted
in Figure 3 as a
function of Cr/Al ratio at a constant iron level. The values obtained for
alloy N were erratic, and,
therefore, are not included in the table. The dramatic effect of the Cr/Al
ratio is clear from the figure.
The best oxidation resistance was obtained when the ratio was between about
4.5 to 8. The oxidation
resistance of alloy S was not as good as the heats with Cr/Al values within
this range probably due to
its higher iron content. However, it did have oxidation resistance as good as
the 214 alloy shown in
Table V.
Table XIII. Results of 1800 F static oxidation tests
Heat M Heat 0 Heat P Heat Q Heat R Heat S
Metal Loss, mils 0.04 0.03 0.06 0.05 0.08 0.03
Avg. internal 0.15 0.14 0.11 0.26 0.49 0.36
penetration
Avg. metal affected, 0.26 0.17 0.17 0.31 0.57 0.39
mils
One additional alloy (Heat T) was produced. It had a composition close to Heat
J in Table
VII, an alloy close to the preferred embodiment of this invention, but the
AI+Ti content was lower,
and the Cr/Al ratio was slightly higher. A small addition of silicon was made
to alloy T, whereas no
silicon was added to alloy J. The resulting composition is shown in Table XIV.
Samples of cold rolled
sheet of Heat T were subjected to a 2100 F/15 minute anneal/rapid air cool
(RAC). Duplicate tensile
tests were conducted at room temperature and at elevated temperature from 1000
to 1800 F in 200
degree increments. The results are presented in Table XV. It was found that
from 1000 F, the yield
strength increased to a maximum at 1400 F (57 Ksi) and then dropped rapidly. A
mid range ductility
dip was observed at 1200-1400 F, with a minimum ductility of 12% elongation at
1400 F. The 12%
elongation was higher than Heat J (8.4%). Alloy T did have all of the desired
properties.
12
CA 02645596 2008-12-02
Table XIV. Composition for alloy T, weight %.
Element Heat T
Ni 48.78
Cr 18.94
Fe 27.3
Al 3.82
Ti 0.32
Al +Ti 4.14
Si 0.21
Mn 0.21
C 0.06
Y <0.002
Ce <0.005
La <0.005
Table XV. Tensile test results for alloy T.
Test temperature, F 0.2% YS, ksi UTS, ksi Elongation, %
Room 42.6 100.9 51.1
1000 38.5 89.3 64.8
1200 52.0 76.0 18.2
1400 56.9 66.5 12.0
1600 13.9 20.1 115.8
1800 6.6 9.7 118.7
It was of interest to discern why several alloys close to the preferred
embodiments of
alloys K, 0, P, S and T had different 1400 F ductilities. For example, why was
the ductility of
Heat N so much higher than for alloys J and T? After focusing on the actual
chemical analysis
of each heat, it was discovered that silicon additions were beneficial to the
1400 F ductility in
alloys containing AI+Ti contents in the range of 3.8% to 4.2%. Referring to
the 4 experimental
heats in Table VII, it should be noted that alloy K was melted as the silicon
containing
counterpart to "no silicon" alloy J. The silicon content of alloy K was 0.29%
and its 1400 F
ductility was 16.4 %, twice the value of no silicon alloy J. Figure 4 is a
graph of the 1400 F %
elongation of four alloys with nearly the same composition, and it shows the
effect of silicon on
improving hot tensile ductility. It clearly indicates that the silicon content
should be above about
0.2% for good 1400 F ductility, and, thereby, good resistance to strain-age
cracking. This
observation was completely unexpected.
13.
CA 02645596 2008-12-02
It was suspected that high silicon contents might lead to a weldability
problem known as
hot cracking, which occurs in the weld metal during solidification. To check
for this, samples of
experimental Heats J, K, N, and T, which had similar compositions except for
silicon contents,
were evaluated by subscale varestraint tests. Samples of alloy E that were
tested are included to
illustrate the negative effects of boron and zirconium. The results are
summarized in Table XVI.
Table XVI. Subscale Varestraint weldability results: (total crack length at
1.6% augmented
Strain). Values reported in mils are an average of two tests.
Heat J Heat T Heat K Heat N Heat E Ref. 2 alloy
% Si 0.02 0.21 0.29 0.32 0.028 NA
B, Zr, % - - - - 0.004, 0.02 NA
Avg. total crack 78 77 80 109 153 171
length, mils
The data indicates that there was no adverse effect of silicon additions up to
0.29%.
When the silicon content was above about 0.3%, the hot crack sensitivity
increased by about
40%. It was observed, however, that the hot crack sensitivity of alloy N was
still much less than
214 alloy. The results for alloy E indicate that the presence of boron and
zirconium have a
negative impact on hot cracking sensitivity. These elements are typically
added to the 214 alloy.
If these elements were left out of alloy E, and additions of 0.2 to 0.6
titanium and 0.2 to 0.4
silicon were made, then it is expected that the resulting alloy would have
good resistance to hot
cracking and all of the attributes claimed in this invention. This modified
alloy E would contain
25.05% iron, 3.86% aluminum, 19.51% chromium, 0.05% carbon, less than 0.025%
zirconium,
0.2-0.4% silicon, 0.2-0.6% titanium, less than 0.005% of each of yttrium,
cerium and lanthanum
and the balance nickel plus impurities.
14.
CA 02645596 2008-12-02
TABLE XVII Alloys Have Desired Properties
Modified
Heat E Heat K Heat 0 Heat P Heat S Heat T
Ni bal. 48.34 4718 47.13 39.32 48.78
Fe 25.05 27.28 27.55 26.86 31.8 27.3
Al 3.86 3.87 3.87 3.12 3.53 3.82
Cr 19.51 19.42 20.2 21.86 24.26 18.94
C 0.05 0.051 0.06 0.06 0.05 0.06
B <0.002 -- -- -- --
Zr <0.025 <0.01 -- -- -- --
Mn 0.18 0.26 <0.01 0.26 0.21
Si 0.2-0.4 0.29 0.32 0.33 0.27 0.21
Ti 0.2-0.6 0.43 0.35 0.34 0.32 0.32
Y <0.005 <0.005 <0.002 <0.002 <0.002 <0.005
Ce <0.005 <0.005 <0.005 <0.005 0.008 <0.005
La <0.005 <0.005 -- -- -- <0.005
AI+Ti 4.06-4.26 3.83 4.22 3.46 3.85 4.14
Cr/Al 5.0 5.0 5.2 7.0 6.8 5.0
-- Not Measured
Table XVII contains the tested alloys having the desired properties and the
composition
of each alloy along with the modified Heat E. From this table and the figures
we conclude that
the desired properties can be obtained in an alloy containing 25-32% iron, 18-
25% chromium,
3.0-4.5% aluminum, 0.2-0.6% titanium, 0.2-0.4% silicon and 0.2-0.5% manganese.
The alloy
may also contain yttrium, cerium and lanthanum in amounts up to 0.01%. Carbon
may be
present in an amount up to 0.25 %., but typically will be present at a level
less than 0.10%.
Boron may be in the alloy up to 0.004%, and zirconium may be present up to
0.025%.
Magnesium maybe present up to 0.01%. Trace amounts of niobium up to 0.15% may
be
present. Each of tungsten and molybdenum may be present in an amount up to
0.5%. Up to
2.0% cobalt may be present in the alloy. The balance of the alloy is nickel
plus impurities. In
addition, the total content of aluminum plus titanium should be between 3.4%
and 4.2% and the
ratio of chromium to aluminum should be from about 4.5 to 8. However, more
desirable
properties will be found in alloys having a composition of 26.8-31.8% iron,
18.9-24.3%
chromium, 3.1-3.9% aluminum, 0.3-0.4% titanium, 0.25-0.35% silicon, up to 0.35
manganese,
15.
CA 02645596 2008-12-02
up to 0.005% of each of yttrium, cerium and lanthanum, up to 0.06 carbon, less
than 0.004
boron, less than 0.01 zirconium and the balance nickel plus impurities. We
also prefer that the
total aluminum plus titanium be between 3.4% and 4.2% and that the chromium to
aluminum
ratio be from 5.0 to 7Ø
We concluded that the optimum alloy composition to achieve the desired
properties
would contain 27.5% iron, 20% chromium, 3.75% aluminum, 0.25% titanium, 0.05%
carbon,
0.3% silicon, 0.25% manganese, trace amounts of cerium and lanthanum up to
0.015% and the
balance nickel plus impurities.
Although we have described certain present preferred embodiments of our alloy,
it should
be distinctly understood that our alloy is not limited thereto, but may be
variously embodied
within the scope of the following claims.
16.