Note : Les descriptions sont présentées dans la langue officielle dans laquelle elles ont été soumises.
CA 02654442 2012-04-26
5109 9 ¨ 3
Method for Acquiring and Interpreting Seismoelectric and Electroseismic Data
Background of the Invention
Field of the Invention
[0001] The
invention relates generally to the field of seismoelectric and electroseismic
surveying of the Earth's subsurface. More specifically, the invention relates
to methods
for acquiring electroseismic and seismoelectric surveys such that subsurface
features may
be more readily identified.
Background Art
[0002]
Electromagnetic geophysical surveying known in the art includes "controlled
source" electromagnetic surveying.
Controlled source electromagnetic surveying
includes imparting an electric field or a magnetic field into the Earth
formations, those
formations being below the sea floor in marine surveys, and measuring
properties of
electric fields and/or magnetic fields induced in response. The electric
and/or magnetic
field properties are measured by measuring voltages induced in electrodes,
antennas
and/or interrogating magnetometers disposed at the Earth's surface, or on or
above the
sea floor. The electric and/or magnetic field properties are used to make
inferences about
the spatial distribution of electrical conductivity of the Earth's subsurface.
[0003]
Controlled source electromagnetic surveying known in the art includes
imparting
alternating electric current into formations below the sea floor. The
alternating current
has one or more selected frequencies. Such surveying is known as frequency
domain
controlled source electromagnetic (f-CSEM) surveying. f-CSEM surveying
techniques
are described, for example, in Sinha, M.C. Patel, P.D., Unsworth, M.J., Owen,
T.R.E.,
and MacCormack, M.G.R., 1990, An active source electromagnetic sounding system
for
marine use, Marine Geophysical Research, 12, 29-68. Other publications which
describe
the physics of and the interpretation of electromagnetic subsurface surveying
include:
Edwards, R.N., Law, L.K., Wolfgram, PA., Nobes, D.C., Bone, M.N., Trigg, D.F.,
and
DeLaurier, J.M., 1985, First results of the MOSES experiment: Sea sediment
conductivity
CA 02654442 2008-11-27
WO 2008/066957 PCT/US2007/069843
and thickness determination, Bute Inlet, British Columbia, by magnetometric
offshore
electrical sounding: Geophysics 50, No. 1, 153-160; Edwards, R.N., 1997, On
the
resource evaluation of marine gas hydrate deposits using the sea-floor
transient electric
dipole-dipole method: Geophysics, 62, No. 1, 63-74; Chave, A.D., Constable,
S.C. and
Edwards, R.N., 1991, Electrical exploration methods for the seafloor:
Investigation in
geophysics No 3, Electromagnetic methods in applied geophysics, vol. 2,
application,
part B, 931-966; and Cheesman, S.J., Edwards, R.N., and Chave, A.D., 1987, On
the
theory of sea-floor conductivity mapping using transient electromagnetic
systems:
Geophysics, 52, No. 2, 204-217.
[0004] Following are described several patent publications which describe
various
aspects of electromagnetic subsurface Earth surveying. U.S. Patent No.
5,770,945 issued
to Constable describes a magnetotelluric (MT) system for sea floor petroleum
exploration. The disclosed system includes a first waterproof pressure case
containing a
processor, AC-coupled magnetic field post-amplifiers and electric field
amplifiers, a
second waterproof pressure case containing an acoustic navigation/release
system, four
silver-silver chloride electrodes mounted on booms and at least two magnetic
induction
coil sensors. These elements are mounted together on a plastic and aluminum
frame
along with flotation devices and an anchor for deployment to the sea floor.
The acoustic
navigation/release system serves to locate the measurement system by
responding to
acoustic "pings" generated by a ship-board unit, and receives a release
command which
initiates detachment from the anchor so that the buoyant package floats to the
surface for
recovery. The electrodes used to detect the electric field are configured as
grounded
dipole antennas. Booms by which the electrodes are mounted onto a frame are
positioned
in a configuration to create two orthogonal dipoles. The two orthogonal
dipoles are used
to measure the complete vector electric field. The magnetic field sensors are
multi-turn,
Mu-metal core wire coils which detect magnetic fields within the frequency
range
typically used for land-based MT surveys. The magnetic field coils are encased
in
waterproof pressure cases and are connected to the logger package by high
pressure
waterproof cables. The logger unit includes amplifiers for amplifying the
signals
received from the various sensors, which signals are then provided to the
processor which
2
CA 02654442 2008-11-27
WO 2008/066957 PCT/US2007/069843
controls timing, logging, storing and power switching operations. Temporary
and mass
storage is provided within and/or peripherally to the processor. There is no
active source
in such MT methods, which rely upon naturally occurring EM fields.
[0005] U.S. Patent No. 6,603,313 B1 issued to Srnka discloses a method for
surface
estimation of reservoir properties, in which average earth resistivities
above, below, and
horizontally adjacent to specifically located subsurface geologic formations
are first
determined or estimated using geological and geophysical data in the vicinity
of the
subsurface geologic formation. Then dimensions and probing frequency for an
electromagnetic source are determined to substantially maximize transmitted
vertical and
horizontal electric currents at the subsurface geologic formation, using the
location and
the average earth resistivities. Next, the electromagnetic source is activated
at or near the
sea floor, approximately centered above the subsurface geologic formation and
a plurality
of components of electromagnetic response is measured with a receiver array.
Geometrical and electrical parameter constraints are determined, using the
geological and
geophysical data. Finally, the electromagnetic response is processed using the
geometrical and electrical parameter constraints to produce inverted vertical
and
horizontal resistivity depth images. Optionally, the inverted resistivity
depth images may
be combined with the geological and geophysical data to estimate the reservoir
fluid and
shaliness (fractional volume in the formation of clay-bearing rocks called
"shale")
properties.
[0006] U.S. Patent No. 6,628,119 B1 issued to Eidesmo et al. discloses a
method for
determining the nature of a subterranean reservoir whose approximate geometry
and
location are known. The disclosed method includes: applying a time varying
electromagnetic field to the strata containing the reservoir; detecting the
electromagnetic
wave field response; and analyzing the effects on the characteristics of the
detected field
that have been caused by the reservoir, thereby determining the content of the
reservoir,
based on the analysis.
[0007] U.S. Patent No. 6,541,975 B2 issued to Strack discloses a system
for generating
an image of an Earth formation surrounding a borehole penetrating the
formation.
3
CA 02654442 2008-11-27
WO 2008/066957 PCT/US2007/069843
Resistivity of the formation is measured using a DC measurement, and
conductivity and
resistivity of the formations are measured with a time domain signal or AC
measurement.
Acoustic velocity of the formation is also measured. The DC resistivity
measurement, the
conductivity measurement made with a time domain electromagnetic signal, the
resistivity measurement made with a time domain electromagnetic signal and the
acoustic
velocity measurements are combined to generate the image of the Earth
formation.
[0008] International Patent Application Publication No. WO 0157555 Al
discloses a
system for detecting a subterranean reservoir or determining the nature of a
subterranean
reservoir whose position and geometry is known from previous seismic surveys.
An
electromagnetic field is applied by a transmitter on the seabed and is
detected by
antennae also on the seabed. A refracted wave component is sought in the wave
field
response, to determine the nature of any reservoir present.
[0009] International Patent Application Publication No. WO 03048812 Al
discloses an
electromagnetic survey method for surveying an area previously identified as
potentially
containing a subsea hydrocarbon reservoir. The method includes obtaining first
and
second survey data sets with an electromagnetic source aligned end-on and
broadside
relative to the same or different receivers. The invention also relates to
planning a survey
using this method, and to analysis of survey data taken in combination so as
to allow the
galvanic contribution to the signals collected at the receiver to be
contrasted with the
inductive effects, and the effects of signal attenuation (which are highly
dependent on
local properties of the rock formation, overlying water, and air at the survey
area). This
is very important to the success of using electromagnetic surveying for
identifying
hydrocarbon reserves and distinguishing them from other classes of subsurface
formations.
[0010] U.S. Patent No. 6,842,006 B1 issued to Conti et al. discloses a sea-
floor
electromagnetic measurement device for obtaining underwater magnetotelluric
(MT)
measurements of earth formations. The device includes a central structure with
arms
pivotally attached thereto. The pivoting arms enable easy deployment and
storage of the
device. Electrodes and magnetometers are attached to each arm for measuring
electric
4
CA 02654442 2008-11-27
WO 2008/066957 PCT/US2007/069843
and magnetic fields respectively, the magnetometers being distant from the
central
structure such that magnetic fields present therein are not sensed. A method
for
undertaking sea floor measurements includes measuring electric fields at a
distance from
the structure and measuring magnetic fields at the same location.
[0011] U.S. Patent Application Publication No. 2004/232917 relates to a
method of
mapping subsurface resistivity contrasts by making multichannel transient
electromagnetic (MTEM) measurements on or near the Earth's surface using at
least one
source, receiving means for measuring the system response and at least one
receiver for
measuring the resultant earth response. All signals from each source-receiver
pair are
processed to recover the corresponding electromagnetic impulse response of the
earth and
such impulse responses, or any transformation of such impulse responses, are
displayed
to create a subsurface representation of resistivity contrasts. The system and
method
enable subsurface fluid deposits to be located and identified and the movement
of such
fluids to be monitored.
[0012] U.S. Patent No. 5,467,018 issued to Rueter et al. discloses a
bedrock exploration
system. The system includes transients generated as sudden changes in a
transmission
stream, which are transmitted into the Earth's subsurface by a transmitter.
The induced
electric currents thus produced are measured by several receiver units. The
measured
values from the receiver units are passed to a central unit. The measured
values obtained
from the receiver units are digitized and stored at the measurement points,
and the central
unit is linked with the measurement points by a telemetry link. By means of
the
telemetry link, data from the data stores in the receiver units can be
successively passed
on to the central unit.
[0013] U.S. Patent No. 5,563,913 issued to Tasci et al. discloses a method
and apparatus
used in providing resistivity measurement data of a sedimentary subsurface.
The data are
used for developing and mapping an enhanced anomalous resistivity pattern. The
enhanced subsurface resistivity pattern is associated with and an aid for
finding oil and/or
gas traps at various depths down to a basement of the sedimentary subsurface.
The
apparatus is disposed on a ground surface and includes an electric generator
connected to
CA 02654442 2008-11-27
WO 2008/066957 PCT/US2007/069843
a transmitter with a length of wire with grounded electrodes. When large
amplitude, long
period, square waves of current are sent from a transmission site through the
transmitter
and wire, secondary eddy currents are induced in the subsurface. The eddy
currents
induce magnetic field changes in the subsurface which can be measured at the
surface of
the earth with a magnetometer or induction coil. The magnetic field changes
are received
and recorded as time varying voltages at each sounding site. Information on
resistivity
variations of the subsurface formations is deduced from the amplitude and
shape of the
measured magnetic field signals plotted as a function of time after applying
appropriate
mathematical equations. The sounding sites are arranged in a plot-like manner
to ensure
that areal contour maps and cross sections of the resistivity variations of
the subsurface
formations can be prepared.
[0014] A limitation to f-CSEM techniques known in the art is that they are
typically
limited to relatively great water depth, on the order of 800-1,000 meters, or
a ratio of
ocean water depth to subsurface reservoir depth (reservoir depth measured from
the sea
floor) of greater than about 1.5 to 2Ø
[0015] A typical f-CSEM marine survey can be described as follows. A
recording vessel
includes cables which connect to electrodes disposed near the sea floor. An
electric
power source on the vessel charges the electrodes such that a selected
magnitude of
alternating current, of selected frequency or frequencies, flows through the
sea floor and
into the Earth formations below the sea floor. At a selected distance
("offset") from the
source electrodes, receiver electrodes are disposed on the sea floor and are
coupled to a
voltage measuring circuit, which may be disposed on the vessel or a different
vessel. The
voltages imparted into the receiver electrodes are then analyzed to infer the
structure and
electrical properties of the Earth formations in the subsurface.
[0016] Another technique for electromagnetic surveying of subsurface Earth
formations
known in the art is transient controlled source electromagnetic surveying (t-
CSEM). In t-
CSEM, electric current is imparted into the Earth at the Earth's surface (or
sea floor), in a
manner similar to f-CSEM. The electric current may be direct current (DC). At
a
selected time, the electric current is switched off, switched on, or has its
polarity changed,
6
CA 02654442 2008-11-27
WO 2008/066957 PCT/US2007/069843
and induced voltages and/or magnetic fields are measured, typically with
respect to time
over a selected time interval, at the Earth's surface or water surface.
Alternative
switching strategies are possible; as will be explained in more detail below.
Structure of
the subsurface is inferred by the time distribution of the induced voltages
and/or magnetic
fields. t-CSEM techniques are described, for example, in Strack, K.-M., 1992,
Exploration with deep transient electromagnetics, Elsevier, 373 pp. (reprinted
1999).
[0017] Other techniques used to make inferences about the structure and
composition of
the formations in the Earth's subsurface include seismoelectric surveying and
electroseismic surveying. Electroseismic surveying is described in U.S. Patent
No.
5,486,764 issued to Thompson et al., which method and apparatus for estimating
the
Earth's resistance (conductivity) as a function of depth. Resistance is
determined by the
frequency-dependent attenuation of reflected electromagnetic (EM) signals
which are
produced by application of seismic signals to the Earth. A seismic wave is
applied by
conventional means into the Earth, and EM waves propagate back to the Earth's
surface
from different reflectors at different depth levels in the subsurface. The
propagation back
through the Earth attenuates the high frequencies preferentially. EM waves
generated at
lower depths are more attenuated relative to those waves generated at
shallower depths.
The method and apparatus described in the Thompson '764 patent determines the
difference in spectral content between the reflected EM signals from different
horizons
based on their relative attenuation, and uses these differences as a direct
measure of the
conductivity between the reflective horizons. Inverse electroseismic
prospecting
techniques can be used to impart EM waves into the Earth and use reflected
seismic
waves to determine electrical resistance as a function of depth. The '764
patent also
describes the inverse process, called seismoelectric prospecting, in which
seismic waves
are imparted into the Earth and induced voltages are detected in response
thereto.
[0018] U.S. Patent No. 5,841,280 issued to Yu et al. describes a
seismoelectric well
logging instrument and method for using such instrument. The method disclosed
is for
estimating porosity of an earth formation from measurements of acoustic energy
traversing the earth formation and from measurements of seismoelectric
voltages
generated in the formation in response to the acoustic energy. The method
includes the
7
CA 02654442 2008-11-27
WO 2008/066957 PCT/US2007/069843
steps of measuring the acoustic energy traversing the earth formation and
measuring the
seismoelectric voltages generated in response to the acoustic energy
traversing the
formation. A seismoelectric signal is synthesized from the measurements of the
acoustic
energy using an initial value of the porosity. A difference is determined
between the
synthesized seismoelectric voltages and the measured seismoelectric voltages.
The initial
value of porosity is adjusted, and the steps of synthesizing the
seismoelectric voltages
from the acoustic signal, determining the difference, and adjusting the value
of porosity
are repeated until the difference drops below a predetermined threshold or the
difference
reaches a minimum value. The adjusted value of porosity which results in the
difference
being at the minimum is taken as the formation porosity. In a particular
embodiment, the
electrical conductivity of fluid in pore spaces of the earth formations can be
calculated.
The particular embodiment includes the steps of measuring the acoustic energy
traversing
the earth formation and measuring the seismoelectric voltages generated in
response to
the acoustic energy traversing the formation. A seismoelectric signal is
synthesized from
the measurements of the acoustic energy using an initial value of fluid
electrical
conductivity. A difference is determined between the synthesized
seismoelectric voltages
and the measured seismoelectric voltages.
The initial value of fluid electrical
conductivity is adjusted, and the steps of synthesizing the seismoelectric
voltages from
the acoustic signal, determining the difference, and adjusting the value of
conductivity
are repeated until the difference drops below a predetermined threshold or the
difference
reaches a minimum value. The adjusted value of fluid electrical conductivity
which
results in the difference being at the minimum is taken as the fluid
electrical conductivity.
[0019]
The origin of seismoelectric signals is shown in Figure lA and Figure 1B.
Figure
lA shows how Stoneley waves traveling through a borehole drilled through a
permeable
Earth formation can displace electrically conductive fluid in the pore spaces
of the
formation. Displacement of the fluid in the pore spaces causes an electric
field to be
generated. Figure 1B shows Stoneley waves moving along a borehole that
penetrates a
fractured Earth formation. Fluid in the fracture is displaced by the action of
the Stoneley
waves and generates an electromagnetic field in response. Figure 2A shows a
seismic
(acoustic pressure or compressional wave) reflection response from the Earth
to imparted
8
CA 02654442 2008-11-27
WO 2008/066957 PCT/US2007/069843
seismic energy. Figure 2B shows seismoelectric response of the same region of
the
Earth's subsurface, showing a degree of correspondence between seismic
response and
seismoelectric response of the Earth.
[0020] Adapting the foregoing electroseismic and seismoelectric techniques
to surveying
from the Earth's surface or from the surface of a body of water is known in
the art. Each
of the techniques described above, including controlled source electromagnetic
surveying, electroseismic surveying and seismoelectric surveying, and although
not
described above, but equally applicable to this description, seismic surveying
known in
the art, are each responsive to different characteristics of the formations in
the Earth's
subsurface. Combining the results of all of the foregoing survey techniques
can provide
improved analysis of the structure and composition of the formations in the
Earth's
subsurface. However, conducting four or more different types of surveys over
the same
area of the Earth's subsurface can be time consuming and expensive. Each of
the
foregoing techniques also investigates different volume in the Earth's
subsurface with
respect to the placement of the respective energy sources and detecting
devices used
therewith. Such differing volumes of investigation have made combining
acquisition and
combining results of the techniques to be impractical. What is needed is a
method and
system to combine various surface electric and seismic survey techniques to
improve the
quality of analysis of the Earth's subsurface. At the same time, integration
of such
interpretations with borehole or fluid injection/production measurements is
required to
provide results that are grounded in actual subsurface measurements, and/or
fluid
production information.
Summary of the Invention
[0021] One aspect of the invention is a method for subsurface Earth
surveying. A
method according to this aspect of the invention includes acquiring seismic
data over a
selected region of the Earth's subsurface. Seismoelectric data are acquired
over a
selected region of the Earth's subsurface. Electroseismic data are also
acquired over a
selected region of the Earth's subsurface. At least one type of
electromagnetic survey
data is acquired over a selected region of the Earth's subsurface. Survey
volumes of the
9
CA 02654442 2012-04-26
51099-3
seismic data, the seismoelectric data, the electroseismic data and the
electromagnetic data are matched, and a model of the Earth's subsurface is
generated using all of the seismic data, the seismoelectric data, the
electroseismic
data and the electromagnetic data.
[0022] Combining the characteristics of the various survey methods in a
systematic fashion allows a synergetic approach to subsurface imaging.
[0023] The scope of the appended claims is not to be limited by the
preferred
embodiments set forth below, which should be given the broadest interpretation
consistent with the description as a whole.
Brief Description of the Drawings
[0024] Figure 1A shows a graphic representation of seismoelectric
response of
a permeable Earth formation.
[0025] Figure 1B shows a graphic representation of seismoelectric
response of
a fractured Earth formation.
[0026] Figure 2A shows seismic amplitude response of a volume of the
Earth's
subsurface in conventional form.
[0027] Figure 2B shows seismoelectric response of a similar volume of
the
Earth's subsurface as for the seismic response of Figure 2A.
[0028] Figure 3A shows a marine transient electromagnetic survey
system
using a horizontal electric dipole current source. The system also includes a
seismic
source and seismic receivers.
[0029] Figure 3B shows a marine transient electromagnetic survey
system
using a vertical electric dipole current source.
CA 02654442 2012-04-26
51099-3
[0030] Figure 3C shows a switching arrangement for selectively coupling
spaced apart acquisition nodes to each other and to a voltage or
velocity/acceleration
measuring device.
10a
CA 02654442 2008-11-27
WO 2008/066957 PCT/US2007/069843
[0031] Figure 3D shows an embodiment of a water surface streamer-type
acquisition
system.
[0032] Figure 4 shows an array of t-CSEM sensors disposed in a plurality
of ocean
bottom cables or as nodes for acquiring a survey according to the invention.
[0033] Figure 5 shows one embodiment of a single ocean bottom t-CSEM
acquisition
system.
[0034] Figure 6 shows an alternative way to the horizontal dipole to
energize the Earth
using magnetic fields.
[0035] Figure 7 shows a flow chart of one embodiment of a processing and
interpretation
method according to the invention.
[0036] Figures 8A through 8D show, respectively, energy paths for seismic
generation
and detection and seismoelectric energy, a seismic trace, seismoelectric
detection, and
electroseismic energy generation and detection.
Detailed Description
[0037] Aside from logistical details, the techniques discussed herein are
equally
applicable to both marine and land surveys, although most of the description
is made with
reference to marine surveys. Accordingly, the invention is not limited in
scope to use
only with marine surveys.
[0038] Generally, an acquisition system that may be used in various
aspects of the
invention includes a seismic energy source, seismic sensors, an electric
and/or magnetic
field source, and electric and/or magnetic field sensors. Figure 3A shows one
embodiment of such a system for use with methods according to various aspects
of the
invention. The system includes a survey vessel 10 that moves in a
predetermined pattern
along the surface of a body of water 11 such as a lake or the ocean. The
vessel 10
includes thereon seismic and electromagnetic (EM) source actuation, signal
recording
and navigation equipment, shown generally at 12 and referred to collectively
herein as
the "control/recording system." The control/recording system 12 includes a
controllable
11
CA 02654442 2008-11-27
WO 2008/066957 PCT/US2007/069843
source of electric current (not shown separately) that is used to energize
transmitter
electrodes 16A 16B towed in the water 11, preferably near the bottom 13
thereof, to
impart an electric field into subsurface formations 15, 17 below the bottom 13
of the
water 11. The control/recording system 12 typically includes instrumentation
(not shown
separately) to determine the geodetic position of the vessel 10 at any time,
such as can be
performed using global positioning system (GPS) receivers or the like.
[0039] The control/recording system 12 in the present embodiment can
include
equipment to transfer signals between the recording system 12 and one or more
recording
buoys 22. The recording buoys 22 receive and store signals from each of a
plurality of
electromagnetic (EM) sensors 20 positioned at selected positions on the water
bottom 13.
The sensors 20 may be disposed along a cable 18. The cable 18 may be of a type
ordinarily used in connection with seismic sensors deployed on the water
bottom known
in the art as "ocean bottom cables." The EM sensors 20 are configured to
detect electric
and/or magnetic fields that result from electric fields induced in the Earth's
subsurface by
electric current passing through the transmitter electrodes 16A, 16B. The EM
sensors 20
will be explained in more detail below with reference to Figure 5. The
recording buoys
22 may include telemetry devices (not shown separately) to transmit the
detected signals
to the recording system 12 on the vessel 10, and/or may store the signals
locally for later
interrogation by the control/recording system 12 or by another interrogation
device.
Alternatively, the sensors' signals may be locally and autonomously recorded,
and such
recordings may be retrieved at the end of the survey.
[0040] The current source (not shown separately) in the control/recording
system 12 is
coupled to the electrodes 16A, 16B by a cable 14A. The cable 14A is configured
such
that the electrodes 16A, 16B can be towed essentially horizontally near the
water bottom
13 as shown in Figure 3A. In the present embodiment, the electrodes 16A, 16B
can be
spaced apart by about 50 meters, and can be energized such that about 1000
Amperes of
current flows through the electrodes 16A, 16B. The foregoing spacing and
current
produces an equivalent source moment to that generated in typical
electromagnetic
survey practice known in the art using a 100 meter long transmitter dipole,
and using 500
Amperes current. In either case the source moment can be about 5X10⁴ Ampere-
meters.
12
CA 02654442 2008-11-27
WO 2008/066957 PCT/US2007/069843
The electric current used to energize the transmitter electrodes 16A, 16B can
be direct
current (DC) that is switched off at a signal recording time index equal to
zero. It should
be understood, however, that switching DC off is only one implementation of
electric
current control that is operable to induce transient electromagnetic effects.
In other
embodiments, the electric current may be switched on, may be switched from one
polarity to the other (bipolar switching), or may be switched in a pseudo-
random binary
sequence (PRBS) or any hybrid derivative of such switching sequences. See, for
example, Duncan, P.M., Hwang, A., Edwards, R.N., Bailey, R.C., and Garland,
G.D.,
1980, The development and applications of a wide band electromagnetic sounding
system
using pseudo-noise source. Geophysics, 45, 1276-1296 for a description of PBRS
switching.
[0041] In the present embodiment, as the current through the transmitter
electrodes 16A,
16B is switched, a time-indexed recording of electric and/or magnetic fields
detected by
the various EM sensors 20 is made, either in the recording buoys 22 and/or in
the
control/recording system 12, depending on the particular configuration of
recording
and/or telemetry equipment in the recording buoys 22 and in the
control/recording system
12.
[0042] Figure 3B shows another implementation of signal generation and
recording, in
which the transmitter electrodes 16A, 16B are arranged such that they are
oriented
substantially vertically along a cable 14B configured to cause the electrodes
16A, 16B to
be oriented substantially vertically as shown in Figure 3B. Energizing the
electrodes
16A, 16B, detecting and recording signals is performed substantially as
explained above
with reference to Figure 3A. Some embodiments may include both the cable 14B
as
shown in Figure 3B, as well as a cable such as cable 14A shown in Figure 3A to
be able
to acquire signals induced by both vertical electric polarization as well as
horizontal
electric polarization. Still other embodiments may include rotation of the
electric field
imparted into the subsurface by applying selected fractions of the electric
current to both
the vertical electrode dipole (cable 14B in Figure 3B) and the horizontal
electric dipole
(cable 14A in Figure 3A).
13
CA 02654442 2008-11-27
WO 2008/066957 PCT/US2007/069843
[0043] Referring once again to Figure 3A, in the present embodiment, the
vessel 10 or
another vessel (not shown) may also tow a seismic energy source, shown
generally at 9.
The seismic energy source 9 is typically an array of air guns, but can be any
other type of
seismic energy source known in the art. The control/recording system 12 can
include
control circuits (not shown separately) for actuating the seismic source 9 at
selected
times, and recording circuits (not shown separately) for recording signals
produced by
seismic sensors. In the present embodiment, the ocean bottom cables 18 may
also
include seismic sensors 21. The seismic sensors 21 are preferably "four
component"
sensors, which as known in the art include three orthogonal geophones or
similar motion
or acceleration sensors collocated with a hydrophone or similar pressure
responsive
sensor. Four component ocean bottom cable seismic sensors are well known in
the art.
See, for example, U.S. Patent No. 6,021,090 issued to Gaiser et al.
[0044] Figure 4 shows a typical arrangement of ocean bottom cables 18
having EM
sensors 20 and seismic sensors 21 at spaced-apart positions thereon for
acquiring a three
dimensional survey according to the invention. Each cable 18 may be positioned
essentially along a line in a selected direction above a portion of the
Earth's sub surface
that is to be surveyed. The longitudinal distance between the EM sensors 20
and seismic
sensors 21 on each cable 18 is represented by x in Figure 4, and in the
present
embodiment may be on the order of 100 to 200 meters. For practical purposes
the
individual sensors 20 and 21 may be co-located. Each cable 18 is shown as
terminated in
a corresponding recording buoy 22, as explained above with reference to Figure
3A. The
cables 18 are preferably positioned substantially parallel to each other, and
are separated
by a lateral spacing shown by y. In the present embodiment, y is preferably
substantially
equal to x, and is on the order of about 100 to 500 meters. In some
embodiments, the EM
sensors 20 and seismic sensors 21 may be randomly distributed, that is,
spacings x and y
between adjacent sensors may be random. The sensors 20, 21 may also be
autonomous
recoding devices without cabled connection to the respective recording buoys.
It is only
necessary in such embodiments to know the geodetic position of each EM sensor
and
each seismic sensor, and that the average separation is as described above. It
is believed
that random spacing may improve signal to noise ratio in the results of an
14
CA 02654442 2008-11-27
WO 2008/066957 PCT/US2007/069843
electromagnetic survey in particular. For a two dimensional survey, only one
such
streamer is required, and the vessel 10 may pass only once along this line.
[0045]
Seismic and electromagnetic survey data that may be used in various
embodiments of
the invention may also be acquired using surface acquisition equipment, as
shown in
Figure 3D. The acquisition system shown in Figure 3D includes the survey
vessel 10 and
recording system 12 thereon. The vessel 10 may tow one or more seismic energy
sources
9 or arrays of such sources in the water. The vessel 10 tows a plurality of
sensor
streamers 23 each having a plurality of spaced apart sensors 21A thereon. The
sensors
21A may be seismic sensors, electric field or magnetic field sensors, or any
combination
thereof The streamers 23 are maintained in lateral positions with respect to
each other
by towing equipment that includes lead in cables 25 coupled to the vessel 10.
The lead in
cables 25 are laterally separated by the action in the water of paravanes 27A
coupled to
the distal ends of the lead-in cables 25. The paravanes 27A are held at a
selected lateral
spacing by a spreader cable 27. The streamers 23 are affixed to the spreader
cable 27.
The sensors 21A, if they include seismic sensing devices, may include
hydrophones or
other pressure or pressure gradient sensors, or may be pressure-responsive
sensors in
combination with various forms of particle motion sensors, such as geophones
or
accelerometers.
See, for example, U.S. Patent Application Publication No.
2004/0042341 filed by Tenghamn et al. for a description of a "dual sensor"
streamer and
its application. Other embodiments may include more or fewer such streamers
23.
Accordingly, the configuration of seismic data acquisition system described
above is not
a limit on the scope of the invention. The embodiment shown in Figure 3D may
also
include, although not shown in the Figure, current source electrodes in a
horizontal
and/or vertical dipole arrangement, as explained with reference to Figure 3A
and Figure
3B, respectively.
[0046]
Referring once again to Figure 3A, in conducting a survey, the vessel 10 moves
along the surface of the water 11, and periodically the control/recording
system 12
energizes the transmitter electrodes 16A, 16B as explained above. In the
present
embodiment, the transmitter electrodes 16A, 16B are energized at selected
times such
that the vessel 10 moves about 10-100 meters between successive energizations
of the
CA 02654442 2008-11-27
WO 2008/066957 PCT/US2007/069843
transmitter electrodes 16A, 16B. Signals detected by the various EM sensors 20
are
recorded with respect to time, and such time is indexed related to the time of
energizing
the electrodes 16A, 16B. By recording with such time indexing, inferences
concerning
the structure and composition of the Earth's subsurface may be made from the
recordings.
[0047] In the present embodiment, the vessel 10 is shown moving
substantially parallel
to the cables 18. In another embodiment, after the vessel 10 moves in a
direction parallel
to the cables 18, substantially above the position of each cable 18 on the
water bottom 13,
then the vessel 10 may move transversely to the cables 18, along sail lines
substantially
above the position of corresponding EM sensors 20 and seismic sensors 21 on
each cable
18 on the water bottom 13.
[0048] In some embodiments, a substantially contemporaneous seismic survey
may be
conducted by periodically actuating the seismic energy source 9, and recording
the
signals detected by the seismic sensors 21. In the present embodiment,
therefore, a
plurality of measurements are made at each EM sensor 20, each representing a
unique
geometry of the transmitter electrodes 16A, 16B with respect to each EM sensor
20. The
plurality of electromagnetic measurements, each with a unique arrangement of
transmitter-to-sensor geometry may be used in some embodiments to produce
various
forms of combined or "stacked" measurements, so as to improve the quality of
images
generated using t-CSEM measurements. Similarly, a three-dimensional seismic
survey is
recorded.
[0049] In the present embodiment, a seismoelectric survey may also be made
by
periodically actuating the seismic energy source 9 and recording voltages
and/or
magnetic fields detected by the EM sensors 20. The seismoelectric survey, as a
matter of
convenience, may be recorded using the same actuations of the seismic energy
source 9
as those used to conduct the seismic survey referred to above. Thus, in such
embodiments, for each seismic energy source actuation, EM sensor measurements
and
seismic sensor measurements are recorded, such recordings being indexed with
respect to
time of actuation of the seismic energy source 9.
16
CA 02654442 2008-11-27
WO 2008/066957 PCT/US2007/069843
[0050] In the present embodiment, an electroseismic survey may be made by
measuring
signals detected by the seismic sensors 21 as the electrical current imparted
across the
electrodes 16A, 16B is switched. The electroseismic survey, as a matter of
convenience,
may be recorded using the same current switchings as are used to induce
transient electric
fields in the Earth's subsurface to conduct the EM survey. Thus, in such
embodiments,
for each current switching, EM sensor recordings are made, and seismic sensor
recordings are made, indexed with respect to the current switching time.
[0051] Figure 5 shows one embodiment of an EM sensor 20 in more detail.
The EM
sensor 20 may be enclosed in a housing 23 made from a dense, electrically non-
conductive, non-magnetic material, such as high-density plastic, such that the
EM sensor
20 will sink in the water and rest on the water bottom (13 in Figure 3A).
Electrodes 26A,
26B, 28A, 28B are positioned on the bottom of the housing 23 such that they
contact the
water bottom (13 in Figure 3A). The electrodes are arranged in dipole pairs.
One pair
26A, 26B can be oriented along the length of cable (18 in Figure 4), and
measures
voltages along the direction of the cable. The other electrode pair 28A, 28B
measures
voltages induced transversely to the cable (18 in Figure 4). The electrode
pairs may span
a distance of about 1 to 10 meters. The electrode pairs 26A, 26B and 28A, 28B
may be
coupled to a combined amplifier/digital signal processor 24 for converting the
detected
voltages into digital words corresponding to the voltage amplitude at selected
moments in
time. In some embodiments, electrode pairs from a plurality of sensors may be
selectively
connected together, or may be selectively coupled across the input terminals
of a selected
one of the combined amplifier/digital signal processors 24 in one of the
sensors 20. By
making such selectively combined coupling and selective amplifier input
coupling, it is
possible to change the effective electrode array length, and to reduce certain
kinds of
noise that are localized to one or more of the individual electrodes by
electrically
summing such electrodes with other ones of the electrodes. Those skilled in
the art of
seismic surveying will appreciate the similarity of coupling spaced apart
electrodes
together to electrically summing signals from a plurality of spaced apart
hydrophones in a
marine seismic streamer to attenuate the effects of acoustic energy traveling
along the
streamer. An embodiment of a suitable switching arrangement that can perform
the
17
CA 02654442 2008-11-27
WO 2008/066957 PCT/US2007/069843
foregoing function is shown in Figure 3C. Sensors 20 substantially as
explained above
with reference to Figure 5 are shown at spaced apart positions. Each sensor 20
includes
one or more electrodes, shown in Figure 3C at 27. The electrodes 27 may be
coupled
using suitable wiring in the cable (18 in Figure 4) to the input of a multi
pole switch 29.
The output of the switch 29 is coupled to one of the amplifier/digital signal
processors 24.
By suitable selection, some of the electrodes 27 may be electrically connected
to each
other, and to one of the two amplifier inputs. The number of connected
electrodes and
the spacing therebetween across the input to the amplifier can be selected to
obtain
measurements corresponding to electric fields originating from different
volumes within
the Earth's subsurface.
[0052]
Referring once again to Figure 5, the present embodiment of the sensor 20 may
include one or more magnetometers 30, 32, 34 oriented along mutually
orthogonal
directions. In the present embodiment, two of the magnetometers 30, 32 may be
oriented
such that their sensitive axes are oriented along the same direction as the
dipole moment
of a corresponding electrode pair 26A, 26B and 28A, 28B. The signal output of
each
magnetometer 30, 32 34 may be coupled to the digital signal processor 24. The
digitized
signal output of the signal processor 24 can be coupled to the recording buoy
(22 in
Figure 4) for transmission to the control/recording system (12 in Figure 3A)
such as by
radio telemetry, or form later interrogation by the control/recording system
(12 in Figure
1A) as the recording buoy 22 is retrieved onto the vessel.
[0053]
The embodiment of a system shown in Figure 3A and Figure 3B uses electric
current applied to electrodes to impart an electric field into the Earth's
subsurface. An
alternative to imparting electric fields is to impart magnetic fields, and
such will be
explained with reference to Figure 6. In Figure 6, the vessel 10 tows a cable
14C which
is connected to two loop transmitters 17A and 17B. The first loop transmitter
17A
encloses an area perpendicular to the water bottom 13.
Periodically, the
control/recording system 12 causes electric current to flow through the first
loop
transmitter 17A. The current can be in any of the same forms as described with
reference
to Figure 3A, including switched DC, PBRS, and alternating polarity DC. When
the
current changes, a transient magnetic field having dipole moment along
direction MA is
18
CA 02654442 2008-11-27
WO 2008/066957 PCT/US2007/069843
imparted into the Earth. At the same or at different times, current is applied
to the second
loop transmitter 17B. The second loop transmitter may be in the form of a
solenoid or
coil, having a magnetic moment along direction MB. Surveying using the
magnetic field
loop transmitters 17A, 17B may be performed substantially according to the
survey
pattern explained above with reference to Figure 3A. In addition, Figure 3A
shows a
seismic source 9 which can be used contemporaneously with or sequentially to
the
electromagnetic source, so as to generate seismic signals and seismoelectric
signals.
[0054]
The embodiments explained above with reference to Figure 6, and the
embodiments explained previously with reference to Figures 3A and 3B show
magnetic
and/or electric dipoles oriented individually along directions that are
orthogonal to each
other. In some embodiments, orthogonal dipole antennas and/or current loops
may be
towed simultaneously by the vessel and energized so as to induce rotating
electric and/or
magnetic fields in the Earth's subsurface. Methods for generating rotating
electric and/or
magnetic fields are known in the art and include applying selected fractional
amounts of
the total electric current to each of the orthogonal antennas and/or current
loops.
[0055]
The foregoing embodiments have been explained in the context of marine
electromagnetic surveying.
It should be clearly understood that the foregoing
embodiments are equally applicable to surveys conducted on land at the surface
of the
Earth. When conducted on land at the surface of the Earth, the sensors can be
deployed
in substantially similar patterns to that shown in Figure 3A. The survey
current source
may be applied in the form of electric current, as shown in Figure 3A, at the
Earth's
surface, or in the form of magnetic fields, as shown in and described with
reference to
Figure 6. For purposes of defining the scope of the invention, the various
survey devices
can be said to be disposed at the top of an area of the Earth's subsurface to
be surveyed.
The top of the Earth's subsurface will be at the bottom of the water in a
marine survey,
and at the surface of the Earth in a land based survey, or on the top of a
layer of floating
ice where such surveys are to be conducted.
[0056]
Those skilled in the art will appreciate that the various embodiments
described
herein which include a moving electromagnetic and seismic energy source and
stationary
19
CA 02654442 2008-11-27
WO 2008/066957 PCT/US2007/069843
sensors are functionally equivalent to corresponding embodiments wherein the
electromagnetic energy sources and seismic energy sources are stationary, such
as being
positioned on the water bottom in a pattern similar to those shown in the
Figures where
the EM sensors 20 and seismic sensors 21 are located, and electromagnetic
sensors and
seismic sensors are moved through the water. Accordingly, in the appended
claims,
references to positions of electromagnetic and seismic sources and sensors are
intended to
include such corresponding source and sensor locations within their scope. The
functional equivalence is a result of the principle of reciprocity, known to
those skilled in
the art. It should also be clearly understood, and as explained above with
reference to
Figure 3D, that both the seismic energy source and sensors, as well as the
electromagnetic source and EM sensors may be towed by the vessel (10 in Figure
3A).
In the case of the seismic source and sensors, such arrangement will be
familiar to those
skilled in the art of seismic surveying as including towing a source array and
one or more
streamers. A streamer is essentially a cable having sensors embedded therein
at spaced
apart locations along the length of the cable. For the electric and/or
magnetic field
induction and measuring, source electrode cables, or loop antenna cables such
as shown,
respectively, in Figures 3A, 3B and 6 may be towed from the same vessel as the
seismic
survey devices explained above. Similarly, EM sensors, such as explained above
with
reference to Figure 5, may be affixed to cables towed in the water by the
vessel (10 in
Figure 3A), also as explained with reference to Figure 3D. Thus, substantially
contemporaneous seismic data, electroseismic data, seismoelectric data and
transient
electromagnetic data can be acquired over a large area of the Earth's
subsurface relatively
efficiently using such a system.
[0057] Another type of data that may be acquired using the system shown in
Figure 3A is
called induced polarization data. Induced polarization refers to an electrical
anomaly in
the Earth's subsurface caused by imparting an electric field into the Earth.
Measurements
of certain characteristics of voltages impressed on electrodes disposed
between the
positions of other electrodes used to impart the electric field are used to
infer the presence
of hydrocarbon-bearing structures. A procedure for obtaining induced
polarization (IP)
data, and a procedure for processing the same, are described in U.S. Patent
No. 4,446,434
CA 02654442 2012-04-26
1 0 9 9¨ 3
issued to Sternberg. The system shown in Figure
3A may be used to acquire IP data by applying a voltage across the electrodes
16A, 16B,
and measuring the voltages imparted across selected ones of the electrodes in
the various
EM sensors 20 disposed between the electrodes 16A ,16B on the cable 14. The
purpose
for acquiring IP data will be explained below with reference to Figure 7.
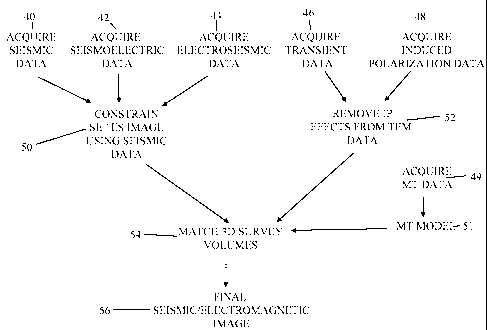
[0058] Figure 7 shows a process according to one aspect of the invention
for using the
above described forms of data to infer structure and composition of selected
volumes of
the Earth's subsurface. At 40, seismic data are acquired as explained above
with
reference to Figures 3A and 3B. As will be appreciated by those skilled in the
art, the
various data recordings of the seismic data will each relate to a particular
geodetic
position in the Earth's subsurface. The geodetic position depends on the
particular
acquisition geometry of each trace in the seismic data. More specifically,
various events
in the seismic data will correspond to subsurface acoustic impedance
boundaries, called
reflectors. The geodetic position of such reflectors may be inferred by known
propagation properties of the seismic energy as it travels from the source (9
in Figure
3A), through the Earth, is reflected back upwardly and is ultimately detected
by the
various seismic sensors (21 in Figure 3A). The propagation path of the seismic
energy
from the seismic source to the reflector and back to the seismic sensor is
related to the
geodetic position of the seismic source and the particular seismic sensor at
the time of
acquisition. For purposes of improving signal-to-noise ratios in the acquired
seismic
data, it is known in the art to sum or "stack" seismic signal recordings
corresponding to a
common travel path element. The most common of the foregoing is called common-
mid-
point (CMP) stacking, in which recordings are summed which correspond to a
geodetic
position at the mid point of various source and sensor positions. In CMP
stacks, it is
likely that reflective events in the seismic traces correspond to the same
point in space
along such reflectors because of the acquisition geometry.
[0059] At 42 and 44, respectively, the scismoelectric and electroseismic
data are
acquired, substantially as explained above with reference to Figures 3A and
3B. Because
the position of the seismic energy source (9 in Figure 3A) is known for each
actuation
thereof, the geodetic position of events in the Earth's subsurface that
generate
21
CA 02654442 2008-11-27
WO 2008/066957 PCT/US2007/069843
seismoelectric signals can be determined. In some embodiments, the geodetic
position of
the various events in the seismoelectric and electroseismic data may be
inferred by
determining differences between arrival times (arrival time being the elapsed
time from
actuation of the respective source to detection of the event) of events in
such data that are
caused by compressional seismic energy, and events caused by shear energy.
Such
geodetic information can be used, as shown at 50, with the seismic data to
constrain an
image generated using the seismoelectric data to a same three-dimensional
volume of the
Earth's subsurface. A similar process can be applied to the electroseismic
data because
the geodetic position of the electrodes (16A, 16B in Figure 3A) is known for
each current
actuation.
Further explanation of constraining the seismoelectric data and the
electroseismic data to correspond to a same 3-dimensional volume in the
Earth's
subsurface will be provided below with reference to Figures 8A through 8D.
[0060]
Still referring to Figure 7, at 46, t-CSEM data are acquired as explained
above
with reference to Figures 3A and 3B, as well as or alternatively, as explained
with
reference to Figure 6. At 48, IP data may be acquired using the system
explained with
reference to Figures 3A and 3B. At 52, the IP data are used to remove the
effects thereof
from the t-CESM data. As will be appreciated by those skilled in the art, the
t-CSEM
data relate to specific volumes of the Earth's subsurface, depending on the
geodetic
position of the electrodes (16A, 16B in either Figure 3A or 3B) or the loop
antennas
(17A, 17B in Figure 6), depending on which type of EM source device is used.
The IP
corrected t-CESM data may then be used to generate a model of spatial
distribution of
electrical conductivity in the Earth's subsurface. At 54, the model generated
using the t-
CSEM data may be volume matched to a subsurface Earth model generated using
the
seismoelectric data. Finally, at 56, the electrical conductivity distribution
in a selected
volume of the Earth's subsurface determined from the t-CSEM data may be used
with
corresponding seismoelectric data to generate a seismoelectric image that
takes account
of the determined conductivity distribution.
[0061]
In some embodiments of a method according to the present aspect of the
invention, magnetotelluric (MT) data may be acquired as shown at 49. The MT
data may
be used either to determine a background electromagnetic field distribution to
correct the
22
CA 02654442 2008-11-27
WO 2008/066957 PCT/US2007/069843
TEM data, or may be used to generate a separate model of the Earth's
subsurface.
Typically, models of the Earth's subsurface made using MT data show the
distribution of
so-called "basement" rocks, meaning those formations below the bottom of
sedimentary
rocks.
[0062] In order to improve the signal-to-noise ratio of the t-CSEM data,
the data may be
summed or stacked in a manner similar to the seismic data. Stacking EM data,
similar to
stacking seismic data, is performed by summing individual data recordings
having events
therein corresponding to the same geodetic position in the Earth's subsurface.
In order to
sum data recordings made when the electrodes (16A, 16B in Figure 3A) or the
loop
antennas (17A, 17B in Figure 6) are in different relative positions with
respect to the EM
sensors, it is necessary to adjust the individual recordings for differences
in acquisition
geometry (the position of the electrodes and sensors corresponding to each
data
recording). Those skilled in the art of seismic exploration will appreciate
that such
acquisition geometry correction is necessary in order to properly stack
seismic
recordings. Seismic recordings are commonly corrected prior to stacking by
selecting
seismic data recordings that represent acquisition of seismic signals having a
"common
mid point." Common mid point means that the location of the seismic energy
source and
the seismic receiver in any two recordings have the same mid point between
them
irrespective of the location of the source and receiver at each recording
time. In the
invention, signal recordings from the EM sensors (20 in Figure 4) are selected
for
stacking such that the signal recordings also have a common mid point.
[0063] In seismic exploration, common mid point recordings are then
processed by a
procedure known as normal moveout correction. Normal moveout correction
adjusts the
timing of events in any seismic recording to that which would occur if the
seismic energy
source and the seismic receiver were collocated above the common mid point.
The time
correction thus adjusts event times in each recording to account for longer
and longer
energy travel paths for longer "offset" recordings. Such recordings are those
made with
longer and longer distances along the Earth's surface between the seismic
energy source
and the receiver.
23
CA 02654442 2008-11-27
WO 2008/066957
PCT/US2007/069843
[0064] As a generalized concept, correction for source-receiver offset in
common mid
point recordings can be applied to electromagnetic signal recordings. However,
the
correction is not necessarily made with respect to travel time. For example,
one basis for
correcting signal recordings for acquisition geometry is the signal amplitude.
For a signal
recording made using electric current amplitude represented by I, and an
electrode
spacing represented by At , the DC electric field strength E in the inline
direction can be
determined by the expression:
IAt
[0065] E(p)= (1)
Ira 0(1+ a 1 / ao )P3
[0066] in which o-1 represents the electrical conductivity of the
subsurface, uo represents
the electrical conductivity of the water, and p represents the transmitter to
receiver
distance or offset (cf. Edwards, R.N., and Chave, A., 1986, A transient
electric dipole-
dipole method for mapping the conductivity of the sea floor: Geophysics 51,
984-987).
The electric field amplitude in the transverse direction is calculated by a
formula with
similar offset dependence. Similar formulas can also be derived for magnetic
field
strength. As a result, the electric field at offset p may be corrected to that
at po (zero
offset) the equation
3
[0067]P
E(P0)= E(1') (2)
Po
[0068] After such correction. recordings acquired with different offsets
may be stacked.
In some embodiments, the stacking may be a form of stacking known as median
stacking
so as to further reduce transient noise effects in the stacked recording.
[0069] Having explained the data that may be used in a method according to
the
invention and a method of jointly interpreting such data in general terms, a
particular
element of the invention will be explained in more detail. The particular
element is
matching the 3-dimensional survey volumes represented by each type of data
such that
the joint interpretation is made over matching volumes of the Earth's
subsurface.
24
CA 02654442 2008-11-27
WO 2008/066957 PCT/US2007/069843
[0070] Figure 8A shows seismic data acquisition along with seismoelectric
data
acquisition to explain one part of volume matching. A seismic source 60A is
positioned
at a selected location on the Earth's surface 64 (or water surface in a marine
survey). The
source is actuated and seismic energy travels down at 61 until it reaches a
subsurface
acoustic impedance boundary, at 66. Typically, boundaries are at places where
formation
composition changes to a significant extent. The seismic energy is reflected
upward 63
until it reaches one or more seismic sensors 62S. Referring to Figure 8B, a
data "trace"
70 is a graphic representation of the signal detected by the seismic sensor
(62S in Figure
8A). The trace 70 includes a distinct amplitude event 72 occurring at a time
related to the
velocity of seismic energy in the subsurface formations (68 in Figure 8A) and
the
distance between the source 60A and the seismic sensor 62S. Typically, a
plurality of
source and sensor positions will be used in a seismic survey, such positions
having
various "offset" distances, offset being the distance between the source and a
particular
sensor location. As explained above, signals are typically summed or "stacked"
that
represent a common mid point (CMP) between the source position and sensor
position,
such that each such stacked trace represents a same reflection point in the
Earth's
subsurface. CMP trace analysis may also be used to perform seismic velocity
analysis.
Each such boundary 66 in the subsurface will typically be associated with a
seismic
velocity of the formations above. For each such event (72 in Figure 8B)
occurring in
various CMP traces, a "moveout", or change in two way time for each event with
respect
to offset, can be analyzed such that the seismic velocity in each formation
"layer" can be
estimated. By performing such velocity analysis using a large number of
different source
and sensor locations, it is possible to obtain a reasonable image of the
spatial distribution
of various boundaries in the Earth's subsurface.
[0071] Referring once again to Figure 8A, as explained previously,
electric field sensors
62E may be positioned in a selected arrangement on the Earth's surface (or
water surface
in a marine survey). As the seismic energy reaches acoustic impedance
boundaries, such
as shown at 66 that have permeable formations below, a seismoelectric signal
68 may be
generated. The seismoelectric signal 68 travels upward at the velocity of
electromagnetic
energy through the same formations (which is fast enough to have negligible
effect on
CA 02654442 2008-11-27
WO 2008/066957 PCT/US2007/069843
recordings made to the time scale of seismic reflections). Referring to Figure
8C, the
electric field sensor 62E response will therefore correspond to seismoelectric
signals that
could originate from any point along a surface 74 represented by the one-way
travel time
of seismic energy through the same Earth formations. By estimating the
velocity of the
Earth formations from the surface 64 to the boundaries (66 in Figure 8A), the
radius of
the surface 74 may be estimated. The actual origin of the seismoelectric
signal may be
determined where the surface 74 corresponds to the spatial position of
acoustic
impedance boundaries in the subsurface. By using seismoelectric data from a
large
number of different seismic source and electric field sensor positions, a
seismoelectric
image having 3-dimensional volumes matched to the seismic survey may be made.
It
should be understood that magnetic field sensors may be used in some
embodiments in
addition to or in substitution for the electric field sensors 62E. The
amplitude and phase
characteristics of the seismoelectric events will be at least in part
dependent on the
conductivity distribution of the Earth formations between the source of such
events and
the electric field sensor 62E. As explained above with reference to Figure 7 a
model of
the conductivity distribution of the Earth formations in the subsurface Earth
volume
corresponding to the seismoelectric survey may be obtained from the t-CSEM
data. Such
conductivity distribution may be used in a joint inversion process to correct
the Earth
model made from the seismoelectric data.
[0072] Referring to Figure 8D, an electroseismic survey may be made over a
same
matched volume of the Earth's subsurface by using an electric field source 60B
to impart
an electric field into the Earth. The electric field radiates outwardly from
the source at
the propagation velocity of electromagnetic energy in the subsurface. As
previously
explained, the propagation velocity is such that little time effect is
measured on the time
scale of seismic data recordings. The phase and amplitude characteristics of
the
electromagnetic energy, however, will be affected by the conductivity
distribution of the
volume of the Earth's subsurface in which the electroseismic survey is being
conducted.
Seismic signals resulting from electroseismic response of the various Earth
formations
can be detected at one or more seismic sensors 62S, which may already be
deployed on
the Earth's surface (or water surface in a marine seismic survey). It will be
appreciated
26
CA 02654442 2008-11-27
WO 2008/066957 PCT/US2007/069843
that the characteristics of the electroseismic data will be related to the
characteristics of
the electromagnetic energy reaching the various formations in the Earth's
subsurface,
which as explained above, will be related to the conductivity distribution. As
may be
inferred from Figure 8D, the time of arrival of electroseismic events will
essentially
depend on the seismic velocity in the Earth's subsurface (illustrated at 63A),
and the
seismic sensor position(s) with respect to the location where the
electroseismic event is
generated. By using a plurality of different source 60B and sensor 62S
positions, it is
possible to estimate positions in the Earth's subsurface where electroseismic
events are
generated.
[0073]
In some embodiments, an initial model of the Earth's subsurface can be
generated
for each of the seismoelectric and electroseismic data. As may be inferred
from the
above description, such models may be constrained by using velocity and
structural
analysis obtained using the seismic data. Also, such models should be adjusted
to
account for the conductivity distribution determined from the t-CSEM data. An
expected
response of each of the seismoelectric data and electroseismic data may then
be made
based on each initial model. The expected responses are compared to the
measured
responses, the initial models adjusted, and expected responses recalculated
until
differences between the expected responses and the measured responses are
minimized.
Preferably, the processes for the seismoelectric and electroseismic data are
performed
jointly, such that a single model of the Earth's subsurface is generated that
most closely
accounts for both the seismoelectric data and the electroseismic data.
[0074]
The foregoing embodiments have been explained in terms of transient controlled
source electromagnetic (t-CSEM) survey data being used to generate a model of
the
Earth's subsurface. T-CSEM survey data may have several advantages over
frequency
domain CSEM data for purposes of the invention as will be readily appreciated
by those
skilled in the art.
It should be understood, however, that frequency domain
electromagnetic survey data may be used in other implementations.
[0075] In one embodiment, the subsurface Earth formation distribution model
may be further
constrained and refined by including data acquired from any wellbores drilled
through the
27
CA 02654442 2008-11-27
WO 2008/066957 PCT/US2007/069843
Earth formations in the survey area. Such data may include, for example, well
log data.
Well log data may include a record, with respect to depth in the Earth, of
acoustic
velocity, formation density, electrical conductivity, and neutron porosity,
and clay
mineral content, among other data. The well log data are generally of quite
high
resolution with respect to depth in the Earth, as compared to the surface-
measured data
discussed above; however well log data are relatively limited in the spatial
volume
(surrounding the well bore) to which they pertain. Thus, well log data may be
used to
further constrain the Earth model within the axial resolution limits of the
well log data.
Lateral variation in composition and structure of the Earth model may be
estimated, for
example, by correlating the well log data to attributes of the seismic data
and t-CSEM
data. See, for example, U.S. Patent No. 6,957,146 issued to Taner et al. for a
description
of methods for correlating well log data to seismic attributes. Other well
related data may
include analysis of core samples of the Earth formations taken from the
wellbore.
Wellbore data may also include drilling lithology data, such as correlations
between
composition of the formations and rate of drilling of the wellbore. The
wellbore data
may also include measurements of fluid pressure in the Earth formations. Any
or all of
the foregoing may be used as constraints for the Earth model. A result of the
further
constrained interpretation is a final Earth model that includes spatial
distribution of
various Earth formation properties such as lithology, porosity, fluid
saturation (and its
converse hydrocarbon saturation), permeability and other properties. Such
spatial
distribution of properties of the Earth's subsurface may be used to more
precisely locate
subsurface hydrocarbon reservoirs in parts of a survey area using only data
acquired from
the Earth's surface and/or seabed.
[0076]
In a particular implementation of an integrated interpretation method
according to the
invention, t-CSEM and/or seismic measurements may be repeated over the same
geographic area at selected times to monitor movement of a hydrocarbon/water
contact
surface, or a gas/oil contact surface in a subsurface reservoir. In such
implementation,
geophysical measurements are made substantially as explained above with
reference to
Figures 3A through 6.
A spatial distribution of a fluid contact, such as a
hydrocarbon/water contact or a gas/oil contact is determined using a combined
28
CA 02654442 2008-11-27
WO 2008/066957 PCT/US2007/069843
interpretation technique, substantially as explained above. At selected times
after
hydrocarbon production is commenced from the subsurface reservoir, at least
one of the
t-CSEM and seismic measurements are repeated, and the spatial distribution of
the
contact is again determined, such as by combined interpretation as explained
above. In
some embodiments, gravity measurements may be repeated at selected times in
order to
assist in determining changes in spatial distribution particularly of a gas-
bearing
subsurface reservoir. If suitable wellbores are available that penetrate the
reservoir,
measurements of formation properties may be made from such wellbores, so that
the
resolution of the calculated spatial distribution may be improved. Suitable
wellbores may
include fluid producing or injection wellbores, for which fluid production or
injection is
temporarily suspended so that measurements may be made from such wellbores.
Other
embodiments may provide permanent "monitoring" wellbores within the subsurface
reservoir. See, for example, U.S. Patent No. 6,739,165 issued to Strack,
entitled,
Combined surface and wellbore electromagnetic measurement system and method
for
determining formation fluid properties, and assigned to the assignee of the
present
invention for a description of the types of wellbore measurements applicable
to fluid
contact monitoring. Such measurements include, but are not limited to,
interval acoustic
velocity, formation electrical resistivity; density (either scattered gamma-
gamma or
differential gravity) and thermal neutron capture cross section.
[0077] In some implementations, the joint interpretation may be matched to
or constrained by
production history information from the modeled subsurface reservoir.
Production
history matching includes determination of the volumes of fluids removed from
or
injected into the reservoir at reservoir pressure and temperature conditions,
such that
changes in the spatial distribution of the fluid contact calculated by
repeating the process
shown in Figure 6 using later-acquired data may be constrained or matched to
estimations
of how such fluid contact distribution would change in respect of the
calculated fluid
volumes extracted from the reservoir.
[0078] In some implementations, the modeled spatial distribution of the
fluid contact
determined from repeated performance of the integrated interpretation shown in
Figure 6
can be compared with modeled change in spatial distribution of the fluid
contact
29
CA 02654442 2008-11-27
WO 2008/066957 PCT/US2007/069843
determined from a reservoir simulation computer program. Such computer
programs
accept as input data such as seismic data, well log data, core analysis data,
pressure
measurements, fluid pressure/volume/temperature (PVT) data and other
measurements
related to the physical properties of and the spatial distribution of fluids
in the subsurface
reservoir, as well as production and injection histories at the various
boreholes. The
reservoir simulation program may be used to predict production rates, with
respect to
time, of fluids from the subsurface reservoir with respect to simulated or
actual wellbores
that intersect the reservoir. The simulator results may be compared with the
modeled
spatial distribution of the fluid contact at various times in order to
constrain or adjust the
results of the integrated interpretation. Reservoir simulation computer
programs are
commercially available such as those sold under the trademarks VIP by Landmark
Graphics Corp., Houston, TX, or sold under the trademark ECLIPSE by
Schlumberger
Technology Corp., Sugar Land, TX.
[0079] The model of the Earth's subsurface produced from the
seismoelectric and
electroseismic data is preferably jointly inverted with the electromagnetic
survey data to
produce a seismoelectric model of the Earth's subsurface that includes the
effects of the
spatial distribution of electrical conductivity. The electromagnetic survey
data preferably
is constrained by using MT data to model the basement rock distribution, and
preferably
includes adjustment for induced polarization effects as explained above.
[0080] In some embodiments, the results of the interpretation technique
explained above
may be improved by beamforming on any or all of the data. Beamforming may be
performed by deploying a plurality of sources (seismic and/or electromagnetic)
at
selected positions along the Earth's surface or water surface, and actuating
the sources
with a selected time delay between actuations at each individual source. The
time delay
is selected such that the seismic and/or electromagnetic energy propagates
approximately
as a plane wave. A propagation direction of the plane wave may be selected by
suitable
selection of time delay between actuations of each of the sources. By
selecting different
directions of propagation of the seismic and/or electromagnetic energy, it is
possible to
energize ("illuminate") any particular portion of the Earth's subsurface from
different
directions, depending on the position of the sources and sensors at the
Earth's surface (or
CA 02654442 2008-11-27
WO 2008/066957 PCT/US2007/069843
water surface). Beamforming can be performed for the seismic data,
seismoelectric data
and electroseismic data as explained, for example, in Adler, G., Beam steering
and
controlled illumination, CSEG Recorder, 8-19 (2001). Beamforming for
electromagnetic
data can be performed as explained in, Chen, J.C., Yao, K., and Hudson, R.E.,
Source
localization and forming, IEEE, Signal Processing Magazine, March, 30-39
(2002). In
some embodiments, subsurface zones indicative of relatively low electrical
conductivity,
and having indications of permeability by reason of seismoelectric signals,
may be
confirmed by illuminating such zones from various directions. Indications of
the
existence of the same subsurface zones with respect to various illumination
directions
may serve to increase the likelihood that such subsurface zones do exist and
may have
producible hydrocarbons therein.
[0081] The basis of beam forming/focusing during acquisition is to use
extended source
and/or receiver arrays. The individual energy source and/or receiver elements
of such
arrays are used simultaneously. For seismic sources this means many shots are
fired at
the same time or in a time sequence that is short duration as compared to the
signal
duration. Firing an extended source array at the essentially the same time
will generate a
plane wave traveling vertically downward. Using linear time shifts between the
individual shots, plane waves traveling in any preselected dip direction may
be formed.
Using non-linear time shifts, non-planar waves may be formed, and such waves
can be
focused on certain targets in the Earth's subsurface. As can be readily
inferred from the
Reflection Law, a plane wave traveling vertically downward will not be
reflected back to
the Earth's surface by reflectors dipping steeper then 45 degrees. The
foregoing example
shows that for a complete scan of the subsurface a plurality of illuminations,
for example
with plane waves dipping in different directions, is necessary. Using
electronically
supervised source actuation times much more sophisticated beam forming methods
are
possible. A similar plurality of shots is necessary for non-planar waves. Due
to the
reciprocity principle all the foregoing techniques are applicable to arrays of
receivers as
well.
[0082] In seismic exploration, beam forming with seismic receivers is
widely used, and
large permanent station arrays are installed (e.g., NORSAR). Such arrays use
31
CA 02654442 2008-11-27
WO 2008/066957 PCT/US2007/069843
sophisticated real time beam forming routines. Similar systems are used in
seismic alarm
(early warning) systems.
[0083] Beam forming/ focusing is possible during acquisition and /or
during processing.
Both acquisition beam forming and processing beam forming techniques each have
advantages and disadvantages. The main advantage of beam forming/ focusing
during
processing is flexibility. Extension of the arrays, time shifts between
elements can be
selected and optimized. The principal disadvantage is the larger data volume
that has to
be handled, and corresponding lower signal to noise ratio. In areas with weak
reflections,
it is possible that the signal to noise ratio is so low that even with signal
processing
adequate seismic information can not be discovered during processing.
[0084] The application of beam forming/focusing during acquisition has the
disadvantage
that specifications such as array extension or time shifts are fixed. Due to
the a priori
better illumination of the target, however, signal to noise ratio may be much
better in the
raw data and thus be the only possibility for a successful survey.
[0085] While the invention has been described with respect to a limited
number of
embodiments, those skilled in the art, having benefit of this disclosure, will
appreciate
that other embodiments can be devised which do not depart from the scope of
the
invention as disclosed herein. Accordingly, the scope of the invention should
be limited
only by the attached claims.
32