Note : Les descriptions sont présentées dans la langue officielle dans laquelle elles ont été soumises.
CA 02699571 2010-03-12
WO 2009/048341 PCT/NZ2008/000263
1
SYSTEM AND METHOD FOR MANAGING AND PREDICTING CROP
PERFORMANCE
FIELD OF INVENTION
The present invention relates to an integrated system and method for managing
and monitoring
crops that facilitates reductions in costs and environmental impacts by
optimizing the amount
and the timing of irrigation and nitrogen fertiliser applications, while
maintaining or improving
yield of the crop.
BACKGROUND TO INVENTION
Most soils are unable to supply the amount of nitrogen required to maximise
crop yields;
nitrogen in the form of fertiliser is added to make up the shortfall. One
difficulty that farmers
face is how to determine the size and timing of this shortfall and
subsequently determine how
much and when nitrogen fertiliser. should be applied.
L
Fertiliser decision support systems attempt to address this problem. These
systems seek to
recommend a schedule of nitrogen fertiliser in the correct timings and amounts
to avoid both
yield limiting deficits and costly surpluses.
Crops are also sensitive to water deficits. In some climates, summer
evapotranspiration
substantially exceeds precipitation. In such climates, irrigation-is essential
to reach yield
potentials.
A number of high-value commercial.food crops, including but not limited to
potatoes, maize and
wheat, produce yields that are highly responsive to both irrigation and
nitrogen. This has caused
a culture of over-irrigating and over fertilising to ensure valuable yield is
not lost due to deficits.
This practice wastes fresh water and nitrogen, causes problems with stream and
ground water
30. quality, and represents an unnecessary economic cost. In the past farmers
have viewed this cost
as "insurance" against missing out on potential yield. Rising energy and
commodity costs are
pushing up the cost of irrigation and fertiliser. At the same time, increasing
consumer demand
for sustainable production is driving interest and regulation to ensure waste
is minimised and the
environment is not being damaged.
CA 02699571 2010-03-12
WO 2009/048341 PCT/NZ2008/000263
2
Currently most farmers irrigate and fertilise according to a recipe based on
empirical research (or
trial and error) and these recipes often don't provide a very good match with
what the crop
actually needs.
Current industry standards for scheduling irrigation and. nitrogen fertiliser
involve monitoring of
soil moisture and crop `nitrogen status using a variety of techniques. These
procedures are
reactive, telling the farmer that a crop needs some nitrogen or irrigation
today rather than when it
will be needed it in the future and how much should be applied. Being able to
predict future
needs is important because nitrogen can take several days to permeate the
soil. If the crop
doesn't have enough nitrogen during the period between when it is applied and
when it is fully
available to the crop, then crop growth will be limited and yield may decline.
Predictive methods
(such as those used by the invention) are also favourable because they allow
forward planning of
field operations during the busy growing season.
A number of basic crop and soil models have been published in the literature
or are available in
the public domain. Crop and soil simulation models use weather data from any
location in the
world to predict the temperature and solar radiation dependent potential yield
and they can
predict how much nitrogen and water the soil will provide and how yield will
be reduced by water
and nitrogen limitations. However, current models do not produce schedules for
the application
of water and nitrogen that can be easily used by farmers for crop management.
SUMMARY OF THE INVENTION
The present invention has at least three aspects:
1. The production of an irrigation and nitrogen management schedule calendar
prescribed
to give optimal fertiliser and irrigation management for specified paddocks.
2. The production of predictions of crop yield and development, used for
analysing crop
yield limitations and monitoring the likely yield and harvest timing of
specified paddocks
3. The production of predictions of drainage and leaching, used for analysing
resource loss
from crops and monitoring their environmental impact
CA 02699571 2010-03-12
WO 2009/048341 PCT/NZ2008/000263
3 .
Aspect 1 improves upon other nitrogen and irrigation management systems by
generating an
easily-used schedule for the application of water and nitrogen that takes
into. account both the
current status of the crop and predictions for future crop requirements.
Aspect 2 improves upon
current methods of analysing and monitoring crop yields because the invention
quantifies the
effects of interacting weather, soil and management factors to predict yields
and identify factors
that may be reducing yield. Aspect 3 provides a means of analysis and
monitoring that is
otherwise not available.
In a first aspect the invention provides a method of managing fertiliser and
irrigation inputs for a
crop, the method comprising obtaining management data for the crop, the
management data
including a planting date for the crop; obtaining weather data representative
of the geographic.
area of the crop; obtaining soil description data representative of the
geographic area of the crop;
calculating an emergence date at least partly from the planting date;
calculating a plurality of
nitrogen deficit values at least partly from the emergence date and the soil
description data, the
nitrogen deficit values associated with respective dates each later than the
emergence date;
calculating a plurality of water deficit values at least partly from the
emergence date and the
weather data, the water deficit values associated with respective dates each
later than the
emergence date; and presenting on a display a schedule. of recommended
nitrogen application
values, irrigation values and application dates, the schedule calculated at
least partly from the
nitrogen deficit values and the water deficit values.
The term `comprising' as used in this specification and claims means
`consisting at least in part
of, that is to say when interpreting statements in this specification and
claims which include that
term, the features, prefaced by that term in each statement, all need to be
present but other
25. features can also be present. Related terms such as `comprise' and
`comprised' are to be
interpreted in similar manner.
As used herein the term "aind/or" means "and" or "or", or both.
As used herein "(s)" following a noun means the plural and/or singular forms
of the noun.
Preferably the weather data includes at least one of solar radiation, maxiunum
temperatures,
minimum temperatures and precipitation.
Preferably the weather data includes wind run.
CA 02699571 2010-03-12
WO 2009/048341 PCT/NZ2008/000263
4
Preferably the weather data includes humidity.
Preferably the weather data includes potential evapotranspiration.
Preferably the weather data comprises a plurality of daily values.
Preferably the soil description data includes at least one of soil texture
profiles, soil bulk density
profiles, soil hydraulic properties by depth, soil organic N content,
mineralization coefficient, soil
mineral N, and distribution of N within the fixst metre of soil.
Preferably the emergence date is calculated at least partly from a user input
emergence date.
Preferably the management data includes cultivar type.
Preferably the emergence date is calculated at least partly from cultivar
type.
Preferably the management data includes nitrogen management coristraints.
Preferably the management data includes water.management constraints.
Preferably the management data includes actual management to date. Preferably
the emergence date is calculated at least pardy from the soil description
data.
Preferably the method further comprises calculating a growth commencement
date.
Preferably the method further comprises calculating a maximum GAI date.
Preferably the method further comprises calculating a canopy senescence
completion date.
The invention further provides a computer readable medium having stored
thereon computer
executable instructions that when executed on a computing device cause the
computing device to
perform a method of managing fertiliser and irrigation inputs for a crop, the
method comprising
CA 02699571 2010-03-12
WO 2009/048341 PCT/NZ2008/000263
obtaining management data for the crop, the management data including a
planting date for the
crop; obtaining weather data representative of the geographic area of the
crop; obtaining soil
description data representative of the geographic area of the crop;
calculating an emergence date
at least partly from the planting date; calculating a plurality of nitrogen
deficit values at least partly
5 from the emergence date and the soil description data, the nitrogen deficit
values associated with
respective dates each later than the emergence date; calculating a plurality
of water deficit values
at least partly from the emergence date and the weather data, the water
deficit values associated
with respective dates each later than the emergence date; and presenting on a
display a schedule
of recommended nitrogen application values, irrigation values and application
dates, the schedule
calculated at least partly from the nitrogen deficit values and the water
deficit values.
In another aspect the invention comprises a method of predicting potential
yield for a crop, the
method comprising obtaining management data for the crop, the management data
including a
planting date for the crop; obtaining weather data representative of the
geographic area of the
crop; obtaining soil description data representative of the geographic area of
the crop; calculating
an emergence date at least partly from the planting date; calculating a
plurality of nitrogen deficit
values at least partly from the emergence date and the soil description data,
the nitrogen deficit
values associated with respective dates each later than the emergence date;
calculating a plurality
of water deficit values at least partly from the emergence date and the
weather data, the water
deficit values associated with respective dates each later than the emergence
date; and presenting
on a display a schedule of potential crop yield values, the schedule
calculated at least partly from
the nitrogen deficit values and the water deficit values.
The invention further provides a computer readable medium having stored
thereon computer
executable instructions that when executed on a computing device cause the
computing device to
perform a method of predicting potential yield for a crop, the method
comprising obtaining
management data for the crop, the management data including a planting date
for the crop;
obtaining weather data representative of the geographic area of the crop;
obtaining soil
description data representative of the geographic area of the crop;
calculating an emergence date
at least partly from the planting date; calculating a plurality of nitrogen
deficit values at least partly
from the emergence date and the soil description data, the nitrogen deficit
values associated with
respective dates each later than the emergence date; calculating a plurality
of water deficit values
at least partly from the emergence date and the weather data, the water
deficit values associated
with respective dates each later than the emergence.date; and presenting on a
display a schedule
CA 02699571 2010-03-12
WO 2009/048341 PCT/NZ2008/000263
6
of potential crop yield values, the schedule calculated at least partly from
the nitrogen deficit
values and the water deficit values.
In a third aspect the invention comprises a method of predicting potential
drainage and leaching
from crop production, the method comprising obtaining management data for the
crop, the
management data including a planting date for the crop; obtaining weather data
representative of
the geographic area of the crop; obtaining.soil clescription data
representative of the geographic
area of the crop; calculating an emergence date at least partly from the
planting date; calculating a
plurality of nitrogen balance values at least partly from the emergence date
and the soil
description data, the nitrogen balance values associated with respective dates
each later than the
emergence date; calculating a plurality of water balance values at least
partly from the emergence
date and the weather data, the water balance values associated with respective
dates each later
than the emergence date; and presenting on a display a schedule of potential
drainage and
leaching values, the schedule calculated at least partly from the nitrogen
balance values and the
water balance values.
The invention further provides a computer readable medium having stored
thereon computer
executable instructions that when executed on a computing device cause the
computing device to
perform a method of predicting potential drainage and leaching from crop
production, the
method comprising obtaining management data for the crop, the management data
including a
planting date for the crop; obtaining weather data representative of the
geographic area of the
crop; obtaining soil description data representative of the geographic area of
the crop; calculating
an emergence date at least partly from the planting date; calculating a
plurality of nitrogen balance
values at least partly from the emergence date and the soil description data,
the nitrogen balance
values associated with respective dates each later than the emergence date;
calculating a plurality
of water balance values at least partly from the emergence date and the
weather data, the water
balance values associated with respective dates each later than the emergence
date; and presenting
on a display a schedule of potential drainage and leaching values, the
schedule calculated at least
partly from the nitrogen balance values and the water balance values.
To those skilled in the art to which the invention relates, many changes in
construction and
widely differing embodiments and applications of the invention will suggest
themselves without
departing from the scope of the invention as defmed in the appended claims.
The disclosures
and.the descriptions herein are purely illustrative and are not intended to be
in any sense limiting.
CA 02699571 2010-03-12
WO 2009/048341 PCT/NZ2008/000263
7
BRIEF DESCRIPTION OF THE DRAWINGS
Figure 1 shows a schematic view of a hardware implementation of the invention;
Figure 2 shows the main software modules of the invention;
Figure 3 illustrates a high-level functional block diagram of the invention,
including inputs and
outputs;
Figure 4 illustrates the key information exchanges to produce irrigation and
management advice;
Figure 5 illustrates key procedures to produce irrigation schedules;
Figure 6 illustrates key procedures to produce nitrogen schedules;
Figure 7 illustrates key procedures to analyse and monitor crop yields;
Figure 8 illustrates key procedures carried out to predict potential and
limited yields;
Figure 9 illustrates key procedures to analyse and monitor resource losses
from crops;
Figure 10 illustrates the key process used in predicting drainage and
leaching;
Figure 11 shows crop yield responses;
Figure 12 shows a preferred form user interface screen;
Figure 13 shows a further preferred form interface screen enabling a user to
perform
management scheduling;
Figure 14 shows a preferred form user interface screen that enables a user to
specify irrigation set
up options;
Figure 15 shows a preferred form schedule generated and displayed to a user;
CA 02699571 2010-03-12
WO 2009/048341 PCT/NZ2008/000263
8
Figure 16 shows an example financial management screen presented to a user;
Figure 17 shows a graphical display of individual water deficit values;
Figure 18 shows a graphical display of soil mineral and nitrogen values;
Figure 19 shows simulation of green leaf area index;
Figure 20 shows crop biomass calculations;
Figure 21 shows soil, mineral and nitrogen values at various depths;
Figure 22 shows the amount of accumulated nitrogen that is leached and water
drained;
Figure 23 shows simulations of crop nitrogen; and
Figure 24 shows simulated root depth.
DETAILED DESCRIPTION
Figure 1 shows a preferred form system 100 for managing performance of an
agriculturalcrop.
The system 100 enables a user to manage and monitor. crops by issuing
recommendations of the
timing of irrigation and nitrogen fertilizer applications.
The system is primarily a web based application. A user 105 accesses
information over internet
110 from a personal computer or other computing device using a web browser.
User 105 is
provided with a uniform resource locator (URL). The browser running on user
machine 105
uses the URL to determine the internet protocol (IP) address of a web page
providing
information required. An IP request is then sent from user 105 over internet
110 to a router 115.
The router is located between the internet 110 and other components of the
system 100. The
router 115 passes along data packets that are specifically addressed to other
components of the
system 100. The router 115 filters or redirects packets that are intended for
other destinations.
CA 02699571 2010-03-12
WO 2009/048341 PCT/NZ2008/000263
9
Data that are intended for the system described below pass next to a firewall
120. The firewall
120 is an optional but preferred component of system 100. The firewall 120
acts to filter out
certain types of potentially malicious data that might impede or otherwise
interfere with the
operation of the invention. Firewall 120 further serves as an end point for a
virtual private
network (VPN) connection. The firewall 120 allows secure access to further
components of the
system 100 from a remote location for the purpose of maintenance and updates.
Data that are considered acceptable by the firewall 120 (when present) are
then passed to load
balancer 125. Load balancer 125 is a further optional component 100 that is a
preferred
component. The load balancer 125 acts to distribute individual data requests
among one or more
web servers 130. Load balancer 125 has the potential to improve performance,
enabling multiple
machines working in parallel to process user requests. Spreading the load over
multiple web
servers 130 improves reliability since the system continues to function as
long as at least one web
server is still running.
Web server(s) 130 typically comprise both.web server hardware and web server
software. Data
arriving at the web server hardware are read by the operating system and
passed to web server
software. Web requests, normally using hyper text transport protocol (HTTP),
are processed by
the web server software and routed to the web application referencing the
original URL sent by
the browser of the user 105.
The request is processed based on the parameters provided in the HTTP request.
A response is
generated consisting of hyper text mark up language (HTML), images and related
files and data.
As part of generating a response web server software typically passes requests
to and receives
responses from database 135. One preferred form database is a relational
database management -
system (RDBMS). The database stores data in a persistent form and provides
facilities for query
and update over a network connection.
Web application 130 receives a request to run soil and crop models to generate
water and
nitrogen schedules. The web application is configured to either run them
directly or to request
that calculation server 140 performs all the necessary calculations. In this
case the database 135
has the potential to be used as an intermediary to handle reliable queuing and
delivery of
messages between web application and calculation server.
CA 02699571 2010-03-12
WO 2009/048341 PCT/NZ2008/000263
When a message is received by the calculation server 140, the server then runs
the soil and crop
models using parameters stored in the database 135. Once the model runs are
complete, the
results are also stored in the database 135.
5 Dashed lines 145 show preferred form security options. In order to limit
security risks, one
configuration of system 100 permits certain applications running on server
hardware to only be
accessible from behind firewall 120 on a maintenance network as indicated by
the dashed line
145. For example remote desktop management and database 135 are only
accessible that way
and cannot be accessed from an IP address that is visible on the public
internet. The
10 ' maintenance network is typically implemented with alternative private IP
addresses that are not
visible on the external side of the firewall 120 except through a secure VPN
connection. Those
secondary IP addresses can also use a second network port on the web server
hardware. The
secondary IP addresses help distribute the network load among more than one
port.
The maintenance network is also used when installing new software on the
servers and other
scenarios where interference of traffic originating from users is not
desirable.
Components.150 are able to be configured as separate pieces of hardware or
combined to a
fewer number of physical machines including a single machine, without loss of
functionality.
Multiple machines are able to be used to improve performance and reliability.
Furthermore, all
of the hardware shown at 150 can be configured in multiple units to increase
performance and
reliability. For example multiple calculation servers can share the model
calculation load.
Multiple load balancers can be configured to fail over in the event of the
failure of one of them.
Figure 2 shows further aspects of the system 200,for managing performance of a
crop.
System 200 includes a user interface 205 configured to generate HTML. System
200 is also
interfaced to the database 135.
System 2.00 further includes control logic 210. As described above the web
application consists
of a collection of web pages. Each of these web pages uses some of the control
logic 210 to
generate HTML.
CA 02699571 2010-03-12
WO 2009/048341 PCT/NZ2008/000263
11
Access to the system 200 requires a user specific account. An authentication
component 215
coordinates the creation of an account after the user provides details
including an account name
and password. User verification details are stored in the database 135. When a
user returns to
the system, the user is authenticated by the system after providing the same
information.
The web application collects user inputs using module 220. Module 220 uses
HTML based
forms. Information collected from a user, such as whether they prefer English
or metric units, is
stored in a user specific profile 225 within database 135. The profile 225 is
referenced as part of
a page creation process. For example one user preferring English units is
provided with an
English unit web page while another has the same page displayed to them in
metric units.
One preferred component is a units conversion component 230 which converts for
example
between English and metric units.
Additional user inputs collected by the user input module 220 include
descriptions of thelocation
of a farm, the type and depth of soil layers at specific paddocks at that
farm, the specific variety
of crop planted at each paddock, the date the crop was planted, which weather
station most
accurately covers their farm, and water and nitrogen history for the crop. The
collected
information is stored in database 135 and can be displayed and edited by the
user.
The scheduler 240 runs the crop 250 and soil 255 models using the collected
user inputs 220, and
stores the results in the database 135. The user is then able to request
generation of reports using
a report generation module 235, based on a selected farm, paddock or crop. The-
report
generation module 235 retrieves, formats and displays information stored in
the database 135,
including results of the scheduler 240 and user inputs 220.
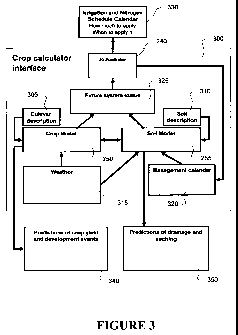
Figure 3 shows a high level block diagram of the system from figures 1 and 2.
The system
collates necessary soil and weather data, and other crop and soil model
inputs. The system uses
this input data to run crop and soil models to produce various outputs. The
preferred form crop
calculator interface 300 receives information for the user such as a planting
date as well as
weather, soil and management parameters. User inputs include for example
cultivar description-
305, soil description 310, weather data 315 and management calendar
information 320.
CA 02699571 2010-03-12
WO 2009/048341 PCT/NZ2008/000263
12 -
The weather information 315 includes temperature, solar radiation rainfall and
potential
evapotranspiration. This information includes both past actual data as well as
future mean or
forecast data. Management calendar information 320 includes irrigation and
fertilisation data.
This includes for example measured past actual data as well as future
scheduled data.
Data 305, 310, 315 and 320 are then input to crop mode1250 and soil model 255.
Crop model
250 predicts potential crop growth and predicts the resources needed to
achieve this growth. Soil
model 255 predicts soil water provided and predicts soil nitrogen provided.
Future system status 325 is calculated. This status represents how much a crop
needs and how
much the soil can provide. The system status predicts when shortfalls in water
and/or nitrogen
will occur.
Scheduler 240 then determines how much nitrogen and/or water is to be applied
and when. The
output of this scheduler 240 is then fed into management calendar 320. This
modified calendar
is then input into soil mode1255 and so on to predict when the next shortfall
will occur. This
process is repeated until no further shortfalls are identified. The resulting
schedule calendar 330
can then be followed as a recommendation that will provide sufficient water
and nitrogen for a
crop to obtain its maximum yield by also avoiding excessive inputs and
reducing the risk of
wastage.
It is anticipated that this system is used throughout the season to update
schedules to account for
actual weather (rainfall in particular) that differs from long term averages.
This irrigation and
nitrogen schedule calendar is indicated at 330.
..
A further aspect of the invention includes predictions of crop yield and -
development events 340.
A still further aspect includes predictions of drainage and leaching 350.
For the analysis and monitoring of crop yield 'and development the invention
collates user inputs
and operates crop and soil models as specified above. In this aspect the
outputs from the
invention are predictions 340 of yield and harvest timings and the prediction
of the extent and
timing of yield limitations. These outputs can be used by farmers to determine
the cause of low
crop yields and may lead to recommendations to improve yield. They can also be
used by crop
CA 02699571 2010-03-12
WO 2009/048341 PCT/NZ2008/000263
13
processors to monitor the spread of harvest timings and crop production from a
given region for
advanced planning of logistics.
For the analysis and monitoring of resource loss the invention collates user
inputs and operates
crop and soil models as specified above. In this aspect the outputs from the
invention are
predictions of drainage and leaching 350. These can be used to identify the
extent of resource
loss from a specified paddock and identify changes in management that may
reduce resource
waste and create cost savings. These predictions can also be used as a
quantification of the
environmental impact of the crop's production and may be used for the purpose
of
environmental audit.
Irrigation and Nitrogen Management
One aspect of the invention involves managing performance of a crop. One
aspect of
management is the provision of optimal irrigation and nitrogen management
recommendations in
the form ofa schedule. Optimal management of.nitrogen and irrigation in crops
will provide
the crops with just enough of each to meet their demand and achieve maxunum
yields, but.no
more than is needed, to minimise wastage. The amount and timing of optimal
fertiliser and
nitrogen applications will differ depending on the specific weather, soil,
planting date, crop
variety and paddock history. The difficulty that farmers face is how to
determine optimal
irrigation and nitrogen management for individual crops that will have
different combinations of
the above variables. The invention relates to a method for collating soil;
weather and
management information and interpreting this to prescribe an optimal
irrigation and nitrogen
schedule forecast specific to the individual paddock.
Figure 4 shows the crop calculator interface 300 performing the collation and
storage of the
information specified below. This information is available from a range of
sources and reported
in a range of units. The invention provides facilities for collating these
sources and translating
input data into appropriate units for use by the models and schedulers. The
input data includes
user soil inputs 405, user weather inputs 410 and user management inputs 415.
For user soil inputs 405 the user enters paddock specific test results for:
a. Soil texture profiles
b. Soil bulk density profiles (or some surrogate)
CA 02699571 2010-03-12
WO 2009/048341 PCT/NZ2008/000263
14
c. Soil mineral nitrogen profiles at or before planting
d. Top soil nitrogen mineralisation results
For user weather inputs 410 the user specifies the nearest weather station
from a list of available
stations, and the invention collates up-to date actual data and long term
average or forecast data
from a variety of sources (including the Internet and private weather
stations) for that station for:
a. Temperature (minimum and maximum)
b. Rainfall
c. Solar radiation
d. Potential evapotranspiration
For user management inputs 415 the user specifies the management they will
impose and have
imposed on the crop:
a. Planting date, row and plant spacing (plant population)
b. Cultivar (the specific variety of crop to be grown)
c. Nitrogen management constraints.(application rate and timing limitations)
d. Water management constraints (application rate and timing limitations)
e. Actual management to date (specified for in-season updates)
The interface 300 collates the above data specific to individual paddocks (or
areas within a
paddock) and can collect information and perform the functions described below
for any number
of paddocks that the user chooses to specify. The invention then derives
necessary parameters
from this information. These parameters include soil parameters 420 and
weather data 425.
Weather data 425 includes long term average weather and actual past weather.
Long term
average weather is used as a forecasting. Actual past weather replaces average
weather each time
the model is updated.
The system then invokes crop model module 250 to predict crop demands. The
system runs soil
model module 255 to predict soil supply. The system further invokes the
scheduler 240 to
identify the timing of shortages each time the model is run.
The above modelling procedure identifies when shortages occur. The system
starts by running
the models using user defrned inputs- and with no additional irrigation or
nitrogen fertiliser. This
identifies when shortages first occur. The system then interrogates the user
input rules that
CA 02699571 2010-03-12
WO 2009/048341 PCT/NZ2008/000263
specify allowable rates of irrigation and nitrogen 430. The scheduler 240 adds
the appropriate
rate to the appropriate day in a schedule calendar. The schedule calendar 435
displays actual to-
date and scheduled future irrigation and fertiliser events.
5 For nitrogen fertiliser, applications are applied several days (usually 3
days) prior to the
occurrence of shortage so there is sufficient time for the fertiliser to be
dissolved and become
available to the crop by the time the shortage would have otherwise occurred.
For irrigation, applications are made the day before a shortage is predicted,
since water becomes
10 available to the crop imrnediately.
The models are then re-run with the above events appended to the schedule
calendar 435.to
identify when the next shortage occurs. This procedure is repeated until no
further shortage
events are identified.
The resulting series of events is a schedule calendar 330 that can be
presented to the user as a
report, recommending when and how much nitrogen and irtigation is to be
applied.
Actual weather will always vary from long term averages or forecasts, which
means in reality that
shortages may occur sooner or later than is predicted using long-term weather
forecasts.
Practical considerations also mean actual amounts and timing of nitrogen.and
irrigation often
differ from that recommended by the irivention. It is therefore important to
update schedules
throughout the growing season to ensure that nitrogeri and irrigation are
matched to the supply
and demand that the actual weather produces.
Another important feature of the systern is its ability to handle the
transition between actual and
forecast information. The system automatically updates weather data for each
weather station
and replaces forecast with actual data as the season progresses. The updated
data is obtained
from multiple sources, including the Internet and private weather stations.
The system also
recognises that events in the schedule calendar prior to the date of the
update should represent
actual events. Thus, it prompts the user to check and change them if actual
management differed
from that scheduled. It then removes all of the future scheduled events and re-
runs the
modelling and scheduling processes, identifying when future shortfalls will
occur based on actual
CA 02699571 2010-03-12
WO 2009/048341 PCT/NZ2008/000263
16
management and weather up to now, and forecast weather into the future and
produces an
updated schedule calendar for the rest of the growing season.
There are three ways that irrigation and nitrogen can be scheduled:
1. Variable rate with fixed timing:
a. For irrigation this might be used when water is available on a fixed
rotation and a
farmer wants to know how long to run the irrigation system for to ensure the
crop won't become stressed prior to the next possible irrigation event. In
this
situation the system finds the first shortage event and then steps back to the
previous fixed time when irrigation could be applied. It then sets the amount
to
be applied equal to the soil water deficit on that day so the soil is re-
filled but no
drainage occurs.
b. For nitrogen this might be used when fertigation (combined irrigation and
fertilisation) or nitrogen spreading machinery is available at fixed timings.
The
timing of applications is distinguished as above. The rate is calculated as
the total
difference between supply and demand from the time of application until the
next
possible application event.
2. Variable timing with fixed rate
a. For irrigation this might be used when a farmer has flexibility in the
frequency
with which a crop can be irrigated but no flexibility in the amount of water
that
the irrigation system can supply. In this instance.the scheduler 240 will
identify
shortage events and schedule an irrigation event of the specified (fixed)
amount
the day prior.
b. For.nitrogen this might be used when a farmer does not change the
calibration on
application equipment during the season (always applies the same rate each
pass)
but has flexibility in when and how often fertiliser is applied. In this
instance the
scheduler 240 will identify shortage events and schedule a fertiliser event of
the
specified (fixed) amount several days (usually 3 days) prior.
3. Variable rate and variable timing
a. For water this can be used for centre pivot irrigation where a farmer can
control
rate by adjusting irrigator speed and timing by determining how frequently the
irrigator is run. Varying rate and timing is beneficial as it allows very
precise
CA 02699571 2010-03-12
WO 2009/048341 PCT/NZ2008/000263
17
control over the supply of water to the crop, which optimises production and
minimises the cost of irrigation and the risk of drainage and leaching. In
this
instance the invention identifies when the crop will be entering water stress,
calculates the soil water deficit on the prior day and sets the irrigation
rate on that
day to replace the predicted soil water deficit.
b. For nitrogen this might be used when the farmer has flexibility in
fertigation -
practices and wants to closely match nitrogen inputs with crop demand to
optimise crop yield but ensure there is no excess in the system that is a risk
of
leaching. In this instance the scheduler identifies when shortages will begin
and
what the total shortage will be over an arbitrary (say 3 day) period following
this.
It then applies this amount of fertiliser several days (usually 3 days) prior
the day
of shortage to ensure there is just enough nitrogen in the system to
adequately
supply the crop for the specified period.
Figure 5 demonstrates how the system calculates irrigation schedules. The crop
model and soil
model described above are preferably run on a daily time step. The models
start with the initial
status of the crop and soil each day. The crop start of day status is shown at
500 and the soil
start of day status is shown at 505.
The crop start of day status is represented by potential evapotranspiration
(PET), crop cover
(R/RO) and root depth (RD).
The soil start of day status 505 is represented by rainfall and soil water
content (SWC).
Crop water demand is calculated 510 as a function of the crop cover and the
PET. A stress
factor 515 is calculated as a function of water supply 540 and water demand
510. The system
identifies stress events 520 where water demand is likely to exceed water
supply. In these
circumstances the scheduler 240 generates and retains irrigation rates and
timings.
Then the change is calculated 525 in crop cover and root depth and the end of
day status 530 is
updated of crop cover and root depth to be fed into the next day start of day
status 500.
The soil start of day water status 505 is updated by updating the soil water
content (SWC) as a
function of irrigation, rainfall and drainage 535. Water supply is then
calculated as a function of
CA 02699571 2010-03-12
WO 2009/048341 PCT/NZ2008/000263
18
soil water content and an extraction constant calculated to the root depth
(RD). Water uptake
and evaporation are calculated 545.
Soil water content 550 is then updated as a function of existing soil water
content, water uptake
and evaporation. The end of day status of the soil water content is then
calculated 555 and fed
back into the next day start of day soil water status 505.
Figure 6 shows calculation of nitrogen schedules. Once again the system
calculates a crop start
of day status 600 and a soil start of day status 605. The crop start of day
status 600 is represented
by radiation (RAD), temperature (TEMP), crop cover (R/Ro) and root depth (RD).
Crop
nitrogen demand is calculated 610 as a function of potential growth and
nitrogen content. _ A
stress factor 615 is calculated as a function of nitrogen supply and nitrogen
demand. Stress
events are identified 620 where nitrogen demand exceeds nitrogen supply. Where
nitrogen
demand exceeds nitrogen supply the scheduler 240 generates and retains
nitrogen rates and
timings.
Then the change is calculated 625 in crop cover and root depth. The end of day
status 630 is
then calculated by updating crop cover and root depth. These updated values
are fed back to the
next day crop start of day status 600.
Once the soil start of day nitrogen status 605 is determined, the crop
available nitrogen (CAN) is
calculated 635. The CAN is a function of soil and nitrogen content,
mineralisation, fertiliser,
leaching and a factor of soil water content.
Nitrogen supply is calculated 640 as a function of crop available nitrogen,
and an extraction
constant calculated to a root depth.
Nitrogen uptake is calculated 645.
The soil nitrogen content is updated 650 as a function of existing soil and
nitrogen content and
nitrogen uptake. The end of day status of soil and nitrogen content is then
calculated 655 and
fed back to the next day soil start of day status 605.
CA 02699571 2010-03-12
WO 2009/048341 PCT/NZ2008/000263
19
Yield Prediction
A further aspect of the invention involves the analysis and monitoring of crop
yields and harvest
dates. Analysing the performance of crops is useful for identifying factors
that are limiting yield
and may be addressed to either improve production or reduce resource inputs to
match possible
production.
Figure 7 demonstrates predictions of yields using crop and soil models. The
system integrates
most of the important factors that influence yield and can quantify the cause
and extent of yield
limitations with greater certainty than other methods. The quantification of
yield limitations
allows a value to be put on this.Iimitation. The ability of the invention to
run "what if'
management scenarios and to predict subsequent yields enables producers to
make informed
decisions on the outcomes of changing management to address the identified
yield limitations.
The alternative is field- scouting where agronomists or consultants make
qualitative observations
of some of the factors that influence yield and make-subjective predictions on
whether yield is.
limited or not.
Monitoring crop yields is necessary for forecasting yields so crop processors
can plan logistics.
The system's use of crop and soil models offers a unique advantage here
because it outputs
predictions of yield and maturity date in many individual fields in response
to their specific soil,
mariagement and weather each year. This enables forward planning of total
production volumes
and the spread of harvest timings. Predictions of yields and harvest dates can
be updated
through each season to take account of weather variatibn and reduce
uncertainty in predictions as
the season progresses. The alternative to this is processing managers'
planning production
capacity and the spread of harvest based on historical information and making
destructive
measurements in individual fields to check for variation from this each year.
This is imprecise
and time consuming..
Figure 7 shows the crop calculator interface 300 performing predictions of
crop yield. Input data
includes user soil inputs 405, user weather inputs 410 and user manual inputs
415.
Once again for user soil inputs 405 the user enters paddock specific test
results for:
CA 02699571 2010-03-12
WO 2009/048341 PCT/NZ2008/000263
20 -
a. Soil texture profile
b. Soil bulk density profile (or some surrogate)
c. Soil mineral nitrogen profiles at or before planting (mineral nitrogen
profile)
d. Topsoil nitrogen mineralisation results (mineralisable nitrogen).
For user weather inputs 410 the user specifies the nearest weather station
from a list of available
stations. The system collates up to date actual data and long term average or
forecast data from a
variety of sources including the internet and private weather stations for
that station for:
a. Temperature (minimum and maximum)
b. Rainfall
c. Solar radiation
d. Potential evapotranspiration.
For user managementinput 415 the user specifies the management the user will
impose and has
imposed on the crop. These inputs include:
a. Planting date, row and plant spacing (plant population)
b. Cultivar (the specific variety of crop to be grown)
c. Nitrogen management constraints (application rate and timing limitations) ,
d. Water management constraints (application rate and timing limitations) C.
Actual management to date (specified for in season updates).
The interface 300 collates the above data specific to individual paddocks or
areas within a
paddock. The system collects information and performs the functions described
below for ariy
number of paddocks that the user chooses to specify. The invention then
derives necessary
parameters from this information. These parameters include soil parameters 420
and weather
data 425. Weather data 425 includes long term average weather and actual past
weather. Long
term average weather is used as a forecast. Actual past weather replaces
average weather each
time the mode is updated.
The system then invokes crop model module 250 to predict potential yield 730
and crop
demands. The system runs soil model module 255 with the specified management
schedule
calendar 435 (represents actual and/or intended irrigation and fertiliser
events) to predict soil
,
CA 02699571 2010-03-12
WO 2009/048341 PCT/NZ2008/000263
21
supply. Stress responses 735 and limited yield are then calculated. The
resulting series of events
is an output 740 that represents a report of potential and limited yields
under defined climate soil
and management.
The system uses inputs collated by the interface and crop models (as described
above) to
determine potential yield according to the effects of temperature on the
development (duration)
of the crop from the planting date to the harvest date, the effects of
temperature on the
development of the crop's leaf area index and radiation interception and the
effects of
temperature on radiation use efficiency. This defines what the potential
stress-free yield of a
given cultivar will be at a given geographical location for a given planting
date.
The system then runs the crop models using irrigation and nitrogen events
specified in the
schedule calendar, the initial status of the soil, water added from rainfall,
and nitrogen added by
mineralisation to determine the timing and extent of water and nitrogen
shortages and predict the
yield that the crop can achieve with the predicted water and/or nitrogen
liinitations. The limited
yield predicts what a given cultivar's yield will be at a givein geographical
location for a given
planting date on a given soil type with .a specified initial nitrogen and
water status with a specified
climate and management schedule.
Figure 8 shows in more detail how the system predicts yield. The crop model
and soil model
described above are preferably run on a daily time step. The models start,with
the initial status of
the crop and soil each day. The crop start of day status is shown at 800 and
the soil start of day
status is shown at 802.
The crop start of day status is represented by radiation (RAD), temperature
(TEMP), potential
evapotranspiration (PET), phonological state, leaf area index (LAI) and root
depth (RD).
The soil start of day status 802 is represented by rainfall, temperature, soil
water content (SWC)
and soil nitrogen content (SNC).
-
Radiation interception is calculated 805 as R/Ro using leaf area index (LAI).
Potential growth is calculated 810 as a function of radiation (RAD), radiation
interception (R/Rõ)
and radiation use efficiency. Water and nitrogen demand is calculated 815.
Stress indices are
CA 02699571 2010-03-12
WO 2009/048341 PCT/NZ2008/000263
22
then calculated 820. Stress indices for water are calculated as a function of
soil water content and
nitrogen stress indices are calculated as a function of soil nitrogen content.
Limited,growth is
calculated 825 as a function of potential yield, stress indices for water and
stress indices for
nitrogen.
Yield is then calculated 830. Biomass is partitioned between leaf, stem and
yield depending on
phonological state. The change in phonological state, leaf area index and root
depth are then
calculated 835.
The end of day status 840 is calculated and fed back into the next day crop
start of day status
800.
The soil start of day status 805 is updated by updating the soil water content
845.
Crop available nitrogeri is calculated 850. Water and nitrogen supply to root
depth is calculated
855.
Water and nitrogen uptake is calculated 860.
Soil water content and soil nitrogen content are then updated 865. The end of
day status is
calculated 870 and fed back into the soil start of day status 805.
In theory it should be possible for a crop to attain the potential yield that
the invention calculates
if it never encounters shortages of water, nitrogen or other nutrients or
burdens from pests or
disease. Identification of yield limitations is done by setting the
invention's user inputs (Fig. 7,
soil, weather and management) to represent a past crop of known_yield.
Firstly, the invention can
determine if water or, nitrogen shortage reduced yield below potential. This
is done by simply
comparing potential and limited yields (as output by the invention, Fig. 7)
and if the limited yield
is lower than potential, then the crop encountered shortage. Comparison of
water and nitrogen
supply with demand will identify which was limiting and a skilled operator can
determine if
alternative management strategies (such as following the management
recommended by the
invention) might improve yield. If the obseived yield (as measured in the
field) was less than the
limited yield then something other than water or nitrogen was reducing yield
and the'farmer
knows to look for other mineral deficiencies or disease problems.
CA 02699571 2010-03-12
WO 2009/048341 PCT/NZ2008/000263
23
Crop processors are interested in monitoring the yield and development of
crops so they can
make decisions on when to start factories, how much storage may be needed and
if crops may
need to be sourced from or moved to other areas to fill processing capacity.
Yield and timing of
crop maturity varies from year to year depending on the weather conditions
experienced in that
year and the effect they will have on planting dates, development rates and
water shortages. The
invention uses crop and soil models and user defined inputs (Fig. 7) to
predict the yield of any
number of defined paddocks and to predict when each paddock will be ready for
harvest.
Aggregation of this information can then be provided to processors to plan
harvesting, transport
and processing logistics.
Predictions of Drainage and Leaching
A further aspect of the invention is the analysis and monitoring of resource
loss. Resources can
be lost from crop production systems through the drainage of water and
leaching and
nitrification of nitrate from fertilisers.
This represents an economic cost to farmers who will have paid for the
acquisition and
application of those resources, and who may have to pay to replace them if
they are lost.
It also represents an environmental cost since drainage reduces water use
efficiency, which
increases the amount of fresh water that is removed from natural ecosystems
for irrigatioti and
can increase the salinity of ground water. Fertiliser leaching has a negative
environmental impact
because it contaminates ground and surface water. Nitrification is a negative
impact because it
produces nitrous oxide which is a potent green house gas. Currently there is
no alternative
method for analysing or monitoring resource losses.
Leaching is calculated from the amount of water that drains from the crops
root depth and the
nitrogen concentration of this water.
Figure 9 demonstrates the analysis and monitoring of resource loss. The crop
calculator interface
300 performs all the necessary collation and storage of information. The input
data includes user
soil inputs 405, user weather inputs 410 and user management inputs 415.
CA 02699571 2010-03-12
WO 2009/048341 PCT/NZ2008/000263
24
For user soil inputs 405 the user enters paddock specific test results for:
a. Soil texture profile
b. Soil bulk density profile (or some surrogate)
c. Soil rnineral nitrogen profiles at or before planting (mineral nitrogen
profile)
d. Top soil nitrogen mineralisation results (mineralisable nitrogen).
For user weather inputs 410 the user specifies the nearest weather station
from a list of available
stations. The system collates up to date actual data and long term average or
forecast data from a
variety of sources including the internet and private weather stations. This
data is represented by:
a. Temperature (minimum and maximum)
b. Rainfall
c. Solar radiation
d. Potential evapotranspirations.
For user management inputs 415 the user specifies to the management they will
impose and have
imposed on the crop. This data includes:
a. Planting date, row and plant spacing (plant population)
b. Cultivar (the specific variety of crop to be grown)
c. Nitrogen management constraints (application rate and timing limitations)
d. Water management constraints (application rate and timing limitations)
e. Actual management to date (specified for in season updates).
The interface 300 collates the above data specific to individual paddocks, or
areas within a
paddock, and can collect information and perform the function as described
below for any
number of paddocks the user chooses to specify. The invention then derives
necessary
parameters from this information. These parameters include soil parameters 420
and weather
data 425. Weather data 425 includes long term average weather and actual past
weather. Long
term average weather is used for forecasting. Actual past weather replaces
average weather each
time the model is updated.
CA 02699571 2010-03-12
WO 2009/048341 PCT/NZ2008/000263
The system then invokes crop model module 250 to predict crop demands. The
system runs soil
model module 255 to predict soil supply.
The system calculates soil, water and nitrogen balances and makes drainage
predictions 935 and
5 leaching predictions 940. The output from the system 950 is a report. of the
amount of drainage
and leaching from the crop.
Figure 10 shows one preferred form model 1000 for calculating water balance.
The water
content of soil layers is calculated 1005 daily. Water is removed throughout
the rooting depth of
10 the crop by transpiration 1010 and is removed from the top soil layer by
evaporation,1015.
Water is added into the top layer from irrigation 1020 and rainfall 1025 and
any water in excess of
the drained upper limit drains 1030 to the next soil layer. Water cascades
down through the soil
profile as subsequent layers fill up and water that drains from below the
crops rooting depth is
considered to be drainage.
Nitrogen balance is calculated where the nitrogen content of soil layers 1035
is calculated daily.
Nitrogen is removed through the rooting depth of the crop by crop uptake 1040
and
denitrification 1045. Nitrogen fertiliser 1050 residual nitrogen 1060 and
mineralised nitrogen
1055 are added to the top soil layer. Mineral nitrogen 1035 occupies three
compartments in the
soil: unavailable, available (can be extracted by plants) and mobile (moved to
deeper layers by
drainage). Nitrogen equilibrates between these compartments and the
concentration of nitrogen
in the mobile water at the bottom of the root depth is used to calculate
leaching 1065 in
combination with drainage amount.
Drainage and leaching can be caused by inappropriate irrigation and
fertilisation practices in the
field but the extent of the problem is. often not recognised because they are
not easily measured.
The system is able to predict the extent and timing of drainage and leaching
in response to soil
type, climate and management. This demonstrates the extent of possible
resource loss.
Farmers.adhering to frequently updated irrigation schedules generated by the
above system may
greatly reduce the risk of drainage by matching irrigation applications to
water demand and not
over-filling the soil.
CA 02699571 2010-03-12
WO 2009/048341 PCT/NZ2008/000263
26
Similarly, the nitrogen schedules produced by the system reduce the risk of
nitrogen leaching by
matching nitrogen supply to demand to ensure the nitrogen content in the soil
does not increase
to high values. A skilled operator of the tool may also use it to identify
further possibilities-to
change management to reduce resource waste.
Increasingly consumers are concerned about the environmental impact of the
production of the
food they are consuming, so producers and retailers are moving to provide
information about the
sustainability of production systems of products they sell. Good Agricultural
Practice (GAP)
programs are being developed around the world, and to meet GAP standards
farmers may need
to provide audit for the environmental impact of each crop they grow.
The system provides a simple mechanism for providing this audit because it
keeps records of the
amount of irrigation and nitrogen applied and predictions of the amount of
drainage and leaching
that occurs.
-
Outputs from the system include pass or fail grades for drainage or leaching
standards which are
given at the end of the season once actual weather and management information
is added to the
calculator. The invention also produces water footprint values for crops.
Nitrous oxide
predictions and the collection of cultivation information allow the invention
to calculate carbon
footprints.
Experimental Results -
The following table shows data representing an average from five trials
conducted in commercial
potato fields in South Canterbury, New Zealand.
COMMERCIAL ASSESSMENT
Basal Scheduled Grower LSD
N applied 100 185 314
(kg/ha)
Yield 63.0 67.3 68.6 3.55
(t/ha)
CA 02699571 2010-03-12
WO 2009/048341 PCT/NZ2008/000263
27
The trials involve three different treatments.
The first treatment known as "Basal" treatment received only 100 kilograms of
nitrogen at
planting.
,
"Scheduled" treatments received nitrogen as scheduled by the system described
above.
"Grower" treatments received nitrogen in accordance with what the grower
applied to the rest of
the paddock.
As shown in the table, the amount of nitrogen applied in kilograms per hectare
was 100 from the
basal treatment, 185 for the Scheduled treatment and 314 for the Grower
treatment. The
scheduled treatment required on average only 85 kilograms of nitrogen more
than the Basal
treatment.
The resulting yield in tonnes per hectare was 63 for the Basal treatment, 67.3
for the Scheduled
treatment and 68.6 for the Grower treatment. The increase from 63 tonnes per
hectare for the
Basal treatment to 67.3 tonnes per hectare for the Scheduled treatment
represents a significant
yield increase. This demonstrates that the crops actually required the extra
nitrogen scheduled.
The extra nitrogen gave a yield benefit.
Under the Grower treatment the growers applied 139 kilograms of nitrogen more
than that
required by the Scheduled treatment. There was not a'significant yield
difference between the
Scheduled treatment and the Grower treatment. The increase was only from 67.3
tonnes per
hectare to 68.6 tonnes per hectare.
This shows that the extra nitrogen applied by the growers was not needed and
the growers could
have achieved the same yield, spent less on fertiliser and reduced leaching
risk by following the
recommendations set out by the invention.
Figure 11 shows a chart representing crop yield responses 1100 to nitrogen
fertiliser applied
1105.
CA 02699571 2010-03-12
WO 2009/048341 PCT/NZ2008/000263
28
Nitrogen application rates specified by the system are indicated by the white
symbols (for
example at 1110 and 1115). The data shows that the system consistently
scheduled nitrogen at
the low end of the range. Because the lines are essentially flat with a low
gradient there was no
yield response to applying more additional nitrogen fertiliser than that
scheduled by the system.
Figure 12 shows a sample user interface screen 1200 presented to a user on a
display associated
with the user computing device 135. The interface refers to tubers. It wiIl be
appreciated that
the interface could be used for other crops. It will also be appreciated that
the actual
presentation and implementation of the user interface can vary significantly.
As shown in Figure 12, the system obtains crop details 1205 from the user.
These crop details,
include at least a planting date. Further optional crop details include row
spacing, spacing
between plants, plants per acre and the name of cultivar planted.
The system also obtains from the user soil description data 1210. This soil
description data 1210
is representative of the geographic area of the tuber crop. Soil description
data includes for
example soil type, initial soil water deficit at planting and total mineral
nitrogen in the soil. Soil
description data further includes moisture content at drained upper limit,
wilting point and/or
saturation point. Soil description data further includes available water
holding capacity, 20 percolation co-efficient, mineralization constant,
organic N, denitrification constant, and /or
inorganic N.
The system also obtains weather data that is representative of the geographic
area of the tuber
crop. This weather data is obtained from a weather station as shown at 1215.
This weather. data
includes for example solar radiation, maximum and minimum temperatures and
precipitation.
Weather data could also include wind run and humidity.
Figure 13 shows a preferred form interface 1300 enabling a user to perform
management
scheduling.
. .
Nitrogen scheduling 1305 enables a user to specify the amount of first
nitrogen applicatiori, the
usual amount of nitrogen applied and the timing of the first application. The
user is also able to
specify irrigation options 1310. The user has expressed an intention to
irrigate when the soil
deficit reaches 0.32, to apply .32 inches and to use fertigation to apply
nitrogen. The preferred
CA 02699571 2010-03-12
WO 2009/048341 PCT/NZ2008/000263
29
form interface provides an Options button 1315 to enable the user to specify
irrigation setup
options.
Figure 14 shows a preferred form -user interface that enables a user to
specify irrigation setup
options 1400.
Figure 15 shows a preferred form schedule that is generated and displayed to a
user as shown at
1500. The planting date 1505 is displayed and has been obtained from the user.
An emergence date 1510 is calculated at least partly from the planting date.
The emergence date
wiIl usually depend on the particular tuber or cultivar type and also soil
description data. A
calculated emergence date is also able to be replaced or entered by the user
as an actual date once
emergence of the crop occurs.
The program optionally further calculates tuber growth commencement date,
maximum green
leaf area index date (full cover date), and canopy senescence completion date
(canopy gone date).
The program calculates a plurality of nitrogen deficit values. These deficit
values are calculated at
least partly from the emergence date 1510 and the soil description data. The
nitrogen deficit
values are each associated with respective dates that are each later than the
emergence date.
The program further calculates a plurality of water deficit values at least
partly from the
emergence date and the weather data. The water deficit values are each
associated with
prospective dates that are each later than the emergence date. As shown in
Figure 15, a schedule
1515 is presented to the user. The schedule includes a plurality of
recommended nitrogen
application values, irrigation values and application dates. The schedule is
calculated at least
partly from the nitrogen deficit values and the water deficit values.
- To assist in calculating nitrogen deficit values and water deficit values,
the program calculates the
actual nitrogen and water available to the crop by calculating the crop
rooting depth and the daily
available soil moisture within the root zone and the nitrogen concentration in
the root available
soil moisture.
CA 02699571 2010-03-12
WO 2009/048341 PCT/NZ2008/000263
- 30
If the user has specified that the crop be given maximum nitrogen and
irrigation, then the
nitrogen deficit values will correspond closely with the recommended nitrogen
application values
and the water deficit values will correspond closely with the irrigation
values.
In many cases however, the crop will not be supplied with unlimited nitrogen
and/or water.
There is an associated cost with the application of nitrogen or water. The
additional cost of
supplying nitrogen or irrigation must be weighed against the potential
increase in yield and
resulting increase,of revenue from sale of that yield.
Figur.e 16 shows an example financial management screen 1600 presented to a
user which enables
a user to balance the cost of irrigation and nitrogen against revenue derived
from an increased
yield of the crop.
The program is optionally set to provide a user with various graphs.
Figure 17 shows a graphical display of individual water deficit values.
Figure 18 shows a graphical display of soil mineral nitrogen values.
Figure 19 shows simulation of green leaf area index.
Figure 20 shows crop biomass calculations.
Figure 21 shows soil mineral nitrogen values at various depths.
Figure 22 shows the amount of accumulated nitrogen that is leached and water
drained.
Figure 23 shows simulations of crop nitrogen.
Figure 24 shows simulated root depth.
The foregoing describes the invention including preferred forms thereof.
Modifications and
improvements as would be obvious to those skilled in the art are intended to
be incorporated in
the scope hereof as defmed in the accompanying claims.