Note : Les descriptions sont présentées dans la langue officielle dans laquelle elles ont été soumises.
CA 02699871 2010-04-09
CUSTOMER SATISFACTION ANALYTICS SYSTEM USING
ON-SITE SERVICE QUALITY EVALUATION
TECHNICAL FIELD
This invention provides devices and technology for surveying and assessing
customer
satisfaction data for the purpose of improving the quality of service or
products provided by an
organization.
BACKGROUND
Since 1985, there has been extensive research done on how service quality
affects customer
satisfaction, and how satisfaction in turn affects customer loyalty. The
conclusion is that customer
satisfaction develops when the quality of a service experience exceeds what
customers expect to
receive. Customer satisfaction leads to a greater affinity with the provider,
future intent to repurchase
and the predisposition to recommend the service to others. Service providers
with high rates of
customer satisfaction, retention and referral (known as customer loyalty) are
more successful.
In practice, getting from satisfying customers to increased profitability is
difficult, because
service quality is variable. A satisfying experience one day can easily go
wrong on another: changing
customer expectations and internal breakdowns are common everyday occurrences
in many service
organizations.
Trying to understand what customers expect to receive and what dissatisfies
them about a
service experience can be hard. Customers are reluctant to give constructive
criticism when they are
dissatisfied and more likely to share a negative experience with friends. A
frequently quoted statistic is
that only 5% of customers who have a negative service experience tell the
provider - while the
remaining 95% share negative impressions with 8 or more friends. Negative word
of mouth can have
disastrous consequences. Knowing what satisfies customers and when things are
not operating as they
should is critical.
Large businesses like Starbucks, Disney and Four Seasons Hotels recognize that
customer
loyalty is earned by delivering good and consistent service. To achieve this,
they operate on the
principle that service experiences must be measured to be managed. Continuous
surveying following
customer service transactions has become common practice. Intelligence
gathering has advanced from
paper to the internet; enterprise-wide monitoring systems now generate a
continuous stream of service
metrics. The performance of different locations, services and staff members
are routinely checked to
find service deficiencies, and statistics drive improvement decisions. The
entire process has come to be
known as data or fact-based management.
1
CA 02699871 2010-04-09
PATENT APPLICATION
File 101321-0003
Small businesses like dentists and other professionals, spas and salons do not
typically
manage by fact or customer satisfaction data. Service quality is learned by
trial and error, and
standardized systems, procedures and processes are less prevalent. The result
is that both quality of
service and customer satisfaction are variable. While entrepreneurs recognize
the importance of
listening to the voice of their customers to understand their expectations,
and their proficiency in
meeting them, many are reluctant to ask for feedback.
Frequently these businesses turn to an e-mail customer satisfaction survey for
answers using
do-it-yourself software and templates. However, the response rate is low, and
the surveys are not
designed to identify and fix weaknesses in a service product.
Prior art e-mail or internet based surveys do not generate representative,
reliable and accurate
response. A representative cross-section of customers and/or enough data over
an extended period is
rarely collected. Fluctuations in service quality and customer satisfaction
are never identified. A low 10-
20% survey response is common with e-mail surveys. Surveys that are not
administered immediately
following a service transaction rarely deliver a reliable statistical sample.
Reaction to the physical,
emotional or psychological aspects of the service experience is infrequently
measured - what really
satisfies or dissatisfies a customer is never confirmed.
Furthermore, previous survey systems do not identify a particular service
weakness.
Performance comparisons can only be made if accurate statistics, sufficient
points of comparison and
benchmarks are available. Technical language and complicated scoring often
result in incomplete or
inaccurate data. Answers are not always easy to translate into numbers or
statistics against which
comparisons can be made. Isolating a service deficiency without knowing how
different locations,
services or staff members are performing is impossible. Most organizations
never field more than one
survey at a time. Question standardization and internal and external
benchmarks are rare. Assessing
the severity of a problem without a point of comparison is generally not
possible.
This kind of intelligence gathering is as likely to lead to more questions as
it is to answers. In
some cases, it can result in action being taken on a problem that does not
exist or problems needing
attention being completely overlooked.
Accordingly, there is a need for a small business alternative that can collect
and compile
customer satisfaction data using reliable analytics, revealing possible areas
for improvement of service
quality.
2
CA 02699871 2010-04-09
PATENT APPLICATION
File 101321-0003
SUMMARY OF THE INVENTION
This invention provides service quality monitoring and improvement systems,
apparatus, and
methods. It is designed so that a number of different organizations or service
providers can use the
system simultaneously to obtain satisfaction data from customers and highlight
areas for improvement.
Customer satisfaction data is conducted at the site where the service or
product is provided, to improve
the response rate and data quality. For each user organization, the apparatus
provides focused
questions or information to improve service quality, selected on the basis of
feedback from their own
customers. By using the system and making improvements in the areas
identified, each user
organization may improve the quality of the service it provides - leading to a
wider customer base and
improved profitability.
One embodiment of this invention is an apparatus or system for collecting,
analyzing and
reporting customer satisfaction data with respect to one or more commercial
services provided by
several different organizations that are being assessed by the apparatus
(referred to here as "user
organizations"). It typically comprises most or all of the following
components:
= An input means (such as a device or internet portal) for receiving scaled
scores for
customer loyalty metrics and/or a plurality of service quality metrics.
= A survey database or storage unit set up to store scaled scores from
customers who have
purchased or used the commercial service provided by different user
organizations.
= A first analytical means or device for compiling the aforesaid scores
amongst customers of
each commercial service provided by each user organization.
= A second analytical means or device for identifying potential errors in each
organization or
the way it provides each of its commercial service. The potential errors are
identified using
scores compiled from the organization's survey data by the first analytical
means.
= A solutions database or storage unit comprising questions or further
information that can be
used to address errors leading to suboptimal service quality, customer
retention, or
customer loyalty. The questions or further information may be selected for
each service
surveyed or assessed for each user organization in view of the potential
errors that have
been identified.
The apparatus of this invention will contain or provide one or more written
reports for each user
organization for the services it wishes to evaluate. The reports typically
include the compiled scores, a
report of the potential errors in the service provided, and questions or
further information to assist the
organization in improving or modifying the services they provide. The report
may be in paper form, or
set up for viewing in a computer monitor or over the internet.
3
CA 02699871 2010-04-09
PATENT APPLICATION
File 101321-0003
The apparatus will collect survey data preferably using an input means that
comprises a
dedicated input terminal at the site of each user organization for immediate
input of survey data by
customers at the time of service.
The apparatus may further comprise a database of industry norms, benchmarks or
targets for
service quality to be used in the analysis and/or the written report for each
user organization. The data
being analyzed and compared may include scores obtained from different time
periods, from different
individuals at the organization, or from different divisions or locations in
the organization.
In a prototype model of this invention, the customers are surveyed using about
25 different
metrics. These include the following customer loyalty metrics: customer
reported satisfaction, retention,
and referral. Also included are service quality metrics for appearance
(equipment, facilities, personnel,
and/or materials); reliability (promises, problem solving, precision,
timeliness, and/or accuracy);
responsiveness (full disclosure, promptness, sensitivity, and/or
accessibility); reassurance (trust,
security, courtesy, and/or knowledge); and empathy (personalization,
convenience, attentiveness,
consideration, and/or understanding). Optionally, the service quality metrics
may be modified by user
organizations to deselect certain metrics or add others.
The apparatus of this invention may identify potential errors in each user
organization or the
way it provides the commercial service by comparing the compiled scores with
industry norms, or with
benchmarks or targets set by the organization. It may include customer
comments linked to survey
results of each customer.
Another embodiment of the invention is a method for collecting, analyzing and
reporting
customer satisfaction data using the apparatus already described. This
typically entails receiving scaled
scores for standardized questions answered by customers at a place where said
service is provided;
transmitting the scaled scores from where they are received to a database or
central processing unit;
compiling the scores; identifying potential errors in each user organization
or the way it provides each
commercial service; selecting questions or information to address such errors;
and preparing written
reports.
Another embodiment of the invention is a method for determining industry
norms, comprising:
receiving and transmitting scaled scores as already described; compiling
scores periodically from at
least 10 different customers who have purchased or used commercial services
provided by a plurality of
user organizations segregated according to industry or occupational
classification; storing such scores
and including them in written reports upon request. Another embodiment of the
invention is a method
for evaluating customer satisfaction data with respect to a particular
commercial service provided to
customers by a particular user organization; comprising: collecting customer
satisfaction data; selecting
industry norms according to the industry or occupational classification of the
particular commercial
service; and preparing a written report.
4
CA 02699871 2010-04-09
PATENT APPLICATION
File 101321-0003
A further embodiment of the invention is a method for improving a commercial
service provided
by an organization. This involves evaluating the commercial service as already
stated, and then
addressing any errors in the organization or the way it provides the
commercial service that are
highlighted in the compiled results of the survey.
Other embodiments of the invention will be apparent from the description that
follows.
DRAWINGS
Figure 1 is a flowchart showing system architecture for a working model of
this invention,
designed for access by user organizations under the trademark 121 QA.
Figure 2 is an image of a survey question presented to the customer for
evaluation of service
quality. This example uses a seven-point Likert scale, in which customers
specify their level of
agreement to the statement shown above.
Figure 3 shows a scorecard report, which provides the user (a manager or
consultant for the
organization) with compiled data as bar graphs. The control panel with links
to further data, information,
and functions of the system is shown to the left. Further aspects of the
information displayed are
explained in the boxed text.
Figure 4 shows a panel in which the user may choose different time periods for
analysis and
display, different employees of the organization, and different comparators.
Figure 5 shows a panel in which the user may input or revise the service
quality targets they
wish to achieve.
Figures 6(A) and 6(B) show panels in which the user is directed towards areas
that may need
corrective action. The system then provides links for self-assessment
questions or further information
relating to fact finding, organization, management, and communication that
enable the user to consider
and improve the quality of service provided to future customers.
DETAILED DESCRIPTION
The service quality monitoring and improvement system described in this
disclosure may be
used for collecting, analyzing and reporting customer satisfaction data with
respect to one or more
commercial services provided by several different organizations that are being
assessed by the
apparatus (referred to as subscriber or user organizations). The system
provides a survey, database
and diagnostics instrument all-in-one. It makes it practical for various user
organizations (such as
professionals, partnerships, small businesses and not-for-profit entities) to
do any or all of the following:
5
CA 02699871 2010-04-09
PATENT APPLICATION
File 101321-0003
= Collect customer feedback at the point of transaction on a continuous basis;
= Compare their service experience against industry norms and business
targets;
= Identify areas of weakness and strength in their service product; and,
= Adopt a diagnostic process that leads to continuous service improvement.
The system creates a business database with analytic capabilities comparable
to large
enterprise solutions. It simplifies the collecting and analyzing of customer
service feedback and helps
each user organization translate customer response into service improvement.
It can be used
advantageously by each subscribing organization without previous knowledge of
customer research,
statistics, or survey design.
The invention differs from one-off in-house systems or separately implemented
survey modules
in that it is designed so that different subscriber organizations can use it
simultaneously. Furthermore,
the invention addresses the problems of prior art survey systems by a variety
of new and inventive
features. These include:
= A database-driven scorecard that presents statistical results generated by
the survey, i.e.
mean, mode and range scores. It also offers the functionality of comparative
assessment
against industry norms, business targets set by the subscriber and between
locations,
services and personnel.
= A diagnostics package that identifies service quality weaknesses triggered
by the
comparative dimensions built into the database. Service quality weaknesses are
divided
into four categories. Each category comprises time tested questions that help
the user
precisely define potential errors and develop solutions.
The customer satisfaction survey system of this invention typically includes
the following
components:
1. Input portal
The system or apparatus of this invention has a means whereby the customers of
each user
organization may input the results of the survey questions. Although the
system can be set up to collect
survey data after the consumer has left the office, typical embodiments have a
dedicated terminal at the
site of service delivery of each user organization. This improves response
rate and data quality.
6
CA 02699871 2010-04-09
PATENT APPLICATION
File 101321-0003
2. Survey questionnaire
The service quality monitoring and improvement system of this invention uses
recognized
metrics of customer loyalty and service quality. It is designed to be
administered at the end of any
service transaction in any location. Different locations, services and staff
members can be surveyed for
each user organization on a concurrent basis.
The survey comprises a suitable number of time tested survey questions. A
customer can
typically respond to the survey in about three minutes on any suitable device,
including a web-enabled
device or hand-held smart phone. Each questionnaire may have its own unique
web address with a
GUID link that can be opened by any http browser.
Each organization using the apparatus or system of this invention initializes
each survey link
when they register. This is done by identifying the subject to be surveyed. In
order to do this the user
must register their business and identify their North American Industry
Classification (NAICS code) from
the list provided. The user then selects their Standard Occupational
Classifications (SOC code), and
inputs the name of the business location, service or staff member to be
surveyed. The name and
occupational description appear as the subject heading of the questionnaire.
This process is repeated
for each survey link. Once registration is completed internal identification
codes are generated for the
business, their survey links and their respective NAICS and SOC
classifications.
The subject of a survey link can be changed at any time following registration
by re-initializing
the questionnaire. Additional survey links can also be added and links can be
turned on and off
depending on the desired frequency of survey administration. The date, time
and subject of any change
in survey link disposition are recorded and links remain assigned to the user
as long as they are
registered.
In embodiments of this invention intended for general use, customer loyalty
and service quality
is surveyed using established North American standards or metrics. Typically
this includes at least 15
or 20, and no more than 30 or 40 (ideally about 25) easy-to-understand
questions that explore the
customer's service experience - their impressions and their perceptions of the
quality of the product.
Some of the questions deal with customer loyalty: i.e., customer satisfaction
and their future intent to
repurchase and refer. Other questions explore perceptions of the appearance,
(equipment, facilities,
personnel, and/or materials); reliability (promises, problem solving,
precision, timeliness, and/or
accuracy); responsiveness (full disclosure, promptness, sensitivity, and/or
accessibility); reassurance
(trust, security, courtesy, and/or knowledge); and empathy (personalization,
convenience, attentiveness,
consideration, and/or understanding).
7
CA 02699871 2010-04-09
PATENT APPLICATION
File 101321-0003
3. Survey results database
The service quality monitoring and improvement system of this invention
typically comprises
various databases for storing customer survey data, comments, compilations,
and questions or
information for solving potential errors in a commercial service provided by
an organization. These
databases may be on separate storage units in the apparatus, they may be
electronically structured
storage matrixes on the same storage unit, or a combination of both of these.
This invention typically warehouses survey scores as raw data into the survey
database. The
data are partitioned between different surveys run for the same user
organization and between different
organizations. They are used by the apparatus to compile results and generate
statistics for display on
the scorecard. Survey responses may be transferred in real time to the
database, allowing statistics to
be calculated automatically.
3. Industry norms database
Besides compiling data for the business aspect and customer base selected by
the user
organization to be surveyed, the apparatus may also compile data across the
entirety of the survey
database, or across various industry sectors within the database of particular
interest. By way of
illustration, data for each industry or occupational classification, or each
geographical location can be
compiled separately using survey data from all the surveys conducted for all
organizations meeting the
same criteria. The data can be averaged between organizations, optionally
weighted for the number of
customers responding to the survey questions for each organization.
This establishes normative data for each classification that can then be
stored in the norms
database. Industry norms can then be provided as a benchmark value for the
results of a particular
survey that is called up by a user organization on the respective scorecard.
4. Customer comments database
Optionally, the survey system of this invention can give the user a chance to
input written text
comments, in addition to their answers to the survey questions. The written
comments are stored in the
comments database, and are linked to the answers provided to the survey
questions by the author.
This way, when the user organization logs on to the system to view survey
results on the scorecard,
they can review the written comments in the context of that customer's answers
to each aspect of the
survey. When the survey is conducted at the site where the service is
provided, the customer can be
given the option of providing written comments later. This improves response
rates to the survey as a
whole, and the written feedback portion.
8
CA 02699871 2010-04-09
PATENT APPLICATION
File 101321-0003
5. Scorecard
The service quality monitoring and improvement system of this invention
provides a written
report or scorecard for each service surveyed for each user organization. The
compiled data fore ach
metric may be compared with one or more comparative benchmarks.
Data from the survey database are compiled and statistically analyzed amongst
customers of
each commercial service provided by each user organization. The compiled data
are then used for
identifying potential errors in each organization or the way it provides each
of its commercial service.
This can be done by identifying particularly low scoring metrics, or by
comparing the scores with some
type of benchmark for each metric. These analytical steps may be done by any
suitable means, such
as a programmed or dedicated computational component of the apparatus or
equivalents thereof.
The scorecard can compare results of the survey with other individuals,
divisions, geographical
locations, or time periods that have been surveyed separately. The scorecard
can also compare results
against comparative benchmarks. These can be targets for each question set by
the user, either when
they register, or at a subsequent time. A business target is set by selecting
a rating for each survey
question for the business or business sector that the user has selected for
analysis. Alternatively or in
addition, the scores can be compared with industry norms retrieved from the
norms database for similar
businesses or having the same NAICS classification.
Where the perceived quality of service falls below a business target or
industry norm red
highlights automatically identify areas of weakness on the scorecard.
Highlights can be investigated by
investigating the performance of different locations, services or staff
members over varying periods of
time. Verbatim comments can also be searched for clues to a problem.
6. Solutions database
The apparatus of this invention also comprises an archive of diagnostic
questions or information
to provide focus for improving service quality. Particular diagnostic
questions or information may be
selected by the system in view of potential errors identified for each service
surveyed for each user
organization. Alternatively, the apparatus may be set up so that each metric
reported on the scorecard
is linked to the diagnostic questions or information that are appropriate for
the metric.
Once a service weakness is identified, diagnostic questions appear to help
guide the search for
the root cause and the best fix for the problem. When procedures, processes or
people are changed,
results can be tracked to gauge incremental improvements in the service
product.
In a working prototype of the invention described below, the diagnostic
questions are
standardized and selected based on compiled survey data. Alternatively or in
addition, diagnostics can
be customized so as to be triggered by deficiencies, connected directly to the
problem (and survey
question) and formatted as questions so as to cause the user organization to
enter into a process of
self-examination and root-cause analysis. This type of self-administered smart
system moves surveying
9
CA 02699871 2010-04-09
PATENT APPLICATION
File 101321-0003
from strictly identifying problems to finding second stage remedial solutions
tailored to the needs and
peculiarities of the user organization. In this sense, the invention automates
and bypasses customer
research and business or practice management consulting. Several extensions
are possible:
= The diagnostic questions can be specialized by industry or user
organization;
= They can be changed, increased in number and/or modified as a body of
knowledge
increases; or
= An entirely new set of diagnostic questions can be created for a new survey
on a new topic.
7. Implementation
The system or apparatus of this invention can be set up so that different
organizations can
subscribe and become users independent of operator participation. The
prototype example described
below has an automatic sign-up or subscription portal, through which user
organizations can identify
themselves, select surveys to run, and arrange for payment. User organizations
log back on at a later
time to see the scorecard for each survey.
It has been discovered that by having the survey available for customers to
use at the site
where the service is provided, the user organization typically will not need
to provide incentives to
promote participation. By having just a few customers complete the survey
every day, the organization
will obtain considerably more data than surveys that customers are expected to
respond to after-the-
fact.
Nevertheless, if desired the system and apparatus of this invention can be
implemented in a
way that provides incentives where user organizations consider them desirable.
When a user
organization first subscribes to the system, it can be given the option of
providing each responding
customer with a benefit - for example, a discount coupon for use at the
organization or elsewhere, a
free item, or commitment to make a contribution to a charity. The customer
would receive the benefit
upon completing most or all of the survey questions, for providing written
comments, or both.
The system or apparatus of this invention may be set up to have as a central
processing unit a
computer configured to receive customer data transmitted to it over the
internet or by other reliable
means from the customer-accessible input terminals. The central processing
unit maintains the various
databases needed for information storage. It performs database management,
compilation, analysis,
and report writing functions in accordance with this invention as instructed
by programmed computer
executable software code stored in memory or in a computer-readable medium. In
some embodiments
the central processing unit is a general purpose computer and peripheral
devices specifically
programmed to carry out the steps of the functions described here. In other
embodiments, the central
processing unit is a dedicated or specialized unit set up to optimize the
manner in which this invention is
deployed and utilized. The apparatus as a whole can be considered to include
input terminals remote
CA 02699871 2010-04-09
PATENT APPLICATION
File 101321-0003
from the central processing unit, optionally located at each user
organization's site of service. The
apparatus can also be considered to include interactive report terminals by
which the user organizations
retrieve and consider survey results and analytical questions provided as a
result of the analysis. The
user organizations may then implement changes to their organizations as
indicated or suggested by the
information retrieved from the solutions database, and/or perform follow-up
customer surveys.
Advantages
The customer satisfaction survey apparatus of this invention is superior to
previously available
systems and methodologies - such as surveys implemented by individual service
organizations
according to their own criteria.
= The survey is ready for immediate implementation. Questions can be
standardized to be
suitable for a wide range of service industries. As soon as a user
organization signs on as a
subscriber, the apparatus can immediately be made accessible to accumulate
survey results
and archive them in the survey database
= The survey can be answered by consumers right at the site of delivery. The
customer input
portal can be set up as a dedicated access computer near the reception or
checkout area
the customer passes through on leaving. Questions in the working example can
be
answered in about three minutes, which makes it reasonably convenient for
customers to
complete before they leave the premises. This provides a considerably improved
response
rate and obtains responses from a broader spectrum of incomes and customer
groupings.
= Survey scores and comments are automatically transferred and archived in the
survey
database. Results can be called up and viewed on the user organization's
scorecard in real
time.
= Since the same questions are used by different organizations, the data can
be used to
calculate industry norms. This gives user organizations true insight into how
their service
quality compares with competing organizations, rather than being inferred from
arbitrary
criteria.
= By using a centralized and standardized data collection and analysis unit,
surveys can be
run and compiled by small business organizations in a much more cost efficient
way. The
working example shown below can be run at a profit by charging user
organizations $80 per
month for 3 unlimited surveys. Compare this with standard customer surveys,
which
typically cost $500 to $5,000 per survey wave, plus $5 to $50 per tabulated
response.
11
CA 02699871 2010-04-09
PATENT APPLICATION
File 101321-0003
EXAMPLE
By way of illustration, a working prototype of this invention has been
created, for access by user
organizations under the trademark 121QA. The working prototype uses 2.0 web
components and
recognized standards. Organizations may subscribe to the system through the
internet. Once
registration is complete, the organization may access the various databases
and begin surveying their
customers. The quality assessment ensues from scoring the 25 metrics referred
to earlier.
Figure 1 shows the overall architecture of the 121QATM system. User
organizations gain
access over the internet by way of the procedure shown on the left. The
organization is registered as a
user, and selects surveys it wishes to have run (the industry as a whole,
industry subdivisions, different
service providers, and so on). Payment is a monthly $10.00 fee for each survey
currently under way,
plus a single $49.99 system access fee, which sets up a survey database
partition and reporting
protocol (collectively referred to as the survey engine). Payment consists of
a monthly $49.99 system
access fee, which sets up a survey database partition and reporting protocol
(collectively referred to as
the survey engine), plus $10.00 for each survey underway. Upon payment (for
example, through a
credit card charging system such as BeanstreamTM), the system provides the
user with survey links.
These links are used to set up an input terminal at the site of each user
organization for immediate input
of survey data by customers at the time of service.
Consumers of the service are given an opportunity to respond to the survey at
the place of
business. All customers can be given access, or someone at the organization
(such as the service
provider or receptionist) may elect particular customers to take the survey so
as to obtain data from
customers fitting a particular profile. The data is then stored on the survey
database and compiled.
When a user organization next goes to the system's URL on the left, they log
in using their password
and have access to survey reports and diagnostics.
Figure 2 shows how customers are surveyed through an input portal. The
customers score
each question on a 7 point Likert scale. Questions are answered in sequence to
progress by clicking
the appropriate radio button. The system can be set up so that answers can not
be changed and
comments are left on the system when all questions are scored.
There are 25 questions: 3 measures of Customer Loyalty - satisfaction,
repurchase and
referral, and 22 perceptual measures of service quality, based on the American
Standard
SERVQUAL/SERVPERF. For SERVQUAL see Zeithaml, Parasuraman & Berry, "Delivering
Quality
Service; Balancing Customer Perceptions and Expectations," Free Press, 1990;
and Nyeck, S.,
Morales, M., Ladhari, R., & Pons, F. (2002). "10 years of service quality
measurement: reviewing the
use of the SERVQUAL instrument." Cuadernos de Difusion, 7(13), 101-107. For
SERVPERF see
Fogarty, G., Catts, R., & Forlin, C. (2000). Identifying shortcomings in the
measurement of service
quality. Journal of Outcome Measurement, 4(1), 425-447.
12
CA 02699871 2010-04-09
PATENT APPLICATION
File 101321-0003
If a customer wishes to provide more detailed written comments, the system
provides a secure
link is sent to the e-mail address they specify. They input their comments by
way of the link from their
home computer. Once comments are posted, the link is disabled.
Figure 3 shows a sample scorecard report obtained from 121 QATM. When problems
exist,
areas of concern light up, and investigations can be made by clicking through
the link. The scorecard
serves two functions: it displays all survey gathered intelligence, and it
simplifies the process of
investigating remedies.
On the right side are a series of bar charts. This is where survey scores are
graphed, statistics
are displayed and benchmarks are flagged. Charts exist for each survey
question and are organized
into six groupings. The first group across the top includes the 3 measures of
service quality. Below the
22 measures of service quality appear organized into the 5 dimensions -
appearance, reliability,
responsiveness, reassurance and empathy.
Figure 4 shows a detail of the navigation control panel on the left of the
screen. There are
three viewing options: time period (sets a date range), view (selects the
survey subject) and benchmark
(targets or norms). Setting a date range determines the absolute number of
surveys contained in a
statistical sample. The start and end dates identify the surveys to be
included and the auto default is
the last 7 days. Extending this time period increases the number of surveys in
the analysis. Once
submitted the database automatically calculates mean, mode and range values
and graphs the survey
scores.
Changing the view setting shrinks the scope of analysis or number of surveys
in the statistical
sample. The auto default is "All Surveys". This can be changed by the user to
view each survey subject
and gauge differences in performance across locations, services or staff
members. When the survey
view is submitted new scores and statistics are automatically calculated and
graphed.
Selecting a benchmark automatically sets the point of comparison against which
the survey
sample is measured. In the case of the industry norm the comparison is all
surveys versus the NAICS
or industry. In the case of individual surveys these are compared against the
business target. Business
targets are set or reset as shown in Figure 5.
Comparisons serve to isolate areas of deficiency. When the survey sample
statistics are equal
to or less than the benchmark effected questions or dimensions of service
quality are highlighted in red.
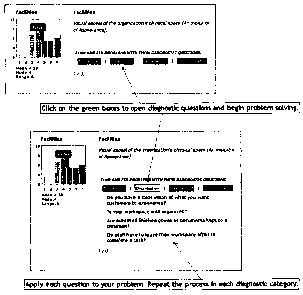
The red highlights indicate areas that need further investigation (Figure
6(A)) and the four remedial
categories (fact finding, organization, management and communication)
automatically appear in green
(Figure 6(B)). To view the diagnostics questions the user simply clicks on the
category of interest.
Users can also access customer comments for clues to a problem. Comments can
be viewed
by changing from the scorecard to the comments report. Comments for the
specified date range are
displayed in date order. To view a survey, to put the comments in context, the
user clicks the date
stamp.
121QATM uses the following 2.0 web components and recognized standards.
13
CA 02699871 2010-04-09
PATENT APPLICATION
File 101321-0003
= File transfer protocol: Hypertext Transfer Protocol (HTTP)
= Secure file transfer protocol: Hypertext Transfer Protocol (HTTPS) utilizing
CURL
= Web server software: Apache Enterprise Server (Apache)
= Scripting language: PHP5: Hypertext Preprocessor (PHP)
= Relational database management system: Open Source MySQL (MYSQL)
= Security: Secure Socket Linkage 128 bit (SSL)
= PHP encryption: MD5
= Optimized browsers: Internet Explorer, Mozilla Firefox and Safari
= Measures of service quality: SERVQUAL (1988), SERVPERF (1994)
In alternative or extended embodiments of the invention, user organizations
may be given the
option to tailor or customize the survey to remove one or more of the standard
metrics, and/or add one
or more additional questions or metrics especially chosen because of the
nature of the particular service
that is provided, or the business objectives of management. By way of
illustration, the survey questions
can be designed to assess employee satisfaction or satisfaction with a
consumer product rather than a
service. Automatic problem-specific direction could be given when deficiencies
are triggered by
statistical comparisons. The statistics could compare one set of survey
questions against another or
using the same survey to take pre and post measurements. In both cases gap
variances would replace
variances from a standard measure. The form and method of providing diagnostic
prompts could be
upgraded, highly specialized and/or framed as answers rather than questions.
The various examples and illustrations referred to in this disclosure are
provided for the benefit
of the reader, and are not intended to limit the implementation or practice of
the invention except where
explicitly referred to in the claims that follow. The devices and methods of
this invention can be
effectively refined or modified by routine optimization without departing from
the spirit of the invention
embodied in the claims.
14