Note : Les descriptions sont présentées dans la langue officielle dans laquelle elles ont été soumises.
CA 02714367 2010-07-29
WO 2009/100491 PCT/AU2009/000163
-1-
ANALYSING IMPEDANCE MEASUREMENTS
Background of the Invention
The present invention relates to a method and apparatus for use in analysing
impedance
measurements, and in particular, to a method and apparatus for determining an
indicator
indicative of extracellular fluid levels using impedance measurements, the
indicator being
usable in identifying venous insufficiency, lymphoedema and/or oedema.
Description of the Prior Art
The reference in this specification to any prior publication (or information
derived from it),
or to any matter which is known, is not, and should not be taken as an
acknowledgment or
admission or any form of suggestion that the prior publication (or information
derived from
it) or known matter forms part of the common general knowledge in the field of
endeavour to
which this specification relates.
Venous insufficiency is a condition characterized by an inability for veins to
adequately
return blood to the heart. Normally, when a subject is in a standing position,
the blood in the
subject's leg veins is urged back towards the heart against gravity by a
combination of
mechanisms, such as muscular squeezing of the leg veins, and through the
action of one-way
valves in the veins. However, conditions can arise such as increased pressure
within the
veins, deep vein thrombosis (DVT), phlebitis, or the like, which lead to blood
pooling in the
legs.
Chronic venous disease (CVD) is common with a 3-7% prevalence, resulting in an
economic
cost US$1 billion per annum.
Typical detection methods for venous insufficiency involve examining for
physical
symptoms such as swelling in the leg or ankle, tightness in the calves, leg
tiredness, pain
while walking, or the like. Venous insufficiency may also be associated with
varicose veins.
Other techniques for assessing venous insufficiency include measuring the
ambulatory
venous pressure, which is achieved by inserting a needle into the vein on the
dorsum of the
CA 02714367 2010-07-29
WO 2009/100491 PCT/AU2009/000163
-2-
foot. Whilst this is regarded as the gold standard of haemodynamic
investigation, this is
invasive, and it is therefore desirable to find alternative non-invasive
techniques. Two such
methods are air plethysmography (APG) and strain gauge plethysmography (SPG).
SPG involves placing mercury strain gauges in a silastic band around the calf
muscle which
are calibrated to read percentage leg volume changes, as described for example
in Nicolaides
AN (2000) "Investigation of Chronic Venous Insufficiency: A Consensus
Statement"
Circulation 102:126-163. These measurements are typically performed during
exercise
regimens to allow venous refilling time and the ejection volume to be
assessed. APG uses an
air bladder which surrounds the leg from the knee to the ankle. The bladder is
inflated to a
known pressure, with volume changes in the calf muscle being determined based
on changes
in pressure on the bladder during a sequence of postural changes.
However, these techniques are only of limited accuracy, and can require
extensive calibration
and exercise, to allow useable measurement to be obtained.
Lymphoedema is a condition characterised by excess protein and oedema in the
tissues as a
result of reduced lymphatic transport capacity and/or reduced tissue
proteolytic capacity in
the presence of a normal lymphatic load. Acquired, or secondary lymphoedema,
is caused by
damaged or blocked lymphatic vessels. The commonest inciting events are
surgery and/or
radiotherapy. However, onset of lymphoedema is unpredictable and may develop
within days
of its cause or at any time during a period of many years after that cause.
One existing technique for determining biological parameters relating to a
subject, such as
fluid levels, involves the use of bioelectrical impedance. This involves
measuring the
electrical impedance of a subject's body using a series of electrodes placed
on the skin
surface. Changes in electrical impedance at the body's surface are used to
determine
parameters, such as changes in fluid levels, associated with the cardiac cycle
or oedema.
US2006/0111652 describes methods for enhancing blood and lymph flow in the
extremities
of a human. As part of this method, impedance measurements are used to assess
segmental
blood flows within the limbs.
CA 02714367 2010-07-29
WO 2009/100491 PCT/AU2009/000163
-3-
US2005/0177062 describes a system for measuring the volume, composition and
the
movement of electroconductive body fluids, based on the electrical impedance
of the body or
a body segment. This is used primarily for electromechanocardiography (ELMEC)
or
impedance cardiography (IKG) measurements for determining hemodynamic
parameters.
W000/79255 describes a method of detection of oedema by measuring
bioelectrical
impedance at two different anatomical regions in the same subject at a single
low frequency
alternating current. The two measurements are analysed to obtain an indication
of the
presence of tissue oedema by comparing with data obtained from a normal
population.
Summary of the Present Invention
The present invention seeks to ameliorate one or more problems of the problems
associated
with the prior art.
In a first broad form the present invention seeks to provide a method for use
in analysing
impedance measurements performed on a subject, the method including, in a
processing
system:
a) determining at least one impedance value indicative of the impedance of at
least one
leg segment of the subject;
b) determining an indicator using the at least one impedance value, the
indicator being
indicative of extracellular fluid levels in the at least leg segment and being
used in the
assessment of venous insufficiency.
Typically the method includes, in a processing system:
a) comparing the indicator to a reference; and,
b) providing an indication of the results of the comparison to allow
determination of a
presence, absence or degree of venous insufficiency.
Typically the method includes, in a processing system:
a) determining a first indicator value with the subject in a first
orientation;
b) determining a second indicator value with the subject in a second
orientation; and,
CA 02714367 2010-07-29
WO 2009/100491 PCT/AU2009/000163
-4-
c) determining an indicator change based on a difference between the first and
second
fluid indicator values, the indicator change being used in the assessment of
venous
insufficiency.
Typically the method includes, in the processing system:
a) comparing the indicator change to a reference; and,
b) providing an indication of the results of the comparison to allow
determination of a
presence, absence or degree of venous insufficiency.
Typically the method includes, in a processing system, determining an index
using the at
least one impedance value, the index being indicative of a ratio of
extracellular to
intracellular fluid levels in the at least leg segment, the index being used
in the assessment of
venous insufficiency.
Typically the method includes, in the processing system:
a) comparing the index to a reference; and,
b) providing an indication of the results of the comparison to allow
determination of a
presence, absence or degree of venous insufficiency.
Typically the method includes, diagnosing the presence of venous insufficiency
if:
a) an indicator is less than first reference; and,
b) an index is greater than a second reference.
Typically the method includes, in a processing system:
a) determining a first index value with the subject in a first orientation;
b) determining a second index value with the subject in a second orientation;
and,
c) determining an index change based on a difference between the first and
second fluid
index values, the index change being used in the assessment of venous
insufficiency.
Typically the method includes, in the processing system:
a) determining a first indicator value with the subject in a first
orientation;
b) after positioning the subject in a second orientation for a predetermined
time period,
determining a second indicator value with the subject in the first
orientation; and,
CA 02714367 2010-07-29
WO 2009/100491 PCT/AU2009/000163
-5-
c) determining a difference between the first and second fluid indicator
values, the
difference being used in the assessment of venous insufficiency.
Typically the method includes, in the processing system:
a) monitoring the difference;
b) determining the time taken for the difference fall below a reference; and,
c) providing an indication of the time taken to allow determination of a
presence,
absence or degree of venous insufficiency.
Typically the method includes, in a processing system:
a) determining a pre-treatment indicator value prior to treatment of the
subject;
b) determining a post-treatment indicator value following treatment of the
subject for
venous insufficiency; and,
c) determining an indicator change based on a difference between the pre-
treatment and
post-treatment indicator values, the indicator change being used in the
assessment of
venous insufficiency.
Typically the method includes, diagnosing the presence of venous insufficiency
if the
indicator change is greater than a reference.
Typically the reference includes using a reference that is at least one of:
a) an indicator or index determined for another limb of the subject;
b) a reference determined from a sample population; and,
c) a previous indicator or index determined for the subject.
Typically the method includes, in the processing system, displaying at least
one of:
a) an indicator;
b) an index ratio;
c) an index;
d) an indicator change;
e) an index change;
f) one or more impedance parameter values; and,
g) results of a comparison.
CA 02714367 2010-07-29
WO 2009/100491 PCT/AU2009/000163
-6-
Typically the first impedance is measured at a measurement frequency of at
least one of:
a) less than 100 kHz;
b) less than 50 kHz; and,
c) less than 10 kHz.
Typically the method includes, in the processing system, using the at least
one impedance
measurement as an estimate of a resistance of the subject at a zero
measurement frequency.
Typically the method includes measuring at least one second impedance value,
the at least
one second impedance value being measured at a measurement frequency of at
least one of:
a) greater than 200 kHz;
b) greater than 500 kHz; and,
c) greater than 1000 kHz.
Typically the method includes, in the processing system, using the at least
one second
impedance measurement as an estimate of a resistance of the subject at an
infinite
measurement frequency.
Typically the method includes, in the processing system:
a) determining a plurality of impedance values; and,
b) determining at least one impedance parameter value from the plurality of
impedance
values.
Typically the impedance parameter values include at least one of:
Ro which is the resistance at zero frequency;
R. which is the resistance at infinite frequency; and,
ZZ which is the resistance at a characteristic frequency.
Typically the method includes, in the processing system:
a) determining values for impedance parameters R0 and R., from the measured
impedance values; and,
b) calculating the index (1) using the equation:
CA 02714367 2010-07-29
WO 2009/100491 PCT/AU2009/000163
-7-
I R.
Ro - R.
Typically the method includes, in the processing system, determining the
parameter values
using the equation:
Ro-R.
Z = R~+
l+(jwr)(1- )
where:
Z is the measured impedance at angular frequency co,
't is a time constant, and
a has a value between 0 and 1.
Typically the method includes, in the computer system, causing the impedance
measurements
to be performed.
Typically the method includes, in the computer system:
a) causing one or more electrical signals to be applied to the subject using a
first set of
electrodes;
b) measuring electrical signals across a second set of electrodes applied to
the subject in
response to the applied one or more signals; and,
c) determining from the applied signals and the measured signals at least one
measured
impedance value.
In a second broad form the present invention seeks to provide apparatus for
use in analysing
impedance measurements performed on a subject, the apparatus including -a
processing
system for:
a) determining at least one impedance value, indicative of the impedance of at
least leg
segment of the subject;
b) determining an indicator using the at least one impedance value, the
indicator being
indicative of extracellular fluid levels in the at least leg segment and being
used in the
assessment of venous insufficiency.
Typically the apparatus includes a processing system for:
CA 02714367 2010-07-29
WO 2009/100491 PCT/AU2009/000163
-8-
a) causing one or more electrical signals to be applied to the subject using a
first set of
electrodes;
b) measuring electrical signals across a second set of electrodes applied to
the subject in
response to the applied one or more signals; and,
c) determining from the applied signals and the measured signals at least one
measured
impedance value.
Typically the apparatus includes:
a) a signal generator for generating electrical signals; and,
b) a sensor for sensing electrical signals.
In a third broad form the present invention seeks to provide a method for use
in assessing the
presence, absence or degree of venous insufficiency, the method including, in
a processing
system:
a) determining at least one impedance value, indicative of the impedance of at
least leg
segment of the subject; and,
b) determining an indicator using the at least one impedance value, the
indicator being
indicative of extracellular fluid levels in the at least leg segment and being
used in the
assessment of venous insufficiency.
In a fourth broad form the present invention seeks to provide a method for use
in analysing
impedance measurements performed on a subject, the method including, in a
processing
system:
a) determining at least one impedance value indicative of the impedance of at
least one
body segment of the subject;
b) determining an indicator using at least one impedance value, the indicator
being
indicative of extracellular fluid levels in the at least one body segment;
c) determining an index using at least one impedance value, the index being
indicative
of a ratio of extracellular to intracellular fluid levels in the at least one
body segment;
d) comparing the indicator to a first reference;
e) comparing the index to a second reference; and,
f) providing an indication of the results of the comparisons.
CA 02714367 2010-07-29
WO 2009/100491 PCT/AU2009/000163
-9-
Typically the method includes, in the processing system, determining the
indicator using an
impedance measurement performed at a single low frequency.
Typically the at least one impedance measurement is measured at a measurement
frequency
of at least one of-
a) less than 100 kHz;
b) less than 50 kHz; and,
c) less than l0 kHz.
Typically the method includes, in the processing system, using the at least
one impedance
measurement as an estimate of a resistance of the subject at a zero
measurement frequency.
Typically the method includes measuring at least one second impedance value,
the at least
one second impedance value being measured at a measurement frequency of at
least one of:
a) greater than 200 kHz;
b) greater than 500 kHz; and,
c) greater than 1000 kHz.
Typically the method includes, in the processing system, using the at least
one second
impedance measurement as an estimate of a resistance of the subject at an
infinite
measurement frequency.
Typically the method includes, in the processing system:
a) determining a plurality of impedance values; and,
b) determining at least one impedance parameter value from the plurality of
impedance
values.
Typically the method includes, in the processing system:
a) at each of three frequencies, determining first and second parameter values
for first
and second impedance parameters relating to the impedance of at least one body
segment of the subject;
b) solving simultaneous equations representing a circle defined with respect
to the first
and second impedance parameters to thereby determine circle parameter values,
the
CA 02714367 2010-07-29
WO 2009/100491 PCT/AU2009/000163
-10-
equations being solved using the first and second parameter values at each of
the three
frequencies;
c) using the circle parameter values to determine a third impedance parameter
value at a
respective frequency; and,
d) using the third impedance parameter value to determine an indicator
indicative of
relative fluid levels within the body segment of the subject.
Typically the first and second parameter values are resistance and reactance
values.
Typically the impedance parameter values include at least one of:
(1) Ro which is the resistance at zero frequency;
(2) R,,,, which is the resistance at infinite frequency; and,
(3) ZZ which is the resistance at a characteristic frequency.
Typically the method includes, in the processing system:
a) determining values for impedance parameters R0 and R., from the measured
impedance values; and,
b) calculating the index (1) using the equation:
R.
R0 - R.
Typically the method includes, in the processing system, determining the
parameter values
using the equation:
(1) Z Ro - Rc
=R~+
1+(jwr) 1- )
(a) where:
1. Z is the measured impedance at angular frequency co,
2. ti is a time constant, and
3. a has a value between 0 and 1.
In a fifth broad form the present invention seeks to provide apparatus for use
in analysing
impedance measurements performed on a subject, the apparatus including a
processing
system for:
CA 02714367 2010-07-29
WO 2009/100491 PCT/AU2009/000163
-11-
a) determining at least one impedance value indicative of the impedance of at
least one
body segment of the subject;
b) determining an indicator using at least one impedance value, the indicator
being
indicative of extracellular fluid levels in the at least one body segment;
c) determining an index using at least one impedance value, the index being
indicative
of a ratio of extracellular to intracellular fluid levels in the at least one
body segment;
d) comparing the indicator to a first reference;
e) comparing the index to a second reference; and,
f) providing an indication of the results of the comparisons.
Typically the processing system is for:
a) causing one or more electrical signals to be applied to the subject using a
first set of
electrodes;
b) measuring electrical signals across a second set of electrodes applied to
the subject in
response to the applied one or more signals; and,
c) determining from the applied signals and the measured signals at least one
measured
impedance value.
Typically the apparatus includes:
a) a signal generator for generating electrical signals; and,
b) a sensor for sensing electrical signals.
In a sixth broad form the present invention seeks to provide a method for use
in
distinguishing the presence of oedema and lymphoedema in a subject, the method
including,
in a processing system:
a) determining at least one impedance value indicative of the impedance of at
least one
body segment of the subject;
b) determining an indicator using at least one impedance value, the indicator
being
indicative of extracellular fluid levels in the at least one body segment;
c) determining an index using at least one impedance value, the index being
indicative
of a ratio of extracellular to intracellular fluid levels in the at least one
body segment;
d) comparing the indicator to a first reference;
e) comparing the index to a second reference; and,
CA 02714367 2010-07-29
WO 2009/100491 PCT/AU2009/000163
-12-
f) providing an indication of the results of the comparisons, the results
being used to
distinguish oedema and lymphoedema.
It will be appreciated that the broad forms of the invention may be used
individually or in
combination, and may be used for assessing venous insufficiency as well as
diagnosing the
presence, absence or degree of a range of conditions in addition to and
including oedema,
lymphodema, body composition, or the like.
Brief Description of the Drawings
An example of the present invention will now be described with reference to
the
accompanying drawings, in which: -
Figure 1 is a schematic diagram of a first example of impedance measuring
apparatus;
Figure 2 is a flowchart of an example of a process for use in analysing
impedance
measurements;
Figure 3 is a schematic diagram of a second example of impedance measuring
apparatus;
Figure 4 is a schematic diagram of an example of a computer system;
Figure 5 is a flowchart of an example of a process for performing impedance
measurements;
Figure 6A is a schematic of an example of a theoretical equivalent circuit for
biological
tissue;
Figure 6B is an example of a locus of impedance known as a Wessel plot;
Figure 7 is a flowchart of a first specific example of a process for analysing
impedance
measurements to allow assessment of venous insufficiency;
Figure 8 is a flowchart of a second specific example of a process for
analysing impedance
measurements to allow assessment of venous insufficiency;
Figure 9 is a flowchart of a third specific example of a process for analysing
impedance
measurements to allow assessment of venous insufficiency;
Figure 10 is a flowchart of a fourth specific example of a process for
analysing impedance
measurements to allow assessment of venous insufficiency; and,
Figure 11 is a flowchart of a fifth specific example of a process for
analysing impedance
measurements to allow assessment of venous insufficiency.
CA 02714367 2010-07-29
WO 2009/100491 PCT/AU2009/000163
-13-
Detailed Description of the Drawings
An example of apparatus suitable for performing an analysis of a subject's
bioelectric
impedance will now be described with reference to Figure 1.
As shown the apparatus includes a measuring device 100 including a processing
system 102,
connected to one or more signal generators 117A, 117B, via respective first
leads 123A,
123B, and to one or more sensors 118A, 118B, via respective second leads 125A,
125B. The
connection may be via a switching device, such as a multiplexer, although this
is not
essential.
In use, the signal generators 117A, 117B are coupled to two first electrodes
113A, 113B,
which therefore act as drive electrodes to allow signals to be applied to the
subject S, whilst
the one or more sensors 118A, 118B are coupled to the second electrodes 115A,
115B, which
therefore act as sense electrodes, to allow signals induced across the subject
S to be sensed.
The signal generators 117A, 117B and the sensors 118A, 118B may be provided at
any
position between the processing system 102 and the electrodes 113A, 113B,
115A, 115B, and
may therefore be integrated into the measuring device 100.
However, in one example, the signal generators 11 7A, 11 7B and the sensors 11
8A, 11 8B are
integrated into an electrode system, or another unit provided near the subject
S, with the leads
123A, 123B, 125A, 125B connecting the signal generators 117A, 117B and the
sensors
118A, 118B to the processing system 102. By performing this, the length of any
connections
between the signal generators 117A, 117B and the sensors 118A, 118B, and the
corresponding electrodes 113A, 113B, 115A, 115B can be reduced. This minimises
any
parasitic capacitances between the connections, the connections and the
subject, and the
connections and any surrounding articles, such as a bed on which the subject
is provided,
thereby reducing measurement errors.
The above described system can be described as a two channel device, with each
channel
being designated by the suffixes A, B respectively. The use of a two channel
device is for the
purpose of example only, and any number of channels may be provided, as
required.
CA 02714367 2010-07-29
WO 2009/100491 PCT/AU2009/000163
-14-
An optional external interface 103 can be used to couple the measuring device
100, via
wired, wireless or network connections, to one or more peripheral devices 104,
such as an
external database or computer system, barcode scanner, or the like. The
processing system
102 will also typically include an I/O device 105, which may be of any
suitable form such as
a touch screen, a keypad and display, or the like.
In use, the processing system 102 is adapted to generate control signals,
which cause the
signal generators 117A, 117B to generate one or more alternating signals, such
as voltage or
current signals of an appropriate waveform, which can be applied to a subject
S, via the first
electrodes 113A, 113B. The sensors 118A, 118B then determine the voltage
across or
current through the subject S, using the second electrodes 115A, 115B and
transfer
appropriate signals to the processing system 102.
Accordingly, it will be appreciated that the processing system 102 may be any
form of
processing system which is suitable for generating appropriate control signals
and at least
partially interpreting the measured signals to thereby determine the subject's
bioelectrical
impedance, and optionally determine other information such indicators of the
presence,
absence or degree of venous insufficiency, other conditions, or the like.
The processing system 102 may therefore be a suitably programmed computer
system, such
as a laptop, desktop, PISA, smart phone or the like. Alternatively the
processing system 102
may be formed from specialised hardware, such as an FPGA (field programmable
gate
array), or a combination of a programmed computer system and specialised
hardware, or the
like, as will be described in more detail below.
In use, the first electrodes 113A, 113B are positioned on the subject to allow
one or more
signals to be injected into the subject S. The location of the first
electrodes will depend on
the segment of the subject S under study. Thus, for example, the first
electrodes 113A, 113B
can be placed on the thoracic and neck region of the subject S to allow the
impedance of the
chest cavity to be determined for use in cardiac function analysis.
Alternatively, positioning
electrodes on the wrist and ankles of a subject allows the impedance of limbs
and/or the
entire body to be determined, for use in oedema analysis, assessment of venous
insufficiency,
or the like.
CA 02714367 2010-07-29
WO 2009/100491 PCT/AU2009/000163
-15-
Once the electrodes are positioned, one or more alternating signals are
applied to the subject
S, via the first electrodes 113A, 113B. The nature of the alternating signal
will vary
depending on the nature of the measuring device and the subsequent analysis
being
performed.
For example, the system can use Bioimpedance Analysis (BIA) in which a single
low
frequency signal is injected into the subject S, with the measured impedance
being used
directly in the determination of biological parameters, such as extracellular
fluid levels,
which can be indicative of oedema, and hence of venous insufficiency.
In one example, the applied signal has a relatively low frequency, such as
below 100 kHz,
more typically below 50 kHz and more preferably below 10 kHz. In this
instance, such low
frequency signals can be used as an estimate of the impedance at zero applied
frequency,
commonly referred to as the impedance parameter value R0, which is in turn
indicative of
extracellular fluid levels.
Alternatively, the applied signal can have a relatively high frequency, such
as above 200
kHz, and more typically above 500 kHz, or 1000 kHz. In this instance, such
high frequency
signals can be used as an estimate of the impedance at infinite applied
frequency, commonly
referred to as the impedance parameter value R., which is in turn indicative
of a combination
of the extracellular and intracellular fluid levels, as will be described in
more detail below.
In contrast Bioimpedance Spectroscopy (BIS) devices perform impedance
measurements at
multiple frequencies over a selected frequency range. Whilst any range of
frequencies may
be used, typically frequencies range from very low frequencies (4 kHz) to
higher frequencies
(15000 kHz). Similarly, whilst any number of measurements may be made, in one
example
the system can use 256 or more different frequencies within this range, to
allow multiple
impedance measurements to be made within this range.
When impedance measurements are made at multiple frequencies, these can be
used to derive
one or more impedance parameter values, such as values of Ro, Z, Rte, which
correspond to
the impedance at zero, characteristic and infinite frequencies. These can in
turn be used to
CA 02714367 2010-07-29
WO 2009/100491 PCT/AU2009/000163
-16-
determine information regarding both intracellular and extracellular fluid
levels, as will be
described in more detail below.
A further alternative is for the system to use Multiple Frequency Bioimpedance
Analysis
(MFBIA) in which multiple signals, each having a respective frequency are
injected into the
subject S, with the measured impedances being used in the assessment of fluid
levels. In one
example, four frequencies can be used, with the resulting impedance
measurements at each
frequency being used to derive impedance parameter values, for example by
fitting the
measured impedance values to a Cole model, as will be described in more detail
below.
Alternatively, the impedance measurements at each frequency may be used
individually or in
combination.
Thus, the measuring device 100 may either apply an alternating signal at a
single frequency,
at a plurality of frequencies simultaneously, or a number of alternating
signals at different
frequencies sequentially, depending on the preferred implementation. The
frequency or
frequency range of the applied signals may also depend on the analysis being
performed.
In one example, the applied signal is generated by a voltage generator, which
applies an
alternating voltage to the subject S, although alternatively current signals
may be applied.
In one example, the voltage source is typically symmetrically and/or
differentially arranged,
with each of the signal generators 117A, 117B being independently
controllable, to allow the
potential across the subject to be varied. This can be performed to reduce the
effects of any
imbalance, which occurs when the voltages sensed at the electrodes are
unsymmetrical (a
situation referred to as an "imbalance"). In this instance, any difference in
the magnitude of
signals within the leads can lead to differing effects due to noise and
interference.
Whilst applying the voltage symmetrically, can reduce the effect, this is not
always effective
if the electrode impedances for the two drive electrodes 113A, 113B are
unmatched, which is
typical in a practical environment. However, by adjusting the differential
drive voltages
applied to each of the drive electrodes 113A, 113B, this compensates for the
different
electrode impedances, and restores the desired symmetry of the voltage at the
sense
electrodes 115A, 115B. This can be achieved by measuring the voltages at the
sense
CA 02714367 2010-07-29
WO 2009/100491 PCT/AU2009/000163
-17-
electrodes, and then adjusting the magnitude and/or phase of the applied
signal to thereby
balance the magnitude of the sensed voltages. This process is referred to
herein as balancing
and in one example is performed by minimizing the magnitude of any common mode
signal.
A potential difference and/or current is measured between the second
electrodes 115A, 11 5B.
In one example, the voltage is measured differentially, meaning that each
sensor 11 8A, 118B
is used to measure the potential at each second electrode 11 5A, 11 5B and
therefore need only
measure half of the potential as compared to a single ended system.
The acquired signal and the measured signal will be a superposition of
potentials generated
by the human body, such as the ECG (electrocardiogram), potentials generated
by the applied
signal, and other signals caused by environmental electromagnetic
interference.
Accordingly, filtering or other suitable analysis may be employed to remove
unwanted
components.
The acquired signal is typically demodulated to obtain the impedance of the
system at the
applied frequencies. One suitable method for demodulation of superposed
frequencies is to
use a Fast Fourier Transform (FFT) algorithm to transform the time domain data
to the
frequency domain. This is typically used when the applied current signal is a
superposition
of applied frequencies. Another technique not requiring windowing of the
measured signal is
a sliding window FFT.
In the event that the applied current signals are formed from a sweep of
different frequencies,
then it is more typical to use a signal processing technique such as
correlating the signal.
This can be achieved by multiplying the measured signal with a reference sine
wave and
cosine wave derived from the signal generator, or with measured sine and
cosine waves, and
integrating over a whole number of cycles. This process, known variously as
quadrature
demodulation or synchronous detection, rejects all uncorrelated or
asynchronous signals and
significantly reduces random noise.
Other suitable digital and analogue demodulation techniques will be known to
persons skilled
in the field.
CA 02714367 2010-07-29
WO 2009/100491 PCT/AU2009/000163
- 18-
In the case of BIS, impedance or admittance measurements can be determined
from the
signals at each frequency using the recorded voltage across and current flow
through the
subject. The demodulation algorithm can then produce an amplitude and phase
signal at each
frequency. This can then be used to derive one or more impedance parameter
values, if
required.
As part of the above described process, the position of the second electrodes
may be
measured and recorded. Similarly, other parameters relating to the subject
(subject
parameters) may be recorded, such as the height, weight, age, sex, health
status, any
interventions and the date and time on which they occurred. Other information,
such as
current medication, may also be recorded. This can then be used in performing
further
analysis of the impedance measurements, so as to allow determination of the
presence,
absence or degree of venous insufficiency and/or oedema, to assess body
composition, or the
like.
An example of the process of analysing impedance measurements operation of the
apparatus
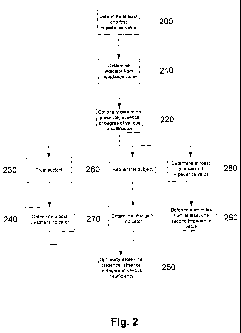
of Figure 1 to perform this will now be described with reference to Figure 2.
At step 200, at least one first impedance value indicative of the impedance of
at least one
segment of the subject's leg is determined. This may be achieved by having the
signal
generators 117A, 117B, apply at least one first signal to the subject S, via
the first electrodes
113A, 113B, with voltage signals being measured across the subject S by the
sensors 118A,
11 8B, via the second electrodes 11 5A, 11 5B. An indication of the current
flow through and
voltage across the subject is provided to the processing system 102, allowing
the impedance,
or an impedance parameter value to be determined.
At step 210, an indicator is determined using the first impedance. The
indicator is typically
indicative of the extracellular fluid levels within the subject. Accordingly,
in one example,
the impedance measurement is performed at a single low frequency, such as
below 100 kHz,
and in one example, at 5 kHz, allowing the indicator to be based on the
measured value
directly. Alternatively, multiple measurements may be performed at multiple
frequencies,
with the indicator being based on an appropriate impedance parameter value
derived
CA 02714367 2010-07-29
WO 2009/100491 PCT/AU2009/000163
-19-
therefrom, such as the impedance at zero applied frequency R0, as will be
described in more
detail below.
Optionally, at step 220, the indicator can be used in the assessment of venous
insufficiency,
or other conditions, such as oedema or lymphoedema. In this regard, high
extracellular fluid
levels in the leg segment are indicative of oedema in the leg, which is in
turn an indicator that
venous insufficiency may be present. In one example, the indicator can be
compared to a
reference, such as an oedema reference, to allow the presence, absence or
degree of oedema
to be determined, as will be described in more detail below.
As the determination of the presence of oedema alone may not be conclusive as
to the
presence, absence or degree of venous insufficiency, or lymphoedema,
additional steps may
optionally be performed.
In one example, at step 230, the subject can be treated for venous
insufficiency. This can be
performed in any one of a number of manners, such as by performing ablation,
or the like.
Following this, at step 240, the impedance measurement described above is
repeated to allow
a post-treatment indicator to be determined. Any difference between the pre-
treatment
indicator determined prior to treatment, and the post-treatment indicator, can
be used to
determine if there has been a reduction in the extra-cellular fluid levels.
Any reduction in
fluid levels indicates that the treatment has been at least partially
successful, thereby allowing
the presence of venous insufficiency to be confirmed at step 250.
In this example, both measurements are typically made with the subject in a
standing or
equivalent position, such as leaning or sitting with their leg hanging in a
substantially vertical
position, to thereby enhance the impact of blood pooling caused by venous
insufficiency on
extracellular fluid levels. For the purpose of the remaining description, the
term standing will
be understood to encompass any position that maximises or enhances pooling of
blood in the
subject's leg.
In another example, at step 260, the subject is reorientated from an
orientation used to
determine the first indicator, allowing a change in indicator between
different orientations to
be determined at step 270.
CA 02714367 2010-07-29
WO 2009/100491 PCT/AU2009/000163
-20-
Thus, the first indicator can be determined with the subject provided in a
first orientation, to
allow a baseline reading to be established. In one example, this is performed
with the subject
in an orientation designed to reduce or minimise blood pooling, such as with
the subject in a
supine position, and optionally with their leg elevated to a height of up to
20 cm above the
level of their heart. For the purpose of the remaining description, the term
supine will be
understood to encompass any position that minimises pooling of blood in the
subject's leg.
The subject then stands, leans or sits with their leg hanging in a
substantially vertical
position, allowing a second indicator to be determined, with a change in
indicator values
being indicative of the change of extracellular fluid levels within the leg,
which in turn can be
used in venous insufficiency assessment.
Alternatively, the subject can be allowed to stand to allow pooling of blood.
Following this,
the subject is returned to the supine position allowing the indicator value to
be monitored.
The time taken for this return to the baseline, or to within a range of the
threshold, can then
be used in venous insufficiency assessment.
In another example, at step 280, second impedance measurements are performed
to allow an
index to be determined at step 290. The index is typically indicative of a
ratio between
intracellular and extracellular fluid levels in the leg, or a leg segment,
which can in turn be
used to assess the presence of lymphoedema. Being able to distinguish between
oedema and
lymphoedema can assist in assessing venous insufficiency.
In the above described examples, the measurements are performed on the
subject's leg as this
maximises the effect of any blood pooling, thereby maximising the
effectiveness of the
measurement procedure to determine indicators that can be used in identifying
venous
insufficiency. However, if the technique is being used for other identifying
conditions such
as lymphoedema, then the process can be applied to other body segments, such
as arms, as
will be described in more detail below.
A specific example of the apparatus will now be described in more detail with
respect to
Figure 3.
CA 02714367 2010-07-29
WO 2009/100491 PCT/AU2009/000163
-21-
In this example, the measuring system 300 includes a computer system 310 and a
separate
measuring device 320. The measuring device 320 includes a processing system
330 coupled
to an interface 321 for allowing wired or wireless communication 'with the
computer system
310. The processing system 330 may also be optionally coupled to one or more
stores, such
as different types of memory, as shown at 322, 323, 324, 325, 326.
In one example, the interface is a Bluetooth stack, although any suitable
interface may be
used. The memories can include a boot memory 322, for storing information
required by a
boot-up process, and a programmable serial number memory 323, that allows a
device serial
number to be programmed. The memory may also include a ROM (Read Only Memory)
324, flash memory 325 and EPROM (Electronically Programmable ROM) 326, for use
during operation. These may be used for example to store software instructions
and to store
data during processing, as will be appreciated by persons skilled in the art.
A number of analogue to digital converters (ADCs) 327A, 327B, 328A, 328B and
digital to
analogue converters (DACs) 329A, 329B are provided for coupling the processing
system
330 to the sensors 11 8A, 11 8B and the signal generators 117A, 117B, as will
be described in
more detail below.
A controller, such as a microprocessor, microcontroller or programmable logic
device, may
also be provided to control activation of the processing system 330, although
more typically
this is performed by software instructions executed by the processing system
330.
An example of the computer system 310 is shown in Figure 4. In this example,
the computer
system 310 includes a processor 400, a memory 401, an input/output device 402
such as a
keyboard and display, and an external interface 403 coupled together via a bus
404, as
shown. The external interface 403 can be used to allow the computer system to
communicate
with the measuring device 320, via wired or wireless connections, as required,
and
accordingly, this may be in the form of a network interface card, Bluetooth
stack, or the like.
In use, the computer system 310 can be used to control the operation of the
measuring device
320, although this may alternatively be achieved by a separate interface
provided on the
CA 02714367 2010-07-29
WO 2009/100491 PCT/AU2009/000163
-22-
measuring device 300. Additionally, the computer system 310 can be used to
allow at least
part of the analysis of the impedance measurements to be performed.
Accordingly, the computer system 310 may be formed from any suitable
processing system,
such as a suitably programmed PC, Internet terminal, lap-top, hand-held PC,
smart phone,
PDA, server, or the like, implementing appropriate applications software to
allow required
tasks to be performed.
In contrast, the processing system 330 typically performs specific processing
tasks, to thereby
reduce processing requirements on the computer system 310. Thus, the
processing system
typically executes instructions to allow control signals to be generated for
controlling the
signal generators 117A, 117B, as well as the processing to determine
instantaneous
impedance values.
In one example, the processing system 330 is formed from custom hardware, or
the like, such
as a Field Programmable Gate Array (FPGA), although any suitable processing
module, such
as a magnetologic module, may be used.
In one example, the processing system 330 includes programmable hardware, the
operation
of which is controlled using instructions in the form of embedded software
instructions. The
use of programmable hardware allows different signals to be applied to the
subject S, and
allows different analysis to be performed by the measuring device 320. Thus,
for example,
different embedded software would be utilised if the signal is to be used to
analyse the
impedance at a number of frequencies simultaneously as compared to the use of
signals
applied at different frequencies sequentially.
The embedded software instructions used can be downloaded from the computer
system 310.
Alternatively, the instructions can be stored in memory such as the flash
memory 325
allowing the instructions used to be selected using either an input device
provided on the
measuring device 320, or by using the computer system 310. As a result, the
computer
system 310 can be used to control the instructions, such as the embedded
software,
implemented by the processing system 330, which in turn alters the operation
of the
processing system 330.
CA 02714367 2010-07-29
WO 2009/100491 PCT/AU2009/000163
-23-
Additionally, the computer system. 310 can operate to analyse impedance
determined by the
processing system 330, to allow biological parameters to be determined.
Whilst an alternative arrangement with a single processing system may be used,
the division
of processing between the computer system 310 and the processing system 330
can provide
some benefits.
Firstly, the use of the processing system 330 more easily allows the custom
hardware
configuration to be adapted through the use of appropriate embedded software.
This in turn
allows a single measuring device to be used to perform a range of different
types of analysis.
Secondly, the use of a custom configured processing system 330 reduces the
processing
requirements on the computer system 310. This in turn allows the computer
system 310 to be
implemented using relatively straightforward hardware, whilst still allowing
the measuring
device to perform sufficient analysis to provide interpretation of the
impedance. This can
include for example generating a "Wessel" plot, using the impedance values to
determine
parameters relating to cardiac function, as well as determining the presence
or absence of
lymphoedema.
Thirdly, this allows the measuring device 320 to be updated. Thus for example,
if an
improved analysis algorithm is created, or an improved current sequence
determined for a
specific impedance measurement type, the measuring device can be updated by
downloading
new embedded software via flash memory 325 or the external interface 321.
In use, the processing system 330 generates digital control signals, which are
converted to
analogue voltage drive signals VD by the DACs 329, and transferred to the
signal generators
117. Analogue signals representing the current of the drive signal ID applied
to the subject
and the subject voltage VS measured at the second electrodes 115A, 115B are
received from
the signal generators 117 and the sensors 118 and are digitised by the ADCs
327, 328. The
digital signals can then be returned to the processing system 330 for
preliminary analysis.
In this example, a respective set of ADCs 327, 328, and DACs 329 are used for
each of two
channels, as designated by the reference numeral suffixes A, B respectively.
This allows
each of the signal generators 117A, 117B to be controlled independently and
for the sensors
CA 02714367 2010-07-29
WO 2009/100491 PCT/AU2009/000163
-24-
118A, 118B to be used to detect signals from the electrodes 11 5A, 11 5B
respectively. This
therefore represents a two channel device, each channel being designated by
the reference
numerals A, B.
In practice, any number of suitable channels may be used, depending on the
preferred
implementation. Thus, for example, it may be desirable to use a four channel
arrangement, in
which four drive and four sense electrodes are provided, with a respective
sense electrode
and drive electrode pair being coupled to each limb. In this instance, it will
be appreciated
that an arrangement of eight ADCs 327, 328, and four DACs 329 could be used,
so each
channel has respective ADCs 327, 328, and DACs 329. Alternatively, other
arrangements
may be used, such as through the inclusion of a multiplexing system for
selectively coupling
a two-channel arrangement of ADCs 327, 328, and DACs 329 to a four channel
electrode
arrangement, as will be appreciated by persons skilled in the art.
An example of the process for performing impedance measurements will now be
described
with reference to Figure 5.
At step 500, the electrodes are positioned on the subject as required. The
general
arrangement to allow impedance of a leg to be determined is to provide drive
electrodes
11 3A, 11 3B on the hand at the base of the knuckles and on the feet at the
base of the toes, on
the side of the body being measured. Sense electrode 115A are also positioned
at the front of
the ankle on the leg being measured, with the sense electrode 115B being
positioned
anywhere on the contra-lateral leg.
It will be appreciated that this configuration uses the theory of equal
potentials, allowing the
electrode positions to provide reproducible results for impedance
measurements. This is
advantageous as it greatly reduces the variations in measurements caused by
poor placement
of the electrodes by the operator.
Alternatively however other arrangements can be used. Thus for example, the
sense
electrodes can be provided anywhere on the leg of interest, allowing the
impedance
measurements to be made along the entire leg, or for a part of the leg
(generally referred to as
a leg segment), such as a calf segment, or the like.
CA 02714367 2010-07-29
WO 2009/100491 PCT/AU2009/000163
-25-
At step 510, an impedance measurement type is selected using the computer
system 310,
allowing the processing system to determine an impedance measurement protocol,
and
configure the processing system 330 accordingly. This is typically achieved by
configuring
firmware or software instructions within the processing system 330, as
described above.
At step 520, the processing system 300 selects a next measurement frequency f,
and causes
the signal generators 117A, 117B to apply a first signal to the subject at the
selected
frequency at step 530. At step 540, the signal generators 117A, 117B and
sensors 118A,
11 8B provide an indication of the current through and the voltage across the
leg segment to
the processing system 330.
At step 550, the processing system 330 determines if all frequencies are
complete, and if not
returns to step 520 to select the next measurement frequency. At step 560, one
or more
measured impedance values are determined, by the computer system 310, the
processing
system 330, or a combination thereof, using the techniques described above.
One or more
impedance parameter values may optionally be derived at step 570.
In this regard, Figure 6A is an example of an equivalent circuit that
effectively models the
electrical behaviour of biological tissue. The equivalent circuit has two
branches that
represent current flow through extracellular fluid and intracellular fluid,
respectively. The
extracellular fluid component of biological impedance is represented by an
extracellular
resistance Re, whilst the intracellular fluid component is represented by an
intracellular
resistance R; and a capacitance C representative of the cell membranes.
The relative magnitudes of the extracellular and intracellular components of
impedance of an
alternating current (AC) are frequency dependent. At zero frequency the
capacitor acts as a
perfect insulator and all current flows through the extracellular fluid, hence
the resistance at
zero frequency, R0, equals the extracellular resistance Re. At infinite
frequency the capacitor
?5 acts as a perfect conductor and the current passes through the parallel
resistive combination.
The resistance at infinite frequency R,,, is given by:
R RVA (1)
Re + R,
CA 02714367 2010-07-29
WO 2009/100491 PCT/AU2009/000163
-26-
Accordingly, the impedance of the equivalent circuit of Figure 6A at an
angular frequency 0),
where w=2n*frequency, is given by:
Z = R~+ Ro - R. (2)
1+(jcor)
where:
R.,= impedance at infinite applied frequency
Ro = impedance at zero applied frequency = Re and,
z is the time constant of the capacitive circuit.
However, the above represents an idealised situation which does not take into
account the
fact that the cell membrane is an imperfect capacitor. Taking this into
account leads to a
modified model in which:
Z = R~+ Ro - R. (3)
1 + (jCvr)(1-a)
where:
a has a value between 0 and 1 and can be thought of as an indicator of the
deviation of
a real system from the ideal model.
The values of impedance parameters R0, Rc, or ZZ may be determined in any one
of a number
of manners such as by:
= estimating values based on impedance measurements performed at selected
respective frequencies;
= solving simultaneous equations based on the impedance values determined at
different frequencies;
= using iterative mathematical techniques;
= extrapolation from a "Wessel plot" similar to that shown in Figure 6B;
= performing a function fitting technique, such as the use of a polynomial
function.
For example, the Wessel plot is often used in BIS (Bioimpedance Spectroscopy)
Bioimpedance Spectroscopy (BIS) devices, which perform multiple measurements
over a
CA 02714367 2010-07-29
WO 2009/100491 PCT/AU2009/000163
-27-
range of frequencies, such as from 4 kHz to 1000 kHz, using 256 or more
different
frequencies within this range. A regression procedure is then used to fit the
measured data to
the theoretical semi-circular locus, allowing values for R.. and R0 to be
calculated.
The regression analysis is computationally expensive, requiring a device with
significant
processing power to perform the calculations, which in turn results in
relatively high power
usage by the apparatus, requiring a larger battery, and adding to the weight
and size of the
apparatus.
A further issue is that a large number of data points are required to perform
the regression
analysis, and as measurements are typically performed at each frequency
sequentially, the
measurement process takes a significant amount of time, such as several
seconds. This is
undesirable as remaining still for long periods of time can cause discomfort
for the subject.
Additionally, the subject may move during the measurement procedure, which can
affect the
measured impedance values, for example due to changes in capacitive and/or
inductive
coupling between the subject and environment, leads and electrodes. This can
lead to
inaccuracies in the measured values.
A circle may be described by the equation:
(x - i)2 + (Y J)2 = r2 (3)
where: i and j are the centre of the circle and r is the radius.
Additionally, a circle may be uniquely defined by the co-ordinates of three
points (x1.3, yl-3)
located on the locus, as shown in Figure 4. Accordingly, three simultaneous
equations can be
defined, one for each of three loci that describe the circle that fits these
points, as shown by
equations (4) below.
(x1-i)2 + (Yi - j)2 =r 2
(x2-i)2 + (Y2 - j)2 = r2 (4)
(x3-i)2 + (y3 -j)2 = r2
CA 02714367 2010-07-29
WO 2009/100491 PCT/AU2009/000163
-28-
Solving these three simultaneous equations allows calculation of the radius
(r) and the co-
ordinates of the centre of the circle (i, j). From these data, Ro and Rc0 are
readily computed
from geometric first principles.
Accordingly, this technique allows a value for Ro and optionally R. to be
derived in a
computationally less expensive manner than if a regression analysis is
performed.
Additionally, this also requires a reduced number of data points. This allows
a value of Ro to
be determined more rapidly, and with a more basic processor than can be
achieved using BIS
and regression analysis, which in turn renders the device required to
determine a value of Ro
less expensive to manufacture.
In particular, this is achieved by performing impedance measurements at at
least three
frequencies. Indications of the signals are used to determine first and second
impedance
parameter values at each of the frequencies. The nature of the impedance
parameter values
will vary depending on the preferred implementation. Thus, for example the
impedance
parameter values could include magnitude and phase information relating to the
measured
signals. However, in one example the impedance parameter values are indicative
of the
resistance and reactance, as derived from the magnitude and phase signals.
Once this is completed, simultaneous equations are solved using the first and
second
impedance parameter values determined at each of the three frequencies,
thereby allowing
circle parameters to be determined. The circle parameters are used to define a
locus
corresponding to at least part of an are of a circle in a space defined by the
parameter values.
Thus, in one example, the simultaneous equations represent a circular locus
provided in a
reactance/resistance space, similar to the Wessel plot described above.
Theoretical impedance parameter values, such as Ro and R. can then be
determined from the
circle parameters.
One potential disadvantage of the use of simultaneous equations is that if one
of the
impedance measurements is inaccurate for any reason, this can lead to a large
deviation in the
calculated value of Ro. Accordingly, in one example, impedance measurements
are
performed at more than three frequencies, with circle parameters for all
possible
CA 02714367 2010-07-29
WO 2009/100491 PCT/AU2009/000163
-29-
combinations of impedance measurements at three frequencies being calculated.
The average
can be provided along with the standard deviation as a measure of the goodness
of fit of the
data to the Cole model. In the event that one of the measurements is
inaccurate, this can be
accounted for by excluding one or more outlier measurements, such as
measurements that
deviates the greatest amount from the mean, or measurements differing by more
than a set
number of standard deviations from the mean, allowing the mean to be
recalculated, thereby
providing more accurate values.
Whilst this process uses additional measurements, such as four or five
measurements, this is
still significantly less than the 256 or more frequencies typically performed
using a BIS
measurement protocol, allowing the measurement process to be performed more
quickly.
In one example, the frequencies used are in the range 0 kHz to 1000 kHz, and
in one specific
example, four measurements are recorded at frequencies of 25 kHz, 50 kHz, 100
kHz, and
200 kHz, although any suitable measurement frequencies can be used.
A further alternative for determining impedance parameter values such as R0
and R,,,, is it
perform impedance measurements at a single frequency, and use these as an
estimate of the
parameter values. In this instance, measurements performed at a single low
frequency can be
used to estimate R0, whilst measurements at a single high frequency can be
used to estimate
Rte.
The above described equivalent circuit models the resistivity as a constant
value and does not
therefore accurately reflect the impedance response of a subject, and in
particular does not
accurately model the change in orientation of the erythrocytes in the
subject's blood stream,
or other relaxation effects. To more successfully model the electrical
conductivity of the
human body, an improved CPE based model may alternatively be used.
In any event, it will be appreciated that any suitable technique for
determination of the
parameter values such as R0, Z, and R,,, may be used.
A first specific example of a process for analysing impedance measurements to
allow
assessment of venous insufficiency will now be described with reference to
Figure 7.
CA 02714367 2010-07-29
WO 2009/100491 PCT/AU2009/000163
-30-
In this example, at step 700, at least one first impedance value is determined
using the
method described above. The measurement is typically performed with the
subject in a
specific orientation, such as in a supine or standing position. This is
performed to either
maximise or minimise the effect of blood pooling, and this will depend on the
analysis
performed.
In this first specific example, the subject is made to stand for a set time
period such as
between five and fifteen minutes to maximize the effect of any blood pooling.
In general, a
marked increase in blood pooling is achieved after five minutes, with the
blood levels
reaching a relatively static maximum after approximately fifteen minutes.
Accordingly,
whilst it is preferable for the subject to stand for fifteen minutes to
thereby maximise blood
pooling, even after five minutes sufficient pooling occurs to allow
measurements to be
performed. It will be appreciated from this that the length of time selected
may depend on
factors such as the amount of time available for the measurement process and
the ability of
the subject to remain in standing position.
Furthermore, the subject may be required to lay in a supine position for a set
time period,
such as five to fifteen minutes prior to standing. This can be performed to
minimise any
blood pooling before standing, so as to provide a more accurate baseline
status for the subject
prior to measurements being performed. Again, a marked reduction in pooling is
achieved
after five minutes, with the level of pooling typically reaching a reasonably
static minimum
after approximately fifteen minutes, so the length of time used will depend on
factors such as
the amount of time available to make a measurement.
At step 710 an impedance parameter value Ro is optionally determined. This can
be
performed if multiple impedance values are determined. Otherwise, a single
impedance
measurement can be made at a low frequency, such as below 10 kHz, as this
provides a
reasonably close approximation of Ro.
At step 720, an indicator that is indicative of the extracellular Re fluid
levels within the
subject is determined, with this being displayed to the user at step 730.
CA 02714367 2010-07-29
WO 2009/100491 PCT/AU2009/000163
-31-
The indicator can be any form of suitable indicator such as a numerical value
based on the
value of the impedance parameter value Ro. The indicator may also be scaled to
provide a
numerical value that is indicative of the presence, absence or degree of
venous insufficiency
or oedema. The indicator can also be based on the results of a comparison of a
numerical
value to a reference, such as an oedema reference.
The oedema reference could be any suitable form of reference. Thus, in one
example, the
oedema reference can be based on an equivalent impedance parameter value
determined for a
different limb of the subject, such as an arm. This is possible, as, for a
subject not suffering
from venous insufficiency, there is a predictable relationship between the
extracellular fluid
levels between different limbs. Thus, for example, if the subject is suffering
from a condition
other than venous insufficiency, which causes a general change in
extracellular fluid levels,
then this should affect body segments in an assessable manner, thereby
allowing venous
insufficiency to be identified.
Minor variations in tissue may occur between different body segments in a
healthy subject,
and this can be accounted for by providing a tolerance to the comparison.
Thus, for example,
this could take into account naturally expected variations between different
limbs in normal
healthy subjects, for example due to limb dominance, previous analysis for the
subject, or the
like. The tolerance may also depend on a number of factors, such as the
subject's age,
weight, sex and height, and again a respective range can be selected based on
these factors.
Alternatively, the oedema reference can be based on a reference derived from
sample
populations, or the like. The oedema reference can be selected based on the
subject
parameters, so that the value of the indicator is compared to values of the
indicator derived
from a study of a sample population of other individuals having similar
subject parameters.
As a further alternative, the oedema reference can be based on a previously
measured
reference for the subject, for example determined before the subject suffered
from venous
insufficiency or oedema. This allows a longitudinal analysis to be performed,
thereby
allowing the onset or progression of venous insufficiency to be assessed.
CA 02714367 2010-07-29
WO 2009/100491 PCT/AU2009/000163
-32-
The indicator can additionally and/or alternatively be displayed on a
graphical linear or non-
linear scale, with the position of a pointer on the scale being indicative of
extracellular fluid
levels and or the presence, absence or degree of oedema or venous
insufficiency. In one
example, the linear scale can include thresholds at values representing ranges
indicative of
s the presence or absence of oedema or venous insufficiency, as derived from
sample
population data, or other references.
At step 740, the user can use the indicator to assess whether further
investigation is required.
In this regard, a high extra-cellular fluid level indicative of the presence
of oedema is a good
indication that the subject has venous insufficiency, but this may need to be
confirmed with
further measurements, and/or analysis.
The above described example allows for a rapid assessment of the presence of
venous
insufficiency. This can be performed using BIA, which allows relatively simple
apparatus
and processing to be used, thereby reducing the cost of equipment required to
assess venous
insufficiency compared to more complex techniques. Despite this, the process
is more
reliable than current non-invasive techniques such as SPG and APG. In this
regard, changes
in fluid levels can typically be detected using impedance measurements before
the fluid level
changes have a noticeable impact on limb volume, thereby making the impedance
measurement process more sensitive than other techniques such as SPG or APG.
Examples for performing further investigation will now be described in more
detail.
In the specific example of Figure 8, at step 800 a first indicator value is
determined with the
subject in a standing position, as described with respect to Figure 7, to
maximise blood
pooling. This is performed before the subject is treated so that the first
indicator acts as a
pre-treatment indicator. At step 810, the subject is treated for venous
insufficiency, by
performing ablation, or the like. Following this, at step 820, a second
indicator value is
determined using a similar technique, (i.e. with the subject in a standing
position) which acts
as a post-treatment indicator.
The processing system 102 then determines any difference between the first and
second
indicator values at step 830, with the difference being compared to a
reference, such as a
CA 02714367 2010-07-29
WO 2009/100491 PCT/AU2009/000163
-33-
treatment reference at step 840, thereby allowing the relevance of any change
to be assessed.
If the comparison indicates that there is a reduction in the extra-cellular
fluid levels greater
than a threshold amount, then this indicates that the treatment is successful
or has at least had
an impact, thereby allowing the presence of venous insufficiency to be
confirmed at step 850.
The magnitude of any difference may also be used to determine the degree of
any venous
insufficiency, and/or the effectiveness of the treatment.
Again, the treatment reference can be derived in any one of a number of
manners. For
example, treatment reference can be obtained from data collected from a sample
population
of subjects, which acts as a pool of data from which normalised expected
differences for
successfully treated, untreated and/or healthy subjects can be determined. The
treatment
reference is then generated by selecting reference values that are determined
to be relevant to
the test subject based on the subject parameters such as age, sex, height,
weight, race,
interventions, or the like.
In this instance, given a preliminary indication that venous insufficiency is
present following
the procedure of Figure 7, treatment of the subject is performed, with the
presence of venous
insufficiency being confirmed if the treatment is successful in the sense that
it results in a
reduction in extra-cellular fluid levels. This therefore allows a more
reliable assessment of
venous insufficiency, but advantageously also simultaneously treats the venous
insufficiency,
ensuring that the subject is treated as rapidly as possible, without having to
await further
analysis. In the instance that the subject does not have venous insufficiency,
then there is no
negative effect of performing the treatment. It will also be appreciated that
this allows the
analysis to be confirmed using the same apparatus as used to perform the
initial assessment,
thereby simplifying the analysis for the relevant health professional
performing the
assessment.
In the specific example of Figure 9, at step 900 a first indicator value is
determined with the
subject in a supine position. This measurement is typically performed after
the subject has
been allowed to rest for some set time, such as five to fifteen minutes. This
reduces the effect
of any blood pooling, allowing a baseline reading to be established. The
subject then stands
for a predetermined time period, such as five to fifteen minutes, to maximize
blood pooling
a second indicator value is determined using the technique described above, at
step
3o before'
CA 02714367 2010-07-29
WO 2009/100491 PCT/AU2009/000163
-34-
910, Again, the first and second indicator values are indicative of extra-
cellular fluid levels,
and therefore could be based on one or more low frequency impedance
measurements or the
impedance parameter value R0, as derived from impedance measurements in some
manner.
At step 920, the processing system 102 then determines any difference between
the first and
second indicator values, with the difference being compared to a reference,
such as a pooling
reference, at step 930.
Again, the pooling reference can be based on similar indicator values derived
from sample
populations, or the like. Alternatively, the pooling reference can be based on
first and second
indicator values previously determined for the subject, for example prior to
the onset of
venous insufficiency, allowing longitudinal analysis to be performed.
In one example, the reference is determined as a percentage change from the
baseline
reading, so that a change of less than a predetermined amount, such as 15%,
indicates that the
subject does not have venous insufficiency. For a percentage change greater
than the
predetermined amount, such as 15%, this indicates that the level of pooling is
abnormal, and
hence that the subject may have venous insufficiency, with the magnitude of
the percentage
change being indicative of the degree of venous insufficiency. Thus, for
example, a change
of greater than 20 %, would typically be indicative of venous insufficiency.
Results of the comparison can be displayed at step 940, to allow the relevance
of any change
to be assessed. In this regard, if the comparison indicates that there is an
increase in the
extra-cellular fluid levels greater than an amount determined from the pooling
reference, then
this indicates that there is significant blood pooling within the subject,
which is in turn
indicative of venous insufficiency. It will be appreciated from this, that the
magnitude of the
difference between the first and second indicator values can be indicative of
the degree of
venous insufficiency.
In this instance, given a preliminary indication that venous insufficiency is
present following
the procedure of Figure 7, the subject is reorientated and the measurement re-
performed. In
this regard, if the indicator derived in the process of Figure 7 is made in
the standing position,
then this can act as the second indicator, with the subject being reorientated
to allow the first
CA 02714367 2010-07-29
WO 2009/100491 PCT/AU2009/000163
-35-
indicator to be determined. Accordingly, it will be appreciated that the terms
"first" and
"second" are used to identify respective indicators and do not necessarily
imply or require an
order to the measurements.
However, in general the first indicator is measured first to allow an accurate
baseline to be
established, although this is not essential. This allows a more reliable
assessment of venous
insufficiency than achievable with prior art techniques, and allows the
analysis to be
confirmed using the same apparatus as used to perform the initial assessment.
This also
allows assessment to be confirmed without requiring treatment of the subject,
which can
reduce the cost burden of the assessment.
In the specific example of Figure 10, at step 1000 a first indicator value is
determined with
the subject in a supine position. As in the previous example, this is
performed to allow a
baseline reading to be established. The subject then stands for a
predetermined time period,
such as five to fifteen minutes, to maximize blood pooling at step 1010,
before returning to a
supine position to allow a second indicator value to be determined using the
technique
described above, at step 1020.
At step 1030, the processing system 102 then determines any difference between
the first and
second indicator values, before determining if the difference is below a
reference, such as a
return reference, at step 1040. If not, the process returns to step 1020,
allowing a new second
indicator to be determined.
The reference may be derived from sample populations, previous measurements
for the
subject, or the like. Alternatively, the reference is deemed to be a certain
percentage
variation from the baseline reading. Thus, in this example, the time taken to
return to within
5-10% of the baseline reading can be determined.
Steps 1020 to 1040 are repeated until the difference between the first and
second indicators is
below the return reference. At step 1050, the length of time taken for the
difference to fall
below the pooling reference is determined, with this being displayed to the
user at step 1060.
If the time taken to return to the baseline (or the reference), is less than a
reference amount,
such as fifteen minutes, then this is indicative that the subject does not
have venous
CA 02714367 2010-07-29
WO 2009/100491 PCT/AU2009/000163
-36-
insufficiency. However, if the time taken is greater than the reference time,
then this is
indicative that the subject does have venous insufficiency.
In this regard, in a healthy subject, the amount of blood will return to the
baseline amount
relatively quickly, whilst in a subject with venous insufficiency, this can
take several
minutes. Accordingly, the time taken for blood pooling in the leg to be
reduced is in turn
indicative of the presence, absence or degree of venous insufficiency. The
return reference is
used to take into account natural variation and to allow the measurement to be
performed in a
reasonable time period.
In this instance, by measuring the time taken for the subject to return to a
baseline reading,
this provides a direct correlation for the ability of the venous system to
counteract any blood
pooling, which is directly indicative of the degree of venous insufficiency.
This therefore
provides an accurate technique for assessing the severity of venous
insufficiency without
requiring treatment or complex apparatus.
An example of a process for allowing oedema and lymphoedema to be
distinguished will
now be described with reference to Figure 11. In one example, this process can
be used to
help assess the presence of venous insufficiency. For example, if measurements
are
performed on the subject's leg, and it is determined that the subject has
oedema but not
lymphoedema, then this is indicative that the subject has venous
insufficiency. Alternatively
however, this technique can be used to distinguish between oedema and
lymphoedema in
other body segments, such as arms. This can be used in helping to identify
optimum
management programmes depending on the conditions suffered by the subject.
Accordingly, for the purpose of this example, the technique will be described
as being
generally applied to a body segment to allow oedema and lymphoedema to be
distinguished.
It will be appreciated that in the event that this technique is used for
identifying venous
insufficiency, then the process will be performed on the subject's leg, but
that the process
could also be applied to other body segments.
In the specific example of Figure 11, at step 1100 impedance values are
determined for the
body segment at a number of different frequencies. If this technique is being
used to
CA 02714367 2010-07-29
WO 2009/100491 PCT/AU2009/000163
-37-
determine indicators that can be used in identifying venous insufficiency,
then these
measurements are typically performed with the subject in a standing position
to maximise
blood pooling.
At step 1110, the processing system 102 determines values for the impedance
parameters R0,
R,,,, as described in more detail above. Thus, this could be performed using
regression
analysis applied to BIS measurements. Alternatively, the process could use
MFBIA, and
solving of simultaneous equations to determine the impedance parameter values.
Other
techniques could also be used as appropriate in which combinations of
individual
measurements at selected frequencies are used. Thus, for example, single
measurements at
low and high frequencies respectively could be used as an estimate of Ro and
R..
At step 1120, a first indicator value is determined using the impedance
parameter value Ro. It
will be appreciated that this can alternatively be derived from a single low
frequency
impedance measurement described above, although in another example,
measurements at
multiple frequencies can be used for subsequent steps, in which case the need
to make
additional single frequency measurements can be avoided.
At step 1130, an index is determined for the body segment which provides an
indication of
the distribution between intra and extracellular fluids. In one example, the
index is indicative
of the ratio of extracellular fluid to intracellular fluid R;/Re. In this
regard, using the values for
the extracellular fluid resistance Re and intracellular fluid resistance R1
above, the index I is
given by the equation:
I ` R ; = R. (4)
Re R0 -R.
At step 1140, the first indicator value is compared to a first reference, such
as the oedema
reference described above, with the results of the comparison allowing the
presence of
oedema to be determined.
15 At step 1150, the index value is compared to a second reference, with the
results of the
comparison allowing determination of whether the subject has lymphoedema. The
second
reference can be determined in any one of a number of manners.
CA 02714367 2010-07-29
WO 2009/100491 PCT/AU2009/000163
-38-
In one example, the index is compared to a reference index value determined
for another
limb. This is possible, as, for a subject not having lymphoedema, there is
generally a degree
of similarity of intra- and extra-cellular fluid levels, even between
different body segments.
Typically minor variations in tissue will occur between different body
segments, for example
due to inherent differences between different types of limb, or due to limb
dominance, and
this can be accounted for using appropriate tolerances in a manner similar to
that described
above. Additionally, and/or alternatively, different references can be used,
such as references
derived from sample populations, previous measurements made for the subject,
or the like.
The results of the comparison can be displayed to the user to allow assessment
of whether the
subject has oedema and/or lymphoedema.
In the event that measurements are performed on the subject's leg, whilst the
subject is in a
standing position, and this indicates that the subject is likely to have
oedema which is not
lymphoedema, then this is indicative that the subject has venous
insufficiency. In this
instance, the magnitude of the indicator and index values can be used to
assess the degree of
venous insufficiency. Alternatively, this technique can be used on other parts
of the body to
distinguish between oedema and lymphoedema.
In a further example, the above described process can be repeated with the
subject in supine
and standing positions. In this instance, changes in the indicator and index
values can further
assist in assessing the presence, absence or degree of venous insufficiency.
In this example, whilst more complex BIS apparatus is required, this can
provide a more
accurate indication of venous insufficiency severity than can be achieved
using the prior art
or other techniques. Furthermore, by using the BIS apparatus described above,
the
assessment can be performed rapidly, without requiring the subject to undergo
exercise
regimes, which may not be appropriate for some subjects.
In the above described examples, the term impedance generally refers to a
measured
impedance value or impedance parameter value derived therefrom. The term
resistance
refers to any measured value relating to the impedance, such as admittance of
reactance
measurements.
CA 02714367 2010-07-29
WO 2009/100491 PCT/AU2009/000163
-39-
The term processing system is intended to include any component capable of
performing
processing and can include any one or more of a processing system and a
computer system.
Persons skilled in the art will appreciate that numerous variations and
modifications will
become apparent. All such variations and modifications which become apparent
to persons
skilled in the art, should be considered to fall within the spirit and scope
that the invention
broadly appearing before described.
Features from different examples above may be used interchangeably where
appropriate.
Thus, for example, multiple different indicators may be determined and
compared to
respective thresholds.
Furthermore, whilst the above examples have focussed on a subject such as a
human, it will
be appreciated that the measuring device and techniques described above can be
used with
any animal, including but not limited to, primates, livestock, performance
animals, such race
horses, or the like.
The above described processes can be used in determining biological
indicators, which in
turn can be used for diagnosing the presence, absence or degree of a range of
conditions and
illnesses, including, but not limited to oedema, lymphodema, body composition,
or the like.
Furthermore, whilst the above described examples have focussed on the
application of a
voltage signal to cause a current to flow through the subject, this is not
essential and the
process can also be used when applying a current signal.
It will also be appreciated that the term impedance measurement covers
admittance and other
related measurements.