Note : Les descriptions sont présentées dans la langue officielle dans laquelle elles ont été soumises.
CA 02779813 2017-01-09
SPECTRAL DECOMPOSITION AND
DISPLAY OF THREE-DIMENSIONAL
ELECTRICAL ACTIVITY IN THE LIAM-WA!, COE MX
Background of the Invention
The field of neuroscience known as "functional localization- attempts to
assign functions to specific regions of the brain. For example, the temporal
lobe
has been shown to be involved with hearing, and the occipital lobe is involved
in
vision. Functional localization can he performed using functional magnetic
resonance imaging (fN/IRI) or positron emission tomography (PET), both of
which
are quite expensive. In addition, there are a number of neurological
conditions in
which the afflicted area has yet to be determined or is undeterminable using
the
aforementioned methods. Given the number of neurological conditions that
currently rely on subjective means of diagnosis or expensive medical imaging,
there is a definite need to isolate meaningful signals from the brain in an
objective
and cost efficient manner.
Many of the brain's higher functions including those associated with
thought, action, emotion, and sensation are often prone to illness, and they
have
been found to originate within the cerebral cortex, the convoluted outer
surface of
the brain commonly known as 'gray matter'. The cerebral cortex emits
electromagnetic signals, which can he measured by electrodes placed on the
surface of the scalp. This practice, when graphed as waveforms plotting
electrical
potential (voltage) against time is generally known as electroeneephalography
(EE(I).
Summary of the Invention
In accordance with an aspect of the present invention, a system is provided
for measuring electrical activity within a brain of a patient. An electrode
array is
configured to take measurements of electrical potential as raw
CA 02779813 2012-04-26
WO 2011/051807
PCT/1B2010/002973
-2-
electroencephalographic (EEG) data. A data processing component includes a
spectral decomposition component configured to divide the raw EEG data into a
plurality of frequency intervals, within a total range of frequencies and an
inverse
solution component configured to transform the raw EEG data associated with
each frequency interval into a spatial mapping of electrical activity as to
provide a
set of parameters, with each parameter representing an average electrical
activity at
an associated location within the brain over an epoch of interest.
In accordance with another aspect of the present invention, a computer
readable medium stores executable instructions for evaluating electrical
activity
within a brain of a patient. A spectral decomposition component is configured
to
divide raw EEG data into a plurality of frequency intervals. Each frequency
interval represents a frequency interval within a total range of frequencies.
An
inverse solution component is configured to reconstruct the electrical
activity of at
least a portion of the brain from the EEG data associated with each frequency
interval into a spatial mapping of electrical activity as to provide a set of
parameters for each frequency interval. Each parameter represents an average
electrical activity at an associated location within the brain over a period
of time.
A user interface is configured to provide the set of parameters associated
with at
least one frequency interval to an associated output device.
In accordance with yet another aspect of the present invention, a method is
provided for the analysis of raw EEG data of a subject. Raw EEG data is
generated at an electrode array. The raw EEG data is filtered to produce a
plurality
of frequency intervals, with each frequency interval representing data within
an
associated frequency interval of the raw EEG data. The data represented by at
least one of the plurality of frequency intervals is transformed via an
inverse
solution approximation algorithm as to determine, for each of the at least one
frequency interval, values at a plurality of locations within a brain of the
subject.
Each value represents a current density within the frequency interval
associated
with the frequency interval at a corresponding location. The values
corresponding
to the current density associated with each of the at least one frequency
interval are
averaged over an epoch to produce, for each frequency interval, a plurality of
averaged values corresponding to the plurality of locations within the brain
of the
-3-
subject. A set of the plurality of averaged values are displayed at a
corresponding
display.
In accordance with yet another aspect of the present invention there is
provided a system for measuring and displaying electrical activity within a
brain
of a patient, the system comprising: an electrode array configured to take
measurements of electrical potential as raw electroencephalographie (EEG)
data; a
data processing component configured to implement an automation loop to
determine a spatial mapping of electrical activity at each of a plurality of
contiguous frequency intervals after the electrode array has taken the
measurements of the electrical potential as the raw EEG data, the data
processing
component comprising: a spectral decomposition component configured to divide
the raw EEG data into the plurality of contiguous frequency intervals, within
a
total range of frequencies to be anaylyzed, and, until each of the plurality
of
contiguous frequency intervals has been selected, select a next frequency
interval
of the plurality of contiguous frequency intervals; and an inverse solution
component configured to transform the raw EEG data associated with the
selected
frequency interval into a spatial mapping of electrical activity as to provide
a set
of parameters, each parameter representing an average electrical activity at
an
associated location within the brain over an epoch of interest, and, until the
raw
EEG data associated with each of the plurality of contiguous frequency
intervals
has been transformed, repeat the transforming of the raw EEG data associated
with
the next frequency interval of the plurality of contiguous frequency
intervals; a
non-transitory storage medium for storing the set of parameters; and an output
device, configured to display the set of parameters in a human comprehensible
form.
CA 2779813 2018-11-13
-3a-
In accordance with yet another aspect of the present invention there is
provided a non-transitory computer readable medium, storing executable
instructions for evaluating electrical activity within a brain of a patient
via an
automation loop configured to determine a spatial mapping of electrical
activity of
frequency intervals after raw EEG data is collected, the executable
instructions
comprising: a spectral decomposition component configured to divide the raw
EEG data into a plurality of contiguous frequency intervals, within a total
range of
frequencies to be analyzed, and, until each of the plurality of contiguous
frequency
intervals has been selected, select a next frequency interval of the plurality
of
contiguous frequency intervals and filter the raw EEG data to isolate the
selected
frequency interval; an inverse solution component configured to reconstruct
the
electrical activity of at least a portion of the brain from the filtered EEG
data
associated with the selected frequency interval into a spatial mapping of
electrical
activity so as to provide a set of parameters for the selected frequency
interval,
each parameter representing an average electrical activity at an associated
location
within the brain over a period of time, and, until the electrical activity of
at least a
portion of the brain from the filtered EEG data associated with each of the
plurality of contiguous frequency intervals has been reconstructed, repeat the
reconstructing of the electrical activity of at least a portion of the brain
from the
filtered EEG data associated with the next frequency interval of the plurality
of
contiguous frequency intervals; and a user interface component configured to
provide a user interface configured to provide the set of parameters
representing
respective frequency intervals of the plurality of contiguous frequency
intervals to
an output device for display, such that at least two locations in the brain
are
presented on the output device.
CA 2779813 2018-11-13
-3b-
Brief Description of the Drawings
Fig. 1 depicts a flowchart of a method in accordance with the present
invention;
Fig. 2 depicts a flowchart of one implementation of a method in
accordance with an aspect of the invention;
Figs. 3A-3D depicts examples of visualization methods available to view
the decomposed data. (A) 2D representation of all average current density
values
one square per value) for each Brodmann area (Y-axis) and for each frequency
band (X-axis). (B) The average current densities of each Brodmann area for one
frequency band of interest (12-16 Hz in this example), visualized in a 3-D
surface
view. (C) The same data as in Fig. 3B visualized as 2D tomographic slices in
the
axial, or transverse, plane. (D) Data represented in histogram form, where the
X-
axis represents average current density values for one frequency band of
interest
and the Y-axis labels the brain areas described by the data;
Fig. 4 illustrates a computer system that can be employed to implement
the systems and methods described herein as computer executable instructions,
stored on a computer readable medium and running on the computer system;
Fig. 5 illustrates one implementation of a system 600 in accordance with
an aspect of the present invention; and
Figs. 6A-6E depict a series of images illustrating an example of how to
use the linear average functionality of the present system to find a summary
of the
generator activity of an EEG waveform.
Detailed Description of the Invention
In accordance with an aspect of the present invention, methods and
systems are provided to allow a user to decompose, analyze and visualize the
three
dimensional (3-D) electrical activity within the cerebral cortex of the brain.
The
human cerebral cortex performs numerous functions, and there are numerous
CA 2779813 2018-11-13
CA 02779813 2012-04-26
WO 2011/051807
PCT/1B2010/002973
-4-
diseases for which the present invention may be utilized for diagnosing,
monitoring, and treating.
The present invention may be used as an aid to diagnose, aid to monitor and
aid to treat a number of mental and behavioral disorders involving electrical
abnormalities in the cerebral cortex, including diseases of the nervous
system,
medical conditions and psychological conditions. In many disorders, there are
known abnormalities evident within the EEG and/or further QEEG analyses, that
is, quantitative EEG, an extension of conventional EEG involving topographic
maps. The methods of the present invention are such that they are designed to
isolate spectral bands, that is, specific frequencies or frequency ranges of
EEG
signals, vector temporal-spatial movement dynamics (changes in the direction
and
location of electrical flow) and to correlate the generator sources (putative
sources
of electrical activity within the cerebral cortex) in three dimensions, thus
identifying the locations and cortical electrical dynamics that underlie the
EEG
abnormalities. Regarding other items on the list below there are theoretical
grounds for placing them here. The present invention is particularly suited
for
characterizing the abnormal electrical dynamics of many diseases involving the
cerebral cortex. For any condition that exhibits EEG abnormalities, it is
possible to
better characterize and localize them with the present invention. Diagnostic
tests
may be developed with the aid of clinical trials to create sets of normative
data
derived from normal individuals, and sets of data derived from diseased
individuals, which will be used for comparisons with data from a patient.
The listing of potential applications herein includes not only the names of
diseases and disorders, but also the names of categories of diseases and
disorders,
which have accepted definitions under the World Health Organization ICD10
system of nomenclature. This includes block F (Chapter V) of the ICD-10,
accessible at: iltip://www3.who.in Vied/von htin2003/fr-icd.htm.
Organic mental disorders include Alzheimer's, vascular dementia, organic
amnesic syndromes, and other cortical dementias. There are examples in
scientific
literature showing electrical abnormalities in people with dementias. In
Alzheimer's, increased low frequency activity (where activity is defined as
higher
EEG signal amplitude) and decreased mean frequency is often found within the
CA 02779813 2012-04-26
WO 2011/051807
PCT/1B2010/002973
-5-
EEG signals. In some dementias, the EEGs revealed increases in delta (1-3 Hz)
and/or theta (4-7 Hz) power (where power is defined as the square of the EEG
signal amplitude) and decreased mean frequency as well as decreased beta
(12-35 Hz) power and dominant frequency in the occipital lobe. Since EEG has
very little ability to localize these abnormalities, it is possible to better
characterize
them with the methods of the present invention as an aid to diagnosis,
monitoring
and treatment. Pick's Disease has EEG abnormalities, which can be imaged and
quantified in greater detail with the methods and apparatus of the present
invention. Delirium Tremens has high frequency abnormalities on EEG.
The visualization system disclosed herein can also be used to identify
mental and behavioral disorders due to psychoactive substance use,
specifically
substance abuse and drug-induced states affecting the cortex. This includes
the
stimulatory/depressive, toxic and withdrawal effects of psychoactive drugs
such as,
but not limited to, depressants, sedatives, stimulants, illegal narcotics,
anti-
epileptics, anxiolytics, sleep drugs, anti-psychotics, hallucinogens, anti-
depressants, and inhalants. Examples include, but are not limited to, cocaine,
amphetamines, cannabis, caffeine, tobacco, nicotine, LSD, ecstasy, GHB, PCP,
heroin, opium, hashish, mescaline, "magic mushrooms", and alcohol. For
example, studies of alcohol abuse have found increased beta activity, and
alcohol
intoxication studies have found decreased alpha activity and increased theta
activity. Increased alpha activity in frontal regions is associated with
cannabis
withdrawal and intoxication. Increased alpha and decreased delta activity is
associated with crack cocaine withdrawal. The present invention may be used to
determine their effects on the electromagnetic activities of the cortex, which
will
be used to diagnose and plan the treatment of cortical states caused by these
drugs.
Systems and methods in accordance with the present invention can also be
used to diagnose schizophrenia, schizotypal disorders, and delusional
disorders.
For example, schizophrenics occasionally exhibit low mean alpha frequency as
well as other alpha wave abnormalities or abnormalities of other frequency
bands,
including frontal delta and theta excess on EEG. Similarly, affective
disorders
include but not limited to unipolar and bipolar disorders including depression
and
mania. Alpha and theta wave abnormalities such as increased alpha and theta
CA 02779813 2012-04-26
WO 2011/051807
PCT/1B2010/002973
-6-
power are known to exist in unipolar depressed patients. Bipolar patients tend
towards reduced alpha and beta activity.
Neurotic, stress-related, and somatoform disorders can also be detected via
the disclosed visualization system. Neurotic, stress- related and somatoform
disorders include but are not limited to anxiety disorders, obsessive-
compulsive
disorder, reaction to severe stress, dissociative disorders, and somatoform
disorders. Anxiety disorders often have reduced alpha activity. Similarly, the
system can facilitate diagnosis of behavioral syndromes associated with
physiological disturbances and physical factors. This includes behavioral
syndromes associated with physiological disturbances and physical factors
including but not limited to anorexia nervosa, bulimia nervosa, non-organic
sleep
disorders including non-organic insomnia and non- organic hypersomnia, and non-
organic disorder of the sleep-wake schedule, sleepwalking (somnambulism),
sleep
terrors, nightmares, and sexual dysfunction not caused by organic disorders or
diseases.
The visualization system can also be used to diagnose disorders of adult
personality and behavior as well as disorders of psychological and
intellectual
development. Disorders of adult personality and behavior can include, but are
not
limited to, paranoid, schizoid, dissocial, emotionally unstable, histrionic,
anakastic,
anxious, dependant personality disorders as was as personality disorder
unspecified
types, and habit and impulse disorders including pathological gambling, gender
identity disorders, disorders of sexual preference, psychological and
behavioral
disorders associate with sexual development and orientation. Disorders of
psychological development can include specific developmental disorders of
speech
and language, specific developmental disorders of scholastic skills including
developmental dyslexia, specific developmental disorder of motor function,
mixed
specific developmental disorders, pervasive developmental disorders including
childhood autism and Rett's syndrome and Asperger's syndrome. Disorders of
intellectual development can include mild, moderate, and severe forms of
mental
retardation. Similarly, a number of behavioral and emotional disorders with
onset
usually occurring in childhood and adolescence, including hyperkinetic
disorders,
disturbances of activity and attention, conduct disorders, emotive disorders
with
CA 02779813 2012-04-26
WO 2011/051807
PCT/1B2010/002973
-7-
onset specific to childhood, tic disorders including combined vocal and
multiple
motor tic disorder (e.g., de la Tourette), can be detected. It will be
appreciated that
this disorders listed herein are not exhaustive, and that the visualization
system can
be useful for additional mental disorders that are not listed herein.
The visualization system can also be used to detect and diagnose various
diseases of the nervous system. Many of these diseases are listed in Block G
(Chapter VI) of the ICD-10 (accessible at: http://www3. who.int/ial/voll
htm2003/fr-icd.htm). These diseases can include inflammatory diseases of the
central nervous system, such as meningitis, encephalitis and abscesses,
systemic
atrophies primarily affecting the central nervous system, extrapyramidal and
movement disorders, such as Parkinson's disease, and other diseases involving
the
cerebral cortex, and demyelinating diseases of the central nervous system,
such as
multiple sclerosis.
The system can also be applied in the detection and treatment of episodic
and paroxysmal disorders. This includes the various forms of epilepsy,
migraine,
tension headache and other headache syndromes, not limited to cluster,
transient
cerebral ischemic attacks and related syndromes, such as Amaurosis fugax,
vascular syndromes of brain in cerebrovascular diseases, sleep disorders
including
disorders of initiating and maintaining sleep (insomnias), disorders of
excessive
somnolence (hypersomnias), disruptions in circadian rhythm including jet lag,
sleep apnea, narcolepsy, and cataplexy. In cerebralvascular disease, slowing
of
EEG frequencies is highly correlated with decreased regional blood flow.
Cerebralvascular diseases include strokes, suspected strokes, or transient
ischemic
attacks.
The EEG visualization system can also be used to diagnose nerve and nerve
root plexus disorder, as well as polyneuropathies and other disorders of the
peripheral nervous system.
The system can further diagnose cerebral palsy and other paralytic
syndromes, including infantile cerebral palsy, hemiplegia, paraplegia and
triplegia
where the cause is cortical in origin, as well as other disorders of the
nervous
system, including hydrocephalus, toxic encephalopathy, cerebral cysts, anoxic
brain damage, benign intracranial hypertension, postviral fatigue syndrome,
CA 02779813 2012-04-26
WO 2011/051807
PCT/1B2010/002973
-8-
encephalopathy, unspecified compression of the brain, cerebral edema, and
Reye's
syndrome.
The EEG visualization system can also be applied in the diagnosis of other
diseases and disorders involving the cerebral cortex, including many that are
that
are not explicitly mentioned above. These diseases can include disorders of
belief
and belief formation, such as delusions and delusional states, as delusional
states
have been found in some cases been found to involve low frequencies on the
EEG.
Cortical sensory disorders can also be detected, including visual disorders,
such as
cortical blindness and visual agnosia, acoustic disorders, such as cortical
deafness
and auditory agnosia, tactile disorders, disorders affecting the sense of
smell, such
as anosmia, vestibular disorders, such as vertigo, and visceral sensory
disorders
like irritable bowel syndrome and interstitial cystitis. The system can also
be used
to detect cortical damage, such as damage caused by stroke or brain injury.
For
example, it is possible to localize this damage using indicators of reduced
cortical
function in the damaged areas using the present invention. Head injuries have
been associated in the medical literature with increased theta power,
decreased
delta power, decreased alpha power, low coherence, and increased asymmetry
across the hemispheres of the brain. These abnormalities can be localized and
better characterized using the present invention so as to provide diagnostic
tests for
the nature and severity of the injuries. Other space occupying lesions: This
includes brain tumors and cysts that will likely have regions of reduced
activity.
The visualization system can also be used in the diagnosis and treatment of
chronic pain, for example, by measuring activity in cortical areas such as the
anterior cingulate gyms. Chronic pain can include muscular and non- muscular
pain, neuropathic pain, fibromyalgia and myofascial pain syndrome. Specific
learning disorders can also be diagnoses, including disorders of the ability
to
acquire knowledge and, specifically, some specific disorders that have been
associated with excess theta or decreased alpha and/or beta powers. The system
can also diagnose disorders involving thought, feeling or combinations of the
two,
such as disorders of planning and foresight as well as of sentiments involving
a
combination of a thought and a feeling such guilt over an error, or the
feeling of
pride in an achievement.
CA 02779813 2012-04-26
WO 2011/051807
PCT/1B2010/002973
-9-
The visualization system can also be used in the diagnosis and treatment of
memory disorders, including disorders of memory storage and memory retrieval,
reasoning disorders, including disturbances of making logical inferences, and
evaluative disorders, including disorders involving the formation of
evaluative
judgments as to what the person deems to be good or had. Similarly, the system
can be applied to disorders of comprehension and understanding, such as
agnosia,
disorders of the self and the self-image, including disorder in self-
representation
and disorders of identity, and other circadian disorders affecting the cortex.
Additional application of the system include detection and treatment of
movement
disorders, such as essential tremor and restless leg syndrome, social and
conduct
disorders, psychosomatic, speech and communication disorders, impulse control
disorders, post traumatic stress disorder, and truth disorders, including any
disorder
in the brain of assigning an idea to the category of being true or untrue. It
can also
be used to diagnosis brain death.
The techniques and methods described herein can also be used for medical
research and brain physiological research to understand the causes of
diseases,
human behavior, and mental processing, specifically as an aid to researching
mental, psychological, and physical cortical processes and states. For
example, the
visualization technique can be used as an aid in the characterization of
normal
mental processes and normal physiological events and states, a tool in
research into
neural pathways and the discovery and further elucidation of migratory
patterns of
cortical electrical activity, and as an interpretation tool EEG recordings of
normal
and abnormal mental activity by revealing the sites of generators in the brain
and
the angular movements of electrical fields that contribute to EEG waveforms.
Further, the ability to accurately trace the movement of current throughout
the
brain provided by the visualization system aids in the understanding of the
translational and rotational movement of electrical fields produced by the
brain as
well as the recognition of functional elements of the brain, i.e. areas of the
brain
that work together to help perform a particular mental function. It will be
appreciated that this research can aid in the characterization of a number of
brain
disorders, conditions, and states such as those listed previously so that
effective
diagnoses, monitoring methods and treatments can be developed.
CA 02779813 2012-04-26
WO 2011/051807
PCT/1B2010/002973
-10-
The visualization system can also be used as an aid in the characterization
of thoughts and ideas, feelings and emotions, beliefs, sensations, learning,
understanding and comprehension, reasoning, desire and motivation, memory,
evaluative processing, including processing of pleasure and pain, truth
processing,
planning, judgment, movement processing, speech and communication,
representation, including self-representation, predispositions, and planning.
Further, the system can be used in the process of drug development by helping
determine the areas of the cerebral cortex where the electrical activity is
affected
by experimental and established pharmaceuticals, hence providing insight on
the
locations and mechanisms of action of these drugs.
Finally, the visualization system can be employed for non-medical
purposes, such as games, entertainment, and industrial and mechanical
applications. For example, the visualization and localization techniques could
be
used for training or controlling assistive devices. Alternatively, the system
can be
used to determine if a person is telling the truth or lying. Signature images
and
signature data patterns for lying and truthfulness may be identified through
research trials utilizing the present invention. The trials may involve
measuring
people who are instructed to lie or instructed to tell the truth and who
comply with
this request while having their brain electrical activity recorded. The trial
may also
be conducted on people who actually lie when the person administering the test
does not know during the testing session that the test subject is lying; this
will
capture cortical activity during actual lies. These two trials will provide a
dataset
of electrical activity of lying versus truthfulness and this dataset will
later be used
when testing future subjects for lying and will serve as a means for
comparison. A
conclusion that a patient has lied can be drawn if the examiner observes the
display
of a signature pattern for lying that is present in the database.
Alternatively, it is
possible to use statistical analysis of the data patterns to aid the examiner
in
identifying a lie.
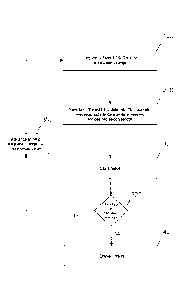
A general flowchart of a method in accordance with an aspect of the
invention is depicted in Fig. 1. At step 100, EEG data is filtered to provide
EEG
data for a desired frequency range within a total range of frequencies. The
EEG
data can be filtered using a frequency filter algorithm such as a fast Fourier
CA 02779813 2012-04-26
WO 2011/051807
PCT/1B2010/002973
-11-
transform or windowed-sinc. The resulting EEG data then only contains
frequencies ranging from the start to the end of that particular band.
In step 200, the 3-D electrical activity of the cerebral cortex is
reconstructed by an inverse-solution approximation from the source EEG data
into
a 3-fl-solution space comprising a plurality of voxels that define the regions
of the
brain occupied by the cerebral cortex. The 3-fl-transformed EEG data is
averaged
for each region over a desired window of time, referred to as an epoch, to
obtain a
summary of the electrical activity for that epoch. By averaging the data,
consistent
activity within the brain is emphasized while minimizing the effect of
transient
activity that may appear throughout an EEG recording. The averages can be
taken
over any of several levels of detail, including voxels. Brodmann areas, minor
anatomy areas called gyrii, and lobes. The averaged values themselves can
represent the magnitude of electrical activity for each region, and/or the
direction
vectors for the electrical activity for each region.
At step 300, the averaged data is stored. The data can be stored in a large
memory buffer, or provided directly to any sort of magnetic, optical, or flash-
based
storage. At step 325, it is determined if all desired frequency bands have
been
filtered, transformed and averaged. If so, the analysis is finished. Otherwise
(N),
the next frequency range is selected, according to a desired interval value,
at
step 350. For example, if a frequency range from four hertz to four hundred
hertz
is being analyzed in four-hertz increments, an eight to twelve hertz interval
is
selected immediately after a four to eight hertz interval has been processed.
Once
all frequency intervals have been processed, the results are then displayed at
an
associated display at step 400. For example, the activity in each of the
plurality of
voxels can be illustrated as a two-dimensional or three-dimensional image of
all or
a portion of the brain. An EEG generator is an electrical activity in the
brain that is
responsible for the waveforms seen on EEG. Source localization using inverse
solutions may help to find generators. The visualization system can be used to
help localize and isolate generators of interest from other generators in the
brain.
For example, the measured values can be evaluated to determine a frequency
interval and a location associated with a given event seen in the raw EEG
data.
CA 02779813 2012-04-26
WO 2011/051807
PCT/1B2010/002973
-12-
As described previously, the measured activity can be used for any of a
number of applications. For example, the visualization system can be used as a
research tool to discover electrical biomarkers of brain states, or normal
brain
events, or diseased brain states or diseased brain events. A biomarker is an
objective and measurable indicator of a pathogenic or physiologic (normal)
biological process. A diagnostic biomarker is a biological marker that
indicates the
presence of a disease. It will be appreciated that the cortical activity
produced by a
system in accordance with present invention can be processed statistically to
identify biomarkers from collected data. For the purposes of this document,
the
electrical activity occurring during making up a lie or lying is assumed to be
a
physiologically normal brain function. The system can be used to discover
electrical biomarkers for events occurring in the brain while formulating a
truthful
expression or formulating a lie (i.e., biomarkers for lying and truth
telling). For
example, the system could be used to identify electrical biomarkers, which
could
be signature images and signature data patterns for lying and truthfulness,
and the
cortical activity of a subject can be measured after stimulating him or her
with a
question or other stimulus useful in stimulating his or her brain, such as
showing
the subject a murder weapon or other significant piece of evidence. The
subject's
reaction can be measured and compared to biomarkers found in an earlier
research
phase.
The system can be used to isolate electrical biomarkers of normal
physiological events. For example, during sleep, the sleep spindle waveforms
are
considered to be an EEG biomarker for stage 2 sleep. The system can be used to
make 2D and 3D images and paired histograms of the generators of these
spindles.
These biomarkers include average current density images over the duration of a
sleep spindle for the specific frequency band of the spindle. The system can
also
be used on individuals to discover the presence or absence of known electrical
biomarkers that were found during earlier research.
The data tables produced by the system can also be evaluated statistically
for the purpose of diagnosis. For example, to diagnose a given disease, the
cortical
activity of a particular subject that has not been diagnosed can be measured
compared to a database containing measurements from subjects having the
CA 02779813 2012-04-26
WO 2011/051807
PCT/1B2010/002973
-13-
disorder and/or to a normative database, including data from normal controls.
If
the subject's results are unlike the controls and like the subjects having the
disorder, then the patient can be diagnosed with the disorder. This would be
based
on biomarkers for the disorder found during the research phase. For example, a
biomarker for Alzheimer's might include reduced activity found in memory areas
of the brain.
Fig. 2 depicts one implementation of a method in accordance with an aspect
of the present invention. Steps 100, 200, 300, and 350 of Fig. 2 are similar
to their
corresponding steps in Fig. 1 and are not described again in the interest of
brevity.
The illustrated implementation utilizes a windowed-sinc filter for step 100,
the
LORETA algorithm in a 6239-voxel solution space based on the ICBM152 dataset
for step 200, and stores the result in a large random access memory (RAM)
buffer
at step 300.
At step 50, each of a desired frequency range, a frequency interval, an
averaging window size, a method of averaging, and a level of binning detail
are
selected. The selection can be selected by a user at a user interface in a
software
implementation of the illustrated method. The desired frequency range is
defined
by selected lowest and highest frequencies to be analyzed ¨ for example,
0-1024 Hz is an example of a desired frequency range.
The frequency interval defines the spacing and width of each frequency
band within the desired frequency range. For example, with a spacing and width
of 4 Hz would mean that 0-4 Hz, 4-8 Hz, 8-12 Hz, 12-16 Hz,... until
1020-1024 Hz would be examined within a desired range of 0 Hz to 1024 Hz. In
some applications, the frequency bands will not be contiguous, such that the
spacing of the frequency bands and the width as separate parameters. For
example,
where the frequency interval defines a spacing of 4 Hz, and width of 1 Hz,
frequency bands of 0-1 Hz, 4-5 Hz, 8-9 Hz, 12-13 Hz, and so on until
1020-1021 Hz, would be analyzed.
The averaging window represents the length of data, measured in seconds
or in frames with the number of frames is equal to the hardware sampling rate
multiplied by however many seconds, to average in order to produce one data
point. For example, if an averaging window of 3072 frames, or three seconds at
CA 02779813 2012-04-26
WO 2011/051807
PCT/1B2010/002973
-14-
a 1024 Hz sampling rate, were chosen, then for every 3072 frames in the EEG
data, a single average number would be generated. If an EEG file consisted
of 12000 frames, and the solution space consisted of 1000 voxels, then there
would
be 12,000,000 data points. With averaging, the four averaged data points would
be
generated for a particular region out of the 12000 frames, resulting in 4000
data
points in total.
The illustrated method includes three methods by which averaging can be
performed, although it will be appreciated that other methods can be utilized
¨ a
linear average, a "delta-sum" average, and a 'Poisson' average. A linear
average is
simply the arithmetic mean, determined as the sum of the values divided by the
number of values. The "delta-sum" average represents the sum of the delta
values
divided by the number of values, where a delta value is the absolute value of
the
difference in current density value for one area from frame iii to frame n.
Essentially, the delta-sum average represents an average change in the
activity of a
given region between subsequent frames of the data set. The 'Poisson' average
keeps track of the region with the top electrical activity for each frame
within a
buffer the size of the solution space and then divides each value of the
buffer by
the averaging window size. For example, if voxel #23 had the highest activity
532
times within a 1000 frame window, and voxel #444 had the highest activity 231
times within the same window, the average values within the buffer after 1000
frames would be 0.532 for voxel #23 (523/1000) and 0.231 for voxel #444. The
Poisson average provides an accessible way of quickly summarizing the regions
of
the brain experiencing heightened activity for a given epoch for a physician
or
researcher.
The data type is the type of data that is averaged, which can be either
current densities or vectors. When EEG data is transformed into 3-D electrical
activity by the inverse solution approximations, four quantities are produced
for
each voxel within the solution space: three vector components, representing X,
Y,
and Z components of the EEG data, and one scalar. The scalar quantity is the
length of the 3-D vector and is known as the current density. Averaging of
either
quantity is possible with the above methodology.
CA 02779813 2012-04-26
WO 2011/051807
PCT/1B2010/002973
-15-
Binning detail refers to the physical resolution, or level of detail of the
analysis. If the averaging is not performed based on voxels, the smallest
discrete
unit of the measured data, then each averaging region consists of a list of
voxels
that comprises the region. The average electrical activity of the region is
determined by the average values for the voxels comprising the region. At
step 375, the final data is stored on a recordable computer readable medium.
In the
illustrated implementation, the recordable medium is a hard disk. The
structure of
the recorded data in the illustrated implementation is as follows:
Byte 0-4 ¨ number of data blocks (signed integer)
Bytes 4-end of file ¨ a plurality of data blocks arranged sequentially, each
as described below:
A Sinkle Data Block Structure
byte 0-4: method of averaging (signed integer)
byte 4-8: binning detail (signed integer)
byte 8-12: data type (signed integer)
byte 12-267: name of the data block (byte array 12551)
byte 267-271: number of data points per frequency band (signed
integer), denoted as dataSize
byte 271-275: low end of frequency range (floating point)
byte 275-279: high end of frequency range (floating point)
byte 279-283: increment between frequency bands (floating
point)
byte 283-287: number of frequency bands examined in this data
block (signed integer), denoted as nunTreqs
byte 287-291: number of averaging windows (signed integer)
denoted as epochs
byte 291-295: number of frames per averaging window (signed
integer)
byte 295-299: number of variables per data point (current
density = 1, vectors = 3; signed integer) denoted as
nums
CA 02779813 2012-04-26
WO 2011/051807
PCT/1B2010/002973
-16-
byte 299-299+size: the averaged data;
where size = dataSize * numFreq,s' *
epochs * nutns;
(floating point array), arranged in a 4D array:
data/frequency band][data point][epoch] [variable
of data point]
byte 299+size-299+size*2 the standard
deviations of the averaged data
(same format as above; floating point array)
It will be appreciated that localization system and methods in accordance
with the present invention provide an efficient method for summarizing EEG
data
for a human operator. In general, EEG data is somewhat opaque to a user, and
significant processing is necessary to locate desired information from the
returned
signals. By automating the spectral analysis of the EEG data and representing
average levels of neural activity in various regions across the brain, the
data can be
analyzed more generally, allowing for a general display of the measured neural
activity. Accordingly, a user can readily identify portions of the brain
responsible
for given frequencies of neural activity even where such frequencies were not
originally known to be of interest, greatly increasing the flexibility of the
analysis.
Fig. 3 depicts three exemplary methods by which the processed data can be
visualized, utilized by the current reduction to practice. Fig. 3A depicts the
entirety of the data in the form of a two-dimensional grid. The X-axis
represents
increasing frequency, and each square represents one frequency band. The
example shown here is displaying one hundred frequency bands, starting at 0-4
Hz
on the far left, to 396-400 Hz on the far right. The Y-axis represents the
regions
comprising the solution space. In the present example, left Brodmann area 1 is
shown at the top, and right Brodmann Area 56 is shown at the bottom. The
intensity of the square represents the magnitude of the electrical activity in
this
example. When displaying vector quantities, each square is further divided
into
three, displaying the magnitudes of each vector component.
Fig. 3B depicts the average current densities of a selected frequency band
in three-dimensions based on the binning detail. The example shown here is
displaying the average current densities of each Brodmann area for 12-16 Hz
in 3-D. Fig. 3C depicts the average current densities of a selected frequency
band
CA 02779813 2012-04-26
WO 2011/051807
PCT/1B2010/002973
-17-
in two-dimensional axial tomographic slices, based on the chosen binning
detail.
The bottom-most surface of the solution space is shown in top-left, and the
top-
most is at the bottom-right. Sagital and coronal axes are also possible. The
example shown here depicts the same data as in Fig. 3B. Fig. 3D depicts the
average current densities of a selected frequency band as a horizontal 'paired
histogram', where the lengths of the horizontal bars correspond to the
averaged
current values of the area specified on the Y-axis. The portion of the bar
that
extends left of the y-axis represents areas within the left hemisphere of the
cerebral
cortex and the portion of the bar that extends right likewise represents areas
on the
right hemisphere. A final step (not shown) is the display of the
aforementioned
graphical information on a computer monitor.
Fig. 4 illustrates a computer system 500 that can be employed to implement
the systems and methods described herein as computer executable instructions,
stored on a computer readable medium and running on the computer system. The
computer system 500 can be implemented on one or more general purpose
networked computer systems, embedded computer systems, routers, switches,
server devices, client devices, various intermediate devices/nodes and/or
stand
alone computer systems. Additionally, the computer system 500 can be
implemented as part of the computer-aided engineering (CAE) tool running
computer executable instructions to perform a method as described herein.
The computer system 500 includes a processor 502 and a system
memory 504. Dual microprocessors and other multi-processor architectures can
also be utilized as the processor 502. The processor 502 and system memory 504
can be coupled by any of several types of bus structures, including a memory
bus
or memory controller, a peripheral bus, and a local bus using any of a variety
of
bus architectures. The system memory 504 includes read only memory
(ROM) 508 and random access memory (RAM) 510. A basic input/output system
(BIOS) can reside in the ROM 508, generally containing the basic routines that
help to transfer information between elements within the computer system 500,
such as a reset or power-up.
The computer system 500 can include one or more types of long-term data
storage 514, including a hard disk drive, a magnetic disk drive, (e.g., to
read from
CA 02779813 2012-04-26
WO 2011/051807
PCT/1B2010/002973
-18-
or write to a removable disk), and an optical disk drive, (e.g., for reading a
CD-ROM or DVD disk or to read from or write to other optical media). The long-
term data storage can be connected to the processor 502 by a drive interface
516.
The long-term storage components 514 provide nonvolatile storage of data, data
structures, and computer-executable instructions for the computer system 500.
A
number of program modules may also be stored in one or more of the drives as
well as in the RAM 510, including an operating system, one or more application
programs, other program modules, and program data.
A user may enter commands and information into the computer system 500
through one or more input devices 520, such as a keyboard or a pointing device
(e.g., a mouse). Further, the computer system 500 can receive data from one or
more sensors, such as conductive leads for an EEG system. These and other
input
devices are often connected to the processor 502 through a device interface
522.
For example, the input devices can be connected to the system bus by one or
more
a parallel port, a serial port or a universal serial bus (USB). One or more
output
device(s) 524, such as a visual display device or printer, can also be
connected to
the processor 502 via the device interface 522.
The computer system 500 may operate in a networked environment using
logical connections (e.g., a local area network (LAN) or wide area network
(WAN)
to one or more remote computers 530. A given remote computer 530 may be a
workstation, a computer system, a router, a peer device or other common
network
node, and typically includes many or all of the elements described relative to
the
computer system 500. The computer system 500 can communicate with the
remote computers 530 via a network interface 532, such as a wired or wireless
network interface card or modem. In a networked environment, application
programs and program data depicted relative to the computer system 500, or
portions thereof, may be stored in memory associated with the remote
computers 530.
Fig. 5 illustrates one implementation of a system 600 in accordance with an
aspect of the present invention. The system 600 includes an electrode array
602
configured to take measurements of electrical potential in a region on
interest, such
as along the scalp of a patient. The measurements from the electrode array 602
are
CA 02779813 2012-04-26
WO 2011/051807
PCT/1B2010/002973
-19-
amplified at an amplifier 604, and provided to a data processing apparatus
610. It
will be appreciated that the data processing apparatus can be implemented as
software running on a general purpose computer, as dedicated hardware, or as
some combination of dedicated hardware and an appropriately programmed
general purpose computer.
The data processing apparatus 610 comprises a spectral decomposition
component 614 configured to filter the EEG data contained within a plurality
of
channels into desired frequency subranges within a total range of frequencies.
The
EEG data is divided using a frequency filter algorithm such as a fast Fourier
transform or windowed-sinc. Each EEG data channel then only contains
frequencies ranging from the start to the end of that particular band.
An inverse solution component 616 can apply an inverse-solution
approximation to reconstruct the 3-D electrical activity of the cerebral
cortex from
the source EEG data within a given channel into a 3-D solution space
consisting of
voxels that define the regions of the brain occupied by the cerebral cortex.
The 3-D-transformed EEG data is simultaneously averaged for each region over
the desired window of time (epoch) to obtain a summary of the electrical
activity,
or in other words, the "brain state". Averaging highlights consistent
activities
while reducing the transient activity that may appear throughout a recording.
The
available levels of detail include averaging based on voxels, Brodmann areas,
minor anatomy areas called gyrii, and lobes. The values themselves can
represent
the magnitude of electrical activity for each region, and/or the direction
vectors for
the electrical activity for each region. The constructed 3-D data can then be
provided to a user interface 618 for display at an associated output device
620,
such as video monitor or printer. For example, the output can include color-
coded
images of the 3-D data for all or a portion of the cortex, datasets giving raw
values
or average values for individual voxels, Brodmann areas, gyrii, or lobes, or
additional graphical representations of these values. The user interface 618
can be
configured to allow the user to select among a plurality of visualization
options,
such that the display can be adapted to various applications.
Fig. 6 depicts a series of images (6A-6e) which combined serve as an
example of how to use the linear average functionality in the visualization
system
CA 02779813 2012-04-26
WO 2011/051807
PCT/1B2010/002973
-90-
to find a summary of the generator activity of an EEG waveform. One must
identify a waveform of interest. In this instance, it is a vertex waveform in
the
brain of a sleeping healthy young man from stage one sleep. Fig. 6A depicts an
EEG showing a waveform of interest which is a vertex waveform (i.e., vertex
wave) just after the dark vertical line near the middle of this EEG. It
appears as the
sudden onset of complex groups of hills and valleys in all the electrodes
occupying
about two-thirds of the sixth segment from the left of the page of the EEG in
6A. A
generator is causing hills and valleys seen in all these electrodes (which are
listed
at the far left). The tallest hill is in the Cz electrode. To find the
generator
responsible for this series of shapes, the first step is to "cut.' out the
segment of
interest from the EEG containing only this waveform.
Fig. 6B shows 2-D images created by the visualization system. From these
images, it is clear, especially viewed in colour, that the strongest activity
is in the
first three bands from the left. When viewed in colour, the heavy red
pixilation
indicating strong activity. The operator can then select a frequency sub-band.
The
third band from the left is the strongest. In this case, it is the 4-6 Hz sub-
band. Fig.
6C shows six 3-D views of the surface of the brain for the linear averaged
activity
of the vertex wave for the 4-6 Hz sub-band. By inspection of these six views,
it is
apparent to one aware of the anatomy of the cortex that the generator is
coming
from the top of the brain. Fig. 6D shows axial tomography of the same vertex
wave epoch and it confirms that the neural generators for this vertex wave are
in
the upper and midline regions of the brain. For example, the fifth row of
images,
approaching the vertex of the brain, shows a diffuse pattern of symmetrical
activation. Fig. 6E demonstrates how the system helps to provide the
anatomical
names for generators of the vertex wave. It shows that the strongest activity
for
this generator for the 4-6 Hz sub-band is in the left and right paracentral
lobules
and the left and right cingulate gyrii.
CA 02779813 2012-04-26
WO 2011/051807
PCT/1B2010/002973
The present invention should not be considered limited to the particular
examples described above, but rather should be understood to cover aspects of
the
invention as fairly set out in the attached claims. Various modifications,
equivalent processes as well as numerous structures to which the present
invention
may be applicable will be readily apparent to those of skill in the art to
which the
present invention is directed upon review of the specifications.