Note : Les descriptions sont présentées dans la langue officielle dans laquelle elles ont été soumises.
CA 02843725 2014-01-30
WO 2013/022547
PCT/US2012/046586
CORRECTING TIME LAPSE SEISMIC DATA FOR OVERBURDEN AND
RECORDING EFFECTS
BACKGROUND OF THE INVENTION
1. Field of the Invention
[0001] The present to geophysical exploration, and more particularly to
processing of time
lapse or 4D seismic data for evaluation of features of interest regarding
subsurface formations
and their contents.
2. Description of the Related Art
[0002] Seismic reflectivity, also known as seismic amplitude or reflection
strength, is
related to differences in acoustic impedance between reservoir rock and
overlying strata.
Changing reservoir fluids can modify reservoir acoustic impedance which is
calculated by
multiplying seismic energy travel velocity and rock density. Seismic
reflection strength at a
reservoir boundary can vary due to fluid changes such as injection of gas or
steam, causing
changes in either density, velocity or both. Changes in temperature and
pressure also
influence the reservoir acoustic impedance. Monitoring movement of these
dynamic changes
between wells is made possible by conducting repeated time lapse seismic
surveys. In this
way fluid position is tracked over time by differencing the reflection
amplitude between two
or more surveys at different times. Other seismic attributes can be
differenced but reflection
strength is the most commonly used. Further descriptions of these types of
surveys and data
processing are contained, for example, in "Spectral analysis applied to
seismic monitoring of
thermal recovery", SEC Expanded Abstracts 12, 331-334 (1993), Eastwood et al.
(1993);
"Processing for robust time-lapse seismic analysis: Gulf of Mexico example,
Lena Field",
SEG Expanded Abstracts 17, 20-23 (1998), Eastwood et al.; "Time lapse
processing: A North
-1-
CA 02843725 2014-01-30
WO 2013/022547
PCT/US2012/046586
Sea case study", 68th Ann. Internat, Mtg., SEG, Expanded Abstracts, 1-4,
Harris et al.
(1998); "Schiehallion: A 3-D Time - Lapse Processing Case History, SEG 1999
Expanded
Abstracts; Altan et al. (1999); and "4D seismic monitoring of CO2 flood in a
thin fractured
carbonate reservoir", The Leading Edge, July 2003,691-695, Li (2003).
[0003] Reservoir characterization based on seismic observations has
required a highly
accurate seismic acquisition and processing system. For the specialized case
of integrating
time lapse seismic surveys with reservoir monitoring, accuracy requirements
have become
even more crucial since dynamic reservoir changes such as fluid movement or
pressure
changes are related to subtle differences in seismic observations. See, for
example, "Time
Lapse Seismic Reservoir Monitoring", Geophysics, Vol. 66, No. 1 (Jan.-Feb.
2001); P. 50-
53, Lumley.
[0004] Under ideal conditions, differencing two seismic observations has
been a straight
forward process so long as the resultant value is assumed to only reflect
changes at the
reservoir level. Since recorded seismic energy propagated through a geologic
overburden,
and was also subject to the recording response of the acquisition system, two
key
assumptions have been used to interpret reservoir amplitude change. These were
that
propagation effects in the geologic overburden remained the same, and that
seismic recording
systems responded identically during independent monitoring surveys at
different times.
[0005] Field studies have routinely shown these basic assumptions to be
false, One only
needs to consider the recording system can never be placed exactly in the same
surface
position, and that changes in the overburden do in fact occur. For example,
near surface
seasonal variations such as water table elevation changed the overburden
response. Even
-2-
CA 02843725 2014-01-30
WO 2013/022547
PCT/US2012/046586
daily temperature and moisture changes in the first few feet of soil affected
repeated seismic
observations.
[0006] To improve repeatability in recording, systems have been developed
that feature
permanently cemented sources and detectors, an example of which is described
in "Reservoir
monitoring using permanent sources and vertical receiver antennae", The Cere-
la-Ronde case
study, The Leading Edge, June 2001, 622-629, (Meunier et al.). Unfortunately
there still
existed possible overburden changes, especially in the near surface, that
occurred above and
below the level of permanently installed recording systems. An example of
seismic energy
above a buried system was the effect of reflections from the air/surface
interface commonly
known as "ghost energy."
[0007] Changes in overburden propagation response are routinely compensated
for during
4D seismic data processing. Although there may be several causes, overburden
changes are
usually treated as a single effect. This has been clone by conditioning the
data using
processing techniques that forced overburden measurements to be the same
between surveys,
or to be the same with those recorded in an initial survey. This processing
method prior to
differencing is commonly referred to as "cross equalization of a monitor
survey to the base
survey." Once cross equalization of the overburden was applied, corrected
reservoir
amplitudes were differenced between surveys to observe dynamic changes in the
reservoir,
such as movement of injected fluids, pressure fronts and temperature fronts.
Examples of
cross equalization are described in "Inside the cross-equalization black box",
The Leading
Edge, 15, 1233-1240, (Ross et al., 1938); "A cross-equalization processing
flow for off-the-
shelf 4-D seismic data", 68th Ann. Internat. Mtg., SEG., Expanded Abstracts,
16-19,
-3-
CA 02843725 2014-01-30
WO 2013/022547
PCT/US2012/046586
(Rickett et al., 1998); and "Seismic Low-Frequency Effects in Monitoring Fluid-
Saturated
Reservoirs", Geophysics, Vol. 69, No. 2 (Mar.-Apr. 2004); p. 522-532, Korneev
et al.
[0008] Performed as
a frequency dependent process, cross-equalization can be robust if
the frequency bandwidth is similar between two surveys. If not, then
cross equalized
surveys are limited to a common bandwidth between surveys which may lower
resolution of
the data, Another key assumption is that signal-to-noise ratios at each
processed frequency
are the same. While this may be the case for certain types of repeatable
noise, such as source
generated noise, it does not address frequency dependent noise variations
between time lapse
surveys.
[0009] Non-
repeatable frequency dependent noise may be caused by seasonal or daily
changes in near surface overburden layers. As such, cross-equalization tends
to propagate
noise present in one survey into other surveys. This effect tends to decrease
repeatability
outside the cross-equalization design window which makes it more difficult to
observe small
seismic amplitude changes caused by dynamic fluid, pressure or temperature
changes in the
reservoir.
[0010] Another
state-of-the-art 4D data processing normalization technique employs
overburden time domain windows to correct the target reservoir. The procedure
calculates an
average amplitude value from an overburden window that is divided into the
average
amplitude value of the reservoir window. Since the correction is computed in
the time
domain, all frequencies contribute to the final correction factor. Similar to
cross equalization,
deficiencies in this method arise when certain frequency bandwidths are
dominated by noise
events that vary across time lapse surveys.
-4-
CA 02843725 2014-01-30
WO 2013/022547
PCT/US2012/046586
SUMMARY OF THE INVENTION
[0011] Briefly, the present invention provides a new and improved computer
implemented
method of correcting time lapse seismic data for overburden and recording
variations present
in the data, the data being obtained in a succession of seismic surveys over a
period of time
from an area of interest regarding a subsurface reservoir beneath an
overburden. The
computer implemented method according to the present invention forms a measure
of
average amplitude of seismic energy at the reservoir in a trace in the data of
a selected one of
the time lapse surveys, and forms a measure of corrected reservoir amplitude
of seismic
energy at the reservoir in the trace in the data of the selected one of the
time lapse surveys. A
correction scalar measure is formed indicating the ratio of the measure of
corrected reservoir
amplitude to the average amplitude at the reservoir in the trace of the
selected one of the time
lapse surveys, and the correction scalar applied to the trace of the selected
one of the time
lapse surveys to form a corrected amplitude seismic trace. A record is then
formed of the
corrected amplitude seismic trace.
[0012] The present invention also provides a new and improved data
processing system
for correcting time lapse seismic data for overburden and recording variations
during the
course of acquiring the time lapse seismic data from an area of interest
regarding a subsurface
reservoir in a succession of seismic surveys over a period of time in the area
of interest. The
data processing system includes a processor which forms a measure of average
amplitude of
seismic energy at the reservoir in a trace in the data of a selected one of
the time lapse
surveys. The processor also forms a measure of corrected reservoir amplitude
of seismic
energy at the reservoir in the trace in the data of the selected one of the
time lapse surveys,
and forms a correction scalar measure indicating the ratio of the measure of
corrected
reservoir amplitude to the average amplitude at the reservoir in the trace of
the selected one
of the time lapse surveys. =The data processing system according to the
present invention
-5-
applies the correction scalar to the trace of the selected one of the time
lapse surveys to form
a corrected amplitude seismic trace, and forms a record of the corrected
amplitude seismic
trace.
[0013] The
present invention further provides a new and improved data storage device
having stored in a computer readable medium computer operable instructions for
causing a
data processing system comprising at least one processor unit and an output
display to correct
time lapse seismic data for overburden and recording variations during the
course of acquiring
the time lapse seismic data from an area of interest regarding a subsurface
reservoir in a
succession of seismic surveys over a period of time in the area of interest.
The instructions
stored in the data storage device cause the data processing system to form a
measure of average
amplitude of seismic energy at the reservoir in a trace in the data of a
selected one of the time
lapse surveys, and to form a measure of corrected reservoir amplitude of
seismic energy at the
reservoir in the trace in the data of the selected one of the time lapse
surveys. The instructions
stored in the data storage device cause the data processing system to also
form a correction
scalar measure indicating the ratio of the measure of corrected reservoir
amplitude to the
average amplitude at the reservoir in the trace of the selected one of the
time lapse surveys, and
apply the correction scalar to the trace of the selected one of the time lapse
surveys to form a
corrected amplitude seismic trace. The instructions stored in the data storage
device according
to the present invention also cause the data processing system to form a
record of the corrected
amplitude seismic trace.
[0013A] The
present invention further provides a new and improved computer
implemented method of correcting time lapse seismic data for overburden and
recording
variations present in the data, the data being obtained in a succession of
seismic surveys over
a period of time from an area of interest regarding a subsurface reservoir
beneath an
-6-
CA 2843725 2017-11-16
overburden. The method is comprised of the computer implemented steps of (1)
forming a
measure of average amplitude of seismic energy at the reservoir in a trace in
the data of a
selected one of the time lapse surveys, (2) forming a measure of corrected
reservoir amplitude
of seismic energy at the reservoir in the trace in the data of the selected
one of the time lapse
surveys, (3) forming a correction scalar measure indicating the ratio of the
measure of corrected
reservoir amplitude to the average amplitude at the reservoir in the trace of
the selected one of
the time lapse surveys, (4) applying the correction scalar to the trace of the
selected one of the
time lapse surveys to form a corrected amplitude seismic trace, and (5)
forming a record of the
corrected amplitude seismic trace, wherein the step of forming a measure
indicating the ratio
comprises the step of (a) forming a ratio of the amplitude spectrum at the
reservoir to the
amplitude spectrum at the overburden.
1001313] The
present invention further provides a new and improved data processing
system for correcting time lapse seismic data for overburden and recording
variations during
the course of acquiring the time lapse seismic data from an area of interest
regarding a
subsurface reservoir in a succession of seismic surveys over a period of time
in the area of
interest. The data processing system includes a processor performing the steps
of (1) forming
a measure of average amplitude of seismic energy at the reservoir in a trace
in the data of a
selected one of the time lapse surveys, (2) forming a measure of corrected
reservoir amplitude
of seismic energy at the reservoir in the trace in the data of the selected
one of the time lapse
surveys, (3) forming a correction scalar measure indicating the ratio of the
measure of
corrected reservoir amplitude to the average amplitude at the reservoir in the
trace of the
selected one of the time lapse surveys, (4) applying the correction scalar to
the trace of the
selected one of the time lapse surveys to form a corrected amplitude seismic
trace, and (5)
forming a record of the corrected amplitude seismic trace, wherein the
processor in performing
-6A-
CA 2843725 2017-11-16
the step of forming a measure of indicating the ratio performs the steps of
(a) forming a ratio
of the amplitude spectrum at the reservoir to the amplitude spectrum at the
overburden.
BRIEF DESCRIPTION OF THE DRAWINGS
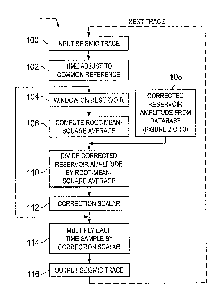
100141 Figure 1
is a functional block diagram or flow chart of a sequence of correction of
time lapse seismic data according to the present invention.
-6B-
CA 2843725 2017-11-16
CA 02843725 2014-01-30
WO 2013/022547
PCT/US2012/046586
[0015] Figure 2 is a functional block diagram or flow chart of a portion of
the sequence of
correction of time lapse seismic data of Figure 1.
[0016] Figure 3 is a functional block diagram or flow chart of an
alternative portion of a
sequence of correction of time lapse seismic data of Figure 1,
[0017] Figure 4 is a schematic diagram of a computer system for correction
of time lapse
seismic data according to the present invention.
[0018] Figure 5A is a plot of a simulated time lapse seismic survey at a
location above a
producing hydrocarbon reservoir.
10019] Figure 5B is a plot of root-mean-square (RMS) amplitude as a
function of time
obtained from a window in the plot of Figure 5A,
[0020] Figure 6A is a plot of a simulated time lapse seismic survey at the
same location
above a producing hydrocarbon reservoir as Figure 5A with seasonal variations
in near
surface seismic velocity added.
[0021] Figure 6B is a plot of root-mean-square (RMS) amplitude as a
function of time
obtained from a window in the plot of Figure 6A.
[0022] Figure 7A is a plot of a simulated time lapse seismic survey at the
same location
above a producing hydrocarbon reservoir as Figure 5A with seasonal variations
in the near
surface overburden layer added.
[0023] Figure 7B is a plot of root-mean-square (RMS) amplitude as a
function of time
obtained from a window in the plot of Figure 7A,
-7-
CA 02843725 2014-01-30
WO 2013/022547
PCT/US2012/046586
[0024] Figure 8A is a plot of a simulated time lapse seismic survey at the
same location
above a producing hydrocarbon reservoir as Figure SA with seasonal variations
in the near
surface overburden layer normalized according to conventional cross-
equalization
techniques.
[0025] Figure 8B is a plot of root-mean-square (RMS) amplitude as a
function of time
obtained from a window in the plot of Figure 8A.
[0026] Figure 9A is a plot of a simulated time lapse seismic survey at the
same location
above a producing hydrocarbon reservoir as Figure 8A with seasonal variations
in the near
surface overburden layer normalized according to conventional cross-
equalization
techniques.
[0027] Figure 98 is a plot of root-mean-square (RMS) amplitude as a
function of time
obtained from a window in the plot of Figure 9A.
[0028] Figure 10A is a plot of a simulated time lapse seismic survey at the
same location
above a producing hydrocarbon reservoir as Figure 6A with seasonal variations
in the near
surface overburden layer normalized according to conventional time domain
normalization
techniques.
[0029] Figure 10B is a plot of root-mean-square (RMS) amplitude as a
function of time
obtained from a window in the plot of Figure 10A.
[0030] Figure 11A is a plot of a simulated time lapse seismic survey at the
same location
above a producing hydrocarbon reservoir as Figure 6A after processing in
accordance with
the present invention.
-8-
CA 02843725 2014-01-30
WO 2013/022547
PCT/US2012/046586
[0031] Figure 11B is a plot of root-mean-square (RMS) amplitude as a
function of time
obtained from a window in the plot of Figure 1 1A.
DETAILED DESCRIPTION OF THE PREFERRED EMBODIMENTS
[0032] According to the present invention, time lapse or 4D seismic data
are corrected for
geologic overburden and seismic recording system effects. The method
normalizes each time
lapse survey within itself rather than across surveys. The data from a survey
at one time of
interest is processed within a selected frequency band, and the survey data is
normalized to
corrected reservoir amplitude. As will be set forth, the present invention
uses a limited range
of frequencies to derive the corrected reservoir amplitude.
[0033] The corrected time lapse amplitude results are used to extract
reservoir amplitudes
from the data of that same survey. Frequencies where overburden signal-to-
noise ratios vary
dramatically between time lapse surveys may then be avoided in processing of
other data
from the area of interest.
[0034] Processing according to the present invention is performed on pre-
stack seismic
data. The present invention also does not require a baseline survey. The
present invention
in addition does not require a cross equalization procedure between time lapse
surveys.
Further, the present invention does not require a coordinate adjustment
procedure.
[0035] In the drawings, a flow chart F (Figure 1) composed of a set of
correction steps
illustrates the structure of the logic of the present invention as embodied in
computer proaram
software. The flow chart F is a high-level logic flowchart which illustrates a
method
according to the present invention of correcting time lapse seismic data for
overburden and
recording system effects. Those skilled in the art appreciate that the flow
charts illustrate the
structures of computer program code elements that function according to the
present
invention. The invention is practiced in its essential embodiment by computer
components
-9-
CA 02843725 2014-01-30
WO 2013/022547
PCT/US2012/046586
that use the program code instructions in a form that instructs a digital data
processing system
D (Figure 4) to perform a sequence of processing steps corresponding to those
shown in the
flow chart F.
[0036] The flow chart F of Figure 1 contains a preferred sequence of steps
of a computer
implemented method or process for correcting time lapse seismic data for
overburden and
recording effects according to the present invention is illustrated
schematically. The flow
chart F uses, as will be set forth, a measure of corrected reservoir amplitude
from either a set
of transform processing steps T (Figure 2) or an alternate set of transform
processing steps T-
1 (Figure 3). The process of the present invention provides several
improvements to the
conventional normalization techniques.
[0037] The flow chart F is a high-level logic flowchart illustrates a
method according to
the present invention of correcting time lapse seismic data for overburden and
recording
effects. The method of the present invention performed in the computer 20
(Figure 4) of the
data processing system D can be implemented utilizing the computer program
steps of
Figures 1, 2 and 3 stored in memory 22 and executable by system processor 24
of computer
20. The input data to processing system D are time lapse or 4D seismic survey
data of the
conventional type obtained from an area of the earth overlying a subsurface
reservoir of
interest. As will be set forth, the flow chart F illustrates a preferred
embodiment of a
computer implemented method or process for correcting time lapse seismic data
for
overburden and recording effects. As shown in the flow chart F of Figure 1, a
preferred
sequence of correction steps based on corrected reservoir amplitude determined
in
accordance with the present invention, either in the form of transform
processing steps T
(Figure 2) or T-1 (Figure 3).
-10-
CA 02843725 2014-01-30
WO 2013/022547
PCT/US2012/046586
[0038] During step 100 (Figure 1) of the flow chart F, an input seismic
trace such as
shown at 64 (Figure 6A) from a simulated time lapse survey of the area of
interest regarding
a subsurface reservoir beneath an overburden is read from database storage in
the data
processing system D. Figure 5A, as well as Figures 6A, 7A, 8A, 9A, 10A and
11A,
represents a simulated time lapse seismic surveys collected every other or on
an alternate day
basis over an acquisition time lasting 720 days from an area of interest.
During step 102
(Figure 1), the arrival times of the seismic traces are adjusted to a common
arrival time.
During step 104, a time window in the time lapse survey data known to be at
the time of a
target reservoir event in the data is selected. An example target reservoir
event is illustrated
at a time window 64 in the time lapse survey data of Figure 6A.
[0039] Processing then proceeds to step 106, where an average, or root mean
square
(RMS), amplitude of the seismic energy amplitude over the time window 64 in
the input trace
of current interest is determined. The amplitude determined during step 106
represents the
uncorrected reservoir amplitude.
[0040] During step 108, a measure of corrected reservoir amplitude
determined in a
manner to be described during the transform processing T (Figure 2) or T-1
(Figure 3) is
obtained from memory 22 of data processing system D. During step 110 (Figure
1) the
uncorrected reservoir amplitude from step 106 is divided into the corrected
reservoir
amplitude obtained during step 108 to derive a correction scalar, which is
also stored in
memory 22 as indicated at step 112. During step 114 the individual time
samples in the input
seismic irace obtained in step 102 are then multiplied by the correction
scalar from step 112.
[0041] During step 116, a record is formed of the corrected seismic trace.
The record is
formed by storing the corrected seismic trace in database memory 22, and an
output display
may also be formed. Processing returns to step 100 and the sequence shown in
Figure 1
-11-
CA 02843725 2014-01-30
WO 2013/022547
PCT/US2012/046586
continues on the next input trace from the time lapse survey data. Processing
of the input
traces over the duration of the time lapse survey of the area of interest
continues until all
traces in all time lapse surveys are processed.
[0042] The computer implemented processing sequence for correction for
transform
processing T (Figure 2), begins at step 200 where an input seismic trace such
as shown at 64
from one time lapse survey of the area of interest for a reservoir is read
from database storage
in the data processing system D. The selected seismic trace and the others
from the surveys
have preferably been pre-processed with conventional relative amplitude
processing
procedures. The relative amplitude processing is performed to retain as far as
possible
reflection amplitudes that represent the acoustic impedance of each geologic
layer in the
overburden and reservoir while attenuating random noise.
[0043] During step 202 of the transform processing T (Figure 2), the
arrival time of the
target reservoir event in the selected seismic trace is adjusted to a common
arrival time.
Processing then proceeds to two sequences which are preferably performed in
parallel, as
shown in Figure 2, to select two time windows from the selected seismic trace.
During step
204, a time window such as that shown at 64 known to be at the time of a
target reservoir
event in the data is selected is selected to represent the target reservoir
window. During step
206, a time window such as that shown at 93 (Figure 10A) known to be at the
time of
overburden of earth structure above the target reservoir event in the data is
selected to
represent the overburden window.
[0044] Steps 208 and 210 (Figure 2) follow steps 204 and 206, respectively.
During steps
208 and 210, a Fast Fourier Transform (FFT) processing technique is performed
on the data
in the respective selected time windows 64 and 93. The output data 208a and
210a from
steps 208 and 210 are as indicated in Figure 2, in the form of a reservoir
frequency spectrum
-12-
CA 02843725 2014-01-30
WO 2013/022547
PCT/US2012/046586
and an overburden frequency spectrum. Each of the spectra is now referenced in
frequency
versus amplitude.
[0045] During step 212, the target reservoir amplitude at each frequency of
the reservoir
frequency spectrum is divided by the overburden amplitude at that same
frequency over the
same spectrum. During a step 214, a target frequency range in the respective
spectra is
chosen which is designed to avoid those frequencies contaminated by non-
repeatable noise.
During step 216, for the target range of frequencies in the respective spectra
selected during
step 214, a measure of the root mean square (RMS) amplitude for the spectra
selected as a
result of step 212 is determined. The RMS amplitude determined during step 216
represents
the corrected target reservoir amplitude.
[0046] During step 218, the corrected reservoir amplitude determined during
step 216 is
then stored in the seismic database in the data processing system D. During
step 218, quality
control plots may also be generated of the corrected reservoir amplitude.
These plots may be
profiles plotted above the seismic traces or maps referenced to recording
position and
calendar day of the seismic survey. The corrected reservoir amplitude
determined and stored
for a trace during the transform processing steps T (Figure 2) is then
available as an input
corrected reservoir amplitude for that trace during step 108 (Figure 1).
Processing to
determine corrected reservoir amplitude for another input trace is then begun
by return to step
200 and the sequence shown in Figure 2 continues on the next input trace from
the time lapse
survey data. Processing of the input traces over the duration of all time
lapse surveys of the
area of interest continues until corrected reservoir amplitude for all traces
in all time lapse
surveys are processed.
100471 Figure 3 illustrates an alternative set of transform processing
steps T-1 which may
be used in place of those shown in Figure 2. In the set of steps T-1, an input
seismic trace
-13-
CA 02843725 2014-01-30
WO 2013/022547
PCT/US2012/046586
such as shown at 50 from one time lapse survey of the area of interest is read
during step 300
from database storage in the data processing system D. The selected seismic
trace and the
others from the time lapse survey have preferably also been pre-processed with
conventional
relative amplitude processing procedures. During step 302, the arrival time of
the reservoir
event in the selected input seismic trace is adjusted to a common arrival
time.
10048] During step 304 a time frequency transform is performed of the data in
the selected
input trace. The time frequency transform may be any of several conventional
types,
including, for example, Fast Fourier Transform (FFT); Short Time Fourier
Transform
(STFT); Wigner-Ville Distribution (WVD) Transform(s); Monet Wavelet Transform;
Complex Wavelet Transform (CWT); and Adaptive Wavelet Transform (AWT). Next,
during
step 306 an average trace is formed from a range of selected range of
frequencies of the
transformed data from step 304. The selected target frequency range is
preferably one chosen
to avoid those frequencies contaminated by non-repeatable noise. During step
308 an average
or RMS reservoir amplitude is determined for the average trace data resulting
from step 306
at a time known to be at the time of a target reservoir event in the data.
During step 310 an
average or RMS overburden amplitude is determined for the average trace data
resulting from
step 306 at a time window known to be at the time window of overburden in the
data.
[0049] During step 312 the RMS reservoir amplitude determined during step
308 is
divided by the RMS overburden amplitude determined during step 310 to form a
measure of
corrected reservoir amplitude. During step 314, the corrected reservoir
amplitude step 312 is
then stored in a seismic database in the data processing system D. If desired,
quality control
plots are generated of the corrected reservoir amplitude. These plots may be
profiles plotted
above the seismic traces or maps referenced to recording position and calendar
day of the
seismic survey. The corrected reservoir amplitude is available form database
memory for the
-14-
CA 02843725 2014-01-30
WO 2013/022547
PCT/US2012/046586
correction processing sequence of Figure 1 during step 108. Processing of the
input traces
over the duration of the time lapse survey of the area of interest continues
until corrected
reservoir amplitude for all traces in all time lapse surveys are processed.
[0050] As illustrated in Fig. 4, a data processing system D according to
the present
invention includes the computer 20 having processor 22 and memory 24 coupled
to the
processor 22 to store operating instructions, control information and database
records therein.
The computer 20 may, if desired, be a portable digital processor, such as a
personal computer
in the form of a laptop computer, notebook computer or other suitable
programmed or
programmable digital data processing apparatus, such as a desktop computer. It
should also
be understood that the computer 20 may be a multicore processor with nodes
such as those
from Intel Corporation or Advanced Micro Devices (AMD), or a mainframe
computer of any
conventional type of suitable processing capacity such as those available from
International
Business Machines (IBM) of Armonk, N.Y. or other source.
[0051] The computer 20 has a user interface 26 and an output display 28 for
displaying
output data or records of processing of seismic data survey measurements
performed
according to the present invention for correcting time lapse seismic data for
overburden and
recording system effects. The output display 28 includes components such as a
printer and an
output display screen capable of providing printed output information or
visible displays in
the form of graphs, data sheets, graphical images, data plots and the like as
output records or
images.
[0052] The user interface 26 of computer 20 also includes a suitable user
input device or
input/output control unit 30 to provide a user access to control or access
information and
database records and operate the computer C. Data processing system D further
includes a
-15-
CA 02843725 2014-01-30
WO 2013/022547
PCT/US2012/046586
database 32 stored in computer memory, which may be internal memory 22, or an
external,
networked, or non-networked memory as indicated at 34 in an associated
database server 36.
[0053] The data processing system D includes program code 38 stored in memory
22 of
the computer C. The program code 38, according to the present invention is in
the form of
computer operable instructions causing the data processor 20 to correct for
time lapse seismic
data for overburden and recording effects according to the processing steps
illustrated in
Figures 1 and 2 (or 3) in the manner described above.
[0054] It should be noted that program code 38 may be in the form of
microcode,
programs, routines, or symbolic computer operable languages that provide a
specific set of
ordered operations that control the functioning of the data processing system
D and direct its
operation. The instructions of program code 38 may be may be stored in memory
22 of the
= computer C, or on computer diskette, magnetic tape, conventional hard
disk drive, electronic
= read-only memory, optical storage device, or other appropriate data
storage device having a
computer usable medium stored thereon. Program code 38 may also be contained
on a data
storage device such as server 36 as a computer readable medium, as shown.
= [0055] The method of the present invention performed in the
computer 20 can be
implemented utilizing the computer program steps of Figure 4 stored in memory
22 and
executable by system processor 24 of computer 20. The input data to processing
system D
are the input field seismic record and other data including, for example,
preprocessed data
with relative amplitudes preserved; two way arrival time of the target
reservoir; analysis time
window length about the target reservoir; and analysis time window length
about the
overburden section.
[0056] Figure 5A illustrates a group of simulated time lapse seismic
surveys collected
every other day over of an acquisition time of 720 days. Figure 5B is a plot
of reflection
-16-
CA 02843725 2014-01-30
WO 2013/022547
PCT/US2012/046586
strength 54 present over the same time as a result of a target reservoir whose
presence is
indicated in the seismic survey at window 52. The RMS amplitude 54 from the
window 52
around the target reservoir indicates a measurable change (7%) in the
reflection amplitude of
the target reservoir over the time interval in which the data were plotted.
[0057] Figure 6A illustrates the same time lapse survey data as Figure 5A,
with seasonal
variations in the near surface velocity added (+7- 5% over the first six
meters). A reservoir
event 64 has been adjusted to a common arrival time. The RMS amplitude 66
(Figure 6B) of
the reservoir event 52 is plotted above the time lapse survey traces of Figure
6A. The
reservoir amplitude 66 now varies by 25% over time interval in which the data
were plotted.
It is to be noted that the variations in amplitude do not correspond to those
indicated by the
expected trend or magnitude plotted at 66 in Figure 6A.
[0058] Figure 7A illustrates the same time lapse survey data with seasonal
variations in
the near surface velocity as in Figure 6A. The RMS amplitude 72 measured from
overburden
window 70 is plotted in Figure 7B above the time lapse survey traces of Figure
7A. Although
overburden RMS amplitude should be expected to be constant for each trace in
the survey
data of Figure 7A, it should be noted that the determined RMS amplitude 72
varies according
to seasonal changes in the near surface velocity. The expected reservoir RMS
amplitude is
also plotted at 74 in Figure 78,
[0059] Figure 8A illustrates a data plot obtained by conventional industry
standard cross-
equalization techniques to the time lapse survey data of Figure 7A. The time
lapse surveys of
Figure 8A have been cross-equalized to the starting day of the time lapse
survey, using the
same overburden window 70 of Figure 7A and 8A as a reference. After cross-
equalization, a
plot 80 from the overburden window is, as would be expected. constant. This
response is
-17-
CA 02843725 2014-01-30
WO 2013/022547
PCT/US2012/046586
consistent with the geologic overburden model. The expected reservoir
amplitude is also
plotted at 82.
[0060] Figure 9B contains a plot 90 of reservoir amplitude after
application of industry
standard cross-equalization techniques to the time lapse survey data of Figure
7A. The plot is
displayed again over the trace data of Figure 9A. Despite the overburden being
successfully
cross-equalized as discussed above regarding Figures 8A and 8B, near surface
variations in
the form of large amplitude variations are still present in the data obtained
from the reservoir
level indicated at 90. The expected reservoir amplitude at reservoir event 91
is also plotted at
92.
[0061] Figure 10B begins with a measure of reservoir amplitude from time
lapse survey
data of Figure 10A after application of industry standard amplitude
normalization techniques.
The time lapse surveys with near surface variations are then each normalized
on a day to day
basis by dividing the RMS reservoir amplitude 94 for that day by RMS amplitude
of
overburden 93. The resultant RMS amplitude for the reservoir plotted at 95 can
be seen to be
more accurate than the results obtained from conventional cross equalization
of Figure 9A
which are plotted at 90 in Figure 9B. The RMS reservoir amplitude plotted at
95 can be seen
to be more accurate, but large amplitude variations due to near surface
velocity changes are
still evident. The expected reservoir amplitude is also plotted at 92.
[0062] Figure 11B contains a plot 96 of RMS reservoir amplitudes according
to the
present invention on time lapse survey data of Figure 11A. The RMS reservoir
amplitude
plotted at 96 can be seen to more closely track expected reservoir response
plotted at 97 than
the plot 90 obtained from conventional cross equalization (Figure 9B) and the
plot 95
obtained from time domain normalization (Figure 10B). The processing
techniques
according to the present invention can thus be used to produce the best match
of the expected
-18-
CA 02843725 2014-01-30
WO 2013/022547
PCT/US2012/046586
reservoir response among the three methods. Further, the results of the
present invention do
not show residual amplitude anomalies caused by variations in the near
surface.
[0063] It can be thus be seen that using the present invention to select a
frequency band
within one survey to extract reservoir amplitudes can avoid those frequencies
where
overburden signal-to-noise ratios vary dramatically between time lapse
surveys.
[0064] Another advantage of the present invention is that it does not
require a surface
coordinate adjustment procedure. This affords advantages over conventional
procedures
comparing two surveys, such as cross equalization, which require additional
processing for
surface coordinate adjustment. The present invention thus represents a cost
savings in project
turnaround time and an opportunity to avoid adding processing errors into the
data.
[0065] Further, as has been noted, using the present invention on model
data (Figure 11B)
has shown that dynamic reservoir amplitude changes on the order of 7% can be
recovered in
the presence of overburden amplitude variations in the range of 25%. The same
models show
that current-state-of-the-art methods such as cross-equalization and time
domain
normalization are not successful in determining the correct 7% amplitude
change at the
reservoir (Figures 9B and 10B).
[0066] From the foregoing, it can be seen that correcting time lapse
seismic data for
geologic overburden and seismic recording system effects according to the
present invention
provides improvements over state-of-the-art normalization techniques. The
present invention
is especially beneficial to reservoir monitoring observations that employ time
lapse seismic
surveying. By improving the accuracy of time lapse seismic measurements a
positive effect
is created for production decisions made by reservoir management, especially
during
enhanced oil recovery operations. A potential operating cost saving during
seismic
-19-
CA 02843725 2014-01-30
WO 2013/022547
PCT/US2012/046586
monitoring may also be available by relaxing the requirement for burying
sources and
detectors below near surface problem zones.
[0067] As has been set forth, the present invention normalizes each time
lapse survey
within itself rather than across surveys. The present invention uses a limited
range of
frequencies to derive the corrected reservoir amplitude. The present invention
works on pre-
stack seismic data. The present invention does not require a baseline survey.
The present
invention does not require a cross equalization procedure between time lapse
surveys. The
present invention does not require a coordinate adjustment procedure.
[0068] The invention has been sufficiently described so that a person with
average
knowledge in the matter may reproduce and obtain the results mentioned in the
invention
herein Nonetheless, any skilled person in the field of technique, subject of
the invention
herein, may carry out modifications not described in the request herein, to
apply these
modifications to a determined structure, or in the manufacturing process of
the same, requires
the claimed matter in the following claims; such structures shall be covered
within the scope
of the invention.
[0069] It should be noted and understood that there can be improvements and
modifications made of the present invention described in detail above without
departing from
the spirit or scope of the invention as set forth in the accompanying claims.
-20-