Note : Les descriptions sont présentées dans la langue officielle dans laquelle elles ont été soumises.
CA 02920602 2016-02-05
WO 2015/047247
PCT/US2013/061668
SYSTEMS AND METHODS FOR REAL TIME
MEASUREMENT OF GAS CONTENT IN DRILLING FLUIDS
BACKGROUND
[0001] The present disclosure relates to systems and methods for
monitoring drilling fluids and, more specifically, for measuring the gas
content in
drilling fluids in real time using optical computing devices and adjusting one
or
more drilling parameters in response thereto.
[0002] During the drilling of a hydrocarbon-producing well, a drilling
fluid or "mud" is continuously circulated from the surface down to the bottom
of
the wellbore being drilled and back to the surface again. The drilling fluid
serves
several functions, one of them being to transport wellbore cuttings up to the
surface where they are separated from the drilling fluid. Another function of
the
drilling fluid is to cool the drill bit and provide hydrostatic pressure on
the walls
of the drilled borehole to prevent wellbore collapse and the resulting influx
of gas
or liquid from the formations being drilled.
[0003] Analyzing the drilling fluid as it returns to the surface is
recognized in the oil and gas industry as an important first appraisal of a
potential hydrocarbon-bearing reservoir zone, thereby providing important data
to guide subsequent evaluation and testing. Such analysis and testing is
commonly referred to as "mud logging" analysis. Through mud logging,
reservoir zones can be evaluated while they are being initially penetrated,
thereby substantially preventing post-drilling changes to the formation that
can
limit the effectiveness of many other evaluation techniques.
[0004] Mud logging often includes the measurement and analysis of
formation gases present in the drilling fluid as it returns to the surface.
Such
analysis can be valuable in providing data on the hydrocarbon and non-
hydrocarbon gas species that may be encountered while drilling. Specifically,
knowing the presence and concentration of hydrocarbon and non-hydrocarbon
gases in drilling fluids provides an indication of the formation confronted by
the
drill bit and provides a basis for determining the feasibility of obtaining
hydrocarbons from the well. The information that such analysis provides is
vital
in the planning and development of hydrocarbon reservoirs, as well as in the
assessment of a reservoir's capacity and performance.
[0005] Mud logging analysis of drilling fluids is typically conducted off-
line using laboratory analyses which require the extraction of a sample of the
drilling fluid and a subsequent controlled testing procedure usually conducted
at
a separate location. Depending on the analysis required, however, such an
approach can take hours to days to complete, and even in the best case
scenario, a job will often be completed prior to the analysis being obtained.
Although off-line, retrospective analyses can be satisfactory in certain
cases,
they nonetheless do not allow real-time or near real-time analysis
capabilities.
As a result, proactive control of drilling operations cannot take place, at
least
without significant process disruption occurring while awaiting the results of
the
analysis.
Off-line, retrospective analyses can also be unsatisfactory for
determining true characteristics of a drilling fluid since the characteristics
of the
extracted sample of the drilling fluid often changes during the lag time
between
collection and analysis, thereby making the properties of the sample non-
indicative of the true chemical composition or characteristic.
SUMMARY
[0005a] In one aspect, there is provided a system, comprising: a flow
path circulating a drilling fluid into and out of a borehole during drilling
operations; a first optical computing device arranged near an outlet of the
borehole and having a first integrated computational element configured to
optically interact with the drilling fluid near the outlet of the borehole and
generate a first output signal corresponding to a concentration of a gas
present
in the drilling fluid at the outlet; a signal processor communicably coupled
to the
first optical computing device and configured to receive the first output
signal
and determine the concentration of the gas present in the drilling fluid at
the
outlet of the borehole, thereby resulting in a resulting output signal being
generated by the signal processor; and one or more peripheral devices
communicably coupled to the signal processor and configured to receive the
resulting output signal and report the resulting output signal to a well
operator,
wherein one or more drilling or completion parameters are adjusted in response
to the resulting output signal
[0005b] In another aspect, there is provided amethod, comprising:
circulating a drilling fluid within a flow path that extends into and out of a
borehole during drilling operations; generating a first output signal with a
first
CA 2920602 2017-07-20 2
optical computing device arranged near an outlet of the borehole, the first
optical computing device having a first integrated computational element
configured to optically interact with the drilling fluid, wherein the first
output
signal corresponds to a concentration of a gas present in the drilling fluid
at the
outlet; receiving the first output signal with a signal processor communicably
coupled to the first optical computing device; determining the concentration
of
the gas present in the drilling fluid at the outlet of the borehole with the
signal
processor, whereby a resulting output signal is generated by the signal
processor; conveying the resulting output signal to one or more peripheral
devices such that a well operator is able to consider the resulting output
signal;
and adjusting one or more drilling or completion parameters in response to the
resulting output signal.
BRIEF DESCRIPTION OF THE DRAWINGS
[0006] The following figures are included to illustrate certain aspects of
the present disclosure, and should not be viewed as exclusive embodiments.
The subject matter disclosed is capable of considerable modifications,
alterations, combinations, and equivalents in form and function, as will occur
to
those skilled in the art and having the benefit of this disclosure.
[0007] FIG. 1 illustrates an exemplary integrated computation element,
according to one or more embodiments.
[0008] FIG. 2 illustrates an exemplary optical computing device for
monitoring a fluid, according to one or more embodiments.
[0009] FIG. 3 illustrates another exemplary optical computing device for
monitoring a fluid, according to one or more embodiments.
[0010] FIG. 4 illustrates an exemplary wellbore drilling assembly that
may employ one or more optical computing devices for monitoring a fluid,
according to one or more embodiments.
[0011] FIGS. 5A-5D illustrate exemplary graphical outputs resulting
from measurement of gas content, according to one or more embodiments.
CA 2920602 2017-07-20
2a
CA 02920602 2016-02-05
WO 2015/047247
PCT/US2013/061668
DETAILED DESCRIPTION
[0012] The present disclosure relates to systems and methods for
monitoring drilling fluids and, more specifically, for measuring the gas
content in
drilling fluids in real time using optical computing devices and adjusting one
or
more drilling parameters in response thereto.
[0013] The exemplary systems and methods described herein employ
various configurations and arrangements of optical computing devices, also
commonly referred to as "opticoanalytical devices," for the real-time or near
real-time monitoring of a fluid, such as a drilling fluid. In operation,
the
exemplary systems and methods may be useful and otherwise advantageous in
determining one or more properties or characteristics of the fluid, such as
the
type and concentration of one or more gases present within the fluid. The
optical computing devices can advantageously provide real-time fluid
monitoring
that cannot presently be achieved with either onsite analyses at a job site or
via
more detailed analyses that take place in a laboratory. A significant and
distinct
advantage of these devices is that they can be configured to specifically
detect
and/or measure a particular component or characteristic of interest of a
fluid,
thereby allowing qualitative and/or quantitative analyses of the fluid to
occur
without having to extract a sample and undertake time-consuming analyses of
the sample at an off-site laboratory.
[0014] The systems and methods disclosed herein may be suitable for
use in the oil and gas industry since the described optical computing devices
provide a cost-effective, rugged, and accurate means for monitoring oil/gas-
related fluids, such as drilling fluids. In particular, the systems and
methods
may prove advantageous for use in mud logging gas analysis, thereby providing
a stream of continuous data on the hydrocarbon and non-hydrocarbon gas
species that may be encountered while drilling boreholes for the exploitation
of
hydrocarbon reserves below the earth's surface. When the drilling fluid
returns
to the surface, for example, it may contain hydrocarbons (and other compounds)
contained within the rock that has been drilled as well as additional
hydrocarbons that have leaked into the wellbore from the surrounding rock
formation. The real-time
measurement of the abundance of these gas
compounds will yield information on the hydrocarbon content of the rock.
[0015] Such data may be provided to a well operator for interpretation
and consideration and, if required, the well operator may alter various
drilling or
3
CA 02920602 2016-02-05
WO 2015/047247
PCT/US2013/061668
completion parameters in response thereto. For instance, depending on what
types and concentrations of gases are detected within the rock being drilled,
a
well operator may adjust production valves and/or choke settings in order to
regulate the progress of the drilling operation and also minimize wellbore
kick
through early kick detection. In other cases, the well operator may alter mud
properties in an effort to optimize drilling efficiency or formation
evaluation
efficiency. Other drilling and completion parameters that may be altered by a
well operator upon consideration of the data include changing a planned
cementing and/or casing program and optimizing a well completion design.
[0016] In some cases, the data may reveal excessive amounts of
hazardous or otherwise toxic gases being returned to the surface. Such gases
may pose a potential health hazard to rig workers and the surrounding
environment. In such cases, the well operator may proactively reduce the
amount of hazardous/toxic gases by introducing one or more remedial additives
or components to the drilling fluid.
[0017] In other cases, the data may indicate an increased amount of
viable hydrocarbons in the drilled borehole, such as in a particular lateral
trajectory of the wellbore. In such cases, the well operator may manipulate
the
well plan and/or geosteering so that the resulting wellbore is formed
substantially in and through the observed hydrocarbon-rich strata or region.
In
other words, the planned trajectory of the well path may be manipulated or
otherwise altered by geosteering the drilling equipment such that the borehole
penetrates a larger portion of the hydrocarbon-rich strata than would have
otherwise been penetrated.
[0018] By measuring the gas content directly in the drilling fluid, it is
not necessary to extract a gas sample from the fluid for mud logging gas
analysis. This may prove particularly advantageous since the gas extraction
process normally used in mud logging gas analyses is not always efficient
since
it depends on a number of variables including temperature, flow rate,
viscosity,
drilling fluid type, etc. Using the optical computing devices described herein
will
effectively eliminate all these variables from the analysis. By reducing
variation
in the analysis, the accuracy of the results may greatly increase. The
reliability
is also improved since there are fewer moving parts. In addition, using the
optical computing devices described herein dramatically reduces the lag time
between drilling fluid exiting the wellhead and the measurement results being
4
CA 02920602 2016-02-05
WO 2015/047247
PCT/US2013/061668
available. Update rates are also greatly improved over traditional extraction
systems.
[0019] The optical computing devices can be deployed at various points
within a drilling fluid circulation system to monitor the drilling fluid and
its
associated gas content. Depending on the location of the particular optical
computing device, different types of information about the fluid can be
obtained.
In some cases, for example, the optical computing devices can be used to
monitor the type and concentration of gases therein before and after the
drilling
fluid circulates into and out of a wellbore. In other cases, the optical
computing
devices may be used to analyze an extracted gas sample in real-time following
its extraction from the drilling fluid via a traditional drilling fluid
sampling
process. In other cases, the optical computing devices may be used to monitor
the drilling fluid at or near a wellbore choking device so as to register real-
time
gas concentrations of the drilling fluid while the drilling fluid circulates
at
wellbore conditions.
[0020] As used herein, the term "fluid" refers to any substance that is
capable of flowing, including particulate solids, liquids, gases, slurries,
emulsions, powders, muds, mixtures, combinations thereof, and the like. In
some embodiments, the fluid is a drilling fluid or drilling "mud," including
water-
based drilling fluids, oil-based drilling fluids, synthetic drilling fluids,
and the like.
In other embodiments, the fluid may be a completion fluid or a clean-up fluid
such as, but not limited to, fresh water, saltwater (e.g., water containing
one or
more salts dissolved therein), brine (e.g., saturated salt water, chloride
salts,
bromide salts, combinations thereof, etc.), seawater, a spacer fluid, base
fluids,
or other treatment fluids known in the art.
[0021] As used herein, the term "characteristic" refers to a chemical,
mechanical, or physical property of the fluid. A characteristic of the fluid
may
include a quantitative value or concentration of one or more chemical
constituents or compounds present within the fluid. Such chemical constituents
may be referred to herein as "analytes." Illustrative characteristics of a
substance that can be monitored with the optical computing devices disclosed
herein can include, for example, chemical composition (e.g., identity and
concentration in total or of individual components or compounds), phase
presence (e.g., gas, oil, water, etc.), impurity content, pH, alkalinity,
viscosity,
density, ionic strength, total dissolved solids, salt content (e.g.,
salinity),
CA 02920602 2016-02-05
WO 2015/047247
PCT/US2013/061668
porosity, opacity, bacterial content, total hardness, combinations thereof,
state
of matter (solid, liquid, gas, emulsion, mixtures, etc), and the like.
[0022] Moreover, the phrase "characteristic of interest of/in a fluid"
may be used herein to refer to the concentration or characteristic of a gas
contained in or otherwise entrained within the fluid. Exemplary gases that may
be monitored or otherwise measured with the optical computing devices as
contained within a drilling fluid, for example, include, but are not limited
to,
methane, ethane, propane, n-butane, n-pentane, iso-butane, iso-pentane, neo-
pentane, benzene, toluene, carbon dioxide, carbon monoxide, hydrogen sulfide,
acetic acid, argon, helium, oxygen, nitrogen, water, hydrogen, carbonyl
sulfide,
carbon disulfide, and any combination thereof.
[0023] As used herein, the term "flow path" refers to a route through
which a fluid is capable of being transported between at least two points. In
some cases, the flow path need not be continuous or otherwise contiguous
between the two points. Exemplary flow paths include, but are not limited to,
a
flow line, a pipeline, production tubing, drill string, work string, casing, a
wellbore, an annulus defined between a wellbore and any tubular arranged
within the wellbore, a mud pit, a subterranean formation, etc., combinations
thereof, or the like. It should be noted that the term "flow path" does not
necessarily imply that a fluid is flowing therein, rather that a fluid is
capable of
being transported or otherwise flowable therethrough.
[0024] As used herein, the term "electromagnetic radiation" refers to
radio waves, microwave radiation, infrared and near-infrared radiation,
visible
light, ultraviolet light, X-ray radiation and gamma ray radiation.
[0025] As used herein, the term "optical computing device" refers to an
optical device that is configured to receive an input of electromagnetic
radiation
associated with a fluid and produce an output of electromagnetic radiation
from
a processing element arranged within the optical computing device. The
processing element may be, for example, an integrated computational element
(ICE), also known as a multivariate optical element (MOE), used in the optical
computing device. The electromagnetic radiation that optically interacts with
the
processing element is changed so as to be readable by a detector, such that an
output of the detector can be correlated to a characteristic of the fluid,
such as
the type and concentration of a gas in the fluid. The output of
electromagnetic
radiation from the processing element can be reflected electromagnetic
6
CA 02920602 2016-02-05
WO 2015/047247
PCT/US2013/061668
radiation, transmitted electromagnetic radiation, and/or dispersed
electromagnetic radiation. Whether the detector analyzes reflected,
transmitted,
or dispersed electromagnetic radiation may be dictated by the structural
parameters of the optical computing device as well as other considerations
known to those skilled in the art. In addition, emission and/or scattering of
the
fluid, for example via fluorescence, luminescence, Raman, Mie, and/or Raleigh
scattering, can also be monitored by the optical computing devices.
[0026] As used herein, the term "optically interact" or variations thereof
refers to the reflection, transmission, scattering, diffraction, or absorption
of
electromagnetic radiation either on, through, or from one or more processing
elements (i.e., integrated computational elements or multivariate optical
elements), a fluid, or a gas present within the fluid. Accordingly, optically
interacted light refers to electromagnetic radiation that has been reflected,
transmitted, scattered, diffracted, or absorbed by, emitted, or re-radiated,
for
example, using a processing element, but may also apply to interaction with a
fluid or a gas entrained within the fluid.
[0027] The exemplary systems and methods described herein will
include at least one optical computing device arranged along or in a flow path
in
order to monitor a fluid contained therein. Each optical computing device may
include an electromagnetic radiation source, at least one processing element
(e.g., an integrated computational element), and at least one detector
arranged
to receive optically interacted light from the at least one processing element
or
the fluid. In some embodiments, the exemplary optical computing devices may
be specifically configured for detecting, analyzing, and quantitatively
measuring
a particular characteristic of the fluid, such as the type and concentration
of a
gas present within the fluid. In other embodiments, the optical computing
devices may be general purpose optical devices, with post-acquisition
processing
(e.g., through computer means) being used to specifically detect the
characteristic of the fluid.
[0028] The presently described optical computing devices can perform
calculations (analyses) in real-time or near real-time without the need for
time-
consuming sample processing. Moreover, the optical computing devices can be
specifically configured to detect and analyze particular characteristics of a
fluid
or a gas present within the fluid. As a result,
interfering signals are
discriminated from those of interest in the fluid by appropriate configuration
of
7
CA 02920602 2016-02-05
WO 2015/047247
PCT/US2013/061668
the optical computing devices, such that the optical computing devices provide
a
rapid response regarding the characteristics of the fluid as based on the
detected
output. In some embodiments, the detected output can be converted into a
voltage that is distinctive of the magnitude of the characteristic of the
fluid.
[0029] The optical computing devices can be configured to detect not
only the composition and concentrations of a gas within a fluid, but they also
can
be configured to determine physical properties and other characteristics of
the
fluid and/or the gas based on an analysis of the electromagnetic radiation
received from the fluid and/or the gas. For example, the optical computing
devices can be configured to determine the concentration of an analyte and
correlate the determined concentration to a characteristic of the fluid. As
will be
appreciated, the optical computing devices may be configured to detect as many
characteristics (e.g., gas compounds and their respective concentrations) of
the
fluid as desired. All that is required to accomplish the monitoring of
multiple
characteristics is the incorporation of suitable processing and detection
means
within the optical computing device for each characteristic. In some
embodiments, the properties of the fluid can be a combination of the
properties
of the analytes therein (e.g., a linear, non-linear, logarithmic, and/or
exponential
combination). Accordingly, the more characteristics and analytes that are
detected and analyzed using the optical computing devices, the more accurately
the properties of the given fluid and/or gas will be determined.
[0030] The optical computing devices described herein utilize
electromagnetic radiation to perform calculations, as opposed to the hardwired
circuits of conventional electronic processors. When electromagnetic radiation
interacts with a fluid, unique physical and chemical information about the
fluid is
encoded in the electromagnetic radiation that is reflected from, transmitted
through, or radiated from the fluid. This information is often referred to as
the
spectral "fingerprint" of the fluid. The optical computing devices described
herein are capable of extracting the information of the spectral fingerprint
of
multiple characteristics or analytes within a fluid, and converting that
information into a detectable output relating to one or more characteristics
of
the fluid or a gas present within the fluid. That is,
through suitable
configurations of the optical computing devices, electromagnetic radiation
associated with a characteristic or analyte of interest of a fluid can be
separated
8
CA 02920602 2016-02-05
WO 2015/047247
PCT/US2013/061668
from electromagnetic radiation associated with all other components of the
fluid
in order to estimate the properties of the fluid in real-time or near real-
time.
[0031] The processing elements used in the exemplary optical
computing devices described herein may be characterized as integrated
computational elements (ICE). Each ICE is
capable of distinguishing
electromagnetic radiation related to the characteristic of interest from
electromagnetic radiation related to other components of a fluid. Referring to
FIG. 1, illustrated is an exemplary ICE 100 suitable for use in the optical
computing devices used in the systems and methods described herein. As
illustrated, the ICE 100 may include a plurality of alternating layers 102 and
104, such as silicon (Si) and 5i02 (quartz), respectively. In general, these
layers
102, 104 consist of materials whose index of refraction is high and low,
respectively. Other examples might include niobia and niobium, germanium and
germania, MgF, SiO, and other high and low index materials known in the art.
The layers 102, 104 may be strategically deposited on an optical substrate
106.
In some embodiments, the optical substrate 106 is BK-7 optical glass. In other
embodiments, the optical substrate 106 may be another type of optical
substrate, such as quartz, sapphire, silicon, germanium, zinc selenide, zinc
sulfide, or various plastics such as polycarbonate, polymethylmethacrylate
(PMMA), polyvinylchloride (PVC), diamond, ceramics, combinations thereof, and
the like.
[0032] At the opposite end (e.g., opposite the optical substrate 106 in
FIG. 1), the ICE 100 may include a layer 108 that is generally exposed to the
environment of the device or installation. The number of layers 102, 104 and
the thickness of each layer 102, 104 are determined from the spectral
attributes
acquired from a spectroscopic analysis of a characteristic of the fluid using
a
conventional spectroscopic instrument. The spectrum of interest of a given
characteristic typically includes any number of different wavelengths. It
should
be understood that the exemplary ICE 100 in FIG. 1 does not in fact represent
any particular characteristic of a given fluid, but is provided for purposes
of
illustration only. Consequently, the number of layers 102, 104 and their
relative
thicknesses, as shown in FIG. 1, bear no correlation to any particular
characteristic. Nor are the
layers 102, 104 and their relative thicknesses
necessarily drawn to scale, and therefore should not be considered limiting of
the present disclosure. Moreover, those skilled in the art will readily
recognize
9
CA 02920602 2016-02-05
WO 2015/047247
PCT/US2013/061668
that the materials that make up each layer 102, 104 (i.e., Si and Si02) may
vary, depending on the application, cost of materials, and/or applicability of
the
material to the given fluid.
[0033] In some embodiments, the material of each layer 102, 104 can
be doped or two or more materials can be combined in a manner to achieve the
desired optical characteristic. In addition to solids, the exemplary ICE 100
may
also contain liquids and/or gases, optionally in combination with solids, in
order
to produce a desired optical characteristic. In the case of gases and liquids,
the
ICE 100 can contain a corresponding vessel (not shown), which houses the
gases or liquids. Exemplary variations of the ICE 100 may also include
holographic optical elements, gratings, piezoelectric, light pipe, digital
light pipe
(DLP), and/or acousto-optic elements, for example that can create
transmission,
reflection, and/or absorptive properties of interest.
[0034] The multiple layers 102, 104 exhibit different refractive indices.
By properly selecting the materials of the layers 102, 104 and their relative
thickness and spacing, the ICE 100 may be configured to selectively
pass/reflect/refract predetermined fractions of electromagnetic radiation at
different wavelengths. Each wavelength is given a predetermined weighting or
loading factor. The thickness and spacing of the layers 102, 104 may be
determined using a variety of approximation methods from the spectrograph of
the characteristic or analyte of interest. These methods may include inverse
Fourier transform (IFT) of the optical transmission spectrum and structuring
the
ICE 100 as the physical representation of the IFT. The approximations convert
the IFT into a structure based on known materials with constant refractive
indices.
[0035] The weightings that the layers 102, 104 of the ICE 100 apply at
each wavelength are set to the regression weightings described with respect to
a
known equation, or data, or spectral signature. Briefly, the ICE 100 may be
configured to perform the dot product of the input light beam into the ICE 100
and a desired loaded regression vector represented by each layer 102, 104 for
each wavelength. As a result, the output light intensity of the ICE 100 is
related
to the characteristic or analyte of interest.
[0036] Referring now to FIG. 2, illustrated is an exemplary optical
computing device 200 for monitoring a fluid 202, according to one or more
embodiments. In the illustrated embodiment, the fluid 202 may be contained or
CA 02920602 2016-02-05
WO 2015/047247
PCT/US2013/061668
otherwise flowing within an exemplary flow path 204. The flow path 204 may be
a flow line, a pipeline, a wellbore, an annulus defined within a wellbore, or
any
flow lines or pipelines extending to/from a wellbore. The fluid 202 present
within the flow path 204 may be flowing in the general direction indicated by
the
arrows A (i.e., from upstream to downstream). Portions of the flow path 204
may be arranged substantially vertical, substantially horizontal, or any
directional configuration therebetween, without departing from the scope of
the
disclosure.
[0037] The optical computing device 200 may be configured to
determine a characteristic of interest in the fluid 202, such as the type
and/or
concentration of a gas present within the fluid 202. In some embodiments, the
device 200 may include an electromagnetic radiation source 208 configured to
emit or otherwise generate electromagnetic radiation 210. The electromagnetic
radiation source 208 may be any device capable of emitting or generating
electromagnetic radiation, as defined herein. For example, the electromagnetic
radiation source 208 may be a light bulb, a light emitting diode (LED), a
laser, a
blackbody, a photonic crystal, an X-Ray source, combinations thereof, or the
like. In some embodiments, a lens 212 may be configured to collect or
otherwise receive the electromagnetic radiation 210 and direct a beam 214 of
electromagnetic radiation 210 toward the fluid 202. The lens 212 may be any
type of optical device configured to transmit or otherwise convey the
electromagnetic radiation 210 as desired, such as a normal lens, a Fresnel
lens,
a diffractive optical element, a holographic graphical element, a mirror
(e.g., a
focusing mirror), or a type of collimator. In other embodiments, the lens 212
may be omitted from the device 200 and the electromagnetic radiation 210 may
instead be directed toward the fluid 202 directly from the electromagnetic
radiation source 208.
[0038] In one or more embodiments, the device 200 may also include a
sampling window 216 arranged adjacent to or otherwise in contact with the
fluid
202 for detection purposes. The sampling window 216 may be made from a
variety of transparent, rigid or semi-rigid materials that are configured to
allow
transmission of the electromagnetic radiation 210 therethrough. For example,
the sampling window 216 may be made of, but is not limited to, glasses,
plastics, semi-conductors, crystalline materials, polycrystalline materials,
hot or
cold-pressed powders, combinations thereof, or the like. After passing through
11
CA 02920602 2016-02-05
WO 2015/047247
PCT/US2013/061668
the sampling window 216, the electromagnetic radiation 210 impinges upon and
optically interacts with the fluid 202. As a result, optically interacted
radiation
218 is generated by and reflected from the fluid 202. Those skilled in the
art,
however, will readily recognize that alternative variations of the device 200
may
allow the optically interacted radiation 218 to be generated by being
transmitted, scattered, diffracted, absorbed, emitted, or re-radiated by
and/or
from the fluid 202, without departing from the scope of the disclosure.
[0039] The optically interacted radiation 218 generated by the
interaction with the fluid 202 may be directed to or otherwise be received by
an
ICE 220 arranged within the device 200. The ICE 220 may be a spectral
component substantially similar to the ICE 100 described above with reference
to FIG. 1. Accordingly, in operation the ICE 220 may be configured to receive
the optically interacted radiation 218 and produce modified electromagnetic
radiation 222 corresponding to a particular characteristic of the fluid 202.
In
particular, the modified electromagnetic radiation 222 is electromagnetic
radiation that has optically interacted with the ICE 220, whereby an
approximation of the regression vector corresponding to the characteristic of
the
fluid 202 is obtained.
[0040] While FIG. 2 depicts the ICE 220 as receiving reflected
electromagnetic radiation from the fluid 202, the ICE 220 may be arranged at
any point along the optical train of the device 200, without departing from
the
scope of the disclosure. For example, in one or more embodiments, the ICE 220
(as shown in dashed lines) may be arranged within the optical train prior to
the
sampling window 216 and equally obtain substantially the same results. In
other embodiments, the ICE 220 may generate the modified electromagnetic
radiation 222 through reflection, instead of transmission therethrough.
[0041] Moreover, while only one ICE 220 is shown in the device 200,
embodiments are contemplated herein which include the use of at least two ICE
components in the device 200 configured to cooperatively determine the
characteristic of interest in the fluid 202. For example, two or more ICE may
be
arranged in series or parallel within the device 200 and configured to receive
the
optically interacted radiation 218 and thereby enhance sensitivities and
detector
limits of the device 200. In other embodiments, two or more ICE may be
arranged on a movable assembly, such as a rotating disc or an oscillating
linear
array, which moves such that individual ICE components are able to be exposed
12
CA 02920602 2016-02-05
WO 2015/047247
PCT/US2013/061668
to or otherwise optically interact with electromagnetic radiation for a
distinct
brief period of time. The two or more ICE components in any of these
embodiments may be configured to be either associated or disassociated with
the characteristic of interest in the fluid 202. In other embodiments, the two
or
more ICE may be configured to be positively or negatively correlated with the
characteristic of interest in the fluid 202.
[0042] In some embodiments, it may be desirable to monitor more than
one characteristic of interest at a time using the device 200, such as
detecting
multiple types or compounds of gases within the fluid 202. In such
embodiments, various configurations for multiple ICE components can be used,
where each ICE component is configured to detect a particular and/or distinct
characteristic of interest. In some embodiments, the characteristic can be
analyzed sequentially using multiple ICE components that are provided a single
beam of electromagnetic radiation being reflected from or transmitted through
the fluid 202. In some embodiments, multiple ICE components can be arranged
on a rotating disc, where the individual ICE components are only exposed to
the
beam of electromagnetic radiation for a short time. Advantages of this
approach
can include the ability to analyze multiple characteristics of the fluid 202
using a
single optical computing device 200 and the opportunity to assay additional
characteristics (e.g., types or compounds of gases within the fluid 202)
simply
by adding additional ICE components to the rotating disc.
[0043] In other embodiments, multiple optical computing devices can
be placed at a single location along the flow path 204, where each optical
computing device contains a unique ICE that is configured to detect a
particular
characteristic of interest in the fluid 202. In such embodiments, a beam
splitter
can divert a portion of the electromagnetic radiation being reflected by,
emitted
from, or transmitted through the fluid 202 and into each optical computing
device. Each optical
computing device, in turn, can be coupled to a
corresponding detector or detector array that is configured to detect and
analyze
an output of electromagnetic radiation from the respective optical computing
device. Parallel configurations of optical computing devices can be
particularly
beneficial for applications that require low power inputs and/or no moving
parts.
[0044] Those skilled in the art will appreciate that any of the foregoing
configurations can further be used in combination with a series configuration
in
any of the present embodiments. For example, two optical computing devices
13
CA 02920602 2016-02-05
WO 2015/047247
PCT/US2013/061668
having a rotating disc with a plurality of ICE components arranged thereon can
be placed in series for performing an analysis at a single location along the
length of the flow path 204. Likewise,
multiple detection stations, each
containing optical computing devices in parallel, can be placed in series for
performing a similar analysis.
[0045] The modified electromagnetic radiation 222 generated by the
ICE 220 may subsequently be conveyed to a detector 224 for quantification of
the signal. The detector
224 may be any device capable of detecting
electromagnetic radiation, and may be generally characterized as an optical
transducer. In some embodiments, the detector 224 may be, but is not limited
to, a thermal detector such as a thermopile or photoacoustic detector, a
semiconductor detector, a piezo-electric detector, a charge coupled device
(CCD)
detector, a video or array detector, a split detector, a photon detector (such
as a
photomultiplier tube), photodiodes, combinations thereof, or the like, or
other
detectors known to those skilled in the art.
[0046] In some embodiments, the detector 224 may be configured to
produce an output signal 226 in real-time or near real-time in the form of a
voltage (or current) that corresponds to the particular characteristic of
interest
in the fluid 202. The voltage returned by the detector 224 is essentially the
dot
product of the optical interaction of the optically interacted radiation 218
with
the respective ICE 220 as a function of the concentration of the
characteristic of
interest of the fluid 202. As such, the output signal 226 produced by the
detector 224 and the concentration of the characteristic may be related, for
example, directly proportional. In other embodiments, however, the
relationship
may correspond to a polynomial function, an exponential function, a
logarithmic
function, and/or a combination thereof.
[0047] In some embodiments, the device 200 may include a second
detector 228, which may be similar to the first detector 224 in that it may be
any device capable of detecting electromagnetic radiation. The second detector
228 may be used to detect radiating deviations stemming from the
electromagnetic radiation source 208. Undesirable radiating deviations can
occur in the intensity of the electromagnetic radiation 210 due to a wide
variety
of reasons and potentially causing various negative effects on the device 200.
These negative effects can be particularly detrimental for measurements taken
over a period of time. In some embodiments, radiating deviations can occur as
14
CA 02920602 2016-02-05
WO 2015/047247
PCT/US2013/061668
a result of a build-up of film or material on the sampling window 216 which
has
the effect of reducing the amount and quality of light ultimately reaching the
first detector 224. Without proper compensation, such radiating deviations
could
result in false readings and the output signal 226 would no longer be
primarily or
accurately related to the characteristic of interest.
[0048] To compensate for these types of undesirable effects, the
second detector 228 may be configured to generate a compensating signal 230
generally indicative of the radiating deviations of the electromagnetic
radiation
source 208, and thereby normalize the output signal 226 generated by the first
detector 224. As illustrated, the second detector 228 may be configured to
receive a portion of the optically interacted radiation 218 via a beamsplitter
232
in order to detect the radiating deviations. In other embodiments, however,
the
second detector 228 may be arranged to receive electromagnetic radiation from
any portion of the optical train in the device 200 in order to detect the
radiating
deviations, without departing from the scope of the disclosure.
[0049] In some applications, the output signal 226 and the
compensating signal 230 may be conveyed to or otherwise received by a signal
processor 234 communicably coupled to both the detectors 224, 228. The signal
processor 234 may be a computer including a processor and a machine-readable
storage medium having instructions stored thereon, which, when executed by
the processor 234, cause the optical computing device 200 to perform a number
of operations, such as determining a characteristic of interest of the fluid
202.
For instance, the concentration of each characteristic detected with the
optical
computing device 200 can be fed into an algorithm operated by the signal
processor 234. The algorithm can be part of an artificial neural network
configured to use the concentration of each detected characteristic in order
to
evaluate the overall characteristic(s) or quality of the fluid 202.
[0050] The signal processor 234 may also be configured to
computationally combine the compensating signal 230 with the output signal
226 in order to normalize the output signal 226 in view of any radiating
deviations detected by the second detector 228. Computationally combining the
output and compensating signals 226, 230 may entail computing a ratio of the
two signals 226, 230. For example, the concentration or magnitude of each
characteristic determined using the optical computing device 200 can be fed
into
an algorithm run by the signal processor 234. The algorithm may be configured
CA 02920602 2016-02-05
WO 2015/047247
PCT/US2013/061668
to make predictions on how the characteristics of the fluid 202 change if the
concentrations of one or more components or additives are changed relative to
one another.
[0051] In real-time or near real-time, the signal processor 234 may be
configured to provide a resulting output signal 236 corresponding to the
characteristic of interest in the fluid 202, such as the concentration of a
gas
present in the fluid 202. The resulting output signal 236 may be readable by
an
operator who can consider the results and make proper adjustments or take
appropriate action, if needed. In some embodiments, the resulting signal
output
236 may be conveyed, either wired or wirelessly, to an operator for
consideration. In other embodiments, the resulting output signal 236 may be
recognized by the signal processor 234 as being within or without a
predetermined or preprogrammed range of suitable operation and may alert the
operator of an out of range reading so appropriate corrective action may be
taken, or otherwise autonomously undertake the appropriate corrective action
such that the resulting output signal 236 returns to a value within the
predetermined or preprogrammed range of suitable operation.
[0052] Referring now to FIG. 3, illustrated is another exemplary optical
computing device 300 for monitoring the fluid 202, according to one or more
embodiments. The optical computing device 300 may be similar in some
respects to the optical computing device 200 of FIG. 2, and therefore may be
best understood with reference thereto where like numerals indicate like
elements that will not be described again. Again, the optical computing device
300 may be configured to determine the concentration of a characteristic of
interest in the fluid 202, such as the concentration of a gas within the fluid
202,
as contained within the flow path 204. Unlike the device 200 of FIG. 2,
however, the optical computing device 300 in FIG. 3 may be configured to
transmit the electromagnetic radiation 210 through the fluid 202 via a first
sampling window 302a and a second sampling window 302b arranged radially-
opposite the first sampling window 302a on the flow path 204. The first and
second sampling windows 302a,b may be similar to the sampling window 216
described above in FIG. 2 and therefore will not be described again.
[0053] As the electromagnetic radiation 210 passes through the fluid
202 via the first and second sampling windows 302a,b, it optically interacts
with
the fluid 202 and optically interacted radiation 218 is subsequently directed
to or
16
CA 02920602 2016-02-05
WO 2015/047247
PCT/US2013/061668
otherwise received by the ICE 220 as arranged within the device 300. It is
again
noted that, while FIG. 3 depicts the ICE 220 as receiving the optically
interacted
radiation 218 as transmitted through the sampling windows 302a,b, the ICE 220
may equally be arranged at any point along the optical train of the device
300,
without departing from the scope of the disclosure. For example, in one or
more
embodiments, the ICE 220 may be arranged within the optical train prior to the
first sampling window 302a and equally obtain substantially the same results.
In
yet other embodiments, the ICE 220 may generate the modified electromagnetic
radiation 222 through reflection, instead of transmission therethrough.
Moreover, as with the device 200 of FIG. 2, embodiments are contemplated
herein which include the use of at least two ICE components in the device 300
configured to cooperatively determine the characteristic of interest in the
fluid
202.
[0054] The modified electromagnetic radiation 222 generated by the
ICE 220 is subsequently conveyed to the detector 224 for quantification of the
signal and generation of the output signal 226 which corresponds to the
particular characteristic of interest in the fluid 202. The device 300 may
also
include the second detector 228 for detecting radiating deviations stemming
from the electromagnetic radiation source 208. As illustrated, the second
detector 228 may be configured to receive a portion of the optically
interacted
radiation 218 via the beamsplitter 232 in order to detect the radiating
deviations. The output signal 226 and the compensating signal 230 may then be
conveyed to or otherwise received by the signal processor 234 which may
computationally combine the two signals 230, 226 and provide in real-time or
near real-time the resulting output signal 236 corresponding to the
concentration of the characteristic of interest in the fluid 202.
[0055] Those skilled in the art will readily appreciate the various and
numerous applications that the optical computing devices 200, 300, and various
alternative configurations thereof, may be suitably used with. For example,
referring now to FIG. 4, illustrated is an exemplary wellbore drilling
assembly
400 that may employ one or more optical computing devices as described herein
in order to monitor a drilling fluid or a completion fluid, according to one
or more
embodiments. The drilling assembly 400 may include a drilling platform 402
that supports a derrick 404 having a traveling block 406 for raising and
lowering
a drill string 408. A kelly 410 supports the drill string 408 as it is lowered
17
CA 02920602 2016-02-05
WO 2015/047247
PCT/US2013/061668
through a rotary table 412. A drill bit 414 is attached to the distal end of
the
drill string 408 and is driven either by a downhole motor and/or via rotation
of
the drill string 408 from the well surface. As the bit 414 rotates, it creates
a
borehole 416 that penetrates various subterranean formations 418.
[0056] A pump 420 (e.g., a mud pump) circulates drilling fluid 422
through a feed pipe 424 and to the kelly 410, which conveys the drilling fluid
422 downhole through an interior conduit defined in the drill string 408 and
through one or more orifices in the drill bit 414. The drilling fluid 422 is
then
circulated back to the surface via an annulus 426 defined between the drill
string
408 and the walls of the borehole 416. The drilling
fluid 422 provides
hydrostatic pressure to prevent formation fluids from entering into the
borehole
416 and keeps the drill bit 414 cool and clean during drilling. The drilling
fluid
422 also serves to carry drill cuttings and solids out of the borehole 416 and
suspend the drill cuttings and solids while drilling is paused and/or when the
drill
bit 414 is brought in and out of the borehole 416.
[0057] As the spent drilling fluid 422 returns to the surface, it may exit
the annulus 426 at the wellhead 427 and subsequently pass through one or
more chokes or choke valves 428 (one shown) via an interconnecting flow line
430. The choke valve 428 may be used to maintain or otherwise regulate the
pressure on the annulus 426 at surface, for example in the range of about 100
psi to about 1500 psi. As a result,
this will enable drilling to continue
underbalanced and is useful in reducing formation 418 damage to the reservoir,
but also to facilitate increases in drilling speed. It will be appreciated,
however,
that the choke valve(s) 428 may be omitted in other embodiments and the spent
drilling fluid 422 may instead return to the surface at atmospheric pressures,
without departing from the scope of the disclosure.
[0058] Following the choke valve 428, the spent drilling fluid 422 may
be conveyed to one or more drilling fluid rehabilitation devices via the
interconnecting flow line 430. Such drilling fluid rehabilitation devices may
include, but are not limited to, one or more degassing units 432 and solids
control equipment 434. The degassing unit 432 may be any device or machine
configured to separate from the drilling fluid 422 any gases (i.e.,
hydrocarbon
and non-hydrocarbon gas species) that may have been entrained in the drilling
fluid 422 while circulating in and out of the borehole 416. The solids control
equipment 434 may be configured to substantially remove the drill cuttings and
18
CA 02920602 2016-02-05
WO 2015/047247 PCT/US2013/061668
solids from the drilling fluid 422 and deposit a "cleaned" drilling fluid 422
into a
nearby retention pit 436 (i.e., a mud pit).
[0059] Several additives or components may be added to the drilling
fluid 422 in order to maintain the drilling fluid 422 in proper working order
and
otherwise enhance drilling capabilities. In some embodiments, the additives
and
components may be added to the drilling fluid 422 via a mixing hopper 438
fluidly coupled to the retention pit 436. Exemplary components that may be
added to the drilling fluid 422 include, but are not limited to, emulsions,
weighting materials, viscosifiers, thickeners, rheology modifiers, thinners,
defloccu la nts, anionic polyelectrolytes (e.g., acrylates, polyphosphates,
lignosulfonates, tannic acid derivates, etc.), high-heat polymers, clay
stabilizers,
clay inhibitors, tar treatments, water and other base fluids, combinations
thereof, and the like. The rehabilitated drilling fluid 422 may then be
recirculated and pumped back into the borehole 416 with the pump 420 via the
feed pipe 424.
[0060] According to the present disclosure, mud logging gas analysis of
the drilling fluid 422 may be undertaken by arranging one or more optical
computing devices 440 (shown as optical computing devices 440a, 440b, and
440c) at various predetermined monitoring locations throughout the circulation
system of the drilling assembly 400. The optical computing devices 440a-c may
be substantially similar to at least one of the optical computing devices 200,
300
of FIGS. 2 and 3, respectively, and therefore will not be described again in
detail. In exemplary operation, the optical computing devices 440a-c may be
configured to measure and report real-time characteristics of the drilling
fluid
422, such as the type and/or concentration of one or more gases present
therein
at their respective monitoring locations.
[0061] In one or more embodiments, the optical computing devices
440a-c may be communicably coupled to a signal processor 442 and configured
to convey corresponding output signals 444a-c, respectively, to the signal
processor 442. The signal processor 442 may be similar to the signal processor
234 of FIGS. 2 and 3 and may be configured to receive and process the output
signals 444a-c. In particular, the signal processor 442 may employ an
algorithm
configured to calculate or otherwise determine the concentration or type of a
gas
detected at each monitoring location. The signal processor 442 may further be
configured to determine the differences between any two or more of the output
19
CA 02920602 2016-02-05
WO 2015/047247
PCT/US2013/061668
signals 440a-c. In other words, the signal processor 442 may be configured to
determine how the concentration of the gas and/or the magnitude of the
characteristic of interest in the fluid 422 changed between each monitoring
location.
[0062] In real-time or near real-time, the signal processor 442 may be
configured to provide a resulting output signal 446 corresponding to one or
more
characteristics of the fluid 422. The resulting output signal 446 may provide
a
measured gas content and/or the magnitude of the characteristic of interest in
the fluid 422 at the various monitoring locations throughout the circulation
system. In some embodiments, the resulting output signal 446 may be
conveyed, either wired or wirelessly, to one or more peripheral devices 448
communicably coupled to the signal processor 442. The peripheral devices 448
may include, but are not limited to, a mobile device, computer monitor, or a
printer coupled to a computer. In some embodiments, as discussed in more
detail below with reference to FIGS. 5A-5D, the peripheral devices 448 may be
configured to provide one or more graphical outputs such as a Pixler plot, a
Haworth Plot, or a gas-ratio plot, depicting various properties, parameters,
and
characteristic(s) detected in the fluid 422. A well operator may then be able
to
consult and interpret the graphical output and thereby make intelligent
decisions
on how best to manage the well in response thereto.
[0063] In other embodiments, the peripheral devices 448 may include
an audible or visual alarm mechanism or device that may be triggered. For
example, the one or more of the output signals 444a-c may be recognized by
the signal processor 442 as being within or without a predetermined or
preprogrammed range of suitable operation for the drilling fluid 422. If the
output signals 444a-c exceed the predetermined or preprogrammed range of
operation, the resulting output signal 446 may trigger an alarm forming part
of
the peripheral device 448 and the alarm may be configured to alert the
operator
so appropriate corrective action may be taken on the drilling fluid 422. In
some
embodiments, the signal processor 442 may be configured to autonomously
undertake the appropriate corrective action such that the resulting output
signal
446 returns to a value within the predetermined or preprogrammed range of
suitable operation. For example, the signal processor 442 may be
communicably coupled to an automated control system (not shown) that may be
configured to undertake the required corrective action.
CA 02920602 2016-02-05
WO 2015/047247
PCT/US2013/061668
[0064] Referring now to FIGS. 5A-5D, with continued reference to FIG.
4, illustrated are graphical depictions of signals representing measurement of
gas content within zones of a subterranean formation, according to one or more
embodiments. In one embodiment, the measurements may be taken by one or
more of the optical computing devices 440a-c of FIG. 4, thereby rendering an
output signal 446 to a peripheral device 448, such as a monitor or printer
(FIG.
4). Further, the peripheral device 448 may display the output signal 446 in
the
form of graphical outputs such as a Pixler plots, Haworth plots, and gas ratio
plots.
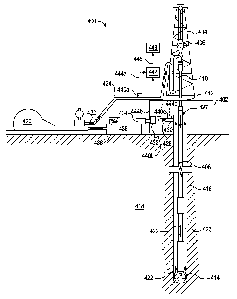
[0065] FIGS. 5A and 5B graphically depict measured gas content of a
formation in the form of "Pixler" plots. Briefly, a Pixler plot is a
visualization
format that depicts gas ratios at varying depths of a formation, thus
indicating
possibilities of oil, gas, or non-productivity at the associated depth. In
some
cases, a Pixler plot may indicate ratios of the quantitative amounts of
methane
(CO, ethane (C2), propane (C3), butane (C4), and pentane (CO, as displayed in
the graph 502 (FIG. 5A) on the X-axis as C1/C2, C1/C3, C1/C4, and C1/C5.
Generally, a ratio of C1/C2 between 2 and 15 indicates oil, a ratio of C1/C2
between 15 and 65 indicates gas, and a ratio of C1/C2 below 2 or above 65
indicates the zone is non-productive. The ratios for C1/C3, C1/C4, and C1/C5
similarly have ranges indicating zones of oil, gas, and non-productivity that
are
known or may be calculated by one of skill in the art.
[0066] In FIG. 5A, graph 500 depicts an overall illustration of gas
measurements taken while drilling through a portion of the formation (e.g.,
the
formation 418 of FIG. 4), thereby correlating downhole depth and gas
measurements (chromatograph). Graphs 520, 540, and 560 of FIGS. 5B, 5C,
and 5D, respectively, also depict depth and chromatograph information, and
thus may be best understood with reference to the discussion of graph 500. As
illustrated, the graph 500 depicts gas measurements at a depth ranging from
approximately 100 meters to approximately 700 meters. The graph 500
illustrates that certain gases are readily present in portions of the
formation,
such as from about 100 meters to about 500 meters, while gases of interest are
generally not present in that range. However, continuing further downhole
within
the formation, such as from approximately 500 meters to approximately 650
meters, certain gases of interest become readily present and the ratio of
gases
correspondingly changes.
21
CA 02920602 2016-02-05
WO 2015/047247
PCT/US2013/061668
[0067] The graph 502 illustrates a gas ratio Pixler plot corresponding to
the gases found in depth range 514 of the graph 500. The ratio of certain
gases
may be used to estimate at what depth a formation may be capable of oil or gas
production or both oil and gas. In the graph 502, range 504 depicts a depth
range where gas ratios indicate that the formation is likely capable of oil
production, range 506 corresponds to gas ratios indicating that the formation
418 is likely capable of gas production, and ranges 508 and 510 depict ranges
indicating non-producing hydrocarbons. Notably, range 510 may be deemed
"non-producing," even though a gas ratio falling with range 510 may indicate
that the formation is capable of some oil production. The range 510 may be
considered non-producing possibly due to the oil being a heavier oil which is
more difficult to produce, thus the quantity of oil produced would not fall
within
the requirements for a "producing" well. The Y-axis of the graph 502 may be
scaled logarithmically or by any other scale helpful in determining production
capabilities. As gas plots 512 fall within ranges 504, 506, and 508 of the
graph
502, the formation 418 may be capable of oil, gas, or nonproduction at the
associated downhole depth. Therefore, a well operator may infer from the gas
plots 512 that this depth is a gas cap to the reservoir.
[0068] Referring now to FIG. 5B, illustrated are graph 520 and Pixler
plot graph 522. The graphs 520 and 522 are substantially similar to the graphs
500 and 502 of FIG. 5A, and therefore may be best understood with reference
thereto. The gas plots 524 of the graph 522 correlate to gas measurements
taken at depth 526 of the graph 520, ranging from approximately 600 meters to
625 meters downhole. As the gas plots 524 fall substantially within the oil
range
504 of the graph 522, this indicates to a well operator that the formation 418
would likely be oil producing at those depths.
[0069] Referring now to FIG. 5C, in another embodiment, one or more
"Haworth" plots may be used to illustrate ratios of measured gas, as depicted
by
graphs 542 and 544. Similar to the Pixler plots described above, Haworth plots
depict gas ratios that may give the well operator an indication of what zone
in a
formation may be capable of efficient hydrocarbon production. Briefly, Haworth
plots may consist of utilizing multiple graphs to indicate whether the
formation
of interest is capable of production at certain depths. A first graph may plot
a
"gas wetness ratio" (GWR) against a "light to heavy ratio" (LHR), for example,
as illustrated by the graph 542. In some embodiments, the GWR may be
22
CA 02920602 2016-02-05
WO 2015/047247
PCT/US2013/061668
calculated by the equation (((C2+C3+C4-FC5)/(C1+C2+C3+C4-FC5))x100), wherein
Ci-C3 represent the gases previously discussed. A GWR value of less than .5
may
represent non-potential for dry gas, a GWR value of .5 to 17.5 may indicate a
potential for gas, a GWR value of 17.5 to 40 may indicate a potential for oil,
and
a GWR value greater than 40 may indicate a potential for residual oil. The LHR
may be calculated by the equation ((C1-PC2)/(C3+C4-FC5)), wherein the ratio
may
show a decreasing trend with increasing fluid density.
[0070] The graph 540 is substantially similar to graphs 500 and 520 of
FIGS. 5A and 5B, respectively, and thus may be best understood with reference
thereto and will therefore not be discussed. The graph 542 illustrates a plot
of
GWR against LHR for gases indicated in graph 540 within a depth range of
approximately 400 meters to approximately 625 meters downhole. The graph
542 illustrates that calculations of GWR and LHR for gases at shallow depths
of
the formation result in high LHR values and low GWR values (e.g., plot
location
546). As downhole depth increases, GWR value increases and LHR value
decreases, for example, the downhole depth of 625 having a high GWR and low
LHR (e.g., plot location 548). A GWR value falling within the range of .5 to
17.5
indicates a likely presence of gas. Accordingly, the graph 542 indicates to a
well
operator that the formation is gas producing from approximately 400 meters to
550 meters downhole. Further, a GWR value falling within the range of 17.5 to
40 indicates a likely presence of oil. Accordingly, the graph 542 indicates
that
the formation is likely gas producing from approximately 550 meters to 625
meters downhole. However, for a more accurate determination of where the
transition from gas to oil may occur, the Haworth analysis includes
implementation of a second set of calculations and graph.
[0071] The second graph utilized in a Haworth analysis plots GWR
against an "oil character qualifier" (OCQ), as depicted in graph 544. The OCQ
may be calculated by the equation ((Ca +Cs) / C3). Accordingly, the graph 544
illustrates that calculations for gases at shallow depths results in a cluster
around plot location 550. As downhole depth increases, calculations result in
increasing GWR and OCQ values, indicated by plot location 552. The critical
junction may be where OCQ is a value of .5. Where the OCQ is less than .5, gas
potential is indicated. Where the OCQ is greater than .5, gas, light oil, or
condensate is indicated. Upon finding where OCQ of .5 intersects the gas plot,
such as at location A of the graph 544, the GWR value should be noted. This
23
CA 02920602 2016-02-05
WO 2015/047247
PCT/US2013/061668
value may then be correlated back to the first graph, as seen at location B of
the
graph 542. Upon performing such analysis, a well operator is more accurately
informed that a transition from gas to oil does not occur at the previously
estimated 550 meters downhole, but occurs at a shallower depth of
approximately 475 meters downhole.
[0072] Referring now to FIG. 5D, illustrated is another exemplary gas
ratio plot, according to one or more embodiments. FIG. 5D provides graphs 560
and 562, where graph 560 is substantially similar to the graphs 540, 520, and
500, and thus can be best understood with respect thereto and will not be
further discussed. The graph 562, however, illustrates a plot where the Y-axis
indicates a calculation of average C2 values divided by average C3 values and
the
X-axis indicates a calculation of C1 values. As shown on the graph 560, and
the
legend of the graph 562, data is illustrated for a depth range of
approximately
470 to 620 meters downhole. In one embodiment, examination of the gas ratio
plot of graph 562 may prove advantageous in helping a well operator
differentiate fluid properties against depth in reservoir zones of interest.
[0073] One of skill in the art will appreciate that the graphs depicted
and described with reference to FIGS. 5A-5D are merely exemplary
embodiments of illustrations depicting gas measurements of a formation, thus
not limiting the scope of the present disclosure.
[0074] Referring again to FIG. 4, as illustrated, a first optical computing
device 440a may be arranged to monitor the drilling fluid 422 as it is being
introduced into the borehole 416 and a second optical computing device 440b
may be arranged to monitor the drilling fluid 422 after it has returned to the
surface and is otherwise de-pressurized via the choke valve 428. More
particularly, the first optical computing device 440a may be arranged in the
feed
pipe 424 leading to the derrick 404 from the pump 420 (or otherwise at any
fluidly communicable location following the pump 420 and before the borehole
416), and the second optical computing device 440b may be arranged on or
otherwise coupled to the flow line 430 before the degassing unit 432 (e.g.,
adjacent an inlet to the degassing unit 432). As will be appreciated, more
than
one optical computing device may be arranged at each of these monitoring
locations, without departing from the scope of the disclosure.
[0075] The first output signal 444a may be indicative of the
type/concentration of a gas in the drilling fluid 422 or another
characteristic of
24
CA 02920602 2016-02-05
WO 2015/047247
PCT/US2013/061668
the fluid 422 as the drilling fluid 422 enters the borehole 416. Likewise, the
second output signal 444b may be indicative of the type/concentration of the
gas
or another characteristic of the fluid 422 as the drilling fluid 422 exits the
borehole 416 de-pressurized. The signal processor 442 may receive the output
signals 444a,b in real-time and provide the resulting output signal 446 that
may
be considered by an operator via the one or more peripheral devices 448, as
described above. In some embodiments, the resulting output signal 446 may
inform the operator of the type/concentration of gas in the drilling fluid 422
as
the drilling fluid 422 enters the borehole 416, as per the first output signal
444a.
In other embodiments, the resulting output signal 446 may inform the operator
of the type/concentration of the gas in the drilling fluid 422 as the drilling
fluid
422 exits the borehole 416, as per the second output signal 444b. As a result,
the operator may be able to conduct mud logging gas analyses of the drilling
fluid 422 without having to extract a gas sample from the returning drilling
fluid
422.
[0076] In yet other embodiments, the signal processor 442 may be
configured to make a comparison between the first and second output signals
444a,b, and thereby provide the operator with a resulting output signal 446
via
the peripheral devices 448 that details the differences between the two output
signals 444a,b. As such, the operator may be apprised as to the quantity and
concentration of one or more gases that may have entered or otherwise become
entrained in the drilling fluid 422 while circulating through the borehole
416.
Such data may be useful in providing information as to the hydrocarbon content
of the rock being drilled through and, as a result, the operator may decide to
adjust one or more drilling or completion parameters in response thereto.
[0077] For example, in some embodiments, the resulting output signal
446 may inform the operator that a particular type or quantity of favorable
gas
is found in a particular strata or region of the subterranean formation 418
while
drilling. As a result, at least one drilling parameter may be adjusted in
response
thereto, such as altering the geosteering of the drill bit 414 so that the
borehole
416 may be drilled or formed substantially in that strata or zone. In some
embodiments, the favorable gas may be one or more hydrocarbons that may be
produced for processing. In other embodiments, however, the favorable gas
may be helium. Those skilled in the art will readily recognize that an
increased
amount of helium returning to the surface as entrained in the drilling fluid
422
CA 02920602 2016-02-05
WO 2015/047247
PCT/US2013/061668
may be an indication of high porosity in the formation 418, and high porosity
can
signify a zone capable of increased production rates. When such gases and
hydrocarbons are detected, the operator may alter the geosteering well path
such that the borehole remains substantially in that stratum, thereby
maximizing
potential hydrocarbon production and efficiencies.
[0078] As will be appreciated, this may prove especially advantageous
in deviated or horizontal wells where altering the geosteering may have the
effect of maintaining the well path substantially parallel and otherwise
within a
hydrocarbon-bearing stratum or region. This may also prove advantageous,
however, in vertical wells where the well operator may be able to log the area
of
the vertical borehole 416 where a high gas content is detected. At a later
time,
the operator may choose to return to that location and complete the borehole
416 at that location such that the hydrocarbons residing in the formation 418
at
that location may be effectively produced with greater efficiency.
Accordingly,
the well completion design may be optimized in response to resulting output
signal 446 and what is provided via the peripheral devices 448. Some well
completion designs that may be altered include, but are not limited to,
changing
a cementing program, changing a casing program or design, or optimizing
placement of downhole perforations, sliding sleeves, and slotted liners.
Optimizations resulting from such well completion alterations may include
containment of unwanted fluids downhole, such as water or unwanted gas, and
may also include optimizing isolation of zones from which production is not
required. Further, nearby wells having similar (correlated) output signals
444a-c
or output signal 446 may implement similar optimizations.
[0079] In some embodiments, the resulting output signal 446 may also
be configured to inform an operator via the peripheral devices 448 of
hazardous,
corrosive, or otherwise toxic gases that may be entrained in the drilling
fluid
422. Hazardous, corrosive, and/or toxic gases, such as hydrogen sulfide (H2S)
and the like, may pose a danger to rig operators and the surrounding
environment. In at least one embodiment, for example, the second output
signal 444b of the second optical computing device 440b may provide the real-
time concentration of hydrogen sulfide (H2S) entrained in the drilling fluid
422 as
it returns to the surface. If the registered level of H25 surpasses a
predetermined "safe" limit, the signal processor 442 may be configured to
trigger an alarm by sending the resulting output signal 446 to the peripheral
26
CA 02920602 2016-02-05
WO 2015/047247
PCT/US2013/061668
devices 448 indicating the same. In response to the alarm, the operator may
act by shutting down the well or adding H2S scavengers or other additives to
the
drilling fluid 422 via the hopper 438 to remedy the situation.
[0080] In some embodiments, the hazardous, corrosive, or otherwise
toxic gas may be methane as entrained in the drilling fluid 422. Since methane
is highly explosive, increased amounts of the gas in the returning drilling
fluid
422 may pose a substantial risk to rig operators and the surrounding
environment. Accordingly, if there is an excessive amount of methane being
detected by, for example, the second optical computing device 440b, such that
it
surpasses a predetermined "safe" limit, the signal processor 442 may be
configured to trigger an alarm via the resulting output signal 446 and the
peripheral devices 448. In response to the alarm, the operator may act to
remedy the situation. For example, the operator may "shut in" the well using
blow-out preventers or the like and then extract the methane in a controlled
manner using choke and kill lines associated with the blow-out preventers.
[0081] In some embodiments, the drilling fluid 422 returned to the
surface may be monitored using the third optical computing device 440c prior
to
full de-pressurization. As illustrated, the third optical computing device
440c
may be arranged in fluid communication with the interconnecting flow line 430
following the wellhead 427 and otherwise arranged prior to the choke valve
428.
Similar to the second optical computing device 440b, the third optical
computing
device 440c may be configured to monitor the drilling fluid 422 after its
return to
the surface for gases (both hydrocarbon and non-hydrocarbon gas species) that
may have become entrained therein after having circulated through the borehole
416. When the drilling fluid 422 exits the choke valve 428, any gases
entrained
therein will immediately break out or otherwise precipitate out of the
drilling
fluid 422. Accordingly,
the third optical computing device 440c may be
advantageous in providing a real or near real-time concentration of one or
more
gases in the drilling fluid 422 as it circulates at or near actual downhole
drilling
environment conditions. The output
signal 444c from the third optical
computing device 440c, therefore, may be useful in mud logging gas analysis of
the drilling fluid 422 at downhole operating conditions.
[0082] Similar to the second optical computing device 440b, the third
optical computing device 440c may be configured to detect and report increased
amounts of a favorable gas in the borehole 416. The resulting output signal
446
27
CA 02920602 2016-02-05
WO 2015/047247
PCT/US2013/061668
may then inform the operator where a particular type or quantity of favorable
gas is found in the borehole 416 and, as a result, at least one drilling
parameter
may be adjusted in response thereto. For example, the operator may alter the
geosteering of the drill bit 414 so that the borehole 416 may be drilled or
formed
substantially in that stratum or zone. In vertical
boreholes 416, the well
operator may be able to log the area of the borehole 416 where a high gas
content is detected and, at a later time, return to that location and complete
the
borehole 416 at that location such that the hydrocarbons residing in the
formation 418 at that location may be effectively produced with greater
efficiency.
[0083] The third optical computing device 440c may also be configured
to detect hazardous, corrosive, or otherwise toxic gases (i.e., H2S, methane,
etc.) that may be entrained in the drilling fluid 422. The resulting output
signal
446 in such cases may inform an operator via the peripheral devices 448 of the
presence of such gases, and the operator may then act to remedy the situation.
In other embodiments, the signal processor 442 may autonomously act to
remedy the situation, such as by shutting down the well or adding H2S
scavengers or other additives to the drilling fluid 422 via the hopper 438 to
remedy the situation. For example, as briefly mentioned above, the signal
processor 442 may be communicably coupled to an automated control system
(not shown) that may be configured to undertake the required corrective
action.
[0084] It is recognized that the various embodiments herein directed to
computer control and artificial neural networks, including various blocks,
modules, elements, components, methods, and algorithms, can be implemented
using computer hardware, software, combinations thereof, and the like. To
illustrate this interchangeability of hardware and software, various
illustrative
blocks, modules, elements, components, methods and algorithms have been
described generally in terms of their functionality. Whether such
functionality is
implemented as hardware or software will depend upon the particular
application
and any imposed design constraints. For at least this reason, it is to be
recognized that one of ordinary skill in the art can implement the described
functionality in a variety of ways for a particular application. Further,
various
components and blocks can be arranged in a different order or partitioned
differently, for example, without departing from the scope of the embodiments
expressly described.
28
CA 02920602 2016-02-05
WO 2015/047247
PCT/US2013/061668
[0085] Computer hardware used to implement the various illustrative
blocks, modules, elements, components, methods, and algorithms described
herein can include a processor configured to execute one or more sequences of
instructions, programming stances, or code stored on a non-transitory,
computer-readable medium. The processor can be, for example, a general
purpose microprocessor, a microcontroller, a digital signal processor, an
application specific integrated circuit, a field programmable gate array, a
programmable logic device, a controller, a state machine, a gated logic,
discrete
hardware components, an artificial neural network, or any like suitable entity
that can perform calculations or other manipulations of data. In some
embodiments, computer hardware can further include elements such as, for
example, a memory (e.g., random access memory (RAM), flash memory, read
only memory (ROM), programmable read only memory (PROM), erasable read
only memory (EPROM)), registers, hard disks, removable disks, CD-ROMS,
DVDs, or any other like suitable storage device or medium.
[0086] Executable sequences described herein can be implemented with
one or more sequences of code contained in a memory. In some embodiments,
such code can be read into the memory from another machine-readable
medium. Execution of the sequences of instructions contained in the memory
can cause a processor to perform the process steps described herein. One or
more processors in a multi-processing arrangement can also be employed to
execute instruction sequences in the memory. In addition, hard-wired circuitry
can be used in place of or in combination with software instructions to
implement various embodiments described herein. Thus, the present
embodiments are not limited to any specific combination of hardware and/or
software.
[0087] As used herein, a machine-readable medium will refer to any
medium that directly or indirectly provides instructions to a processor for
execution. A machine-readable medium can take on many forms including, for
example, non-volatile media, volatile media, and transmission media. Non-
volatile media can include, for example, optical and magnetic disks. Volatile
media can include, for example, dynamic memory. Transmission media can
include, for example, coaxial cables, wire, fiber optics, and wires that form
a
bus. Common forms of machine-readable media can include, for example,
floppy disks, flexible disks, hard disks, magnetic tapes, other like magnetic
29
CA 02920602 2016-02-05
WO 2015/047247
PCT/US2013/061668
media, CD-ROMs, DVDs, other like optical media, punch cards, paper tapes and
like physical media with patterned holes, RAM, ROM, PROM, EPROM and flash
EPROM.
[0088] It should also be noted that the various drawings provided
herein are not necessarily drawn to scale nor are they, strictly speaking,
depicted as optically correct as understood by those skilled in optics.
Instead,
the drawings are merely illustrative in nature and used generally herein in
order
to supplement understanding of the systems and methods provided herein.
Indeed, while the drawings may not be optically accurate, the conceptual
interpretations depicted therein accurately reflect the exemplary nature of
the
various embodiments disclosed.
[0089] Embodiments disclosed herein include:
[0090] A. A system that may include a flow path circulating a drilling
fluid into and out of a borehole during drilling operations, a first optical
computing device arranged near an outlet of the borehole and having a first
integrated computational element configured to optically interact with the
drilling
fluid near the outlet of the borehole and generate a first output signal
corresponding to a concentration of a gas present in the drilling fluid at the
outlet, a signal processor communicably coupled to the first optical computing
device and configured to receive the first output signal and determine the
concentration of the gas present in the drilling fluid at the outlet of the
borehole,
thereby resulting in a resulting output signal being generated by the signal
processor, and one or more peripheral devices communicably coupled to the
signal processor and configured to receive the resulting output signal and
report
the resulting output signal to a well operator, wherein one or more drilling
or
completion parameters are adjusted in response to the resulting output signal.
[0091] B. A method that may include circulating a drilling fluid within a
flow path that extends into and out of a borehole during drilling operations,
generating a first output signal with a first optical computing device
arranged
near an outlet of the borehole, the first optical computing device having a
first
integrated computational element configured to optically interact with the
drilling
fluid, wherein the first output signal corresponds to a concentration of a gas
present in the drilling fluid at the outlet, receiving the first output signal
with a
signal processor communicably coupled to the first optical computing device,
determining the concentration of the gas present in the drilling fluid at the
outlet
CA 02920602 2016-02-05
WO 2015/047247
PCT/US2013/061668
of the borehole with the signal processor, whereby a resulting output signal
is
generated by the signal processor, conveying the resulting output signal to
one
or more peripheral devices such that a well operator is able to consider the
resulting output signal, and adjusting one or more drilling or completion
parameters in response to the resulting output signal.
[0092] Each of embodiments A and B may have one or more of the
following additional elements in any combination: Element 1: wherein the gas
is
selected from the group comprising methane, ethane, propane, n-butane, n-
pentane, iso-butane, iso-pentane, neo-pentane, benzene, toluene, carbon
dioxide, carbon monoxide, hydrogen sulphide, acetic acid, argon, helium,
oxygen, nitrogen, water, hydrogen, carbonyl sulfide, carbon disulfide, and any
combination thereof. Element 2: further comprising a second optical computing
device arranged at or near an inlet to the borehole and having a second
integrated computational element configured to optically interact with the
drilling
fluid and generate a second output signal corresponding to the concentration
of
the gas present in the drilling fluid at the inlet. Element 3: wherein the
signal
processor is communicably coupled to the second optical computing device and
configured to receive the second output signal and generate the resulting
output
signal corresponding to a difference between the first and second output
signals,
and wherein the one or more peripheral devices are configured to receive the
resulting output signal and report to the well operator how the concentration
of
the gas changed between the inlet and the outlet. Element 4: wherein the one
or more peripheral devices are configured to provide a graphical output
depicting
the concentration of the gas present in the drilling fluid at the outlet of
the
borehole. Element 5: wherein the graphical output comprises an output selected
from the group consisting of one or more Pixler plots, Haworth plots, and gas
ratio plots. Element 6: further comprising a choke valve arranged near the
outlet, wherein the first optical computing device is arranged downhole from
the
choke valve. Element 7: further comprising an automated control system
communicably coupled to the signal processor and configured to undertake one
or more corrective actions in response to the resulting output signal.
[0093] Element 8: wherein the one or more peripheral devices comprise
at least one of a monitor and a printer coupled to a computer system, and
wherein conveying the resulting output signal to one or more peripheral
devices
comprises providing a graphical output of the resulting output signal for
31
CA 02920602 2016-02-05
WO 2015/047247
PCT/US2013/061668
consideration by the well operator with the monitor or the printer. Element 9:
wherein the one or more peripheral devices comprise an alarm, and wherein
conveying the resulting output signal to one or more peripheral devices
comprises alerting the well operator either audibly or visually with the alarm
when the resulting output signal reports a gas concentration that exceeds a
predetermined safe limit. Element 10: further comprising shutting down the
well
upon being alerted that the gas concentration exceeds the predetermined safe
limit. Element 11: further comprising adding additives to the drilling fluid
upon
being alerted that the gas concentration exceeds the predetermined safe limit.
Element 12: wherein adjusting the one or more drilling or completion
parameters comprises altering geosteering of a drill bit. Element 13: wherein
adjusting the one or more drilling or completion parameters comprises at least
one of changing a cementing program, changing a casing program, changing a
casing design, optimizing placement of downhole perforations, sliding sleeves,
and slotted liners, and optimizing isolation of zones from which production is
not
required. Element 14: further comprising generating a second output signal
with
a second optical computing device arranged at or near an inlet to the
borehole,
the second optical computing device having a second integrated computational
element configured to optically interact with the drilling fluid, wherein the
second
output signal corresponds to the concentration of the gas present in the
drilling
fluid at the inlet, receiving the second output signal with the signal
processor
communicably coupled to the second optical computing device, calculating a
difference between the first and second output signals with the signal
processor,
whereby the resulting output signal is generated and correspond to how the
concentration of the gas changed between the inlet and the outlet, and
reporting
the difference between the first and second output signals to the well
operator
with the one or more peripheral devices. Element 15: further comprising
undertaking one or more corrective actions in response to the resulting output
signal. Element 16: wherein undertaking the one or more corrective actions
comprises at least one of shutting down the well and adding additives to the
drilling fluid as directed by an automated control system communicably coupled
to the signal processor.
[0094] Therefore, the present disclosure is well adapted to attain the
ends and advantages mentioned as well as those that are inherent therein. The
particular embodiments disclosed above are illustrative only, as the present
32
CA 02920602 2016-02-05
WO 2015/047247
PCT/US2013/061668
disclosure may be modified and practiced in different but equivalent manners
apparent to those skilled in the art having the benefit of the teachings
herein.
Furthermore, no limitations are intended to the details of construction or
design
herein shown, other than as described in the claims below. It is therefore
evident that the particular illustrative embodiments disclosed above may be
altered, combined, or modified and all such variations are considered within
the
scope and spirit of the present disclosure. The disclosure illustratively
described
herein suitably may be practiced in the absence of any element that is not
specifically disclosed herein and/or any optional element disclosed herein.
While
compositions and methods are described in terms of "comprising," "containing,"
or "including" various components or steps, the compositions and methods can
also "consist essentially of" or "consist of" the various components and
steps.
All numbers and ranges disclosed above may vary by some amount. Whenever
a numerical range with a lower limit and an upper limit is disclosed, any
number
and any included range falling within the range is specifically disclosed. In
particular, every range of values (of the form, "from about a to about b," or,
equivalently, "from approximately a to b," or, equivalently, "from
approximately
a-b") disclosed herein is to be understood to set forth every number and range
encompassed within the broader range of values. Also, the terms in the claims
have their plain, ordinary meaning unless otherwise explicitly and clearly
defined
by the patentee. Moreover, the indefinite articles "a" or "an," as used in the
claims, are defined herein to mean one or more than one of the element that it
introduces.
33