Note : Les descriptions sont présentées dans la langue officielle dans laquelle elles ont été soumises.
CA 02982519 2017-10-12
WO 2016/166516
PCT/GB2016/051012
1
A Management Method and System
Field of Invention
The present invention is in the field of management. More particularly, but
not
exclusively, the present invention relates to a method and system for
generating intelligence (such as business intelligence) by monitoring and
analysing motivation data provided by individuals (e.g. employees).
Background
Companies traditionally focus on Key Performance Metrics (KPI's), such as
forecasting profitability, future sales, and turnover, to manage their
business.
Employees are a core asset that a business has to influence these metrics.
Businesses monitor employees via managers. Managers may require
members of their team to deliver regular reports on their tasks. Managers
process this information to be able to deliver reports on their team to their
own
manager. Eventually, with the filtering and summarisation of reports, at the
top
level, the business has a view of their employees.
Unfortunately, this process does not provide a standardised view and does
not help managers or the business to identify systemic issues or their causes.
Another mechanism utilised by businesses are employee surveys.
A traditional employee survey attempts to determine how employees are
feeling and what they think about the business. Typically the surveys take
place annually and take some time by each employee to fill in - more than 10
minutes.
CA 02982519 2017-10-12
WO 2016/166516
PCT/GB2016/051012
2
The advantage of this method is a standardised process, but the
disadvantage is that the surveys are cumbersome to administer and provide
limited insight into the business.
An improved employee survey is called a pulse survey (such as provided by
TinyPulse.com). This is similar to traditional surveys but differs by asking
more, but smaller questions, throughout the year and at key times.
An alternative method of monitoring employees is an employee feedback
system (such as 15five.com or Idonethis.com).
These systems automate a traditional employee reporting system.
The disadvantages with all the prior art is that they do not leverage
coincident
data to deliver intelligence at a business-wide level or at a team level.
Furthermore, none of the prior art describes a standardised method to
measure the motivation levels of employees.
It is an object of the present invention to provide a management method and
system which overcomes the disadvantages of the prior art, or at least
provides a useful alternative.
Summary of Invention
According to a first aspect of the invention there is provided a computer-
implemented method of providing a management tool, including:
Capturing a motivation value from each of a plurality of users via a user
device; and
At least one processor processing the captured motivation values with data
from one or more data sources to generate correlation information.
The motivation values may be captured periodically.
CA 02982519 2017-10-12
WO 2016/166516
PCT/GB2016/051012
3
The motivation values may be captured every week.
The user device may be a mobile user device and may include a touch-
screen. The motivation values may be captured by a mobile application
executing on the mobile user device.
A user may be given a predefined window within which to provide the
motivation value.
The motivation values may be within a predefined range.
The method may further include the step of: at the time of capturing the
motivation value, capturing specific information relating to the user's tasks
via
the user device. The specific information may include answers to predefined
questions. The questions may be the same questions for each user. The
questions may include questions relating highlights of a time period,
challenges for the time period, and focus for the following time period. The
specific information may be aggregated and sent to one or more managers of
the user.
At least some of the users are employees of a company. The data from the
one or more data sources may be key performance indicators for the
company. The method may further include the step of: providing the correlated
information to one or more managers within the company. The employees
may link the company to their motivation values to enable correlated
information relating to their captured motivations values to be provided to
their
managers. The employees may link the company using an activation code
provided by the company or by using a manager's email. The motivation
values may be anonymised before being provided to the one or more
managers. Each manager may head a team of which the employees are
CA 02982519 2017-10-12
WO 2016/166516
PCT/GB2016/051012
4
members. Correlation information relating to the manager's team may be
provided to the manager. The data may include team data.
At least one of the data sources may be an external data source.
At least one of the data sources may be a data source from a company of
which at least some of the users are employees.
One of the data sources may be the user device.
At least some of the data from the one or more data sources may be
global/national data. The global data may be one or more selected from
financial information and news stories.
At least some of the data from the one or more data sources may be local
data. The local data may be one or more selected from weather, transport,
and date.
At least some of the data from the one or more data sources may be user
specific data. The user specific data may be one or more selected from fitness
data and geolocation data.
The method may further include the steps of: capturing calibration data from
each user in relation to their motivation and/or using the calibration data to
generate a model for each user and/or analysing each captured motivation
value in relation to the model for the user to detect erroneous values.
The method may further include the step of: prior to processing, normalising
the motivation values. The step of normalising the motivation values may
utilise the calibration data and/or historical motivation values.
CA 02982519 2017-10-12
WO 2016/166516
PCT/GB2016/051012
The user devices may receive the motivation value via a user interface
mechanism at the user device. The user interface mechanism may be a
gauge.
5 The method may further include the step of: providing the correlation
information to the user.
The method may further include the step of: providing historical motivation
values for a user to a user.
The method may further include the step of: at the time of capturing the
motivation value, capturing information relating to the motivation value from
the user via the user device.
The information may be captured from the user via a text entry interface
mechanism at the user device.
The method may further include the step of: at the time of capturing the
motivation value, capturing an answer to specific question from the user at
the
user device. The question may be a multi-choice question or a binary
question. The method may further include the step of: clustering the users
using answers to the specific question to facilitate generation of the
correlation
information.
The data from the one or more data sources may be periodically retrieved by
the at least one processor.
The motivation values may be stored within a database. The stored motivation
values may be associated with a timestamp of capture.
CA 02982519 2017-10-12
WO 2016/166516
PCT/GB2016/051012
6
Users may be assigned to one or more groups. The groups may be based
upon the user's role, the user's team within a company, or a location of the
user.
The method may further include the step of: pre-processing the data retrieved
from the one or more data sources before use in generating correlation
information. The pre-processing may include normalising the data, generating
a quantitative time series, and/or aligning the data.
According to a further aspect of the invention there is provided a system for
providing a management tool, including:
A plurality of user devices, each device configured to capture motivation
values from a user;
At least one processor configured to process the captured motivation values
with data from one or more data sources to generate correlation information;
and
At least one memory store configured to store the captured motivation values.
The system may include a manager user device configured to display
correlation information to a manager of one or more of the users.
The system may also include at least one communication module configured
for retrieving at least some of the data from one or more external data
sources.
According to a further aspect of the invention there is provided a computer-
implemented method of providing a management tool, including:
Capturing a motivation value from each of a plurality of users via a user
device;
At least one processor normalising the motivation value for each user
utilising
calibration information previously provided by that user; and
CA 02982519 2017-10-12
WO 2016/166516
PCT/GB2016/051012
7
At least one processor processing the normalised motivation values to
generate analysis.
According to a further aspect of the invention there is provided a system for
providing a management tool, including:
A plurality of user devices, each device configured to capture motivation
values from a user;
At least one processor configured to normalise the motivation value for each
user utilising calibration information previously provided by that user and to
process the normalised motivation values to generate analysis; and
At least one memory store configured to store the normalised motivation
values.
Other aspects of the invention are described within the claims.
Brief Description of the Drawings
Embodiments of the invention will now be described, by way of example only,
with reference to the accompanying drawings in which:
Figure 1: shows a block diagram illustrating a system in accordance with
an embodiment of the invention;
Figure 2: shows a flow diagram illustrating a method in accordance with
an embodiment of the invention;
Figures 3a and 3b:
show a flow diagram illustrating a method and system in
accordance with an embodiment of the invention;
Figures 4a, 4b, and 4c:
CA 02982519 2017-10-12
WO 2016/166516
PCT/GB2016/051012
8
show screenshots illustrating different user interface
mechanisms for use in a system in accordance with an embodiment of the
invention;
Figures 5a, 5b, and 5c:
show screenshots illustrating the capture of notes for a
motivation value in accordance with an embodiment of the invention;
Figures 6a, 6b, 6c, 6d, and 6e:
show screenshots illustrating the capture of specific information
relating to an employee's tasks in accordance with an embodiment of the
invention;
Figures 7a and 7b:
show screenshots illustrating the posing and answering of a
binary question in accordance with an embodiment of the invention.
Figures 8a, 8b, 8c, and 8d:
show screenshots illustrating the calibration for a user in
accordance with an embodiment of the invention;
Figure 9:
show a flow diagram illustrating a method in accordance with an
embodiment of the invention;
Figures 10a, 10b, 10c, and 10d:
show screenshots illustrating the display of analysis/information
to a user based upon their entered motivation values in accordance with an
embodiment of the invention; and
CA 02982519 2017-10-12
WO 2016/166516
PCT/GB2016/051012
9
Figure 11: shows a diagram illustrating the display of
analysis/information
to a manager based upon motivation values provided in accordance with an
embodiment of the invention.
Detailed Description of Preferred Embodiments
The present invention provides a method and system for providing a
management tool. The management tool may be used, for example, to assist
managers, employees, or users.
The inventor has determined that a motivated team is more likely to exceed
business KPI's, whereas an unmotivated team is unlikely to achieve them. If a
business was able to understand the motivational levels of their teams they
would be able to better predict future business performance and importantly
focus on the elements that affect motivation and therefore increase business
performance.
The inventor has discovered that motivational values can be captured from
employees and can be analysed and/or correlated with other data to produce
insight for businesses.
The inventor also notes that motivational insight may also be useful for any
user, for example, to improve their own motivation.
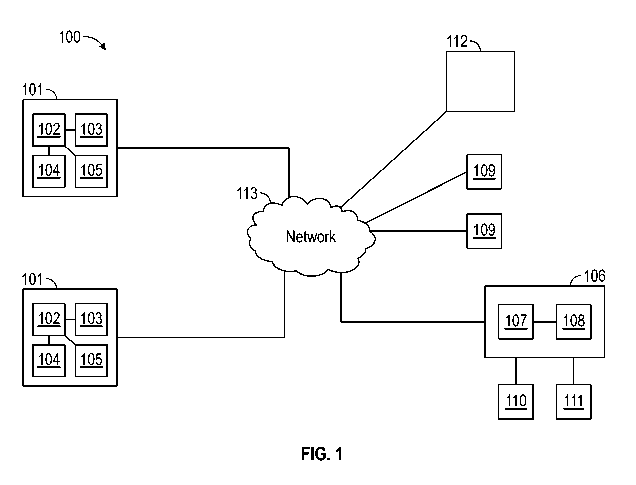
In Figure 1, a system 100 for providing a management tool in accordance with
an embodiment of the invention is shown.
A plurality of user devices 101 are shown. Each device 101 may include a
processor 102, an input 103, a display 104, and a communications module
105. The user device 101 may be a mobile device such as a tablet, smart-
phone, or smart-watch.
CA 02982519 2017-10-12
WO 2016/166516
PCT/GB2016/051012
A server 106 is also shown. The server 106 may include a processor 107, and
a communications module 108.
A plurality of external data sources 109 is shown. The data sources 109 may
5 be, for example, a weather server for transmitting weather reports, a
transport
server for transmitting information about transport, and a fitness server for
transmitting information about physical activity of a user (for example, from
a
personal fitness device such as a FitBit).
10 A memory store 110 is shown. The memory store 110 may be configured to
store a database of captured motivation values.
A second memory store 111 is shown. The second memory store 111 may be
configured to store a database of data retrieved from a plurality of data
sources such as 109.
A manager user device 112 is shown. The manager user device 112 may
include a processor, a display, and a communications module.
A network 113 or combination of networks may be used for interconnecting
one or more of the user devices 101, server 106, external data sources 109,
and manager user device 112.
Each user device 101 may be configured for capturing from a user a
motivation value, specific information relating to the user's tasks, and
answers
to predefined multi-choice/binary questions. The captured information may be
transmitted using the communications module 105 at the user device 101 via
a communications network 113 to the server 106.
The server 106 may be configured for receiving the motivation values,
processing the values to normalise them, and storing them within the first
memory store 110. The server 106 may also be configured for retrieving data
CA 02982519 2017-10-12
WO 2016/166516
PCT/GB2016/051012
11
from a plurality of data sources which may include the external data sources
109, internal data sources, or the user devices 101. The data may be
retrieved and stored within the second memory store 111. The server 106
may be configured for processing the retrieved data to normalise it. The
server 106 may utilise the communications module 108 to receive data from
the external data sources 109.
The server 106 may be further configured to process the motivation values
and the retrieved data to generate correlation information and/or analysis. At
least some of the correlation information/analysis may be provided back to the
user devices 101 or to the manager user device 112. For example, the user
devices 101 may receive correlation information/analysis related to the user's
motivation values and the manager user device 112 may receive correlation
information/analysis related to the manager's team's motivation values.
The manager user device 112 may be configured for displaying the correlation
information/analysis.
Referring to Figure 2, a method 200 for providing a management tool in
accordance with an embodiment of the invention will be described.
In step 201, a motivation value is captured at a user device for each of a
plurality of users. The user device may be executing a mobile application, and
the mobile application may display a graphical user interface (GUI) for
capturing the motivation values. The GUI may utilise a gauge or dial to
receive
the user's input as a value for their motivation within a predefined range.
When the motivation value is captured, further information may also be
captured from the user, for example, prior to, after or before and after
capture
of the motivation value. This further information may include notes relating
to
the motivation value, specific information relating to the user's tasks, and
answers to multi-choice/binary questions.
CA 02982519 2017-10-12
WO 2016/166516
PCT/GB2016/051012
12
The notes may be information that the user considers relevant to their
motivation value or information about what is happening at the time the value
is captured (e.g. "company away-day", "pay-day", or "moved office location").
The specific information may be requested from the user by prompting the
user to answer questions, such as ("what are your highlights of the week",
"what are your challenges for the week", and "what is your focus for next
week"). The user device may provide a text-box user interface element to
receive the specific information from the user. The inventor has discovered
that requesting specific information relating to the user's tasks may help
focus
a user's mind such that when they then provide their motivation value, the
value is more likely to be relevant to the user's tasks (and, therefore,
employment where those tasks are employment-related). Such focussing can
provide more useful data for managers, for example, of those users.
The user device may prompt the user to provide a motivation value (and the
further information). This prompting may be scheduled such that periodic
capture of a user's motivation values occurs. The inventor has discovered that
capturing motivation values periodically (such as weekly) can provide useful
information to assist in analysing a user's changing motivation.
The user device may prompt the user by starting a time window within which
the user can provide their motivation value for a time period. For example, a
12-hour window may be permitted for a user to provide their motivation value
for a one week time period.
A time-stamp for the motivation value may be recorded when the motivation
value is captured to facilitate correlation with time-based events.
CA 02982519 2017-10-12
WO 2016/166516
PCT/GB2016/051012
13
In step 202, the motivation values are normalised. This normalisation process
may utilise calibration data captured earlier from the user. An example of a
calibration process will be later described in relation to Figures 8a to 8d.
The normalisation process may generate a model for the user based upon
calibration data received from the user when the user first accesses the
system, and historic motivation values captured from the user.
In step 203, data is retrieved from one or more data sources. At least some of
the data sources may be external data source such as weather data sources
to retrieve rain, sun, daylight hours, pollen data, etc; fitness data sources,
to
retrieve fitness tracking data such as from RunKeeper or Strava; or travel
data
sources, to retrieve data such as from TripIt or the TFL (Transport for
London)
API. At least some of the data may be retrieved periodically and stored.
The data may be time-stamped to facilitate time-based correlations with
motivation values.
In step 204, after retrieval of the data, the data may be normalised. This
normalisation process may involve construction of quantitative time series
from events and data alignment with periodic motivation capture (i.e. to align
time of the data with the time of motivation value capture).
In step 205, the motivation values and the retrieved data is processed to
generate correlation information. Various correlation methodologies may be
utilised, including regression analysis, predictive time series analysis, and
clustering.
Where answers to multi-choice/binary questions are provided, users may be
clustered based on their answers to augment analysis.
CA 02982519 2017-10-12
WO 2016/166516
PCT/GB2016/051012
14
In step 206, at least part of the resulting correlation information may be
displayed to the user at their user device or to a manager of the user.
For example, the resulting correlation information may be displayed as
statement or conclusions, such as, for users:
= Did you know that when the clocks change your motivation dips by
10%.
= Your average motivation is 5% higher than your company's average.
= Your motivation in the summer months is more stable than the winter
months.
= When you come back from holiday your motivation is 20% higher than
normal, though this effect only lasts for three weeks.
= Your motivation increases in weeks when you get to work early
= You are below your desired motivation level
Or for managers:
= This week motivation is high.
= Towards the end of the week your team's motivation is higher.
= Your team is above their desired motivation level
= Your New York office's motivation is improving more than your London
office
The user may be associated with one or more groups. For example, the user
may be associated with a team. The manager of the team may be provided
with at least part of the resulting correlation information.
In one embodiment, at least some of the users are employees at a company,
and the correlation information relating to those users is provided to their
managers at that company. The correlation information provide to a manager
may relate to motivation data aggregated from every member within a
manager's team, such that an individual's motivation data is effectively
anonym ised.
CA 02982519 2017-10-12
WO 2016/166516
PCT/GB2016/051012
Referring to Figures 3a and 3b, a method and system in accordance with an
embodiment of the invention will be described.
5 The system may include an app or user interface executing or provided on
a
user device, one or more processors at one or more servers, and one or more
databases.
Capture and Storage of Motivation Data (Step 301a)
A motivation recording is captured within an app or user interface, and stored
in a database. This may be done through the use of an Application
Programming Interface (API) which is exposed over the network, for example,
to mobile applications executing on user devices.
The motivation score, that is, the value that the user selected as to how
motivated they are, along with a unique identifier for the user and the
timestamp of the recorded motivation value would be stored, this will be
referred to as Motivation Data. The motivation score would be selected from a
finite range.
Some Additional Data (as described later in this document) may also be
collected at this point, such as geolocation data (latitude, longitude,
altitude),
device data (accelerometer sensor, wifi network name, etc), and other data
that may be available at point of capture of motivation.
User generated notes may also be stored within the Motivation Data. These
notes give the user the ability to say why they selected the value they
selected
for their motivation.
CA 02982519 2017-10-12
WO 2016/166516
PCT/GB2016/051012
16
Before, during or after the motivation score is captured from the user, the
user
may be prompted to provide answers to binary Questions 301b or provide
feedback to Top3 questions 301c. Top3 questions are questions which
request the user's top three highlights and challenges for the week, and the
user's top three goals for the following week. Both binary questions and Top3
questions are described in greater detail later within this document.
An example of Motivation Data as a JavaScript Object Notation (JSON)
representation is given below:
user id: "d924ce56-4493-4337-8770-1d697050003b",
timestamp: 1424197076000,
score: integer(0-100),
note: "lorem ipsum dolor sit amet"
Error detection/correction (Step 302)
As detailed later in this document a model is fitted for each user. If the
user
provides a value which their model suggests is particularly unlikely (for
example less than a 1% probability of occurrence), the app could ask the user
to confirm their entry.
Linking of Motivation (Step 303)
CA 02982519 2017-10-12
WO 2016/166516 PCT/GB2016/051012
17
Individual users can be associated by the use of groupings. These groupings
can either be derived from data stored by the system (such as geographic
location data) or via users grouping themselves into user generated groups.
Some examples of these groups may include:
= Teams
= Companies or Organisations
= Divisions
= Roles
= Cities, Countries and other Localities
These groups could also be inferred by the system.
By associating individuals to groups, further analysis can be done to provide
alternative aggregate group views of motivation. This analysis can then be
provided back to the individual or be anonymously shared with the rest of the
group. When leaving a team or company an individual user can unlink with
where they work and link to their new place of work.
In one embodiment, no motivation data is actually stored within these groups.
Therefore, if a user leaves a group their individual motivation data will no
longer continue to contribute to that group's motivation data. The system may
also store information about when a user joins and leaves user generated
groups, for example, data is stored that indicates "John has joined the team
Marketing" and "John has left the team Marketing" along with the timestamps
at which this change took place. The data for one of these events might be
represented in JSON as:
user id: "d924ce56-4493-4337-8770-1d697050003b",
timestamp: 1424197076000,
CA 02982519 2017-10-12
WO 2016/166516 PCT/GB2016/051012
18
model: "team",
event: "join",
related id: "5d1f1f22-d182-48de-8918-6ce0395f0f67"
Individual User Modelling (Step 304)
The app can deliver insight in relation to their motivation back to individual
users in a short space of time, while at the same time capturing a broad
outline of motivational variables that allows it to quickly analyse in
relation to
other groups. The app may be able to accomplish this by asking calibration
questions when an individual user logs in for the first time. The system may
attempt to understand one or more of the following:
= Current motivation - direct recording.
= Average motivation - both computed by the system (empirically) and
the subjective estimation of an individual user.
= Motivational range - how big is the user's average range of motivation
recording?
= Propensity to swing - how does the user's motivation swing within this
range?
= Motivation aspiration - where would the user like their motivation to
be?
= Highest motivation reading ¨ the user's highest recording or estimation
of highest level.
= Lowest motivation reading ¨ the user's lowest recording or estimation
of lowest level.
= Interpretation of Motivation - what average (or any other number within
the range) means to the user as an individual?
CA 02982519 2017-10-12
WO 2016/166516
PCT/GB2016/051012
19
For the purposes of analysis the system can fit a model for each individual
user; for example a normal distribution with mean and standard deviation a
(although a more sophisticated model which takes account of generally
observed features of self reported motivation could also be used). With
sufficient data fitting such a model is straightforward via calculation of the
sample mean and standard deviation:
LJ
p. = _____________
a = / 1
(x, - it)2
rt 1
1
However, the system can also provide analysis and information immediately.
To address this, the user may be asked to answer a few simple questions on
first use, e.g.:
"Where do you feel your current motivation is?"
"In the past three months what is the highest motivation you have felt?"
"In the past three months what is the lowest motivation you have felt?"
Additionally to address the target motivation issues, the following question
may be asked:
"Where would you like your motivation to be?"
CA 02982519 2017-10-12
WO 2016/166516
PCT/GB2016/051012
The current motivation provides us with an estimate of 1u. If the high
motivation
is h, the low motivation 1, then an estimate of a could be obtained by:
a =(h¨l) k
where initially, for example, k=4 and later, through the gathering of data
from
5 other users, estimating this data by relating their empirical motivation
distribution to their original estimates of low and high.
Once additional motivation readings are received from a user the estimate for
their mean and standard deviation can be updated using a learning process.
10 For example, assuming the system has new estimates of a model parameter,
instead of just accepting this the model moves in the direction of this new
estimate (where a controls the strength of convergence). The new estimate
might be a relatively computationally light approximation based on recent
data, for example:
X t+1 ¨ :14
.+.1
Individual Motivation Pattern (Step 305)
Once the system has collected time series data on motivation for a few
months, the system can look at windowed subsections of the time series and
for each section estimate, for example, a mean and standard deviation;
assuming windows are labelled t and each has a set of data points T:
tit = -----------
T I
CA 02982519 2017-10-12
WO 2016/166516
PCT/GB2016/051012
21
a t E
õ __________________ ElT (X I 1)2
\I -
This provides a new time series which can provide insights to the user about
how their motivation is varying over time (not just the absolute value, but
how
variable it is). The size of the window can be tuned allowing the trading off
of
robustness and resolution.
Missing Values (Step 306)
If individuals may miss motivation recordings or for the purposes of analysis
in
conjunction with finer grained additional data (see below) the system may
generate replacement values. Approaches to accomplish include simply filling
in these values forwards, backwards or taking a linear interpolation of the
values on either side.
The system may, where team data is available, do something more
sophisticated by estimating the missing values based on the recorded
motivation of the other members of the team (scaling via the inverse of the
process described in standardisation below). Subsequent analysis may have
to take account of the fact that some values have been inferred from other
team member's data; in particular any team conclusions may be less certain
than first appears (as they are based on less data).
Windowing (step 307)
As the frequency of motivation records may vary (for example in one week a
user may record their motivation 20 times, in another week once; in this case
CA 02982519 2017-10-12
WO 2016/166516
PCT/GB2016/051012
22
it is undesirable to give equal weighting to all 21 readings) the system may
need to pre-process the motivation records. For example, by taking the
arithmetic or geometric means of motivation records within windows e.g.
weeks.
Standardisation (step 308)
Once individual models for the users are estimated, the system will
standardise individual motivation records. For example, by calculating the z-
score:
bt
ci-7
This provides a standardised value for motivation that takes into account both
the average motivation level of the user and the variability in their levels.
This
can be used, as outlined below, to provide insight to individuals, but also as
an input to the team motivation.
Team Motivation/Aggregation (step 309)
Once a set of standardised scores for a team is generated, the system may
calculate an aggregate motivation measure for the team, for example by
calculating the arithmetic mean of the standardised values (in this case a
mean of means):
hit
T1
CA 02982519 2017-10-12
WO 2016/166516
PCT/GB2016/051012
23
For the purposes of anonymity teams would have to consist of at least, for
example three individuals.
This provides a team motivation score (and, as additional motivation records
are collected and processed, a time series), which can be used for insights as
detailed below. The summary statistics of this time series can also be used
for
insights.
Additional Data (step 310)
The system collects other information, at specific points in time, for future
analysis against the Motivation Data. This data may be primarily unstructured,
however, it is may always be timestamped as to when it was collected,
allowing for chronological correlations to be made in the future. This data is
referred to as Additional Data, and it may takes four forms: individual, team,
local and global:
Individual (311)
User-Specific Additional Data is associated with a given user through the
storage of that user's unique identifier alongside the data to be stored. It
can
come from the app (such as Questions or Top3) or it can be sourced from a
third-party database, when the system has a linked user identifier.
An example of this is collecting data about lifestyle from an application such
as the Jawbone UP platform, which provides information as to the user's
health and physical activity. To access that data, credentials for the system
CA 02982519 2017-10-12
WO 2016/166516
PCT/GB2016/051012
24
are required showing that the user has delegated Jawbone access to access
their HTTP(S) API to the system.
Team (312)
The system may record various team updates, such as new people joining a
team, people leaving a team and so on. This allows the system to build time
series of team events, for example the length of time since somebody joined
the team or left the team (NB this would be an anonymous, team property; the
joining or leaving of team would also be an individual's event).
The system may also link to third party, team related APIs in a similar manner
to those for the individual.
Local (313)
Data such as weather conditions, astrological states, recent events (for
instance holidays or disasters), or transportation issues, etc. may be
recorded
with both a location and time in a database by the system.
National/Global (314)
Generic information may include data about users companies (e.g., stock
price, news occurrences, board changes, etc), or globally significant news.
CA 02982519 2017-10-12
WO 2016/166516
PCT/GB2016/051012
All of the Additional Data may be stored separately from Motivation Data,
however, would still be accessible during analysis and correlation of
Motivation Data.
5 The collection of new Additional Data may happen in response to new
Motivation Data being collected (for instance, a user submits motivation
scores, so the system collects the users' fitness data or check their
company's
stock price). It may also come in via the internet through an API that the
system exposes to other applications, such as third party applications.
Significant pre-processing of the data may be required. This could include
normalising quantitative data for input to machine learning algorithms,
construction of quantitative time series from events (for example time since
last public holiday) and data alignment with, for example, weekly motivation
data.
Some of the additional data, while timestamped, may not be temporally
meaningful: for example the answers to some Binary Questions. This may
however be useful in drawing conclusions between users or clustering users.
Correlations (step 315)
Once the system obtains and standardises motivation readings and obtains
and pre-processes additional data, it can perform correlation analysis of this
data. In one embodiment, the correlation analysis may ignore the time series
nature of the data and look for straightforward positive or negative
correlations.
CA 02982519 2017-10-12
WO 2016/166516
PCT/GB2016/051012
26
Having identified strong correlations with motivation data the system can
estimate a statistical model relating the motivation data to the other data
set(s).
When viewing the datasets as time series, the system may, for example,
attempt to identify where one dataset lags another. The system can also
perform predictive analyses via machine learning as described below:
Regression Analysis (316)
In order to model relationships between datasets, the system may fit
statistical
models. Typically, the system may be most interested in understanding what
affects motivation and how strongly. So the dependent variable in such
analyses would be the (standardised) motivation score. The independent
variables would be the windowed, (possibly) normalised additional data
variables. With this data, the system can apply standard regression algorithms
(for example Ordinary Least Squares, Ridge Regression) to fit models. This
process gives the key results of a statistical significance of each result, a
size
(how large an effect) and a sign (is the effect positive or negative). These
insights can be delivered to users, teams and globally as insights as detailed
below.
In these kinds of analyses, the system ignores the time series structure of
the
data.
The data can be combined from many individuals to estimate global models
and considered as individuals and team's data separately.
CA 02982519 2017-10-12
WO 2016/166516
PCT/GB2016/051012
27
Predictive Time Series Analysis (317)
In performing time series analysis, the system has to cope with specific
aspects of the data. For example, motivation patterns changing over time,
new team members joining, or old members leaving.
Example of pre-processing steps may include the calculation of the first
differences (i.e. the change in values from previous values) and the removal
of
new members from the team values (for the purposes of estimating the impact
of the new member joining while not including their direct motivation
effects).
Clustering (318)
With the binary questions, the system has a high dimensional, but binary
dataset which can be used to cluster users. This may allow the identification
by the system of subsets of users who behave in similar ways; or for whom
similar conclusions from regression analysis hold. For the dataset generated,
for example, a k-Medians clustering algorithm may be appropriate. There may
be potential issues with different users answering different questions (e.g.
leading to missing values); but if questions are ordered it can be ensured
that
users have answered at least as many questions as the one who has
answered the fewest.
Insight (step 319)
Insights may be generated from the correlations step and may be represented
through the use of Graphs, Tables, Infographics, or Copy or other formats of
communicating information. The sharing of insights may happen through the
CA 02982519 2017-10-12
WO 2016/166516
PCT/GB2016/051012
28
use of emails or push notifications to mobile devices. Insights may utilise
correlations from external or internal data sources, or a combination of both.
Having obtained standardised motivation data, the additional data, including
the various forms described above, and the results of the correlation and
machine learning analyses, the system may generate insights for various
users. The insights may be rescaled or converted from quantitative to
categorical values for ease of comprehension. In particular, the system could
use a scale of 0-100 (or whatever scale is used for the motivation selection)
to
present normalised results.
Individual Insights (step 320)
The app on their user device presents individuals with easily understood
summary data such as their last, average, highest and lowest motivation
values.
Additionally graphs could show how a user's motivation has varied over time
and show values average by day, week, month or other time window and how
this varies over time. The notes provided by the user at the point of
providing
their motivation value may be represented on this graph as a visual icon such
as an asterisk. This may assist the user in showing which motivation values
are associated with notes and the note may be displayed to the user upon
actuation of the icon.
Additionally, or alternatively, a simple categorical state could be presented,
for
example:
"today your motivation is high".
CA 02982519 2017-10-12
WO 2016/166516
PCT/GB2016/051012
29
The results from correlation, regression or other analyses may presented by
the app in an accessible manner. For example:
"pollen count appears to affect your motivation" or
"on days when you exercise your motivation is higher".
These could, when appropriate, be presented in graphical form, particularly
for
seasonal effects; or via quantitative estimates, for example:
"your motivation is around 5 points higher on days when you work from
home".
Team Insights (step 321)
The system may present to team managers and members an overview of their
team using the standardised and aggregated results as produced by the
processed outlined above.
The results could be presented in a similar manner to individual results. For
example:
"this week motivation is high"or
"towards the end of the week your team's motivation is higher".
Additional team insights could include how varied the motivation is in the
team.
CA 02982519 2017-10-12
WO 2016/166516
PCT/GB2016/051012
These results may be for aggregate data (to ensure that a manager does not
see individual data). If an insufficient number of motivation recordings have
been made within, for example, a week, it is possible some or all of these
insights will have to be kept hidden because they may reveal individual data.
5
National/Global Insights (step 322)
From the global dataset, a number of results could be presented to all users.
10 When presented to users the form could be along the lines of:
"exercise tends to improve motivation".
Where there is a globally observed relationship the system could scale the
effect, taking into account the variability and average motivation an
individual
15 to present the result in a quantified way, specific for that user. For
example:
"We expect your motivation to be around 5 points lower this Winter".
The results of clustering may also be used to divide the global user base into
subsets for whom more accurate insights can be provided.
Questions (301b)
Within the individual user's app, the user may be prompted to answer simple
binary questions. These questions will be stored by the system in a database
and may be used for further correlation analysis, insight into individual
users
and for clustering of users. The answers to these questions are stored as
User-specific Additional Data.
CA 02982519 2017-10-12
WO 2016/166516
PCT/GB2016/051012
31
Answers will store the unique identifier for the question, the unique
identifier
for the user answering, along with their binary response (Yes/No, True/False).
If a user skips a question, then the system may store the fact that they
skipped, instead of storing the binary response.
e.g. The question "do you think duvet days are a good idea?" identified by
d79ca123-9f18-42fe-a9e7-cefOcd90d081 would be presented to the user
identified as d924ce56-4493-4337-8770-1d697050003b through the app. On
screen, the user would see the question text, followed by three buttons: Yes,
No, and Skip. If a user answers yes then the JSON representation of the data
recorded in the database may be:
user id: "d924ce56-4493-4337-8770-1d697050003b",
question_id: "d79ca123-9f18-42fe-a9e7-
cefOcd90d081"
skipped: false,
response: true,
timestamp: 1424197076000
A recording may be separately stored of other sensor data related to the
answering of the question by the combination of user id and timestamp.
To p3 (301c)
CA 02982519 2017-10-12
WO 2016/166516
PCT/GB2016/051012
32
Within the individual user's app, the user may be prompt to record their top
three highlights and challenges of the week along with their top three goals
for
next week. The input for Top3 is in the form of three text values, in which a
user can write anything they desire. However, there may be a soft character
limit alerting users if they have typed in too much (256 characters is
suggested limit). This may assist in encouraging employees to be precise and
concise.
The Top3 data may stored separately from the rest of the system's databases,
and persists only for as long as needed to send aggregate reports, or to check
if the user had completed their goals from the previous week.
Instead of using this data to generate correlation information, the system
makes a record as to whether Top3 was submitted, and if so, whether it was
fully completed or only partially completed. These records are stored as User-
specific Additional Data, and take the form of, for example:
user id: "d924ce56-4493-4337-8770-1d697050003b",
timestamp: 1424197076000,
highlight_count: integer(0-3),
challenge_count: integer(0-3),
goal_count: integer(0-3),
submitted: true
If a user fails to submit Top3 by the time at which Top3 submissions close for
the week, the following may be recorded, for example:
CA 02982519 2017-10-12
WO 2016/166516
PCT/GB2016/051012
33
user id: "d924ce56-4493-4337-8770-1d697050003b",
timestamp: 1424198036000,
highlight_count: 0,
challenge_count: 0,
goal_count: 0,
submitted: false
One potential advantage of requiring users to provide answers to Top3 is that
not only does it help teams improve communication and help the user to
reflect and think about what they need to accomplish, but it also acts as a
mechanism to ensure motivation values are regularly captured, and all
employees can be instructed/encouraged to complete the Top3 on a weekly
basis.
Once the Top3 deadline has passed the system will correlate all Top3
recordings from individual users within the same team then send a single
update email to the team's designated manager. This will include the users'
name when displaying the Top3 data.
The email may also provide information as to number of team members who
skipped Top3, or changes to the team's structure, for instance new team
members or people leaving the team.
CA 02982519 2017-10-12
WO 2016/166516
PCT/GB2016/051012
34
Figures 4a, 4b, and 4c show different user interface mechanisms for capturing
motivation values from a user in accordance with an embodiment of the
invention.
Figure 4a illustrates a gauge where a user swipes an indicator 400 left and
right within a range to modify a value between 0 and 100. The user can also
add a note for the motivation value by pressing 401. Notes allow a user to
enter a description of what was influencing their motivation at that point in
time. This may be used by the system to display these notes back to the user,
when the user is exploring their historical motivation levels.
Figure 4b illustrates an alternative mechanism, specifically a dial, for
capturing
a motivation value and note from the user.
Figure 4c illustrates an alternative dial.
Figures 5a, 5b, and 5c illustrate the capture of notes for each motivation
value
in accordance with an embodiment of the invention.
Figure 5a highlights where the add note button is.
Figure 5b illustrates how a note would be entered.
Figure 5c illustrates the display of a summary 500 of the note once entered
for
some devices. For other devices, a summary of the note may not possible due
to the limitation in screen space on those devices. Where this occurs the 'ADD
A NOTE' button may change to 'EDIT NOTE' along with its colour (for
example, a change from orange to green).
The following are examples of notes that may be provided by a user:
= "Had an amazing presentation and feel great"
= "Just won a new bit of business after some really hard pitching"
CA 02982519 2017-10-12
WO 2016/166516
PCT/GB2016/051012
= "Not feeling confident about where I currently am in my job following a
negative review."
As can be seen above, these notes can be both positive and negative.
5
Figures 6a, 6b, 6c, 6d, and 6e illustrate the capture of specific information
relating to an employee's tasks in accordance with an embodiment of the
invention.
10 In this embodiment, the specific information will be referred to as
Top3. In
Top3, three questions are asked, and three inputs are required from the user
in relation to each question.
Figure 6a illustrates the app in a waiting state. This occurs when the
15 motivation values are captured periodically and indicates that the Top3
information is not yet required from the user. A count-down is shown to the
user. At the expiry of the count-down, the user will be able to provide their
Top3 information.
20 Figure 6b illustrates the app when the count-down has expired. The user
is
prompted to begin entry of their Top3 information.
Figure 6c illustrates the provision of text data by the user to answer the
Top3
questions.
Figure 6d illustrates the capture of a motivation value from the user using a
gauge user interface mechanism which occurs after the Top3 answers have
been provided.
Figure 6e illustrates the screen displayed when the motivation value and Top3
answers have all been provided.
CA 02982519 2017-10-12
WO 2016/166516
PCT/GB2016/051012
36
Figures 7a and 7b illustrate the posing and answering of a binary question in
accordance with an embodiment of the invention.
Figure 7a illustrates the asking of a binary question ¨ in this example, "Do
you think duvet days are a good idea?", of the user. The user can select the
tick box to agree or the X box to disagree.
Figure 7b illustrates an output provided to the user on the basis of their
answer. In this example, the percentage of users agreeing with the user is
86%.
Figures 8a, 8b, 8c, and 8d illustrate the calibration for a user in accordance
with an embodiment of the invention.
The mobile application on the user's device may prompt for calibration when
the user first registers with the system.
On signing up the user enters their registration details (for example, a work
activation code). After which the user is asked four calibration questions by
the mobile application:
1. On a scale of 0% to 100% what is your current motivation?
2. In the last three months, roughly what was your highest motivation?
3. In the last three months, roughly what was your lowest motivation?
4. What would you like your motivation to be on average?
The answers to these questions can be used by the system to compute the
initial Range of motivation and the potential Swing area that the motivation
score will move between. It also allows the system to correlate an average
base level across different Employees within a company. An example of this
is one Employee's average may be 68% while another is 78%, both are
average but there is a ten point difference. For some analysis, the system
may calculate both Employees as 10 on a 20 point scale (therefore both being
CA 02982519 2017-10-12
WO 2016/166516
PCT/GB2016/051012
37
average). This allows for more accurate benchmarking and analytics then
adding the Employees scores together then dividing the number of employees
to calculate an average motivation score. It also harmonises high scores with
low scores (e.g. some Employees will naturally enter higher numbers than
others, however, in reality and from a mathematical point of view they have
exactly the same motivational levels). By combining the Range, Swing and
Motivational score together motivation can be monitored more accurately over
time.
Referring to Figure 9, a method 900 in accordance with an embodiment of the
invention will be described.
In step 901, calibration information is captured from a user and provided to a
server. The calibration information may include a value representing the
user's current motivation level, the user's estimation of their highest
motivation
level in a last set period of time, the user's estimation of their lowest
motivation level in the last set period of time, and/or the user's estimation
of
what they would like their motivation level to be at. The set period of time
may
be, for example, three months.
In step 902, a motivation value is captured from the user and provided to the
server via a user device. Step 902 may occur significantly after step 901 and
may be repeated multiple times without step 901 being repeated.
In step 903, the server normalises the motivation value captured utilising the
previously provided calibration information.
In step 904, the server may process the normalised motivation values to
generate analysis. The analysis may be represented as averages of
motivation over a period of time, graphs of historical motivation values,
differences in current motivation from the user's average motivation (or
CA 02982519 2017-10-12
WO 2016/166516
PCT/GB2016/051012
38
average motivation of a group of users), and rates of change in motivation
over time. The analysis may be delivered to the user.
In step 905, the normalised motivation values of a plurality of users (such as
members of a team) may be aggregated.
In step 906, the server may process the aggregated values to generate
analysis. The analysis may be represented as averages of motivation over a
period of time, graphs of historical motivation values, differences in current
motivation from the group of users' average motivation, and rates of change in
motivation over time. The analysis may be delivered to a manager of the
group of users.
Figures 10a, 10b, 10c, and 10d illustrate the display of analysis to a user
based upon their entered motivation values in accordance with an
embodiment of the invention.
Figure 10a illustrates a dashboard displayed to a user showing the user's
last,
average, lowest, and highest motivation value for a period of time.
Figures 10b, 10c, and 10d illustrate gauges of which one will be displayed to
a
user showing their current motivation at their desired level, below their
desired
level, and above their desired level respectively.
Referring to Figure 11, the display of information/analysis to a manager based
upon the provided motivation values in accordance with an embodiment of the
invention will be described.
This embodiment of the invention provides anonymised information on groups
to a manager or senior person within an organisation. Groups are anonymised
groupings of three or more individuals (employees/members of the
organisation). These groups may be teams, divisions, job types, tenure of
CA 02982519 2017-10-12
WO 2016/166516
PCT/GB2016/051012
39
employment, location, seniority, gender, etc. On viewing one single group
insight/analysis may be displayed in a similar format to what an individual
user
is shown in Figures 10a to 10d. However, the manager may also compare
multiple groups.
This embodiment of the invention normalises where an individual is within
their own motivation recording and converts this into banding that can be used
for comparison of individuals, teams, roles, organisations, countries and
more,
for example, using standard deviation.
This embodiment of the invention utilises calibration data provided by the
user
(as described in relation to Figure 9) to calculate the desired motivation
level
for individual groups to enable accurate comparison of teams with each other.
This embodiment may attribute the following values to an individual in
relation
to where they are in their range:
10% above their desired motivation: 10 points
Within 10% on their desired motivation: 0 points
10% below their desired motivation: -10 points
It will be appreciated that the "10%" range is exemplary only.
Desired motivation may be assigned an arbitrary 100 points. The points
system allows this embodiment to add up all the individual points within any
size of group and turn it into a c)/0 to calculate if that group is above or
below
their desired motivation. If the group scores below 95% they are below their
desired level if they score 105% and above, they are above their motivation
desire as a group.
CA 02982519 2017-10-12
WO 2016/166516
PCT/GB2016/051012
This embodiment can then use this to compare multiple groups with each
other as well as enabling the plotting of groups' motivation on a graph over
time where desire is the Y axis and X is the time as shown in Figure 11.
5 It will be appreciated that the aspects shown and described in relation
to any
of the above figures can be combined together in a number of variations to
form embodiments of the invention.
A potential advantage of some embodiments of the present invention is that
10 superior business intelligence can be provided to managers and a business
by correlating other data sources with employee's motivation. Other potential
advantages of some embodiments of the present invention is that periodically
captured motivation values can provide insight about the effects of time-based
causes on motivation, capturing information relating to an employee's tasks
15 alongside motivation improves the relevance of motivation data captured,
and
normalising the motivation data on a per user basis improves standardisation
of the results over time.
While the present invention has been illustrated by the description of the
20 embodiments thereof, and while the embodiments have been described in
considerable detail, it is not the intention of the applicant to restrict or
in any
way limit the scope of the appended claims to such detail. Additional
advantages and modifications will readily appear to those skilled in the art.
Therefore, the invention in its broader aspects is not limited to the specific
25 details, representative apparatus and method, and illustrative examples
shown and described. Accordingly, departures may be made from such
details without departure from the spirit or scope of applicant's general
inventive concept.