Note : Les descriptions sont présentées dans la langue officielle dans laquelle elles ont été soumises.
ELECTROMAGNETIC DATA ACQUISITION SYSTEM FOR
REMOVING NEAR SURFACE EFFECTS FROM BOREHOLE TO
SURFACE ELECTROMAGNETIC DATA
BACKGROUND OF THE INVENTION
[0002] The present invention pertains to the art of electromagnetic
geophysical surveys conducted near a borehole and, more specifically, to
mitigating the effect of near surface geological structures on electromagnetic
data collected during the surveys. The embodiments described herein relate
generally to soundings within the Earth based upon electrical or magnetic
fields. As used herein, "Earth" generally refers to any region in which a
borehole may be located including, for example, the lithosphere.
Electromagnetic geophysical surveys probe electrical resistivity, or
equivalently, conductivity, in the ground as a function of depth. While the
term "electromagnetic" is used generally, the term is intended to cover
electric and/or magnetic or even induced polarization techniques.
1
CA 2985485 2019-11-26
CA 02985485 2017-11-08
WO 2016/183138
PCT[US2016/031749
[0003] The source of the electromagnetic field used in a geophysical
survey may originate in the natural environment or be manmade. Generally
known methods employ transmitters that induce electrical currents to flow in
the ground. The transmitters are preferably sources of electric current
injected by electrodes implanted in the soil or rock and connected to a power
supply or the transmitters are loops of wire carrying an alternating current
which produces an alternating magnetic field that, by Faraday's law of
induction, induces an electromotive force in the ground that, in turn, drives
currents in the ground. In either case, the currents induced depend on the
distribution of resistivity in the ground and these induced currents produce
secondary electric and magnetic fields that are measured by receivers which
are usually separated from the transmitter. For instance, the receivers may
include two separated electrodes in contact with the ground and across
which a voltage is measured that is proportional to the electric field at that
point. Receivers may also include a variety of sensors designed to measure
the magnetic fields that accompany the induced currents. The transmitters
and receivers can be on the surface or in the ground.
[0004] These methods are used to determine the distribution of
electrical resistivity in the ground. For example, the methods are preferably
used to characterize the layering of the ground so as to identify an
electrically resistive (high resistivity) layer that contains oil or gas, an
electrically conductive (low resistivity) layer containing saline water, or a
clay layer that might be an impermeable barrier for hot water in a
geothermal setting, or other targets of contrasting electrical resistivity
with
the background. A more specific application of such methods is to
determine the size and electrical resistivity of limited regions in the
ground.
2
CA 02985485 2017-11-08
WO 2016/183138
PCT/US2016/031749
Examples are zones of petroleum rich rock in an oilfield that has not been
drained by the existing oil wells in the field (essentially bypassed oil),
zones
of electrically conducting rocks reflecting the presence of metallic ore
minerals, a zone of enhanced electrical conductivity brought about by the
injection under pressure of a fluid mixture designed to cause a fracture or a
fluid mixed with solid conductive particles intended to keep the fracture
open (proppant), or a zone of changing electrical resistivity caused by the
injection of carbon dioxide for sequestration, or for mapping or monitoring
carbon dioxide, steam or chemical for enhanced oil recovery (tertiary
recovery) or water for improved oil recovery (secondary recovery) or
mapping and monitoring steam or chemicals injected to reduce viscosity and
increase production from an oilfield formation. The application need not be
restricted to exploring oilfields; other applications include pollutant
remediation and groundwater exploration. In all of these applications, the
goal is to detect and, if possible, delineate a zone whose electrical
resistivity
is distinctly different from the resistivity of the overall volume of the
ground
below the surface in a specified region (referred to as the background
resistivity). Since the resistivities of such targets and the surrounding
medium may be quite dissimilar, it is possible to discriminate between them
by measuring their subsurface resistivities when subjected to an
electromagnetic field. Using this methodology, the depth, thickness, and
lateral extent of materials of interest can be determined. Combined with
other data, volumes and saturation can be determined as well.
[0005] Most of the prior work in this area concentrated on using a
surface to borehole configuration rather than a borehole to surface
configuration. The methods are similar, differing only in whether the
3
transmitter is located in the borehole or at the surface. An advance in EM
methods specifically for the deep subsurface is described in International
Patent Application No. PCT/US2012/39010, entitled "System and Method to
Measure or Generate an Electrical Field Downhole" now published as U.S.
Patent Application Publication No. 2015/0160364, by Hibbs and Glezer. .
A further advancement described
in International Patent Application No. PCT/US2013/058158, entitled
"System and Method to Induce an Electromagnetic Field within the Earth",
now published as U.S. Patent Application Publication No. 2015/0219784,
by Hibbs and Morrison, is to
remove the source electrode at depth within the casing and instead drive the
entire casing of the borehole at the desired voltage, V, by making an
electrical connection at or near the top of the casing.
100061 Borehole to surface electromagnetics is emerging as a
significant new method for imaging the Earth, especially in oil and gas fields
and can produce accurate images of fluid distribution up to 2 km from a
well. With this method, an electromagnetic (electric or magnetic) source is
placed at depth, usually within a borehole, and when activated generates
fields and currents within the subsurface that interact with subsurface
structures. The total field is the sum of the provided signal (primary field)
and that produced by this interaction (secondary field). The overall field is
measured at the surface with an array of magnetic or electrical field
detectors and the fields are inverted to yield an electrical resistivity
distribution (or by inverse, conductivity distribution) that may be associated
with targets of interest.
4
Date Recue/Received Date 2020-04-07
CA 02985485 2017-11-08
WO 2016/183138
PCT/US2016/031749
[0007] Borehole to surface electromagnetics is much more sensitive to
subsurface structures than surface techniques due to the closer proximity of
the source to the region of interest. That is, when the source is deployed
close to the target region, the resulting field is much more sensitive to this
body than a measurement with a more remote source. Unfortunately,
although there is more sensitivity to structures near the transmitter
antennas,
there is also high sensitivity with structures near the receiver antennas, or
the
near surface geology, topography and infrastructure. That is, in areas of
complex near surface or shallow geology, it may still be difficult to resolve
deep targets from the influence due to "geologic noise", which is defined as
small scale undefined near surface geologic structures.
[0008] With the above in mind, there is seen to be a need for a system
and method for removing near surface effects from borehole to surface
electromagnetic data.
SUMMARY OF THE INVENTION
[0009] The present invention is directed to an electromagnetic data
acquisition system and an associated method for measuring subsurface
structures with electromagnetic fields and for removing near surface effects
from borehole to surface electromagnetic data. Preferably, the system is
used to obtain information about targets located deep below the Earth's
surface, especially in oil and gas fields, while mitigating the effects of
near
surface geological or shallow structures on collected electromagnetic (EM)
data.
CA 02985485 2017-11-08
WO 2016/183138
PCT/US2016/031749
100101 The system includes an electromagnetic source adapted to be
operated at a depth in a borehole formed in the Earth's surface and for
generating electromagnetic signals that interact with the subsurface
structures and affect the electromagnetic fields. The system also includes an
electromagnetic receiver adapted to be operated on the Earth's surface to
detect the electromagnetic fields and produce data representative of the
electromagnetic fields. A controller is connected to the source and receiver.
The electromagnetic source is preferably an electric dipole source and, in
use, the dipole source produces low frequency signals that affect the data
associated with the shallow and deep structures and high frequency signals
that affect the data associated with shallow structures. In another
embodiment, the electromagnetic source produces a weak signal to generate
data associated with near surface structures and a powerful signal to generate
data associated with shallow and deep structures. In yet another preferred
embodiment, the receiver is adapted to collect data associated with shallow
structures from within a set distance of the borehole and is adapted to
collected data associated with shallow and deep structures from distances
greater than the set distance from the borehole. Alternatively, the
electromagnetic source includes a transmitter at a shallow depth which
produces signals that generate data associated with near surface structures
and includes a transmitter at a deep depth which produces signals that
generate data associated with shallow and deep structures. In a preferred
embodiment, the borehole is in an oil and gas field and the target of interest
is a hydrocarbon deposit, with the shallow geological formations and
topography and man-made structures including pipelines, power lines, water
pumps and other similar structures.
6
CA 02985485 2017-11-08
WO 2016/183138
PCT/US2016/031749
100111 The data acquisition system is preferably employed with a
method for removing near surface effects from borehole to surface
electromagnetic data collected by an electromagnetic data acquisition system
for measuring subsurface structures. The method includes deploying the
system in an area of interest by placing an electromagnetic source down a
borehole and placing an electromagnetic receiver on the surface. Then the
source is activated to generate a first electromagnetic signal that primarily
illuminates shallow structures and a second electromagnetic signal that
illuminates both shallow and deep structures. Near surface, shallow
measurement data produced by the first electromagnetic signal and
combined shallow and deep measurement data produced by the second
electromagnetic signal are measured with the receiver. The method also
includes developing near surface information from the shallow measurement
data and then employing the near surface information to remove the shallow
measurement data from the combined shallow and deep measurement data to
produce deep measurement data. Finally, the data associated with the deep
structures is analyzed to determine if the deep structures include a target of
interest or to evaluate, measure, characterize, map or monitor the target of
interest.
[0012] Additional objects, features and advantages of the present
invention will become more readily apparent from the following detailed
description of a preferred embodiment when taken in conjunction with the
drawings wherein like reference numerals refer to con-esponding parts in the
several views.
7
CA 02985485 2017-11-08
WO 2016/183138
PCT[US2016/031749
BRIEF DESCRIPTION OF THE DRAWINGS
[0013] The present invention is described with respect to particular
exemplary embodiments thereof and reference is accordingly made to the
drawings in which:
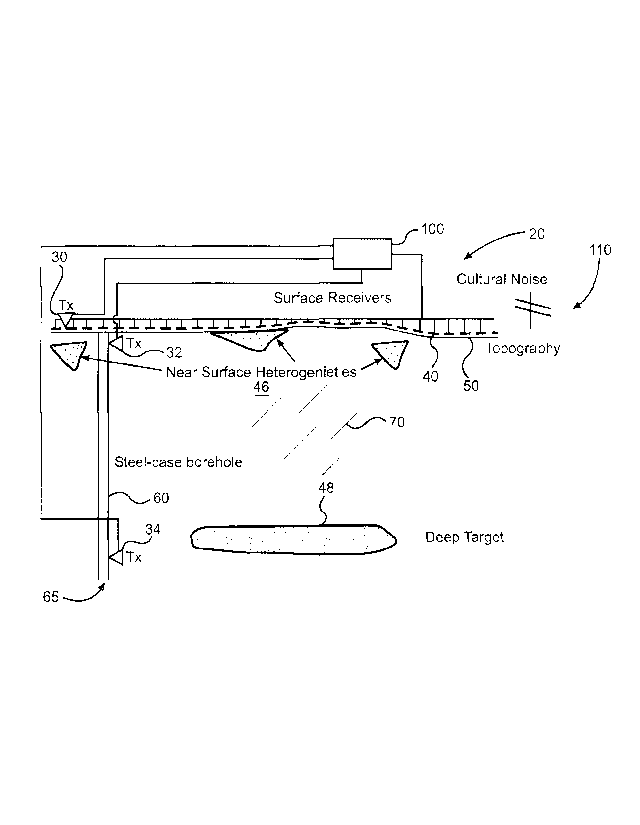
[0014] Figure 1 is a schematic diagram of near surface geological,
topographic and cultural noise conditions adjacent to a borehole where a
source is deployed to image a deeper target of interest;
[0015] Figure 2 is a schematic representation of a simple model to
illustrate the data treatment;
[0016] Figure 3A is a graph showing sensitivity to a deeper layer at
low frequency;
[0017] Figure 3 B is a graph showing no sensitivity to the same deeper
layer of Figure 3 at high frequency; and
[0018] Figure 4 is a graph showing the noise levels for the two sources,
where only the signal levels above the source lines are recoverable.
DETAILED DESCRIPTION OF THE PREFERRED EMBODIMENTS
[0019] Detailed embodiments of the present invention are disclosed
herein. However, it is to be understood that the disclosed embodiments are
merely exemplary of the invention which may be embodied in various and
alternative forms. The figures are not necessarily to scale, and some features
may be exaggerated or minimized to show details of particular components.
Therefore, specific structural and functional details disclosed herein are not
8
CA 02985485 2017-11-08
WO 2016/183138
PCT[US2016/031749
to be interpreted as limiting, but merely as a representative basis for
teaching
one skilled in the art to variously employ the present invention.
100201 In the description which follows, like parts may be marked
throughout the specification and drawing with the same reference numerals.
The foregoing description of the figures is provided for a more complete
understanding of the drawings. It should be understood, however, that the
embodiments are not limited to the precise arrangements and configurations
shown. Although the design and use of various embodiments are discussed
in detail below, it should be appreciated that the present invention provides
many inventive concepts that may be embodied in a wide variety of
contexts. The specific aspects and embodiments discussed herein are merely
illustrative of ways to make and use the invention and do not limit the scope
of the invention. It would be impossible or impractical to include all of the
possible embodiments and contexts of the invention in this disclosure. Upon
reading this disclosure, many alternative embodiments of the present
invention will be apparent to persons of ordinary skill in the art.
[0021] As noted above, borehole to surface electromagnetics is
emerging as a significant new method for imaging the Earth, especially in oil
and gas fields. As will become fully evident below, the invention, as
particularly represented in Figures 1 and 2, sets forth an electromagnetic
data acquisition system 20 which employs multiple transmitters or sources
30, 32 and 34, along with multiple receivers 40. Figure 1 shows near surface
heterogeneities or shallow structures 46 and deep target or structures 48. As
shown, transmitter 30 is a surface transmitter located on the Earth's surface
50. However, transmitter 34 is located down a casing 60 of a borehole 65
and constitutes an electromagnetic source, adapted to be operated at a depth
9
CA 02985485 2017-11-08
WO 2016/183138
PCMJS2016/031749
in borehole 65, for generating electromagnetic signals which interact with
subsurface structures, such as shallow structures 46 or deep structures 48,
with these electromagnetic signals affecting electromagnetic fields 70 which
are detected by receivers 40. Receivers 40 are adapted to be operated on the
Earth's surface 50 to detect electromagnetic fields 70 (represented in Figure
1) and produce data representative of electromagnetic fields 70. A controller
100 is connected to sources 30, 32 and 34 and receivers 40. Controller 100
is configured to activate sources 30, 32 and 34 so that sources 30, 32 and 34
generate the electromagnetic signals with a first set of components that are
affected by shallow structures 46 and a second set of components that are
affected by both shallow structures 46 and deep structures 48. Controller
100 also receives the data from receivers 40, and separates the data into data
associated with shallow structures 46 and data associated with deep
structures 48. Controller 100 is also configured to analyze the data
associated with deep structures 48 to determine if deep structures 48 include
a target of interest, such as ore bodies, hydrocarbons, water, steam, carbon
dioxide, proppants, hydraulic fracture (fracking) fluids and/or proppant,
salts, other substances injected into the ground to improve the effectiveness
of geophysical soundings, and environmental noise. In general, the the deep
measurement data is analyzed to characterize and/or map and/or image the
target of interest
[0022] In further detail, electromagnetic data acquisition system 20
preferably conducts a series of measurements and data treatments that
preferentially illuminate near surface geologic, shallow structures 46, so
that
the shallow measurement data corresponding to shallow structures 46 may
be recovered separately from data corresponding to deep structures 48 of
CA 02985485 2017-11-08
WO 2016/183138
PCT/US2016/031749
interest. Fluids and gases are considered to be part of this geologic
structure.
With this method, EM (electric or magnetic) source 34 is placed at depth,
usually within borehole 60 and, when activated, generates field 70 and
currents within the subsurface that interact with subsurface structures 46,
48.
The total field 70 is the sum of the provided signal (primary field) and that
produced by this interaction (secondary field). This field 70 is measured at
the surface with an array of magnetic and/or electrical field detectors such
as
receivers 40 that acquire shallow and deep measurement data including at
least one component of electric field 70 and/or signals for induced
polarization. The fields are inverted to yield an electrical resistivity
distribution that may be associated with deep structures 48 of interest. In
other words, the distribution of electric field 70 measured at surface 50, and
included in the shallow and deep measurement data, is inverted to give a
one- two-2.5- or three-dimensional model or image of the electrical
resistivity of the subsurface which, in turn, can be analyzed to determine and
identify the distribution of typical targets, such hydrocarbons and other
resources of economic value. The concept of using a model of the Earth and
inverting distribution of an electric field measured at the surface is known
in
the art and will not be discussed further here.
100231 Borehole to surface electromagnetic techniques are much more
sensitive to subsurface structures than surface electromagnetic techniques
due to the closer proximity of source 34 to the region of interest i.e. deep
structures 48. That is, when source 34 is deployed close to target region or
deep structures 48, resulting field 70 is much more sensitive to deep
structures 48 than a measurement with a more remote source.
Unfortunately, although there is more sensitivity to deep structures 48 near
11
CA 02985485 2017-11-08
WO 2016/183138
PCT[US2016/031749
the transmitter antennas i.e., source 34, there is also high sensitivity to
shallow structures 46 near the receivers 40, or to the near surface geology,
topography and infrastructure 110. That is, in areas of complex near surface
geology, it may still be difficult to resolve deep targets due to "geologic
noise" from near surface structures.
[0024] The Earth's resistivity structure is perhaps most variable in the
upper 100m shown by reference numeral 120 in Figure 2 and referred to as
near surface. Here variations in water saturation and water salinity in the
porous, largely sedimentary rock of near surface 120 can provide significant
changes over a scale of a few meters. In addition, this area has more man-
made infrastructure 110, like pipelines, powerlines and water pumps that can
cause changes in the data. These abrupt changes easily manifest themselves
in collected data and are often difficult to recognize in the fields
themselves.
100251 The problem is particularly acute in areas of high topography
and high cultural background noise. Topography produces abrupt changes
in the Earth's electrical field due to the field discontinuity at the
air/earth
interface or Earth's surface 50. In addition, man-made infrastructure 110
produces significant field distortion and man-made noise that may corrupt
field readings. Measurements designed to image deeper targets will be
influenced by this variation and this influence is hereby accounted for in the
data analyzing, processing and imaging.
[0026] The philosophy for solving this issue is to separate subsets of
collected data that are more sensitive to near surface 120 environment from
those sensitive to deep structure 48 and shallow structures 46. Once the
shallow structure 46 has been recovered from inversion, it is thereafter not
allowed to vary during subsequent inversions to recover deep structures 48
12
CA 02985485 2017-11-08
WO 2016/183138
PCT/US2016/031749
of interest. In this context, "removed" or "cancelled" means "eliminated,
frozen or otherwise constrained." In other words, the data more sensitive to
shallow structures 46 is used to interpret and set near surface 120 geological
structure. This near surface structure is thereafter constrained to prevent it
from varying in later interpretation efforts (also referred to as "fixing" or
"setting" the near surface information) prior to interpreting data that is
also
sensitive to deep structures 48. Ideally, this discrimination can be made
from existing measurement so that a separate deployment is not required.
The methods to accomplish this result fall into at least two categories, i.e.,
Category 1: Adjusting operational parameters (Methods 1, 2 and 3); and
Category 2: Adjusting source and receiver geometries (Methods 4 and 5).
[0027] In Method 1
a surface or near surface transmitter or source 30 is
operated at higher frequencies (i.e., in the order of 100-500 Hz) that will
interact with shallow structures 46 and affect the shallow measurement data.
However, due to inductive losses, these signals will not penetrate to deep
structures 48 of primary interest. The same source 30 and receivers 40 are
then operated at a lower frequency (i.e., in the order to 5 Hz) that will
illuminate both shallow structures 46 and deeper structures 48 to affect the
shallow and deep measurement data. The higher frequency data is treated
separately and used to obtain the geologic structure and man-made
infrastructure in the upper 100-500m. The higher and lower frequency
signals may be transmitted simultaneously using a dual frequency
waveform. This allows the high frequency and low frequency data to be
collected simultaneously. Such combination waveforms are in common use
in a variety of scientific and engineering applications. With this method,
higher frequency data has a limited penetration depth due to the
13
CA 02985485 2017-11-08
WO 2016/183138
PCT[US2016/031749
electromagnetic skin depth so that a source that transmits higher frequency
data will provide illumination of the near surface only, whereas the lower
frequency transmission illuminates shallow and deeper structures. The
higher frequency data is then used to fit the near surface geological
structure.
The model of this shallow geology is then fixed/set and prevented from
varying and the low frequency data is fit by constraining the inversion to
only change the model in the deeper horizons, i.e., those associated with the
target depths.
100281 These techniques are illustrated using a simple layered model
150 shown in Figure 2. Here a 100m thick surface layer 120 of 5 ohm-m
represents the near surface geology. A 200m thick deep layer 125 at a depth
of 1000 m represents the "deep" target, or deep structures 48. Electrical
dipole transmitter locations 30, 32 and 34 are indicated with the triangle
symbol, while surface receivers 40 are designated with horizontal lines.
100291 In Figures 3A and 3B the calculated data from a surface
transmitter or source 30 over model 150 is shown using frequencies of 5 Hz
in Figure 3A and 500 Hz in Figure 3B. The plots show the response from a
surface transmitter 30, wherein the line with hollow points represents the
amplitude of the measured signal and line with solid points represents the
percent difference in amplitude between a model with and without that
deeper layer, for both sources. At low frequencies, Figure 3A, the percent
difference is more noticeable (up to +- 60%), while at higher frequencies,
Figure 3B the percent difference is negligible, indicating that the data are
insensitive to the presence of the layer at depth.
[0030] The data plot shows a significant response of the deeper layer
125 at the low frequency at offsets greater than 800 m; the high frequency
14
CA 02985485 2017-11-08
WO 2016/183138
PCT/US2016/031749
profiles show almost no response from deeper layer 125. Using the higher
frequency data shown in Figure 3B to resolve shallow structures 46, or
provide an equivalent model, enables use of the low frequency data in Figure
3A to resolve deeper structures 48 of interest.
[0031] Method 2 is a variant on method 1, but in this case a lower
amplitude transmitter signal is used that will interact with shallow
structures
46. However, it is weak signal that is too weak to penetrate deeply and thus
deep structures 48 will provide no response. This technique uses the
principle that a signal that penetrates to great depth and interacts with deep
structures 48 must be quite powerful. A weaker signal will attenuate to
below a detection threshold before it can penetrate to target depths 125 and
will illuminate near surface 120 only. A more powerful signal will then
illuminate both shallow structures 46 and deeper structures 48 and this will
be analyzed with near surface 120 fixed or cancelled. Using the same
analogy, near surface 120 is illuminated with a weak source, followed by a
strong source, or vise-versa.
[0032] The graph in Figure 4 shows the noise levels for the two
sources, where only the signal levels above the lines are recoverable. The
graph indicates that the weak source recovers only the signal sensitive to
shallow structures 46, whereas the deeper source recovers signals from both
sets of structures 46 and 48. More specifically, Figure 4 duplicates the plot
of Figure 3A, but adds in two lines representing a weak and a strong source
noise level. These lines apply only to the hollow point curve representing
measured amplitude. Only signals with amplitudes above these lines are
observed. The solid point curve "amplitude % difference" plot (with its
values on the right-hand-side axis), in the case where the amplitude of the
CA 02985485 2017-11-08
WO 2016/183138
PCT/US2016/031749
measured signal is above the weak source only, the percent difference is
close to 0. In the part of the percent difference plot, which correlates to
where the amplitude is below the weak source threshold but above the strong
source threshold, significant changes in the solid point line are seen.
Therefore, if we use a weak source only, we ensure that our data is
measuring/sensitive to the near-surface resistivity only. Only when the
strong source is used can we measure the small amplitude fields that are
sensitive to the target at depth, and observe their differences from a
background model.
[0033] The large amplitude percent differences (high solid point line
values) representing sensitivity to the presence of the deep target are
derived
from measurements taken at long-offset. These long-offset values; however,
are very small and below the weak source threshold, and thus could not be
measured. The strong source is needed to have sensitivity to structure at
depth, because otherwise the signals are too small to be measured. In
contrast, by using only the weak source, one is able to ensure that any
percent differences measured will be due purely to the near surface features.
[0034] Method 3 involves use of the lower frequencies to obtain a
deeper portion of upper geological shallow structures 46 and man-made
infrastructure 110. In this method, only data collected within approximately
1 km of the source location 30 are analyzed to obtain a near surface
geological model. This data will be largely insensitive to deeper structures
48 due to the limited amount of geometric source-receiver spreading. Again,
this data will be treated differently from other data and data for shallow
structures 46 determined for this data alone and subsequently fixed. Using
the same layered model analogy of Figure 2, this can be shown with already
16
plotted data. Using the data from Figure 3, again poor sensitivity to deeper
layer 125 is noted at offsets of less than 800m. Therefore, preferentially the
data collected within 1 km of the source is used in mapping shallow layer
120.
[0035] In Method 4, a borehole conductor or source 34 is used as a
transmitter antenna. As described in U.S. Patent Application Publication
No. 2015/0219784 a borehole conductor
can comprise any conductive material or combination of conductive
materials associated with a borehole, including, but not limited to, casing,
tubing, rods, and/or fluids, or could consist of a conductor added to the
borehole (either temporarily or permanently) such as an electrode commonly
used in bore to surface methods. The current source is electrically connected
to a borehole conductor (i.e., well casing 60) at one or more positions 32,
34.
At the top position, the well casing 60 will principally illuminate the near
surface, shallow structures 46. At greater (i.e., reservoir) depths, source 34
will mainly illuminate deep structures 48 associated with the principal
targets. With this method, the electromagnetic sources may be deployed on
a borehole conductor (i.e., steel well casing) or in an open hole and tubing
may be present. In any case, two configurations are considered, one where
source 32 is deployed at or near surface 50, and the second where source 34
is deployed at depth as shown in Figure 1. Other deployments between or
beyond 32 and/or 34 may also be utilized. Data from shallow source 32 is
then interpreted to provide a model for the near surface geology and this is
fixed prior to the inversion and/or interpretation of the data from deeper
source 34.
17
Date Recue/Received Date 2020-04-07
CA 02985485 2017-11-08
WO 2016/183138
PCT/US2016/031749
[0036] In Method 5, only data collected within approximately l km of
the source 30 is analyzed to obtain a near surface geological and
infrastructure model. This data, which is collected from a series of surface
grounded antennas or a "top casing" source 32 defined as an electrical
source grounded into the top of a borehole conductor (i.e., a conductive well
casing), will be largely insensitive to deeper structures 48 due to the
limited
amount of geometric source-receiver spreading. The workflow for Method 5
is that only "local" source and receiver combinations are used to interpret
the near surface geology. That is, surface source 30 and top casings 32 are
used in combination with surface receivers 40 that are located within
approximately 1 km from these sources to interpret near surface geologic
structures and infrastructure (i.e., the upper 100-500m). This close source-
sensor spacing has a much reduced sensitivity to structures beneath 500m
and can therefore be used to interpret shallow structures 46 and
infrastructure 110, with the near surface resistivity distribution being
canceled prior to or while analyzing, processing and/or inverting the data.
[0037] Although described with reference to preferred embodiments of
the invention, it should be readily understood that various changes and/or
modifications can be made to the invention without departing from the spirit
thereof. For instance, although the invention has been described as being
applicable to borehole to surface electromagnetic techniques wherein
electromagnetic sources are located in a borehole and one or more
electromagnetic sources are deployed at the surface, the invention could also
be used with other novel forms of electromagnetic techniques. In general,
the invention is only intended to be limited by the scope of the following
claims.
18