Note : Les descriptions sont présentées dans la langue officielle dans laquelle elles ont été soumises.
CA 02986787 2017-11-22
WO 2016/187655 PCT/AU2016/050388
- 1 -
VALIDATING BIOMARKER MEASUREMENT
Background of the Invention
[0001] The present invention relates to a method and apparatus for validating
measurement
of biomarker values used in generating an indicator, and in one example, to a
method and
apparatus for validating an indicator used in determining the likelihood of a
biological
subject having at least one medical condition.
Description of the Prior Art
[0002] The reference in this specification to any prior publication (or
information derived
from it), or to any matter which is known, is not, and should not be taken as
an
acknowledgment or admission or any form of suggestion that the prior
publication (or
information derived from it) or known matter forms part of the common general
knowledge
in the field of endeavour to which this specification relates.
[0003] Measurement of gene expression (as RNA or protein) in samples taken
from living
organisms has practical applications including, but not limited to,
determining a disease state,
determining disease extent or severity, disease prognosis and early
identification, identifying
a tissue type (both normal and diseased including cancers), identifying and
enumerating cell
types in a cell mix, and understanding normal metabolic processes and their
response to
external factors or insults (including injury, wounds, burns, stress, viral or
bacterial or
parasitic or fungal infection, exercise, diet, therapeutics, toxins,
therapies, treatments and
experimental procedures). There are a number of methods available for
measuring gene
expression (as RNA or protein) that are well known in the art, from low-
throughput (single
genes and gene products) to high-throughput (exome and arrays), including
northern blots,
polymerase chain reaction (qPCR), microarrays, RNA sequencing (RNA-seq),
targeted RNA
sequencing, ELISA, ETA, mass spectrometry, HPLC, SNP analysis, and epigenetic
technologies (ChIP-Seq, Chromatin Conformational Signatures (CCA), DNA
methylation
analyses).
CA 02986787 2017-11-22
WO 2016/187655 PCT/AU2016/050388
-2-
100041 Each of these technologies produces a value, or a set of values for
each of the
products measured. In the context of medical discovery and its applications,
these values are
termed `biomarkers'. A measured value for any gene expression product (as RNA
or protein)
is defined as a measured biomarker, as measured by the processing instrument
or device.
Examples of a measured biomarker include a protein concentration for a
specified protein,
the transcript count for a single transcript in the case of RNA sequencing,
the expression
value for an exon or transcript in the case of microarrays, an m/z value in
the case of mass
spectrometry or a fluorescence value in the case of flow cytometry. Measured
biomarkers can
be understood as 'raw data', as measured by the instrument. Multi-biomarker
assays will
measure a number of biomarkers in parallel, reporting a collection of measured
biomarkers.
[0005] Indicator values are values that are designed to correlate, classify,
or otherwise be
indicative of some condition, stage, diagnosis or prognosis or absence thereof
For example
temperature reported in degrees is an indicator value for fever. Arbitrarily
complex indicators
may be built for any purpose, and in the case of multi-biomarker medical
devices, the
indicator will be some combination of biomarkers that, through an equation,
generate an
indicator value that correlates to some state or condition (or the absence of
such) for a
patient.
[0006] The development and use of indicator values requires accurate and valid
measurement
of gene expression (as RNA or protein) measured values, and can be achieved
through the
use of two key steps: normalisation and controls. Controls provide a check
that the
underlying values are valid, and normalisation is any method by which samples
can be made
comparable by removing non-biological sources of variation between samples.
[0007] Controls are used to ensure that relevant potential modes of failure
can be detected. If
a failure is detected in a control, the assay or experiment can be declared
failed and the
indicator value (if any) will consequently also be invalid. In the context of
medical devices,
controls guard against the results of the test (indicator values) being
reported when the
underlying inputs to the indicator may be invalid thus avoiding the potential
of the operator
drawing false conclusions. Controls that can be used include the following
(which ones used
depends in part upon the user, the application and the stage of development of
the assay):
CA 02986787 2017-11-22
WO 2016/187655 PCT/AU2016/050388
- 3 -
= No template control (run in parallel with other reactions to determine
the extent of
contamination ¨ for PCR)
= No amplification control for assays relying on nucleic acid amplification
(e.g.,
contains no polymerase ¨this checks for example the integrity of a labelled
probe
relying on the FRET principle ¨ for PCR)
= Positive control (a sample used during assay use to confirm that the test
is able to
produce a result in the reportable range). This does not imply that the
reported value
for this control will be above a given threshold (for example positive for a
disease),
merely that the control is positively able to generate a value in the
reportable range of
the test. Positive controls may be biological in origin or synthetic (or a
hybrid of the
two, such as recombinant products), and the positive controls can be internal
(coming
from within a sample being tested) or external (run in parallel and
independent of the
sample being tested). Positive controls can include positive or negative
biological or
synthetic controls.
= A control containing no reverse transcriptase (to determine the extent of
contaminating DNA especially if primers are not designed across an exon /
intron
border ¨ for PCR)
= Spike-in controls include artificial nucleic acid added to either the
sample to be tested
(at any stage) and are used to determine the extent of PCR inhibition and for
quality
control in array and RNA-seq (for quantification, sensitivity, coverage and
linearity).
[0008] Of these measured controls perhaps the most common are external
positive controls
containing known concentrations of a given analyte, and spike-ins. The use of
such controls
contributes to the expense and complexity of running an experiment, or assay,
through
having to purchase reagents and the controls themselves, through the use of
experimental
"real estate" which could otherwise be used for targets, and in the additional
resources and
complexity inherent in having these control targets in addition to the targets
required to
produce the indicator value. It is therefore advantageous to reduce the
additional measured
controls not measured in the course of determining the indictor value.
CA 02986787 2017-11-22
WO 2016/187655 PCT/AU2016/050388
-4-
100091 Normalisation is an important step that ensures that comparisons
between samples, or
between a reference and a sample can be made. The objective of the
normalisation step is to
remove differences not attributable to biological variability, such as batch
effect and other
sources of technical variability including those introduced by concentration,
time,
temperature, instruments, operators or assay parameters (including those
unknown or outside
of the control of the assay users) such as those introduced in a typical
workflow, such as that
described below.
[0010] Measurement of gene expression using microarrays or PCR or RNA-seq by
example
usually involves some or all of the following steps depending on the method
(similar types of
controls are required in most experiments measuring biomarkers):
= Experimental design including power calculation and number of replicates
to be used
= Isolation of RNA or mRNA from sample(s) of interest
= Determination of RNA quality and quantity
= Fragmentation and size selection (for RNA-seq)
= Conversion of RNA to complementary DNA (cDNA)
= Conversion of cDNA to cRNA (for certain microarrays)
= Fragmentation and labelling (for arrays, or use of a labelled probe for
PCR)
= Detection
= Data capture
= Determination of data quality
= Data normalisation
= Control for false discovery.
[0011] Some of the experimental method variables that need to be controlled
for
(normalized) are detailed in Table 1 below, adapted from Roche Applied Science
Technical
Note No. LC15/2002, under the appropriate step.
CA 02986787 2017-11-22
WO 2016/187655 PCT/AU2016/050388
- 5 -
Table 1
Sample DNA / RNA cDNA Product
Sample Nucleic acid Reverse Amplification Detection
Preparation isolation transcription
= Preparation = Isolation = Efficiency =
Efficiency = Method used
method method = Enzyme = Enzyme =
Linearity of
= Stability of = Purity variability
variability assay
nucleic acid = Variability
= Storage of isolation
= Storage
[0012] So that datasets can be compared, and that publicly available data is
of high quality,
minimum information guidelines for gene expression analysis experiments have
been
published in scientific journals for both PCR and microarrays (Bustin SA,
Benes V, Garson
JA, Hellemans J, Huggett J, et al. (2009) The MIQE Guidelines: Minimum
Information for
Publication of Quantitative Real-Time PCR Experiments. Clinical Chemistry 55:
611-622)
(Brazma A, Hingamp P, Quackenbush J, Sherlock G, Spellman P, et al. (2001)
Minimum
information about a microarray experiment (MIAME)-toward standards for
microarray data.
Nat Genet 29: 365-371) and are publicly available for RNA-seq (MINSEQE -
www.mged.org/minseqe/).
[0013] Normalisation of data to account for these effects using measured
biomarkers is
common. For example, an external positive control at a known concentration may
be run in
parallel with a sample. The value of the measured biomarker value in the
sample can then be
inferred (normalized) with reference to the measured external positive
control. This is the
concept behind a standard calibration curve used for normalisation. Another
common
normalisation method using measured biomarkers uses internal positive
controls; for
example, in an RNA sequencing experiment, certain genes (or groups of genes)
may be
assumed to have a constant biological level of expression (these are the
normalizer
biomarkers). Differences in the measured values for these normalizer
biomarkers between
CA 02986787 2017-11-22
WO 2016/187655 PCT/AU2016/050388
- 6 -
samples is then assumed to be non-biological. The measured values for each
sample are then
adjusted up or down such that the normalizer biomarkers in each sample have
the same value
and the data is then said to be normalized. The normalized values of each
biomarker may
then be directly compared between samples, for example for the diagnosis of a
medical
condition. Extensions of this concept are also known, for example Robust
Microarray
Analysis (Irizarry, RA; Hobbs, B; Collin, F; Beazer-Barclay, YD; Antonellis,
KJ; Scherf, U;
Speed, TP (2003). "Exploration, normalisation, and summaries of high density
oligonucleotide array probe level data.". Biostatistics 4 (2): 249-64) where
the measured
values for each sample are adjusted such that the normalized values for each
sample fit the
same distribution.
[0014] In practice, microarrays and RNA-seq and other platforms are often used
in the early
"discovery" or research stage of experimentation to generate sets of measured
biomarkers
covering the exome or genome or regulatory mechanisms thereof. The set of
measured
biomarkers generated in such discovery experiments may be upwards of 6,000
genes or
transcripts, or up to 1,000,000 peaks in the case of tandem mass spectrometry
discovery
datasets. There are typically many more measured biomarkers in each dataset
than patient
samples. This leads directly to false discovery problems as will be
appreciated by someone
skilled in the art of biomarker discovery. A false discovery is when a
measured biomarker
with no genuine biological correlation to the condition under consideration by
chance
happens to correlate to said condition. These false discoveries are
indistinguishable from true
discoveries until more patient samples have been tested.
[0015] Once certain biomarkers have been "discovered", or shown to be
significantly
correlated to the desired experimental endpoint, a minimal set of biomarkers
is often
migrated to an appropriate clinical device, such as qPCR or Point-Of-Care RNA-
sequencing
platforms, along with a minimal set of appropriate controls.
[0016] qPCR currently has significant and commercially attractive advantages
over
microarrays and RNA-seq (including targeted RNA-seq), especially when used in
a clinical
environment. Such advantages include fast turnaround time, limited technician
hands-on-
time to set up an assay, limited technical skill level required to run an
assay, accessibility and
CA 02986787 2017-11-22
WO 2016/187655 PCT/AU2016/050388
- 7 -
availability of PCR machines, small footprint of PCR machines, ease of results
interpretation,
limited need for supporting information technology infrastructure (software,
algorithms,
hardware, networks), limited license fees, availability and cost of reagents.
Such factors lead
to reduced cost of goods sold and a higher likelihood of market acceptance of
an assay.
[0017] The successful migration of relevant biomarkers to qPCR is currently
limited by a
number of factors including:
= Limited multiplexing capability
= Limited reporter dyes (with non-overlapping emission spectra or with good
spectral
resolution)
= The need for positive controls and spike-ins
= The need to run a passive reference dye
= Cost of spike-in controls
= Cost and added complexity of controls, especially external controls
= Sample prep limitations.
[0018] Such factors generally limit multiplex qPCR to two to four targets at
the maximum
since up to three dyes are used as controls (passive reference, internal,
spike-in).
[0019] Thus, for cost and practical reasons, there is a need for a better
control strategy in
gene expression analysis, and in particular one tailored for use in medical
devices.
[0020] Prior art practices in the design and use of controls in gene
expression analyses is
limited and is generally based on variations on the themes of the use of spike-
ins (artificial
sequences and naturally occurring sequences) and internal measured controls.
For example,
Vandesompele et al., (2002) (Vandesompele J, De Preter K, Pattyn F, Poppe B,
Van Roy N,
et al. (2002) Accurate normalisation of real-time quantitative RT-PCR data by
geometric
averaging of multiple internal control genes. Genome Biol 3: RESEARCH0034)
describe the
use of multiple internal control genes (a collection of measured biomarkers),
rather than just
a single internal control gene, and a method of identifying stably expressed
genes in different
tissues for the use of tissue-specific internal control genes. The authors
suggest that different
tissues may require the use of different internal control genes and that the
use of more than
CA 02986787 2017-11-22
WO 2016/187655 PCT/AU2016/050388
- 8 -
one internal control gene provides more consistent results with respect to
normalisation.
Prior to this publication it was generally accepted that a single gene was
sufficient for
normalisation and that the genes GAPDH, beta-2 microglobulin or 18S ribosomal
were stably
expressed across all tissues and all conditions, which has since been proven
to be incorrect,
especially in conditions that have a large effect on gene expression, such as
peripheral blood
gene expression in sepsis.
[0021] Fardin et al., (2007) (Fardin P, Moretti S, Biasotti B, Ricciardi A,
Bonassi S, et al.
(2007) Normalisation of low-density microarray using external spike-in
controls: analysis of
macrophage cell lines expression profile. BMC Genomics 8: 17. doi:10.1186/1471-
2164-8-
17) describe the use of artificial spike-in RNAs as a method of providing more
consistent
normalisation for low density array qPCR data, especially when the
distribution of up- and
down-regulated genes is asymmetric. Similarly, Jiang et al., (2011) (Jiang L,
Schlesinger F,
Davis CA, Zhang Y, Li R, et al. (2011) Synthetic spike-in standards for RNA-
seq
experiments. Genome Res 21: 1543-1551. doi:10.1101/gr.121095.111) describe
synthetic
RNA spike-in controls for use in RNA-seq experiments.
[0022] Various published patents describe the use of internal control genes
(measured
biomarkers) specifically for blood (EP2392668A2, U520100184608) or artificial
universal
spike-in (external) controls for use with any tissue type (U520030148339).
[0023] In the patent entitled "Diagnostic and Prognostic Tests" (U57622260)
the inventors
describe an approach using ratios of gene expression to diagnose biological
states or
conditions, in particular cancer, and for distinguishing malignant pleural
mesothelioma from
other lung cancers or from normal lung tissue, and for distinguishing between
subclasses of
malignant pleural mesothelioma.
Summary of the Present Invention
[0024] In one broad form the present invention seeks to provide a method for
validating
quantification of biomarkers, the biomarkers being quantified using a
quantification
technique of a selected type, and the method including:
CA 02986787 2017-11-22
WO 2016/187655 PCT/AU2016/050388
- 9 -
a) determining a plurality of biomarker values, each biomarker value being
indicative of a value measured or derived from a measured value, for at least
one
corresponding biomarker of the biological subject and being at least partially
indicative of a concentration of the biomarker in a sample taken from the
subject;
b) determining at least one control value by determining a combination of
biomarker
values;
c) comparing each control value to a respective control reference; and,
d) determining if the biomarker values are valid using results of the
comparison.
[0025] Typically at least first and second biomarker values are used to
determine an indicator
indicative of a test result, and wherein the method includes determining
control values
including:
a) a combination of the first and at least one other biomarker value; and,
b) a combination of the second and at least one other biomarker value.
[0026] Typically the method includes:
a) determining at least four biomarker values, the indicator being based on a
combination of:
i) a first indicator value calculated using first and second biomarker
values; and,
ii) a second indicator value calculated using third and fourth biomarker
values;
and,
b) determining control values including:
i) a first control value calculated using first and third biomarker values;
ii) a second control value calculated using first and fourth biomarker values;
iii) a third control value calculated using second and third biomarker values;
and,
iv) a fourth control value calculated using second and fourth biomarker
values.
[0027] Typically the method includes determining control values including:
a) a fifth control value calculated using first and second biomarker values;
b) a sixth control value calculated using third and fourth biomarker values;
and,
c) control values calculated using a combination of measured biomarkers not
used in
determining an indicator value.
CA 02986787 2017-11-22
WO 2016/187655 PCT/AU2016/050388
- 10 -
[0028] Typically the method includes calculating at least one of the indicator
values and the
control values by applying a function to the respective biomarker values.
[0029] Typically the function includes at least one of:
a) multiplying two biomarker values;
b) dividing two biomarker values;
c) a ratio of two biomarker values;
d) adding two biomarker values;
e) subtracting two biomarker values;
f) a weighted sum of at least two biomarker values;
g) a log sum of at least two biomarker values; and,
h) a sigmoidal function of at least two biomarker values.
[0030] Typically the method includes determining:
a) a first control value using a ratio of first and third biomarker values;
b) a second control value using a ratio of first and fourth biomarker values;
c) a third control value using a ratio of second and third biomarker values;
and,
d) a fourth control value using a ratio of second and fourth biomarker values.
[0031] Typically the method includes determining control values including:
a) a fifth control value using a ratio of first and second biomarker values;
b) a sixth control value using a ratio of third and fourth biomarker values;
and,
c) controls values calculated using a ratio of measured biomarkers not used in
determining an indicator value.
[0032] Typically the method includes:
a) determining a validity probability based on the result of the
comparison; and,
b) using the validity probability to determine if the biomarker values are
valid.
[0033] Typically the method includes:
a) determining a control value probability for the comparison of each control
value
to the respective control reference; and,
b) combining the control value probabilities to determine the validity
probability.
CA 02986787 2017-11-22
WO 2016/187655 PCT/AU2016/050388
-11-
100341 Typically the control reference is at least one of:
a) a control value threshold range;
b) a control value threshold; and,
c) a control value distribution.
[0035] Typically the control reference is a control value threshold range, and
wherein the
method includes:
a) comparing each control value to a respective control value threshold range;
and,
b) determining at least one of the biomarker values to be invalid if any one
of the
control values falls outside the respective control value threshold range.
[0036] Typically the control reference is a control value distribution, and
wherein the method
includes:
a) comparing each control value to a respective control value distribution;
and,
b) determining the validity using the results of the comparisons.
[0037] Typically each respective reference is derived from biomarker values
collected from a
number of individuals in a sample population.
[0038] Typically each respective reference is determined for at least part of
the sample
population.
[0039] Typically the sample population includes:
a) a plurality of individuals of different sexes;
b) a plurality of individuals of different ethnicities;
c) a plurality of healthy individuals;
d) a plurality of individuals suffering from at least one diagnosed medical
condition;
e) a plurality of individuals showing clinical signs of at least one medical
condition;
and,
f) first and second groups of individuals, each group of individuals
suffering from a
respective diagnosed medical condition.
CA 02986787 2017-11-22
WO 2016/187655 PCT/AU2016/050388
- 12 -
[0040] Typically the indicator is for use in determining the likelihood that a
biological
subject has at least one medical condition, and wherein the sample population
includes:
a) individuals presenting with clinical signs of the at least one medical
condition;
b) individuals diagnosed with the at least one medical condition; and,
c) healthy individuals.
[0041] Typically the indicator is determined by combining the first and second
derived
indicator values using a combining function, the combining function being at
least one of:
a) an additive model;
b) a linear model;
c) a support vector machine;
d) a neural network model;
e) a random forest model;
f) a regression model;
g) a genetic algorithm;
h) an annealing algorithm;
i) a weighted sum; and,
j) A nearest neighbour model.
[0042] Typically the method includes:
a) determining an indicator value;
b) comparing the indicator value to at least one indicator value range; and,
c) determining the indicator at least in part using a result of the
comparison.
[0043] Typically the indicator is indicative of a likelihood of the subject
having at least one
medical condition.
[0044] Typically the method includes generating a representation of the
indicator.
[0045] Typically the representation includes:
a) an alphanumeric indication of the indicator value;
b) a graphical indication of a comparison of the indicator value to one or
more
thresholds; and,
CA 02986787 2017-11-22
WO 2016/187655
PCT/AU2016/050388
- 13 -
c) an alphanumeric indication of a likelihood of the subject having at
least one
medical condition.
[0046] Typically the biomarker value is indicative of a level or abundance of
a molecule, cell
or organism selected from one or more of:
a) proteins;
b) nucleic acids;
c) carbohydrates;
d) lipids;
e) proteoglycans;
f) cells;
g) metabolites;
h) tissue sections;
i) whole organisms; and,
j) molecular complexes.
[0047] Typically the method is performed at least in part using one or more
electronic
processing devices.
[0048] Typically the indicator reference is retrieved from a database.
[0049] Typically the method includes, in the one or more electronic processing
devices:
a) receiving the biomarker values;
b) determining the at least one control value using at least two of the
biomarker
values;
c) comparing the at least one control value to the respective control value
threshold;
and,
d) determining if the test is a valid test using the results of the
comparison.
[0050] Typically the method includes, in the one or more electronic processing
devices:
a) determining the indicator by:
i) calculating a first indicator value using a ratio of first and
second biomarker
values;
CA 02986787 2017-11-22
WO 2016/187655 PCT/AU2016/050388
- 14 -
ii) calculating a second indicator value using a ratio of third and fourth
second
biomarker values; and,
iii) determining a sum of the first and second indicator values;
b) determining a plurality of control values by:
i) calculating a first control value using a ratio of the first and third
biomarker
values;
ii) calculating a second control value using a ratio of the first and fourth
biomarker values;
iii) calculating a third control value using a ratio of the second and third
biomarker values; and,
iv) calculating a fourth control value using a ratio of the second and fourth
biomarker values;
c) comparing each control value to a respective threshold range; and,
d) displaying the indicator in response to a successful comparison for each
control
value.
[0051] Typically the method includes, in the one or more electronic processing
devices:
a) calculating a fifth control value using a ratio of the first and second
biomarker
values;
b) calculating a sixth control value using a ratio of the third and fourth
biomarker
values; and,
c) calculating an additional or set of control values by using a combination
of
biomarkers not used in determining an indicator value.
[0052] Typically the biomarkers are gene expression products and wherein the
method
includes:
a) obtaining a sample from a biological subject, the sample including the gene
expression products;
b) amplifying at least the gene expression products in the sample; and,
CA 02986787 2017-11-22
WO 2016/187655 PCT/AU2016/050388
- 15 -
c) for each gene expression product, determining an amplification amount
representing a degree of amplification required to obtain a defined level of
the
respective gene expression.
[0053] Typically the amplification amount is at least one of:
a) a cycle time;
b) a number of cycles;
c) a cycle threshold; and,
d) an amplification time.
[0054] Typically the biomarkers are gene expression products and wherein the
method
includes, determining a combination of biomarker values by subtracting
amplification
amounts for the respective gene expression products so that the combination of
biomarker
values represents a ratio of the relative concentration of the respective gene
expression
products.
[0055] Typically the biomarker values are obtained from a biological subject
presenting with
clinical signs of at least one medical condition.
[0056] Typically the at least one condition includes ipSIRS (infection
positive Systemic
Inflammatory Response Syndrome) and wherein the biomarker values correspond to
relative
concentrations of LAMP1, CEACAM4, PLAC8 and PLA2G7.
[0057] Typically the biomarker values are obtained from a biological subject
presenting with
clinical signs common to first and second conditions and wherein the indicator
is for use in
distinguishing between the first and second conditions.
[0058] Typically the first and second conditions include inSIRS (infection
negative Systemic
Inflammatory Response Syndrome) and ipSIRS.
[0059] Typically the quantification technique is at least one of:
a) a nucleic acid amplification technique;
b) polymerase chain reaction (PCR);
CA 02986787 2017-11-22
WO 2016/187655 PCT/AU2016/050388
- 16 -
c) a hybridisation technique;
d) microarray analysis;
e) low density arrays;
I) hybridisation with allele-specific probes;
g) enzymatic mutation detection;
h) ligation chain reaction (LCR);
i) oligonucleotide ligation assay (OLA);
j) flow-cytometric heteroduplex analysis;
k) chemical cleavage of mismatches;
1) mass spectrometry;
m) flow cytometry;
n) liquid chromatography;
o) gas chromatography;
p) immunohistochemistry;
q) nucleic acid sequencing;
r) single strand conformation polymorphism (SSCP);
s) denaturing gradient gel electrophoresis (DGGE);
t) temperature gradient gel electrophoresis (TGGE);
u) restriction fragment polymorphisms;
v) serial analysis of gene expression (SAGE);
w) affinity assays;
x) radioimmunoassay (MA);
y) lateral flow immunochromatography;
z) flow cytometry;
aa) electron microscopy (EM); and,
bb) enzyme-substrate assay.
[0060] In one broad form the present invention seeks to provide apparatus for
validating
measurement of biomarker values used in generating an indicator, the
biomarkers being
quantified using a quantification technique of a selected type, and the
apparatus including at
least one processing device that:
CA 02986787 2017-11-22
WO 2016/187655 PCT/AU2016/050388
- 17 -
a) determines a plurality of biomarker values, each biomarker value being
indicative
of a value measured or derived from a measured value, for at least one
corresponding biomarker of the biological subject and being at least partially
indicative of a concentration of the biomarker in a sample taken from the
subject;
b) determines at least one control value by determining a combination of
biomarker
values;
c) compares each control value to a respective control reference; and,
d) determines if the biomarker values are valid using results of the
comparison.
[0061] In one broad form the present invention seeks to provide a method for
validating an
indicator used in determining the likelihood of a biological subject having at
least one
medical condition, the biomarkers being quantified using a quantification
technique of a
selected type and the method including:
a) determining a plurality of biomarker values, each biomarker value being
indicative of a value measured or derived for at least one corresponding
biomarker
of the biological subject;
b) determining an indicator indicative of the likelihood of a biological
subject having
at least one medical condition by:
i) calculating a first indicator value using first and second biomarker
values;
ii) calculating a second indicator value using third and fourth second
biomarker
values; and,
iii) determining the indicator using the first and second indicator values;
c) calculating at least one of:
i) a first control value using the first and third biomarker values;
ii) a second control value using the first and fourth biomarker values;
iii) a third control value using the second and third biomarker values;
iv) a fourth control value using the second and fourth biomarker values;
v) a fifth control value using the first and fourth second values;
vi) a sixth control value using the third and fourth biomarker values; and,
vii) an additional or set of control values by using a combination of
biomarkers
not used in determining an indicator value;
CA 02986787 2017-11-22
WO 2016/187655 PCT/AU2016/050388
- 18 -
d) comparing the at least one control value to a respective control value
threshold;
and,
e) selectively validating the indicator using the results of the
comparison.
[0062] In one broad form the present invention seeks to provide apparatus for
validating an
indicator indicative of measured values of gene expression products, the
biomarkers being
quantified using a quantification technique of a selected type, the apparatus
including at least
one processing device that:
a) determines a plurality of biomarker values, each biomarker value being
indicative
of a value measured or derived for at least one corresponding biomarker of the
biological subject;
b) determines the indicator by:
i) calculating a first indicator value using first and second biomarker
values;
ii) calculating a second indicator value using third and fourth second
biomarker
values; and,
iii) determining the indicator using the first and second indicator values;
c) calculates at least one of:
i) a first control value using the first and third biomarker values;
ii) a second control value using the first and fourth biomarker values;
iii) a third control value using the second and third biomarker values;
iv) a fourth control value using the second and fourth biomarker values;
v) a fifth control value using the first and second biomarker values;
vi) a sixth control value using the third and fourth biomarker values; and,
vii) an additional or set of control values by using a combination of
biomarkers
not used in determining an indicator value.
d) compares the at least one control value to a respective control value
threshold;
and,
e) selectively validates the indicator using the results of the
comparison.
[0063] In one broad form the present invention seeks to provide a method for
validating an
indicator used in determining the likelihood of a biological subject having at
least one
CA 02986787 2017-11-22
WO 2016/187655 PCT/AU2016/050388
- 19 -
medical condition, the biomarkers being quantified using a quantification
technique of a
selected type and the method including:
a) obtaining a sample from a biological subject, the sample including gene
expression products;
b) quantifying at least some gene expression products in the sample to
determine a
concentration of the gene expression product in the sample;
c) determining an indicator indicative of the likelihood of a biological
subject having
at least one medical condition by combining:
i) a first indicator value indicative of a ratio of the concentration of
the first and
second gene expression products; and,
ii) a second indicator value indicative of a ratio of the concentration of the
third
and fourth gene expression products;
d) determining control values by determining at least one of:
i) a first control value indicative of a ratio of the concentration of the
first and
third gene expression products;
ii) a second control value indicative of a ratio of the concentration of the
first and
fourth gene expression products;
iii) a third control value indicative of a ratio of the concentration of the
second
and third gene expression products;
iv) a fourth control value indicative of a ratio of the concentration of the
second
and fourth gene expression products;
v) a fifth control value indicative of a ratio of the concentration of the
first and
second gene expression products;
vi) a sixth control value indicative of a ratio of the concentration of the
third and
fourth gene expression products; and,
vii) an additional or set of control values by using a combination of gene
expression products not used in determining an indicator value;
e) comparing each control value to a respective control value threshold range;
and,
f) validating the indicator if each of the control values is within the
respective
control value range.
CA 02986787 2017-11-22
WO 2016/187655 PCT/AU2016/050388
- 20 -
[0064] Typically the method includes quantifying the concentration of the gene
expression
products by:
a) amplifying at least some gene expression products in the sample; and,
b) for each of a plurality of gene expression products, determining an
amplification
amount representing a degree of amplification required to obtain a defined
level of
the respective gene expression product.
[0065] Typically the method includes:
a) determining the indicator by:
i) determining a first indicator value calculated using the first and
second
amplification times indicative of the concentration of first and second gene
expression products; and,
ii) a second indicator value calculated using third and fourth amplification
times
indicative of the relative concentration of third and fourth gene expression
products; and,
b) determining control values by determining at least one of:
i) a first control value calculated using first and third amplification
times
indicative of the relative concentration of first and third gene expression
products;
ii) a second control value calculated using first and fourth amplification
times
indicative of the relative concentration of first and fourth gene expression
products;
iii) a third control value calculated using second and third amplification
times
indicative of the relative concentration of second and third gene expression
products;
iv) a fourth control value calculated using second and fourth amplification
times
indicative of the relative concentration of second and fourth gene expression
products;
v) a fifth control value calculated using first and second amplification times
indicative of the relative concentration of first and second gene expression
products;
CA 02986787 2017-11-22
WO 2016/187655 PCT/AU2016/050388
-21 -
vi) a sixth control value calculated using third and fourth amplification
times
indicative of the relative concentration of third and fourth gene expression
products; and
vii) an additional or set of control values by using a combination of
amplification
times not used in determining an indicator value.
[0066] In one broad form the present invention seeks to provide apparatus for
validating an
indicator used in determining the likelihood of a biological subj ect having
at least one
medical condition, the apparatus including:
a) a sampling device that obtains a sample from a biological subject, the
sample
including gene expression products;
b) a quantification device that quantifies at least some gene expression
products in
the sample to determine a concentration of the gene expression product in the
sample; and,
c) at least one processing device that:
i) determines an indicator indicative of the likelihood of a
biological subject
having at least one medical condition by combining:
(1) a first indicator value indicative of a ratio of the concentration of the
first
and second gene expression products; and,
(2) a second indicator value indicative of a ratio of the concentration of the
third and fourth gene expression products;
ii) determines control values by determining at least one of:
(1) a first control value indicative of a ratio of the concentration of the
first
and third gene expression products;
(2) a second control value indicative of a ratio of the concentration of the
first
and fourth gene expression products;
(3) a third control value indicative of a ratio of the concentration of the
second
and third gene expression products;
(4) a fourth control value indicative of a ratio of the concentration of the
second and fourth gene expression products;
CA 02986787 2017-11-22
WO 2016/187655 PCT/AU2016/050388
- 22 -
(5) a fifth control value indicative of a ratio of the concentration of the
first
and second gene expression products;
(6) a sixth control value indicative of a ratio of the concentration of the
third
and fourth gene expression products; and,
(7) an additional or set of control values indicative of a ratio of the
concentration of biomarkers not used in determining an indicator value;
iii) compares each control value to a respective control value threshold
range;
and,
iv) validates the indicator if each of the control values is within the
respective
control value range.
[0067] In one broad form the present invention seeks to provide a method for
validating
quantification of biomarkers , and the method including:
a) determining a plurality of biomarker values, each biomarker value being
indicative of a value measured or derived from a measured value, for at least
one
corresponding biomarker of the biological subject and being at least partially
indicative of a concentration of the biomarker in a sample taken from the
subject;
b) determining at least one control value by determining a combination of
biomarker
values;
c) comparing each control value to a respective control reference; and,
d) determining if the biomarker values are valid using results of the
comparison,
wherein the biomarker value is indicative of a level or abundance of a
molecule,
cell or organism selected from one or more of:
i) proteins;
ii) nucleic acids;
iii) carbohydrates;
iv) lipids;
v) proteoglycans;
vi) cells; and,
vii)pathogenic organisms.
CA 02986787 2017-11-22
WO 2016/187655 PCT/AU2016/050388
- 23 -
[0068] In one broad form the present invention seeks to provide a method for
validating
quantification of biomarkers, the method including:
a) determining a plurality of biomarker values, each biomarker value being
indicative of a value measured or derived from a measured value, for at least
one
corresponding biomarker of the biological subject and being at least partially
indicative of a concentration of the biomarker in a sample taken from the
subject;
b) determining at least one control value by determining a combination of
biomarker
values;
c) comparing each control value to a respective control reference; and,
d) determining if the biomarker values are valid using results of the
comparison,
wherein the biomarker value is indicative of a level or abundance of a
molecule,
cell or organism selected from one or more of:
i) proteins;
ii) nucleic acids;
iii) carbohydrates;
iv) lipids;
v) proteoglycans;
vi) cells;
vii)metabolites;
viii) tissue sections;
ix) whole organisms; and,
x) molecular complexes.
[0069] In one broad form the present invention seeks to provide a method for
validating
quantification of biomarkers, the method including:
a) determining a plurality of biomarker values, each biomarker value being
indicative of a value measured or derived from a measured value, for at least
one
corresponding biomarker of the biological subject and being at least partially
indicative of a concentration of the biomarker in a sample taken from the
subject;
b) determining at least one control value by determining a combination of
biomarker
values;
CA 02986787 2017-11-22
WO 2016/187655
PCT/AU2016/050388
- 24 -
c) comparing each control value to a respective control reference; and,
d) determining if the biomarker values are valid using results of the
comparison,
wherein the biomarkers are quantified using at least one of:
i) a nucleic acid amplification technique;
ii) polymerase chain reaction (PCR);
iii) a hybridisation technique;
iv) microarray analysis;
v) low density arrays;
vi) hybridisation with allele-specific probes;
vii) enzymatic mutation detection;
viii) ligation chain reaction (LCR);
ix) oligonucleotide ligation assay (OLA);
x) flow-cytometric heteroduplex analysis;
xi) chemical cleavage of mismatches;
xii)mass spectrometry;
xiii) flow cytometry;
xiv) liquid chromatography;
xv) gas chromatography;
xvi) immunohistochemistry;
xvii) nucleic acid sequencing;
xviii) single strand conformation polymorphism (SSCP);
xix) denaturing gradient gel electrophoresis (DGGE);
xx) temperature gradient gel electrophoresis (TGGE);
xxi) restriction fragment polymorphisms;
xxii) serial analysis of gene expression (SAGE);
xxiii) affinity assays;
xxiv) radioimmunoassay (RIA);
xxv) lateral flow immunochromatography;
xxvi) flow cytometry;
xxvii) electron microscopy (EM); and,
xxviii) enzyme-substrate assay.
CA 02986787 2017-11-22
WO 2016/187655 PCT/AU2016/050388
- 25 -
[0070] It will be appreciated that the broad forms of the invention and their
respective
features can be used in conjunction, interchangeably and/or independently, and
reference to
separate broad forms is not intended to be limiting.
Brief Description of the Drawings
[0071] An example of the present invention will now be described with
reference to the
accompanying drawings, in which: -
[0072] Figure 1A is a flow chart of an example of a method for validating
measurement of
biomarker values;
[0073] Figures 1B and 1C are flow charts of an example of the comparison of
independent
and relative control approaches;
[0074] Figure 2 is a schematic diagram of an example of a distributed computer
architecture;
[0075] Figure 3 is a schematic diagram of an example of a base station
processing system;
[0076] Figure 4 is a schematic diagram of an example of a client device of
Figure 2;
[0077] Figure 5 is a flowchart of an example of a method for validating an
indicator derived
from biomarker measurements and corresponding reference distributions;
[0078] Figure 6 is a flowchart of an example of a method for validating an
indicator derived
from biomarker measurements;
[0079] Figure 7A is schematic diagram of an indication of the relationship of
biomarker
values in the process of Figure 5;
[0080] Figure 7B is schematic diagram of an indication of the relationship of
biomarker
values to a control in a standard control arrangement;
[0081] Figures 8A and 8B are a flowchart of an example of a method for
validating an
indicator derived from biomarker measurements;
[0082] Figures 9A and 9B are schematic diagrams of examples of representations
of
indicator values;
[0083] Figure 10A is a flow chart of an example of the standard use of
controls in a multi-
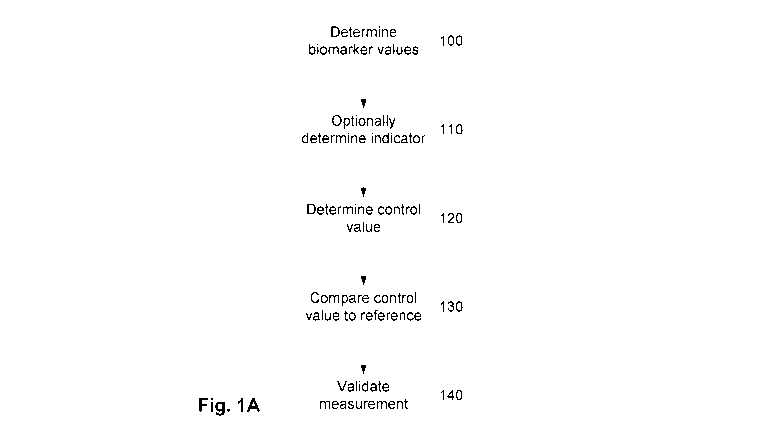
biomarker medical device;
[0084] Figure 10B is a flow chart of an example of the use of relative
controls in place of
standard controls in a multi-biomarker medical device;
CA 02986787 2017-11-22
WO 2016/187655 PCT/AU2016/050388
- 26 -
100851 Figure 10C is a flow chart of an example of the us of a hybrid of
standard and relative
controls in a multi-biomarker medical device
100861 Figure 11A is plots of cycle times obtained for measured biomarkers
over a range of
concentrations;
100871 Figure 11B is plots indicator values for biomarker values derived from
the cycle times
of Figure 11A;
100881 Figure 12A is a density plot of measured biomarker values for a sample
population;
100891 Figures 12B (a)-(f) are plots of each measured biomarker value for an
invalid sample
shown against the reference population of measured biomarkers;
100901 Figures 12C (a)-(f) are plots of derived control values for an invalid
sample shown
against the reference derived control values.
100911 Figure 12D is a scatterplot showing the invalid sample against one of
the reference
derived control biomarkers.
100921 Figures 13A (a)-(d) are plots showing an invalid sample against a
reference
population of measured biomarkers.
100931 Figures 13B (a)-(0 are plots showing the same invalid sample against a
reference
population of derived control biomarkers.
Detailed Description of the Preferred Embodiments
100941 An example of a process for validating measurement of biomarkers for
use in
determining an indicator, such an as an indicator indicative of the likelihood
of a biological
subject having at least one predominant medical condition will now be
described with
reference to Figure 1.
100951 For the purpose of explanation, a number of different terms will be
used.
100961 For example, the term "biomarker" refers to any quantifiable value, or
combination or
derivative of parameters, that can be used as an indicator of a biological
state. In the context
of the current application, biomarkers include proteins, nucleic acids, such
as DNA, RNA or
the like, carbohydrates, lipids, proteoglycans, cells, metabolites, tissue
sections, whole
SUBSTITUTE SHEET (RULE 26)
CA 02986787 2017-11-22
WO 2016/187655 PCT/AU2016/050388
- 27 -
organisms (e.g. pathogenic and non-pathogenic microorganisms) and molecular
complexes
(e.g. protein / nucleic acid complex), or the like.
[0097] The term "biomarker value" refers to a value determined by quantifying
the amount
of, abundance of, level of, concentration of, quantity of, or activity of, the
corresponding
biomarker within a subject or individual. The biomarker value can be based on
a measured
biomarker value or a value derived therefrom, and examples will be described
in more detail
below.
[0098] The term "reference biomarkers" is used to refer to biomarkers whose
values are
known for a sample population of one or more individuals having one or more
conditions,
stages of one or more conditions, subtypes of one or more conditions or
different prognoses.
The term "reference data" refers to data measured for one or more individuals
in a sample
population, and may include quantification of the level or activity of the
biomarkers
measured for each individual, information regarding any conditions of the
individuals, and
optionally any other information of interest including derived biomarkers
which have been
derived from measured markers. Reference biomarkers are named for their
primary purpose
of providing a reference against which new or unknown samples can be compared.
[0099] The term "indicator values" is used to refer to combinations of
biomarker values that
are used in deriving an indicator, which may be indicative of the likelihood
of a subject
suffering from a biological condition. The indicator could be in the form of
an absolute or
relative numerical or other value, and could be based on comparison of a value
to one or
more thresholds.
[0100] The term "test" is used to refer to mechanism that is used in
quantifying a plurality of
biomarkers to determine respective biomarker values, which can then be used
subsequently
in determining indicator values. The "test" could include one or more
measurement
processes or steps, that could be performed collectively or independently, but
which are
performed using a quantification platform or technique of a selected type. The
"test" may
form a part of a broader "medical assessment", which could include a number of
different
CA 02986787 2017-11-22
WO 2016/187655 PCT/AU2016/050388
- 28 -
tests, performed to allow for the diagnosis of a presence, absence, degree or
prognosis
associated with a medical condition.
[0101] The terms "quantification platform of a selected type" and
"quantification technique
of a selected type" are used interchangeably herein to refer to a device
and/or method or
combination of devices and/or methods that can determine the amount of,
abundance of, level
of, concentration of, quantity of, or activity of, one or more biomarkers of
interest where
either quality control measures are used as part of the overall procedure, or
the use of
control(s) is / are used. Representative examples of such include nucleic acid
amplification
techniques including polymerase chain reaction (PCR) (e.g., PCR-based methods
such as real
time polymerase chain reaction (RT-PCR), quantitative real time polymerase
chain reaction
(Q-PCR/qPCR), use of PCR to analyse chromatin conformation (CCA), and the
like),
hybridisation techniques including mi cro array analysis, low density arrays,
hybridisation
with allele-specific probes, enzymatic mutation detection, ligation chain
reaction (LCR),
ol i gonucl eoti de ligation assay (OLA), flow-cytometric heterodupl ex
analysis, chemical
cleavage of mismatches, mass spectrometry, flow cytometry, liquid
chromatography, gas
chromatography, immunohistochemistry, nucleic acid sequencing (including next
generation
sequencing, ChIP-seq, DNA methylation analyses), single strand conformation
polymorphism (SSCP), denaturing gradient gel electrophoresis (DGGE),
temperature
gradient gel electrophoresis (TGGE), restriction fragment polymorphisms,
serial analysis of
gene expression (SAGE), affinity assays including immunoassays such as
immunoblot,
immunoprecipitation, enzyme-linked immunosorbent assay (ELISA; ETA), lateral
flow
immunochromatography, radioimmunoassay (RIA), electron microscopy (EM), enzyme-
substrate assay, or combinations thereof
[0102] The term "control" is used to refer to a mechanism utilised on order to
determine a
pass or fail state for the validity of a test, and therefore the validity of
the output.
[0103] Controls can include "independent controls", which are added to a test
and are
independent of the biomarkers being quantified. Thus, the independent controls
are
independent of the measured biomarkers and can be considered a stand-alone
test for the
validity of the test overall. An example is a synthetically produced in vitro
transcript in a
CA 02986787 2017-11-22
WO 2016/187655 PCT/AU2016/050388
- 29 -
gene expression test at a known concentration. In this case, the sample being
tested (ie blood)
does not interact at all with the independent control. The control serves only
to ensure that
the reagents used across the whole test are capable of reproducing a value for
this
independent control to the expected value.
[0104] The term "control values" is used to refer to combinations of biomarker
values or
indicators that are used in assessing whether biomarker values, such as the
biomarker values
used to derive indicator values and the resulting indicator values, are valid.
In this regard, a
biomarker value or indicator value may be invalid if it has been incorrectly
measured,
calculated or quantified and as such is not genuinely indicative of the target
condition, or if
it's value is sufficiently rarely represented in the corresponding reference
data that it could be
reasonably presumed as true that the value could not have derived from a
successful test and
therefore the assay should be declared invalid (in the case of a failed
control). Examples of p
values that may be considered presumed to be true range from:
= 0.50 to 0.20
= 0.20 to 0.10
= 0.10 to 0.05
= 0.05 to 0.01
= 0.01 to 0.001
= 0.001 to zero.
[0105] Control values are "Relative Controls" that define a pass or fail state
of a test that are
not independent of the biomarkers being quantified. For example, if there are
two markers
measured in the test marker A and marker B, then one way in which these
markers may be
relative to each other is the ratio of marker A to marker B. This relationship
is a control if its
value is used to pass or fail the validity of a test. In this example, if the
ratio of marker A to
marker B is a value outside of an acceptable range, the test will be declared
invalid.
[0106] A "positive control" is used to show that the test is able to produce a
positive result.
Typically the positive control is designed so that when exposed to the same
treatment as the
other markers being measured it will result in a detection at a certain level.
The assumption is
that if the treatment worked acceptably for the positive control, then it also
worked for the
CA 02986787 2017-11-22
WO 2016/187655 PCT/AU2016/050388
- 30 -
other assays in the test. An example of where this will be useful is in the
case where the test
has been exposed to unacceptable temperatures during transport, which has
destroyed some
key ingredient in the test. With a key ingredient destroyed, the positive
control will not work
as expected and the test will be declared invalid.
[0107] A "negative control" is used to show that the test is able to produce a
negative result.
Typically the negative control is designed so that when exposed to the same
treatment as the
other markers being measured it will result in a detection below a certain
level (usually below
the detectable limit of the test). The assumption is that if the treatment did
not result in
positive detection for the negative control, then the other assays in the test
are also capable of
a negative detection.
[0108] The terms "biological subject", "subject," "individual" and "patient"
are used
interchangeably herein to refer to an animal subject, particularly a
vertebrate subject, and
even more particularly a mammalian subject. Suitable vertebrate animals that
fall within the
scope of the invention include, but are not restricted to, any member of the
subphylum
Chordata including primates, rodents (e.g., mice rats, guinea pigs),
lagomorphs (e.g., rabbits,
hares), bovines (e.g., cattle), ovines (e.g., sheep), caprines (e.g., goats),
porcines (e.g., pigs),
equines (e.g., horses), canines (e.g., dogs), felines (e.g., cats), avians
(e.g., chickens, turkeys,
ducks, geese, companion birds such as canaries, budgerigars etc.), marine
mammals (e.g.,
dolphins, whales), reptiles (snakes, frogs, lizards, etc.), and fish. A
preferred subject is a
primate (e.g., a human, ape, monkey, chimpanzee).
[0109] As used herein, the term SIRS ("systemic inflammatory response
syndrome") refers
to a clinical response arising from a non-specific insult with two or more of
the following
measureable clinical characteristics; a body temperature greater than 38 C or
less than
36 C, a heart rate greater than 90 beats per minute, a respiratory rate
greater than 20 per
minute, a white blood cell count (total leukocytes) greater than 12,000 per
mm3 or less than
4,000 per mm3, or a band neutrophil percentage greater than 10%. From an
immunological
perspective, it may be seen as representing a systemic response to insult
(e.g., major surgery)
or systemic inflammation. As used herein, "inSIRS" (which includes within its
scope "post-
surgical" (PS) inflammation) includes the clinical response noted above but in
the absence of
CA 02986787 2017-11-22
WO 2016/187655 PCT/AU2016/050388
- 31 -
a systemic infectious process (infection-negative systemic inflammatory
response syndrome).
By contrast, "ipSIRS" (infection-positive systemic inflammatory response
syndrome)
includes the clinical response noted above but in the presence of a presumed
or confirmed
infection. Presumed infection can be based on clinician's judgement whereas
confirmation of
an infection can be determined using microbiological culture, isolation or
detection of the
infectious agent or through the use of other parameters that provide evidence
of infection.
From an immunological perspective, ipSIRS may be seen as a systemic response
to
microorganisms, be it a local, peripheral or systemic infection.
[0110] As used herein, the term "likelihood" of a condition refers to a level
of certainty
associated with whether or not the subject may be suffering from a condition.
It should be
noted that this does not necessarily correlate with a degree, seriousness,
severity, stage or
state of a condition.
[0111] It will be appreciated that the above described terms and associated
definitions are
used for the purpose of explanation only and are not intended to be limiting.
[0112] In this example, the method includes determining a plurality of
biomarker values at
step 100, each biomarker value being indicative of a value measured or derived
for at least
one biomarker of the biological subject.
[0113] The biomarker values can be of any appropriate form and in particular
can relate to
any attribute of a subject for which a value can be quantified. This technique
is particularly
suited to high-throughput technologies such as mass spectrometry, sequencing
platforms,
array and hybridisation platforms, immunoassays, flow cytometry, and in one
preferred
example, the biomarker values relate to a level of activity or abundance of an
expression
product or other measurable molecule.
[0114] The biomarker values could be measured biomarker values, which are
values of
biomarkers measured for the subject, or alternatively could be derived
biomarker values,
which are values that have been derived from one or more measured biomarker
values, for
example by applying a function to the one or more measured biomarker values.
As used
CA 02986787 2017-11-22
WO 2016/187655 PCT/AU2016/050388
- 32 -
herein, biomarkers to which a function has been applied are referred to as
"derived
biomarkers".
[0115] The biomarker values may be determined in any one of a number of ways.
In one
example, the process of determining the biomarker values can include measuring
the
biomarker values, for example by obtaining a sample from the biological
subject and then
quantifying the biomarkers within the sample. More typically however, the step
of
determining the biomarker values includes having an electronic processing
device receive or
otherwise obtain biomarker values that have been previously measured or
derived. This
could include for example, retrieving the biomarker values from a data store
such as a local
or remote instrument or database, obtaining biomarker values that have been
manually input,
using an input device, or the like.
[0116] At step 110 an indicator can optionally be determined with the
indicator being at least
partially based on the biomarker values. The indicator is generally indicative
of a test result
and can be determined in any one of a number of ways and may be at least
partially based on
a ratio of biomarker values, as will be described in more detail below.
However, this is not
essential and alternatively the biomarker values could be used to validate
that the
quantification has been performed correctly, with indicators or other
interpretation of the
biomarker values being performed in subsequent downstream processes.
[0117] At step 120 one or more control values are determined. The control
values are
determined based on a combination of the biomarker values. The biomarker
values can be
combined in any one of a number of ways and this can include for example
adding,
multiplying, subtracting, or dividing biomarker values to determine the
control value. This
step is performed so that multiple biomarker values can be combined into a
single control
value, and typically a self-normalised value, as will be described in more
detail below.
[0118] At step 130 each control value is compared to a respective control
reference. The
respective control reference is typically established based on reference
control values
determined for a sample population including a mixture of healthy individuals
and
individuals suffering from or demonstrating clinical signs of one or more
conditions. The
CA 02986787 2017-11-22
WO 2016/187655 PCT/AU2016/050388
- 33 -
control reference can be a single threshold value or a range defined by
respective upper and
lower values but more typically is in the form of distribution of control
values.
[0119] At step 140 measurements of the biomarker values are validated using
results of the
comparison. Thus, if any control values are beyond/under the threshold,
outside of a defined
threshold range, or beyond a certain point in the threshold, or beyond a
certain point of the
distribution, this is used to indicate that the ascertained biomarker values
measured are not
suitable for use in generating an indicator that is reliable enough for use in
determining the
likelihood of a condition.
[0120] Accordingly, the above technique uses different combinations of
biomarker values to
identify if biomarker values are valid.
[0121] In one example, the control values are based on a combination of
biomarker values,
which differs to a combination of biomarkers used to establish an indicator
indicative of a
test result. For example, if values are quantified for three biomarkers for
the subject, namely
A, B and C, and the biomarker values A and B are used to establish the
indicator, then
combinations of A and C and B and C can be used to determine the control
values.
[0122] In this example, if measurement of biomarker A is spurious, for
example, due to
failures in acquiring, storing or processing of a sample from the subject, or
the like, this could
result in an indicator value based on the combination of biomarkers A and B
which is
indicative of the subject having or not having a condition. However, in
reality, because the
measurement biomarker A is incorrect, this result is meaningless, and hence
could lead to
inaccurate diagnosis if relied upon.
[0123] In this case, by also determining values of control values using the
combinations of A
and C and B and C, it will be identified that the control value corresponding
to A and C is
outside an expected range for individuals either having or not having a
condition of interest,
meaning that the biomarker values for A and/or B are not valid, and hence
can't be used in
establishing an accurate indicator.
CA 02986787 2017-11-22
WO 2016/187655 PCT/AU2016/050388
- 34 -
[0124] Thus, the above described process recognises that biomarkers values are
typically
within defined ranges for individuals regardless or not of whether they are
suffering from
conditions. Thus by measuring various combinations of different biomarker
values, and
comparing these to established ranges for a reference population of
individuals having a
range of different conditions, including healthy individuals, this can be used
to establish
whether the biomarker values are within expected ranges.
[0125] It will be further appreciated that whilst this could in theory be
performed using
individual biomarkers as opposed to combinations, this would require the
ability to measure
absolute values, such as absolute concentrations of biomarkers within a
sample, which
generally cannot be achieved. This is typically addressed through the use of
independent
controls, so that the concentration of biomarkers relative to a control of
known concentration
is measured. However, the use of such independent controls is typically
expensive, as the
control biomarkers themselves are difficult to produce, introduce complexity,
and also limit
the number of biomarkers that can be measured by the ability of the measuring
procedures, so
as more controls are introduced, this reduces the number of biomarkers that
can be measured
for the subject. However, by using combinations of biomarker values, such as
ratios, or the
like, this allows the measured biomarker values to be indicative of relative
concentrations,
and hence self-normalising. In particular, if the ultimate output is based on,
for example,
ratios of genes, then measurements of validity using similar ratios of genes
is more intuitive,
robust, and appropriate. Thus, by comparing different combinations of
biomarker values to
thresholds, this allows checks to be performed of the validity of the measured
value in the
native measurement space (i.e. ratios), essentially leading to a self-
validating test without the
need for measurement of independent controls.
[0126] Such an approach provides a better control strategy. Using the
biomarkers being
measured as controls specifically addresses issues associated with normalising
results,
improves the statistical power for the detection of failed assays, reduces the
overall number
of controls used, reduces the complexity of an assay and reduces overall assay
cost and risk.
[0127] Firstly and by example, by using the described control strategy, many
biomarkers can
be used to define derived biomarkers for use as control ranges against a
corresponding
CA 02986787 2017-11-22
WO 2016/187655 PCT/AU2016/050388
- 35 -
reference range for each derived biomarker. These biomarkers need not be those
involved in
the indictor biomarkers used for classification of the patient for the
condition of interest.
Using many relative internal biomarkers for this purpose has a smoothing and
stabilizing
effect on normalisation thereby reducing overall variance.
[0128] Secondly, by relying on external or spike-in controls, if there is a
failure of these
controls, the assay will be called invalid, even if the result from the
measured genes, and
therefore of the indicator value, is accurate. Thirdly, by measuring multiple
interactions
between measured biomarkers by looking at the larger number of relative
biomarkers
available, there are more relevant control checks for each biomarker being
measured,
resulting in higher statistical power, confidence and sensitivity. Fourthly,
by avoiding the use
of external controls, or use of extraneous housekeeping controls, the
complexity of the assay
is reduced which translates to decreased cost and risk.
[0129] In particular, this technique can avoid the need for independent
controls, by using
control values derived from measured biomarkers of interest to self validate a
test. This
approach is exemplified by comparison of the independent and relative control
approaches,
shown in Figures 1B and 1C.
[0130] As shown in this example, in each case, biomarker values are measured
at steps 151,
161 and used to generate indicator values at steps 152, 162. In the dependent
controls
process, separate controls are measured at step 153 and assessed to determine
if these are in
an expected range at step 154. In contrast, in the relative controls approach,
the measured
biomarker values are used to derive control values at step 163, which are then
assessed to
determine if they are within the expected range at step 164. In each case, if
the control is in
range, the test results are reported at steps 155, 165, otherwise the test is
failed at step 156,
166.
[0131] Thus, it can be seen the relative controls formed from control values
derived from the
measured biomarker values can be used in a manner similar to independent
controls, but
without requiring the presence of independent controls. This avoids the need
for additional
control markers, meaning the test can be cheaper. This also avoids the need
for added
CA 02986787 2017-11-22
WO 2016/187655 PCT/AU2016/050388
- 36 -
independent controls failing independently, which can needlessly invalidate a
valid test.
Additionally, relationships between measured markers put tighter and more
numerous
constraints on expected values, thus increasing statistical power and
therefore confidence in
detection of an invalid test, as will be described in more detail below.
[0132] A number of further features will now be described.
[0133] In one example, at least three biomarker values are used, with first
and second
biomarker values being used to determine the indicator and with the control
values being
determined using a combination of the first and at least one other biomarker
value and the
second and at least one other biomarker value. However, in another preferred
example, the
method includes determining at least four biomarker values. In this case, the
indicator can be
based on a combination of a first indicator value calculated using first and
second biomarker
values and a second indicator value calculated using third and fourth
biomarker values.
These two indicator values can then be combined to form the indicator, which
combines the
discriminatory power of each of the first two indicator values. This allows
two independent
pairs of biomarker values to be combined and used to establish the indicator,
which can
significantly enhance the ability of the indicator to discriminate the
likelihood of the subject
having the condition.
[0134] Furthermore, when using four biomarker values, this allows at least
four control
values to be determined including a first control value calculated using first
and third
biomarker values, a second control value calculated using first and fourth
biomarker values, a
third control value calculated using second and third biomarker values and a
fourth control
value calculated using second and fourth biomarker values. Thus, again, this
allows for
additional control values to be utilised, further increasing the likelihood
that invalid
measurements can be accurately discriminated. It will be appreciated that
combinations of
biomarkers comprising the indicator value can also be control values: in this
example the first
and second biomarkers and the third and fourth biomarkers make up the
indicator value, and
they too, if out of range to a corresponding reference, may indicate failure
of the assay.
CA 02986787 2017-11-22
WO 2016/187655 PCT/AU2016/050388
- 37 -
[0135] It will also be appreciated that in the above example, each of the
biomarker values
used in establishing the indicator are also used in the validation check. This
maximises the
use of biomarkers, so that in effect each measured biomarker value is used in
both generating
the indicator and the validation. For platforms and processes that can only
handle limited
numbers of biomarker values, this can therefore maximise the discriminatory
power of the
indicator, by allowing all measured biomarker values to be used in determining
the indicator,
whilst still ensuring indicator validity. However, this is not essential, and
additionally and/or
alternatively, comparison to a biomarker value measured for the subject, but
not used in
generating the indicator could be performed.
[0136] It should also be noted that the indicator values could also be used as
control values.
In this instance, typically an acceptable range for indicator values would be
specified for
assessing the likelihood of a subject having a condition, with this range
representing the
maximum and minimum indicator values observed or expected in the target
population.
Values outside of this range may imply a problem with at least one of the
underlying values
comprising the indicator value, and the test will be declared invalid.
Accordingly, in this
example, the method includes determining control values including one or more
of a fifth
control value using a ratio of first and second biomarker values, a sixth
control value using a
ratio of third and fourth biomarker values and, a single or set of controls
values calculated
using a ratio of measured biomarkers not used in determining an indicator
value.
[0137] The method typically includes calculating at least one of the indicator
values and the
control values by applying a function to the respective biomarker values. The
function used
will therefore vary depending on the preferred implementation. In one example,
the function
includes at least one of multiplying two biomarker values, dividing two
biomarker values;
adding two biomarker values, subtracting two biomarker values, a weighted sum
of at least
two biomarker values, a log sum of at least two biomarker values and, a
sigmoidal function
of at least two biomarker values.
[0138] More typically the function is division of two biomarker values, or log
subtraction
(which is equivalent to division of absolute values) so that the derived
biomarker value
corresponds to a ratio of two measured biomarker values. There are a number of
reasons
CA 02986787 2017-11-22
WO 2016/187655 PCT/AU2016/050388
- 38 -
why the ratio might be preferred. For example, use of a ratio is self-
normalising, meaning
variations in measuring techniques will automatically be accommodated. For
example, if the
input concentration of a sample is doubled, the relative proportions of
biomarkers will remain
the same. As a result, the type of function therefore has a stable profile
over a range of input
concentrations, which is important because input concentration is a known
variable for
expression data. Additionally, many biomarkers are nodes on biochemical
pathways, so the
ratio of biomarkers gives information about the relative activation of one
biological pathway
to another, which is a natural representation of biological change within a
system. Finally,
ratios are typically easily interpreted.
[0139] In one example, the control values are ratios, with each control value
being compared
to a respective control value threshold range and determining at least one of
the biomarker
values to be invalid if any one of the control values falls outside the
respective control value
threshold range. In this instance, each respective threshold range is
typically derived from
biomarker values collected from a number of individuals in a sample
population. This can be
performed for example using a statistical method or computer-implemented
classifier
algorithm trained on biomarker values for the sample population. The sample
population
typically includes a plurality of healthy individuals, a plurality of
individuals suffering from
at least one diagnosed medical condition, a plurality of individuals showing
clinical signs of
at least one medical condition or first and second groups of individuals, each
group of
individuals suffering from a respective diagnosed medical condition. This can
be used to
provide a suitable cross section of the population and to ensure that the
control value
threshold ranges are not influenced by the presence or absence of conditions.
[0140] In particular, when an indicator is for use in determining the
likelihood that a
biological subject has a specific medical condition, the sample population
includes
individuals presenting with clinical signs of the specific medical condition,
individuals
diagnosed or confirmed to have or have had (including retrospectively) the
specific medical
condition and/or healthy individuals. This ensures that the assessment of
indicator validity
applies regardless of not or whether the individual has the specific condition
or not.
CA 02986787 2017-11-22
WO 2016/187655 PCT/AU2016/050388
- 39 -
[0141] It will also be appreciated that the sample population could also
include a plurality of
individuals of different sexes, ethnicities, ages, or the like, allowing the
control value ranges
to be common across populations. However, this is not essential, and
alternatively control
value thresholds could be established that are specific to a particular sub-
set of the
population. In this case, it would be necessary to ensure that the control
value threshold
ranges used are appropriate for the subject under consideration.
[0142] Typically the indicator is determined by combining the first and second
derived
indicator values using a combining function, the combining function being at
least one of an
additive model, a linear model, a support vector machine, a neural network
model, a random
forest model, a regression model, a genetic algorithm, an annealing algorithm,
a weighted
sum and a nearest neighbour model.
[0143] In one example, the method further includes determining an indicator
value,
comparing the indicator value to at least one indicator value range and
determining the
indicator at least in part using a result of the comparison. Thus, once it has
been established
that the biomarker values are suitable for use in determining the indicator,
the indicator can
be calculated and compared to an indicator value range to assess the
likelihood of the subject
having at least one medical condition.
[0144] Following this, the method can further include generating a
representation of the
indicator. In this regard, the representation allows the indicator to be
viewed, for example by
a medical practitioner, allowing the medical practitioner to perform a
diagnosis and assess
what intervention, if any, to perform. The representation can be of any
appropriate form and
can include one or more of an alphanumeric indication of an indicator value, a
graphical
indication of a comparison of the indicator value to one or more thresholds
and an
alphanumeric indication of a likelihood of the subject having at least one
medical condition.
A specific example representation will be described in more detail below.
[0145] The method is typically performed at least in part using one or more
electronic
processing devices, for example forming part of one or more processing
systems, such as
computers or servers, which could in turn connected to one or more other
computing devices,
CA 02986787 2017-11-22
WO 2016/187655 PCT/AU2016/050388
- 40 -
such as mobile phones, portable computers or the like, via a network
architecture, as will be
described in more detail below.
[0146] In one example, the one or more electronic processing devices receive
the biomarker
values, determine the indicator using biomarker values, determine the at least
one control
value using at least two of the biomarker values, compare the at least one
control value to the
respective control value threshold and determine if the test is a valid test
using the results of
the comparison.
[0147] In this regard, the biomarker values can be received from a database or
the like, in
which the values have been previously stored, or could be received directly
from a measuring
device, such as a PCR machine or the like, which is used in determining the
biomarker
values. The processing devices can then automatically assess the validity of
the
measurements and then, if valid calculate the indicator, generating and
displaying a
representation of this as required. Thus, it will be appreciated that this can
provide a
substantially automated procedure from the point at which a sample is loaded
into a
measuring device.
[0148] In one example, the one or more electronic processing devices determine
the indicator
by calculating a first indicator value using a ratio of first and second
biomarker values,
calculating a second indicator value using a ratio of third and fourth second
biomarker values
and determining a sum of the first and second indicator values. The one or
more electronic
processing devices similarly determine a plurality of internal relative
control values by
calculating a first control value using a ratio of the first and third
biomarker values,
calculating a second control value using a ratio of the first and fourth
biomarker values,
calculating a third control value using a ratio of the second and third
biomarker values and
calculating a fourth control value using a ratio of the second and fourth
biomarker values,
before comparing each control value to a respective threshold range and
displaying the
indicator in response to a successful comparison for each control value.
[0149] When the biomarkers are gene expression products, the relative
abundance of target
biomarkers can be determined thus; obtain a sample from a biological subject,
such that the
CA 02986787 2017-11-22
WO 2016/187655 PCT/AU2016/050388
-41 -
sample includes the target gene expression products, then amplify at least the
target gene
expression products in the sample, then for each gene expression product
determine an
amplification amount required to obtain a defined level of the respective gene
expression
product, the amplification amount being dependent on the concentration of the
gene
expression product in the sample being based on a cycle time, number of
amplification
cycles, a cycle threshold, an amplification time, or the like. In this case,
relative biomarkers
can be generated using combinations of amplification times by subtracting
amplification
times for the respective gene expression products so that these relative
biomarker values
represent a ratio of the relative concentration of the respective gene
expression products.
[0150] It will be appreciated that the above described process is typically
performed on a
biological subject presenting with clinical signs of at least one medical
condition. In this
case, a medical practitioner will typically perform an initial assessment of
the clinical signs
and establish a specific test to be performed. For example, if the
practitioner identifies that
the subject may have ipSIRS, the above described process is typically
performed with
relative biomarker values corresponding to relative concentrations of LAMP1,
CEACAM4,
PLAC8 and PLA2G7.
[0151] More typically the clinical signs could be common to first and second
conditions,
which case the indicator is for use in distinguishing between the first and
second conditions.
Thus, for example, inSIRS and ipSIRS typically have similar clinical signs, so
practitioners
can use the indicator to distinguish between the conditions.
[0152] Thus, the above could be used for validating an indicator used in
determining the
likelihood of a biological subject having at least one medical condition, the
biomarkers being
quantified using a quantification technique of a selected type and the method
including:
a) determining a plurality of biomarker values, each biomarker value being
indicative of a value measured or derived from at least one corresponding
measured biomarker of the biological subject;
b) determining an indicator indicative of the likelihood of a biological
subject having
at least one medical condition by:
i) calculating a first indicator value using first and second
biomarker values;
CA 02986787 2017-11-22
WO 2016/187655 PCT/AU2016/050388
- 42 -
ii) calculating a second indicator value using third and fourth second
biomarker
values;
iii) determining the indicator using the first and second indicator values;
and,
c) calculating at least one of:
i) a first control value using the first and third biomarker values;
ii) a second control value using the first and fourth biomarker values;
iii) a third control value using the second and third biomarker values;
iv) a fourth control value using the second and fourth biomarker values;
d) comparing the at least one control value to a respective control value
threshold;
and,
e) selectively validating the indicator using the results of the
comparison.
[0153] Thus, the above could also be used for validating an indicator used in
determining the
likelihood of a biological subject having at least one medical condition, the
biomarkers being
quantified using a quantification technique of a selected type and the method
including:
a) obtaining a sample from a biological subject, the sample including gene
expression products;
b) quantifying at least some gene expression products in the sample to
determine a
concentration of the gene expression product in the sample;
c) determining an indicator indicative of the likelihood of a biological
subject having
at least one medical condition by combining:
i) a first indicator value indicative of a ratio of the concentration of
the first and
second gene expression products; and,
ii) a second indicator value indicative of a ratio of the concentration of the
third
and fourth gene expression products; and,
d) determining control values by determining:
i) a first control value indicative of a ratio of the concentration of the
first and
third gene expression products;
ii) a second control value indicative of a ratio of the concentration of the
first and
fourth gene expression products;
CA 02986787 2017-11-22
WO 2016/187655 PCT/AU2016/050388
- 43 -
iii) a third control value indicative of a ratio of the concentration of the
second
and third gene expression products; and,
iv) a fourth control value indicative of a ratio of the concentration of the
second
and fourth gene expression products;
e) comparing each control value to a respective control value threshold; and,
f) selectively validate the indicator using the results of the comparison.
[0154] In one example, the process is performed by one or more processing
systems
operating as part of a distributed architecture, an example of which will now
be described
with reference to Figure 2.
[0155] In this example, a number of base stations 201 are coupled via
communications
networks, such as the Internet 202, and/or a number of local area networks
(LANs) 204, to a
number of client devices 203 and one or more measuring devices 205, such as
PCR,
sequencing machines, or the like. It will be appreciated that the
configuration of the networks
202, 204 are for the purpose of example only, and in practice the base
stations 201, client
devices 203 and measuring devices 205, an communicate via any appropriate
mechanism,
such as via wired or wireless connections, including, but not limited to
mobile networks,
private networks, such as an 802.11 networks, the Internet, LANs, WANs, or the
like, as well
as via direct or point-to-point connections, such as Bluetooth, or the like.
[0156] In one example, each base station 201 includes one or more processing
systems 210,
each of which may be coupled to one or more databases 211. The base station
201 is adapted
to be used in calculating and validating indicators and generating
representations for these to
be displayed via client devices. The client devices 203 are typically adapted
to communicate
with the base station 201, allowing indicator representations to be displayed.
[0157] Whilst the base station 201 is a shown as a single entity, it will be
appreciated that the
base station 201 can be distributed over a number of geographically separate
locations, for
example by using processing systems 210 and/or databases 211 that are provided
as part of a
cloud based environment. However, the above described arrangement is not
essential and
other suitable configurations could be used.
CA 02986787 2017-11-22
WO 2016/187655 PCT/AU2016/050388
- 44 -
[0158] An example of a suitable processing system 210 is shown in Figure 3. In
this
example, the processing system 210 includes at least one microprocessor 300, a
memory 301,
an optional input/output device 302, such as a keyboard and/or display, and an
external
interface 303, interconnected via a bus 304 as shown. In this example the
external interface
303 can be utilised for connecting the processing system 210 to peripheral
devices, such as
the communications networks 202, 204, databases 211, other storage devices, or
the like.
Although a single external interface 303 is shown, this is for the purpose of
example only,
and in practice multiple interfaces using various methods (e.g., Ethernet,
serial, USB,
wireless or the like) may be provided.
[0159] In use, the microprocessor 300 executes instructions in the form of
applications
software stored in the memory 301 to allow the required processes to be
performed. The
applications software may include one or more software modules, and may be
executed in a
suitable execution environment, such as an operating system environment, or
the like.
[0160] Accordingly, it will be appreciated that the processing system 210 may
be formed
from any suitable processing system, such as a suitably programmed client
device, PC, web
server, network server, or the like. In one particular example, the processing
system 210 is a
standard processing system, which executes software applications stored on non-
volatile
(e.g., hard disk) storage, although this is not essential. However, it will
also be understood
that the processing system could be any electronic processing device such as a
microprocessor, microchip processor, logic gate configuration, firmware
optionally
associated with implementing logic such as an FPGA (Field Programmable Gate
Array), or
any other electronic device, system or arrangement.
[0161] As shown in Figure 4, in one example, the client device 203 includes at
least one
microprocessor 400, a memory 401, an input/output device 402, such as a
keyboard and/or
display, and an external interface 403, interconnected via a bus 404 as shown.
In this
example the external interface 403 can be utilised for connecting the client
device 203 to
peripheral devices, such as the communications networks 202, 204, databases,
other storage
devices, or the like. Although a single external interface 403 is shown, this
is for the purpose
CA 02986787 2017-11-22
WO 2016/187655 PCT/AU2016/050388
- 45 -
of example only, and in practice multiple interfaces using various methods
(e.g., Ethernet,
serial, USB, wireless or the like) may be provided.
[0162] In use, the microprocessor 400 executes instructions in the form of
applications
software stored in the memory 401 to allow communication with the base station
201, for
example to allow for selection of parameter values and viewing of
representations, or the
like.
[0163] Accordingly, it will be appreciated that the client devices 203 may be
formed from
any suitable processing system, such as a suitably programmed PC, Internet
terminal, laptop,
or hand-held PC, and in one preferred example is either a tablet, or smart
phone, or the like.
Thus, in one example, the processing system 210 is a standard processing
system, which
executes software applications stored on non-volatile (e.g., hard disk)
storage, although this is
not essential. However, it will also be understood that the client devices 203
can be any
electronic processing device such as a microprocessor, microchip processor,
logic gate
configuration, firmware optionally associated with implementing logic such as
an FPGA
(Field Programmable Gate Array), or any other electronic device, system or
arrangement.
[0164] Examples of the processes for determining and validating measurements
of indicators
will now be described in further detail. For the purpose of these examples it
is assumed that
one or more processing systems 210 acts to receive measured biomarker values
from the
measuring devices, calculate indicator values and control values, and use
these to calculate
and validate an indicator which can then be displayed as part of a
representation via hosted
webpages or an App residing on the client device 203. The processing system
210 is
therefore typically a server which communicates with the client device 203 and
measuring
devices 205 via a communications network, or the like, depending on the
particular network
infrastructure available.
[0165] To achieve this the processing system 210 of the base station 201
typically executes
applications software for performing required processes, with actions
performed by the
processing system 210 being performed by the processor 300 in accordance with
instructions
CA 02986787 2017-11-22
WO 2016/187655 PCT/AU2016/050388
- 46 -
stored as applications software in the memory 301 and/or input commands
received from a
user via the I/0 device 302, or commands received from the client device 203.
[0166] It will also be assumed that the user interacts with the processing
system 210 via a
GUI (Graphical User Interface), or the like presented on the client device
203, and in one
particular example via a browser application that displays webpages hosted by
the base
station 201, or an App that displays data supplied by the processing system
210. Actions
performed by the client device 203 are performed by the processor 400 in
accordance with
instructions stored as applications software in the memory 401 and/or input
commands
received from a user via the I/0 device 402.
[0167] However, it will be appreciated that the above described configuration
assumed for
the purpose of the following examples is not essential, and numerous other
configurations
may be used. It will also be appreciated that the partitioning of
functionality between the
client devices 203, and the base station 201 may vary, depending on the
particular
implementation.
[0168] An example process for establishing control and indicator references
will now be
described in more detail with reference to Figure 5.
[0169] In this example, at step 500 the processing system 210 determines
reference data in
the form of biomarker values obtained for a reference population.
[0170] A reference population is any population of interest for which
information is collected
against which reference can be made. For example the population may be
characterized into
those with or without a condition, or with varying degrees of severity,
prognosis, stage, or
similar disease or condition stratification method.
[0171] The reference data may be acquired in any appropriate manner but
typically this
involves obtaining gene expression product data from a plurality of
individuals, selected to
include individuals diagnosed with one or more conditions of interest, as well
as healthy
individuals. The terms "expression" or "gene expression" refer to production
of RNA only or
production of RNA and translation of RNA into proteins or polypeptides. In
specific
CA 02986787 2017-11-22
WO 2016/187655 PCT/AU2016/050388
- 47 -
embodiments, the terms "expression" or "gene expression" refer to production
of messenger
RNA (mRNA), ribosomal RNA (rRNA), microRNA (miRNA) or other RNA classes such
mitochondrial RNA (mtRNA), non-coding RNA (ncRNA, lncRNA (long)), small
interfering
RNA (siRNA), transfer RNA (tRNA) or proteins.
[0172] As used herein, the terms "microRNA" or "miRNA" refer to a short
ribonucleic acid
(RNA) approximately 18-30 nucleotides in length (suitably 18-24 nucleotides,
typically 21-
23 nucleotides in length) that regulates a target messenger RNA (mRNA)
transcript post-
transcriptionally through binding to the complementary sequences on the target
mRNA and
results in the degradation of the target mRNA. The terms also encompass the
precursor
(unprocessed) or mature (processed) RNA transcript from a miRNA gene. The
conversion of
precursor miRNA to mature miRNA is aided by RNAse such as Dicer, Argonaut, or
RNAse
[0173] The conditions captured in the reference data are typically medical,
veterinary or
other health status conditions and may include any illness, disease, stages of
disease, disease
subtypes, severities of disease, diseases of varying prognoses, or the like.
[0174] Example reference biomarkers could include expression products such as
nucleic acid
or proteinaceous molecules, as well as other molecules relevant in making a
clinical
assessment.
[0175] The individuals in the reference population also typically undergo a
clinical
assessment allowing any conditions to be clinically identified as part of the
characterization
process for the reference population, and with an indication of any assessment
or condition
forming part of the reference data. Whilst any conditions can be assessed, in
one example the
process is utilized specifically to identify conditions such as SIRS (Systemic
Inflammatory
Response Syndrome) (M S Rangel-Frausto, D Pittet, M Costigan, T Hwang, C S
Davis, and
R P Wenzel, "The Natural History of the Systemic Inflammatory Response
Syndrome
(SIRS). a Prospective Study.," JAMA : the Journal of the American Medical
Association 273,
no. 2 (January 11, 1995): 117-123.). SIRS is an overwhelming whole body
reaction that may
have an infectious or non-infectious aetiology, whereas sepsis is SIRS that
occurs during
CA 02986787 2017-11-22
WO 2016/187655 PCT/AU2016/050388
- 48 -
infection. Both are defined by a number of non-specific host response
parameters including
changes in heart and respiratory rate, body temperature and white cell counts
(Mitchell M
Levy et al., "2001 SCCM/ESICM/ACCP/ATS/SIS International Sepsis Definitions
Conference," Critical Care Medicine 31, no. 4 (April 2003): 1250-1256.; K
Reinhart, M
Bauer, N C Riedemann, and C S Hartog, "New Approaches to Sepsis: Molecular
Diagnostics
and Biomarkers," Clinical Microbiology Reviews 25, no. 4 (October 3,2012): 609-
634). To
differentiate these conditions they are referred herein to as SIRS (both
conditions), infection-
negative SIRS (SIRS without infection, hereafter referred to as "inSIRS") and
infection-
positive SIRS (sepsis, SIRS with a known or suspected infection, hereafter
referred to as
"ipSIRS"). The causes of SIRS are multiple and varied and can include, but are
not limited
to, trauma, burns, pancreatitis, endotoxaemia, surgery, adverse drug
reactions, and infections
(local and systemic). It will be appreciated from the following, however, that
this can be
applied to a range of different conditions, and reference to inSIRS or ipSIRS
is not intended
to be limiting.
[0176] Additional reference data may also be collected for the reference
population and may
include additional biomarkers such as one or more phenotypic or clinical
parameters of the
individuals and/or their relatives that has not been generated or captured by
instrument
measurements or a clinical assessment. Phenotypic parameters can include
information such
as the gender, ethnicity, age, hair colour, eye colour, height, weight, waist
and hip
circumference, or the like. Also, in the case of the technology being applied
to individuals
other than humans, this can also include information such as designation of a
species, breed
or the like. Clinical traits may include genetic information, white blood cell
count, diastolic
blood pressure and systolic blood pressure, bone density, body-mass index,
presence of
diabetes or not, resting heart rate, HOMA (homeostasis model assessment), HOMA-
IR
(homeostasis model assessment insulin resistance), IVGT (intravenous glucose
tolerance
test), resting heart rate, 0 cell function, macrovascular function,
microvascular function,
atherogenic index, low-density lipoprotein/high-density lipoprotein ratio,
intima-media
thickness, body temperature, Sequential Organ Failure Score (SOFA) and the
like.
CA 02986787 2017-11-22
WO 2016/187655 PCT/AU2016/050388
- 49 -
[0177] The reference population has two functions, the first is to
characterize patients with
respect to the condition of interest, in this example categorize patients into
inSIRS and
ipSIRS. The second is to capture the values required to generate values used
in the assay.
Thus, for a reference population and for a specific indicator, application of
the indicator to
the reference data will produce a reference indicator distribution of values
corresponding to
known categories or degrees such as inSIRS and ipSIRS, against which indicator
values
determined from new samples can be compared.
[0178] Similarly, internal relative controls can be generated using the
reference population
data and compared to internal relative controls similarly generated for each
new sample.
[0179] Each individual within the reference population is typically allocated
to a group. The
groups may be defined in any appropriate manner such as any one or more of an
indication of
a presence, absence, degree, stage, severity, prognosis or progression of a
condition, other
tests or assays, or measured biomarkers associated with the individuals.
[0180] For example, a first selection of groups may be used to identify one or
more groups of
individuals suffering from SIRS, one or more groups of individuals suffering
ipSIRS, and
one or more groups of individuals suffering inSIRS. Further groups may also be
defined for
individuals suffering from other conditions. The groups may include
overlapping groups, so
for example it may be desirable to define groups of healthy individuals and
individuals
having SIRS, with further being defined to distinguish inSIRS patients from
ipSIRS patients,
as well as different degrees of inSIRS or ipSIRS, with these groups having
SIRS in common,
but each group of patients differing in whether a clinician has determined the
presence of an
infection or not. Additionally, further subdivision may be performed based on
phenotypic
traits, so groups could be defined based on gender, ethnicity or the like so
that a plurality of
groups of individuals suffering from a condition are defined, with each group
relating to a
different phenotypic trait.
[0181] It will also be appreciated, however, that identification of different
groups can be
performed in other manners, for example on the basis of particular activities
or properties of
biomarkers within the biological samples of the reference individuals and
accordingly,
CA 02986787 2017-11-22
WO 2016/187655 PCT/AU2016/050388
- 50 -
reference to conditions is not intended to be limiting and other information
may be used as
required.
[0182] The manner in which classification of patients in the reference
population into groups
is performed may vary depending on the preferred implementation. In one
example, this can
be performed automatically by the processing system 201, for example, using
unsupervised
methods such as Principal Components Analysis (PCA), or supervised methods
such as k-
means or Self Organising Map (SOM). Alternatively, this may be performed
manually by an
operator by allowing the operator to review reference data presented on a
Graphical User
Interface (GUI), and define respective groups using appropriate input
commands.
[0183] Accordingly, in one example the reference data can include for each of
the reference
individuals information relating to at least one and desirably to a plurality
of reference
biomarkers and a presence, absence, degree or progression of a condition.
[0184] The reference data may be collected from individuals presenting at a
medical centre
with clinical signs relating to any relevant conditions of interest, and may
involve follow-on
consultations in order to confirm clinical assessments, as well as to identify
changes in
biomarkers, and/or clinical signs, and/or severity of clinical signs, over a
period of time. In
this latter case, the reference data can include time series data indicative
of the progression of
a condition, and/or the activity of the reference biomarkers, so that the
reference data for an
individual can be used to determine if the condition of the individual is
improving, worsening
or static. It will also be appreciated that the reference biomarkers are
preferably substantially
similar for the individuals within the sample population, so that comparisons
of measured
activities between individuals can be made.
[0185] This reference data could also be collected from a single individual
over time, for
example as a condition within the individual progresses, although more
typically it would be
obtained from multiple individuals each of which has a different stage of the
one or more
conditions of interest.
CA 02986787 2017-11-22
WO 2016/187655 PCT/AU2016/050388
-51 -
[0186] It will be appreciated that once collected, the reference data can be
stored in the
database 211 allowing this to be subsequently retrieved by the processing
system 210 for
subsequent analysis, or could be provided directly to the processing system
210 for analysis.
[0187] In one example, the measurements are received as raw data, which then
undergoes
preliminary processing. Such raw data corresponds to information that has come
from a
source without modification, such as outputs from instruments such as PCR
machines, array
(e.g., microarray) scanners, sequencing machines, clinical notes or any other
biochemical,
biological, observational data, or the like. This step can be used to convert
the raw data into
a format that is better suited to analysis. In one example this is performed
in order to
normalise the raw data and thereby assist in ensuring the biomarker values
demonstrate
consistency even when measured using different techniques, different
equipment, or the like.
Thus, the goal of normalisation is to remove the variation within the samples
that is not
directly attributable to the specific analysis under consideration. For
example, to remove
variances caused by differences in sample processing at different sites.
Examples of
normalisation that are well known in the art include z-score transformation
for generic data,
or popular domain specific normalisations, such as RMA normalisation for
microarrays.
[0188] However, it will also be appreciated that in some applications, such as
a single sample
experiment run on a single data acquisition machine, this step may not
strictly be necessary,
in which case the function can be a Null function producing an output
identical to the input.
[0189] In one example, the preferred approach for generating reference data is
a paired
function approach over log normalised data. Log normalisation is a standard
data
transformation on gene and protein expression data, because the measured
biomarkers follow
a log-normal distribution as directly measured by the instrument. Applying a
log transform
turns the data into process-friendly normally distributed data. The biomarker
values
measured will depend on the predominant condition that is being assessed so,
for example, in
the case of determining the likelihood of a subject having ipSIRS as opposed
to inSIRS, the
RNA biomarkers Bmi, Bm2, Bm3, Bm4 used could be LAMP1, CEACAM4, PLAC8 and
PLA2G7. A second possible example, in the case of determining the likelihood
of a subject
having liver disease, the protein biomarkers Bmi, Bm2, Bm3, Bm4 used could be
Alkaline
CA 02986787 2017-11-22
WO 2016/187655 PCT/AU2016/050388
- 52 -
Phosphatase (AP), Aminotransferase (AT), Aspartate Aminotransferase (AspAT)
and
Gamma-glutamyl transpeptidase (GGT).
[0190] As part of the above process, at step 510 the measurements are
validated using
traditional prior art techniques, to ensure that the measurements have been
performed
successfully, and hence are valid.
[0191] At step 520 at least four internal relative control values Ctrli,
Ctr12, Ctr13, Ctr14, are
determined for the reference population, with two additional control values
Ctr15, Ctr16, being
optionally determined as follows:
Ctrli = (Bmi 1 Bm3)
Ctr12 = (Bmi 1 Bm4)
Ctr13¨ (Bm2 1 Bm3)
Ctr14 ¨ (Bm2 1 Bm4)
Ctr15= (Bmi 1 Bm2)
Ctr16¨ (Bm3 1 Bm4)
[0192] At step 530, the control values used to update or create respective
control reference
data. In this regard, in the current example, each control reference is in the
form of a
distribution of control values for the reference population including healthy
individuals and
individuals suffering from the conditions of interest. The distribution itself
can be used as a
control reference, or alternatively one or more values could be derived
therefrom, such as to
define a threshold range. For example this could be set to encompass 99% of
the distribution.
[0193] Additionally, the control reference could be defined so that it is
specific to
characteristics of the individuals, such as the sex, ethnicity, age, weight,
height or other
physical characteristic of the subject, thereby allowing different control
references to be
defined for different groups of individuals with similar characteristics.
[0194] Once created the control references and in particular the control
distributions, are
stored in the database 211 for subsequent use.
[0195] At step 540, first and second indicator values are determined. The
first and second
indicator values In1,In2 are determined on a basis of ratios of first and
second, and third and
fourth biomarker values respectively:
CA 02986787 2017-11-22
WO 2016/187655 PCT/AU2016/050388
- 53 -
Ini= (Bin] I Bm2)
I112 ¨ (Bm3 I Bm4)
[0196] The indicator values used to update or create a set of indicator
references at step 550,
which is used in analysing measured indicator values for a subject to
establish a likelihood of
the subject having a condition. In particular, indicator values for each
reference group are
statistically analysed to establish a range or distribution of indicator
values that is indicative
of each group, thereby allowing the indicator values to be used to
discriminate between the
different groups, and hence ascertain the likelihood a subject is suffering
from a particular
condition, as will be described in more detail below.
[0197] An example process of a process for validating measurement of biomarker
values
used in generating an indicator will now be described in more details with
reference to Figure
6.
[0198] In this example, at step 600 values of four biomarkers Bin], Bm2, Bm3,
Bm4 are
measured by the measuring device 205. The four biomarker values selected will
depend on
the predominant condition that is being assessed. For example, in the case of
determining the
likelihood of a patient having ipSIRS as opposed to inSIRS, the biomarkers
Bin], Bm2, Bm3,
Bm4 used will be LAMP1, CEACAM4, PLAC8 and PLA2G7.
[0199] At step 610 the processing system 210 determines first and second
indicator values,
either directly from the measuring device 205, or by retrieving the values
after storage in a
database 211 or other data store. The first and second indicator values
In1,In2 are determined
on a basis of ratios of first and second, and third and fourth biomarker
values respectively:
Ini= (Bin] I Bm2)
In2 ¨ (Bm3 I Bm4)
[0200] At step 620 the processing device 210 combines the indicator values to
determine an
indicator In which may be achieved utilising a sum of the first and second
indicator values or
other similar measure. So for example:
In = I112 = (Thni / Bm2) + (Bm3 / Bm4)
CA 02986787 2017-11-22
WO 2016/187655 PCT/AU2016/050388
- 54 -
[0201] At step 630, the processing device 210 determines the four control
values Ctrli, Ctr12,
Ctr13, Ctr14, and optionally additional control values Ctr15, Ctr16, as
follows:
Ctrl = (Bmi 1 Bm3)
Ctr12 = (Bmi 1 Bm4)
Ctr13¨ (Bm2 1 Bm3)
Ctr14 ¨ (Bm2 1 Bm4)
Ctr15= (Bmi 1 Bm2)
Ctr16 ¨ (Bm3 1 Bm4)
[0202] Thus, as shown in Figure 6, each possible ratio of the values of the
four biomarkers
Bmi, Bm2, Bm3, Bm4 is calculated, with two of the ratios being used to form
the indicator
values and hence the indicator, and all of the ratios being used for control
values.
[0203] Each of the control values is then compared to a respective control
reference, and in
particular control distribution, at step 640. In this regard, it will be
appreciated that the
processing system 210 will retrieve respective control distributions for the
particular
biomarkers that are used to determine the respective control values Ctrli,
Ctr12, Ctr13, Ctr14,
optionally additional control values Ctr15, Ctr16 with these control
distributions being
previously determined and stored in the database 211, as described above. At
step 650, the
processing system 210 determines if each control value is acceptable based on
the results of
the comparison. In this regard, if any one control value is outside the
defined control value
threshold range, then this is indicative of a test failure which is
communicated to the user at
step 660, for example by providing an indication on a client device 203 of a
medical
practitioner requesting the test. Otherwise a representation of the indicator
is displayed at step
670 on the client device 203, as will be described in more detail below.
[0204] In the above described process, the values of the four biomarkers Bmi,
Bm2, Bm3, Bm4
are used to determine four (or optionally six) control values. Because each
biomarker (Bmi,
Bm2, Bm3, Bm4) is involved in multiple comparisons with other biomarkers as
controls (Ctrli,
Ctr12, Ctr13, Ctr14), there are more opportunities for detection of an invalid
underlying
biomarker than if each biomarker was measured against only a single expected
range or
against a single control biomarker. This multiple testing of each biomarker
results in far
greater sensitivity than would be achieved with individual comparison to an
independent
control, as shown in the arrangement of Figure 7B.
CA 02986787 2017-11-22
WO 2016/187655 PCT/AU2016/050388
- 55 -
[0205] For example, in the case of Figure 7B, representing a standard control
strategy based
on measured biomarkers, Bin] is measured relative to the control, or
equivalently to an
absolute value using the control to derive the value. The measured value being
outside an
expected range is only seen once in every thousand samples, so if the measured
value falls
outside of this range, the probability that this sample measurement belongs to
the distribution
(that is, it is valid) is therefore 1/1000 and p value for failure detection:
0.001.
[0206] In contrast in the case of the current system of Figure 7A, the
measured value of
biomarker Bin] is compared to each of biomarkers Bm2, Bm3, Bm4. Each
represents an
independent check on the measured value of Bmi, so values outside the range
are only once
every 1000 samples for each comparison. The probability that this sample is
not in the
distribution of valid samples (a failure) is 1/1000 x 1/1000 x 1/1000, so that
the p value for
failure detection: le-9, meaning this relative control combination shown in
Figure 7A is a
million times more sensitive than a standard measured control shown in Figure
7B.
[0207] A further example will now be described with reference to Figures 8A
and 8B.
[0208] In this example, at step 800 a sample is acquired from the subject. The
sample could
be any suitable sample such as a peripheral blood sample, or the like,
depending on the nature
of the biomarker values being determined. At step 805 the sample undergoes
preparation
allowing this to be provided to the measuring device 205 and used in a
quantification process
at step 810. For the purpose of this example, the quantification process
involves PCR
amplification, with the measuring device being a PCR machine, although other
suitable
biomarker measurement devices and techniques could be used. In this instance,
amplifications times Ati, At2, At3, At4, are determined for each of the four
biomarkers Bin],
Bm2,Bm3,Bm4 at step 815, with the amplification times being transferred from
the measuring
device 205 to the processing system 210 allowing the processing system 210 to
perform
analysis of the corresponding biomarker values.
[0209] Accordingly, at step 820 the processing system 210 calculates ratios
using the
amplifications times. In this regard, as the amplification times represent a
log value, the ratios
CA 02986787 2017-11-22
WO 2016/187655 PCT/AU2016/050388
- 56 -
are determined by subtracting amplifications times as will be appreciated by a
person skilled
in the art.
[0210] Accordingly, in this example the indicator and control values would be
determined as
follows:
Ctrli = (Log Bm - Log Bm3) = (At - At3)
Ctr12 = (Log Bmi - Log Bm4) = (At/ - At4)
Ctr/3¨ (Log Bm2 - Log Bm3) ¨ (At2 - At3)
Ctr/4 ¨ (Log Bm2 - Log Bm4) ¨ (At2 - At4)
[0211] As previously mentioned, the indicator values can also be used as
control values,
leading to two further control valves:
Ctr15 = (Log Bm - Log Bm2)= (At - At2)
Ctr16 ¨ (Log Bm3 - Log Bm4) ¨ (At3 - At4)
[0212] The processing system compares the ratios representing the control
values to
respective control value threshold ranges retrieved from the database 211, at
step 825.
Again, this can be based on characteristics of the subject, with the control
values being
derived from control values measured for a sample population of individuals
with similar
characteristics.
[0213] At step 830, the processing system 210 determines if the control ratios
correspond to
control values that are acceptable, in other words if they fall within the
defined threshold
range. If this is not the case then test failure is indicated, for example, by
having the
processing system 210 generate a failure notification and provide this to a
client device 205
at step 835. The notification could be of any suitable form and could include
an email,
notification in a dash board of a test management software application or the
like. As part of
this, any outlier ratios that fall outside the control value ranges can be
identified, allow an
operator to identify which if any of the biomarker values failed or was
inaccurately measured
for any reason.
CA 02986787 2017-11-22
WO 2016/187655 PCT/AU2016/050388
- 57 -
[0214] In the event that each of the control values are acceptable, at step
840 the processing
system 210 determines an indicator value by combining the ratios for the
indicator values, as
follows:
In = (Log Bmi - Log Bm2) + (Log Bm3 - Log Bm4) = (Ati - At2) + (At3 - At4)
[0215] The processing system 210 then compares the indicator value to one or
more
respective indicator thresholds at step 845.
[0216] As previously described, the indicator references are derived for a
sample population
and are used to indicate the likelihood of a subject suffering from ipSIRS or
another
condition. To achieve this, the indicator reference is typically derived from
a sample
population having similar characteristics to the subject. The sample
population is typically
grouped based on a clinical assessment into groups having / not having the
conditions or a
measure of severity, risk or progression stage of the condition, with this
then being used to
assess threshold indicator values that can distinguish between the groups or
provide a
measure of severity, risk or progression stage. The results of this comparison
are used by the
processing system 210 to calculate a likelihood of the subject having ipSIRS
at step 850, with
this being used to generate a representation of the results at step 855, which
is transferred to
the client device 203 for display at step 860, for example as part of an
email, dashboard
indication or the like.
[0217] An example of the representation is shown in Figures 9A and 9B.
[0218] In this example, the representation 900 includes a pointer 910 that
moves relative to a
linear scale 930. The linear scale is divided into regions 921, 922, 923, 924
which indicates
the probability of a subject having either SIRS or sepsis. Corresponding
indicator number
values are displayed at step 930 with an indication of whether the
corresponding value
represents a likelihood of inSIRS or ipSIRS being showing at step 940. An
alphanumeric
indication of the score is shown at step 951 together with an associated
probability of the
biological subject having ipSIRS at step 952.
[0219] As shown in this example, regions of the linear scale where the pointer
is situated are
highlighted with the diagnosis that is most unlikely being greyed out to make
it absolutely
CA 02986787 2017-11-22
WO 2016/187655 PCT/AU2016/050388
- 58 -
clear where the subject sits on the scale. This results in a representation
which when
displayed at step 860 is easy for a clinician to readily understand and to
make a rapid
diagnosis.
[0220] Features of the benefits of using derived internal controls over prior
art will now be
described with reference to Figures 10A, 10B and 10C.
[0221] Using the above example with four measured biomarkers used in
generating the
indicator value, a standard control methodology is shown in Figure 10A. The
work flow of
the assay is divided up into physical 1010 and algorithmic 1020 components,
where the
physical components 1010 are inherent hardware, reagents and non-software
components and
the algorithmic components 1020 are carried out on an appropriate computing
device 210.
The values of the measured biomarkers 1015 and external measured controls 1030
are
generated using the physical device 1010. External positive controls 1030 are
used to validate
that the test is able to produce a result in the reportable range by measuring
against a
reference range 1040, and if no, then fail the test 1050, or if yes, output
the indicator value
1060 in a report 1070.
[0222] For comparison, the same device using internal relative controls is
shown in Figure
10B. Again the workflow is divided up into physical 1010 and algorithmic 1020
components
and the measured biomarkers 1015 are generated on the physical device 1010.
Note that the
external positive controls 1030 shown in Figure 10A are not present, and there
is an
additional generation of internal relative controls 1035 which are derived
from the measured
biomarkers 1015. Otherwise the two methods are similar with the testing of
controls against
reference thresholds 1040, and if outside these thresholds a failure of the
assay will be
reported 1050, else the indicator value 1060 will be output in the form of a
report 1070.
[0223] It will be appreciated that by removing physical components of a device
in the form
of external controls 1030, and replacing their function with the use of
internal relative
controls 1035, the control component of the test has been shifted from a
physical component,
with fixed costs per unit, to the algorithmic component, which is
substantially more scalable
as software. Therefore the use of internal relative controls as shown in
Figure 10B has
CA 02986787 2017-11-22
WO 2016/187655 PCT/AU2016/050388
- 59 -
advantages over the use of prior art measured controls Figure 10A including
lower cost,
complexity and risk for industrial manufacture or processing risk.
102241 An extension of this method is example in Figure 10C, which may be used
in the
event that the measured biomarkers 1015 are unable or impractical to produce
relative
controls 1035 that completely cover all instances where a failed sample must
be detected
1040. The use of such additional internal relative controls is useful in the
case where an
indicator value may be invalid even if no combinations of controls comprising
the indicator
may be out of range. An example may be that a test is designed for use in
people with an
inflammatory response due to infection, and the indicator value may be a
measure of the
likelihood that the patient will improve or deteriorate in the following 24
hours. It may be
that the indicator is highly prognostic in this population, and that an
internal relative
biomarker not related to this indicator can reliably distinguish those with
and without
infection. In this example the internal relative biomarker can be used as an
additional control
to ensure that the patient is indeed infected, and therefore part of the
intended use population,
and therefore that the indicator value is valid for use on this patient. In
this case an additional
measured biomarker 1031 can be run on the physical device 1010 in parallel
with the
measured biomarkers 1015 that are used for the indicator value 1060.
Additional measured
biomarkers 1031 need not be used in the indicator value (test result), and are
specifically
selected to ensure that any invalid samples, when tested for acceptable ranges
1040 will
appropriately fail the test 1050. It will be appreciated that multiple
additional internal
controls 1031 may be required to cover all possible cases of invalid samples
and that a
plurality of functions may be applied to additional measured internal controls
in combination
with each other and the measured biomarkers comprising the indicator value to
meet this
goal. It will further be appreciated that generally it is simpler and cheaper
to measure
additional internal controls 1031 in a medical device than to use external
controls 1030, and
therefore even the addition of many internal controls will generally still
provide cost and
complexity advantages over the use of a small number of external controls.
102251 An example will now be described with reference to Figures 12A to 12C
(a)-(f),
which show kernel density plots for this population. The distribution of Cycle
Threshold (Ct)
SUBSTITUTE SHEET (RULE 26)
CA 02986787 2017-11-22
WO 2016/187655 PCT/AU2016/050388
- 60 -
values for each gene is shown in solid lines, and the Ct values for
synthesized In-Vitro
Transcripts at known concentrations as controls is shown as dashed lines.
102261 Another advantage of the use of relative controls method over standard
measured
controls will be described with reference to Figures 11A and 11B, using the
same example.
In Figure 11A, the Ct value for each of the measured biomarkers (Bmi, Bin,,
Bm3, Bm4) is
shown over a range of concentrations ranging from 20 to 2000 ng input to the
PCR reaction.
In this example the indicator value is measured as a sum of proportions of
these measured
biomarkers:
M = In] 1112 - (13mi / Bm?) (Bm3 / Bm4)
The indicator value for these biomarkers at each concentration is shown in
Figure 11B, which
shows a flat profile despite very large changes in concentration over the
input range. These
results demonstrate that the indicator is stable over a range of input
concentrations because it
measures the relative concentrations between the biomarkers. If a reference
threshold (in Ct
units) were applied over the stable indicator range (20 to 2000 ng input) to
each of the
measured biomarkers in Figure 11A, then the reference ranges would be very
wide. In this
example, valid ranges for PLAC8 would range from 17 to 23 Ct units. Such wide
control
reference ranges are generally not appropriate, so typically assays specify a
narrow input
range so that reference ranges of measured biomarkers can be made sufficiently
narrow. This
step in creating an input concentration from a sample is an extra step in
processing that can
be removed if the indicator value uses relative information derived from
measured
biomarkers, and if the controls also use relative information derived from
measured
biomarkers. Such an example shows improved utility over controls using
measured
biomarkers in this case by the removal of a processing step requiring diluting
to a specified
input concentration, which saves time, cost and reduces complexity.
102271 In this example, the data shown in Figure 12A is taken from 106
consecutive samples
with 2 or more ipSIRS criteria, divided in patients with or without infection,
for biomarkers
in the form of signature genes LAMP1, CEACAM4, PLAC8 and PLA2G7.
SUBSTITUTE SHEET (RULE 26)
CA 02986787 2017-11-22
WO 2016/187655 PCT/AU2016/050388
-61 -
[02281 Next a failure of the measurement of one of the four signature genes
will be
described. Using sample number 13, and artificially reducing reaction
efficiency of the
LAMP1 reaction to 89% (failed assay) we reduce the recorded Ct value from
25.71 to 22.88.
The probability based on reference Ct observations for this gene that the
assay has failed is
32.5% as shown for LAMP1 in figures 12B (a)-(0, not sufficient to declare a
failed assay.
Figures 12B (a)-(0 show the Ct values recorded for each of the other
biomarkers (PLA2G7,
PLAC8 and CEACAM4) for the failed sample, and also that for both the high and
low
positive controls, the values are in the expected ranges.
[0229] Table 2 shows that for each of the measured biomarkers and both
controls that the
values are within the reference ranges and there is not sufficient evidence
(p<0.05) to identify
the failed sample.
Table 2
PLA2G7 PLAC8 CEACAM4 LAMP1 Hi Pos Cntl Low Pos Cntl
Sample Value 30 22 24 25.5 21 33
In range Yes Yes Yes Yes Yes Yes
P value 1.000 0.280 1.000 0.325 1.00
1.00
102301 Now looking at ratios between the measured biomarkers in Figure 12C (a)-
(0, the
ratio PLAC8-LAMP1 clearly detects the failure p<0.001, which is sufficient to
correctly
declare the assay failed.
102311 Table 3 shows that the failed assay is detected by a low p value
(<0.01) for the
relative values of PLAC8 to LAMP 1.
Table 3
PLA2G7 PLA2G7¨ PLA2G7- PLAC8¨ PLAC8¨ CEACAM
CEACAM LA MP1 CEACAM LAM P1 4 ¨
PLAC8 4 4 LAM P1
Sample Value 8 6 4.5 -2 -3.5 1.5
in range Yes Yes Yes Yes No Yes
P value 0.204 0.927 0.291 0.133 <0.001 0.133
SUBSTITUTE SHEET (RULE 26)
CA 02986787 2017-11-22
WO 2016/187655 PCT/AU2016/050388
- 62 -
[02321 Figure 12D plots the failed sample as a scatterplot of PLAC8 and LAMP
1. It can be
seen that although this sample is within the maximum and minimum ranges of
both PLAC8
and LAMP1, it is a clear outlier when considering the relative position with
respect to each of
the these biomarkers. This is reflected in the low p value for this relative
control, as it is
outside of the reference range and thus is correctly identified as a failed
sample.
[0233] Accordingly, using this approach, multiple relative controls that may
not individually
be sufficient to declare a failed assay can be combined using a Bayes Rule or
other
probabilistic method to give a joint probability of failure.
[0234] Accordingly, the above process described the use of controls comprised
of ratios of
measured biomarker values, such as expression of target genes, rather than the
use of non-
target internal or external controls or spike-ins, in gene expression
experiments and analyses.
Advantages of such an approach include no additional measurements beyond those
used for
the indicator values, the ability to analyse more targets in a single
experiment and reduced
overall costs of performing gene expression analysis in addition to higher
sensitivity and the
ability to skip an input normalizing step during processing if the indicator
values are also
comprised of ratios.
[0235] An example will now be described with reference to Figures 13A (a)-(d)
which shows
data from BUPA Medical Research Ltd in a study of male patients for the
detection of liver
damage due to alcoholism. In this study there were 144 enrolled volunteers
classified as
alcoholic, and 200 enrolled volunteers classified as non-alcoholic.
Measurements of liver
related proteins from peripheral blood were taken for each volunteer and a
diagnostic
combination of these proteins (the indicator) for alcohol related liver damage
yielded 94%
accuracy of classification (Comak, Emre, et al. "A new medical decision making
system:
Least square support vector machine (LSSVM) with Fuzzy Weighting Pre-
processing." Expert ,S'ystenis with Applications 32.2 (2007): 409-414.). The
utility of this test
is that an accurate diagnosis of liver damage due to alcoholism can be made
with a multi-
marker protein panel from peripheral blood in preference to an invasive and
more expensive
liver biopsy. Four proteins were measured from peripheral blood; Alkaline
Phosphatase (AP),
Aminotransferase (AT), Aspartate Aminotransferase (AspAT) and Gamma-glutamyl
SUBSTITUTE SHEET (RULE 26)
CA 02986787 2017-11-22
WO 2016/187655 PCT/AU2016/050388
- 63 -
transpeptidase (GGT). The reference population is the set of patients in the
study, and the
reference data are the measured values for each of the protein concentrations
plus the relative
controls defined as all pair-wise ratios of abundance of each protein. In this
example,
consider a hypothetical new sample for a patient with unknown liver status
with the
following measurements AP=56, AT=49, AspAT=28 and GGT=6. An indicator value
for
liver disease may be generated from these measurements, but it is not yet
known if the values
are valid (if there has been some failure in measurement). All of these
measurements are
within the observed range of values for each of these proteins, so this sample
would
traditionally be considered as having satisfied the controls (being within the
observed
reference distribution. Figures 13A (a)-(d) shows the measured values for the
new sample
against the reference distribution for each measured biomarker (AP, AT, AspAT
and GGT)).
It can be seen that the sample falls within the reference range for each
measured biomarker
and therefore would traditionally be considered valid. Table 4 shows the
values for each
measured biomarker against the reference distribution and the probability of
failure for each
reference distribution.
Table 4
AP AT AspAT GGT
Sample Value 56 49 28 6
In range Yes Yes Yes Yes
P value 0.451 0.340 0.739 0.411
102361 Figures 13B (a)-(0 show the same sample against derived control
distributions. In the
case of AT-GGT and Asp-GGT, there are p values less than 0.05, indicating that
this sample
is unlikely to have come from the population of samples for which this test
was designed, or
there is some other failure, and therefore the indicator value (result) for
this test is invalid.
102371 Table 5 shows the relative control values for this sample and the
specific controls
capable of detecting this failure.
Table 5
AP¨ AP¨ AP¨ AT¨ AT¨ AspAT-
AT AspAT GGT AspAT GGT GGT
Sample Value 7 28 50 21 43 22
In range Yes Yes Yes Yes No No
SUBSTITUTE SHEET (RULE 26)
CA 02986787 2017-11-22
WO 2016/187655 PCT/AU2016/050388
- 64 -
P value 0.208 0.381 0.653 0.157 0.023 0.006
[0238] Accordingly, the above described system introduces the use of relative
internal
controls in the case of multi-biomarker medical devices, such that the need
for controls that
are not internal relative controls may be reduced or eliminated.
[0239] In one example, the relative internal controls are relative biomarkers
internal to the
sample that are used to ensure that the values used in establishing an
indicator are valid. The
relative biomarkers can be derived from measured biomarker values, with these
being used
by defining corresponding acceptable reference thresholds for each relative
biomarker. These
relative biomarkers may or may not include relative biomarkers used in
determining the
indicator, and could include the same biomarker values used in different or
the same
combinations. In one example, this provides a set of relevant controls without
the need for
any additional measured biomarkers being added to the assay.
[0240] The system can further be used to provide the appropriate use of these
controls in a
medical device using the relative biomarkers used in establishing the
indicator value.
[0241] The system can also provide a method by which additional internal
relative
biomarkers may be added to the group of relative controls to meet any
arbitrarily stringent
control requirement such that a minimal set of additional measured biomarkers
is required,
thus providing an optimal performance for a minimum cost.
[0242] Despite allowing additional markers to be avoided, the system can
successfully detect
test failure in cases where prior art methods are not able to, a critical
advance in the case of
medical devices where acting on an invalid test results can have potentially
life threatening
consequences.
[0243] The system is also shown by example to appropriately pass a result in
cases where
prior art methods unnecessarily fail a sample. Also an important advance for
medical devices
with potentially life-critical consequences if a test is unnecessarily failed
(and the result is
therefore unavailable).
CA 02986787 2017-11-22
WO 2016/187655 PCT/AU2016/050388
- 65 -
[0244] A further example will now be described using in-house data derived
from the use of
real-time polymerase chain reaction (RT-PCR) on 546 blood samples taken from
patients
with suspected sepsis. The results of the assay provide a probability of a
patient having sepsis
(or SIRS) based on a formula that uses the PCR Ct (cycle time) values for each
of four target
genes (PLA2G7, PLAC8, LAMP1 and CEACAM4).
[0245] The method in brief was as follows. Patient blood was collected
directly into
PAXgene tubes and total RNA extracted. The RT-PCR assay was provided in kit
form to a
hospital laboratory based in the Netherlands. The assay uses quantitative,
real-time
determination of the amount of each four host immune cell RNA transcripts in
the sample
based on the detection of fluorescence on a qRT-PCR instrument (e.g. Applied
Biosystems
7500 Fast Dx Real-Time PCR Instrument, Applied Biosystems, Foster City, CA,
catalogue
number 440685; K082562). Transcripts are each reverse-transcribed, amplified,
detected, and
quantified in a separate reaction well for each target gene using a probe that
was visualized in
the FAM channel. Each of the four target genes has a known Ct range and when
assay results
are obtained outside of these ranges the test is failed. For each sample the
following internal
controls were also run in separate reaction vessels ¨ HIGH, LOW, NEGATIVE and
a no-
template (NTC). The HIGH, LOW and NEGATIVE internal controls contain a known
quantity of an artificial DNA template ¨ each of these separate reactions must
also fall within
a particular Ct range for the assay to pass, and the NTC must not amplify a
PCR product.
[0246] A summary table of the results from running the assay on these 546
samples using
both control methods ("Normal" and "Relative") is shown below in Table 6. Full
results are
shown in Tables 7, 8, 9 and 10.
Table 6
Relative
Normal Fail Pass
Fail (Controls) 0 23
Fail (Four Targets) 2 3
Pass 13 505
CA 02986787 2017-11-22
WO 2016/187655 PCT/AU2016/050388
- 66 -
[0247] A brief summary, explanation and discussion of these results follows.
[0248] 505 samples (92.5%) were passed using both control methods.
[0249] Two (2) samples were failed using both control strategies. Using the
Normal controls
method both samples failed because the Ct values for the target gene PLA2G7
were out of
the expected Ct range. Using the Relative controls method these same two
samples were
strongly failed because multiple Relative control p values were obtained that
were less than
0.001.
[0250] 26 samples were failed using Normal controls method but were passed
using Relative
control method. Of these 26 samples, 23 were failed because the LOW control
was out of
range. For these 23 samples, all individual gene target measurements (PLA2G7,
PLAC8,
LAMP1 and CEACAM4) were within the expected Ct range, and all Relative
controls
passed. Upon further inspection of the Ct values for individual genes and
other Normal
controls the 23 samples that were failed because of one out-of-range Normal
control (LOW)
should not have been. The Relative control strategy did not fail these
samples. In practice this
would mean that the use of the Relative controls strategy would have 'rescued'
23 valid
diagnostic tests that would be denied to the patient using a Normal control
method.
[0251] The other three (3) samples failed using the Normal method because the
Ct values for
PLA2G7 were out of the expected range for this gene. Of these three samples:
1) Sample DCP 128: reported adjusted p values for the Relative controls above
0.045. Such a p value suggests that this sample should not have been failed.
Upon further inspection of the Ct values all individual gene measurements were
comparatively high (in the high range for values expected for the other three
genes but not out of range). Such a result suggests that the assay was run
with a
low input RNA concentration or low quality RNA. Despite this, a valid
probability of sepsis was still able to be calculated. Further, the
retrospective
clinical diagnosis of the patient matched the sepsis probability from the
assay,
implying that the assay result was valid and should not have been failed.
CA 02986787 2017-11-22
WO 2016/187655 PCT/AU2016/050388
- 67 -
2) Sample 6869: The Reported Relative control p values were as low as 0.0016.
A
result like this can be expected in 16 in every thousand normal tests.
3) Sample 1357: The Reported Relative control p values were as low as 0.002. A
result like this can be expected in one in every five hundred normal tests.
[0252] The use of Relative control p values allows a clinical interpretation
of the relevance of
an abnormality level (p value), rather than an absolute call, allowing the
treating physician
(or a procedure on behalf of the physician) to determine the optimal p value
at which to call a
fail status on the test.
[0253] There were 13 instances where the Normal method passed samples whereas
the
Relative method did not. In these instances all measured gene markers were
within the
expected Ct range, and all Normal controls were also within range. However,
these samples
resulted in a low p value using the Relative method. In fact, the probability
that the Relative
controls measurements would happen by chance for any of these samples is less
than one in
one thousand. These Relative control results suggests a high level of
abnormality for these 13
samples, and implies that these samples are not similar to other samples
observed, nor similar
to the patient population used for the development and interpretation of the
diagnostic.
Based on the high level of abnormality using the Relative control approach
these 13 samples
should be failed despite the measured markers and Normal controls falling
within expected
Ct range. In this instance the Relative control approach is especially useful,
as it has
identified patients for whom the interpretation of the diagnostic result using
the Normal
control approach is not valid. Further, the Relative control approach provides
a confidence of
the non-validity of the result. These latter two points are discussed in more
detail below.
[0254] Considering sample 3787: all Ct values of the genes are within expected
range, and
the Normal internal controls all are within range. Thus, this result would be
considered valid
using the Normal control approach. However, the Relative control CEACAM4/LAMP1
has a
p value of 0.0007642 and the Relative control LAMP 1/PLAC8 has a p value of
3.96E-07
indicating that such a result occurs in less than one in a million cases
(based on the
distribution curve of expected results). Such a result can be interpreted in
two ways:
CA 02986787 2017-11-22
WO 2016/187655 PCT/AU2016/050388
- 68 -
1). The test values are correct, and this really is a one-in-a-million
patient.
2). The test values are incorrect and there is some problem with the assay.
[0255] Any patient sample that generates a test result so radically different
(1:1,000,000
chance) from all other patient samples should not be diagnosed with reference
to other patient
sample results that fit within the normal distribution - such a result should
at least be further
investigated (e.g. repeat the assay and/or investigate patient clinical
notes).
[0256] Thus, when Relative controls approach reveal highly unlikely results
(based on p
value) the test should be failed. In these 13 cases, through appropriate
failure of the samples,
the Relative controls approach can 1) 'protect' patients from diagnostic calls
that are unlikely
to be actually valid, and 2) detect more sensitively test results that do not
reflect the true
status of the patient.
[0257] Full results of the 546 assays are shown in Tables 7, 8, 9 and 10.
[0258] Table 7 shows raw data results for 505 samples (of 546) that passed
using both the
Normal and Relative controls method.
Table 7
Normal Controls Relative Controls
cef
-8 -8
cf11) ce:3
11)0.3
c)
P.o
ft
0.0 0.0
6607 21.3 23.7 25.0 21.6 P P 0.368 0.233 0.472 0.535 0.222 0.185 P
6617 22.5 24.3 28.0 19.8 P P 0.769 0.267 0.838 0.163 0.941 0.405 P
6629 21.6 24.0 27.3 21.1 P P 0.363 0.581 0.762 0.945 0.897 0.948 P
6636 22.0 24.7 32.7 22.0 P P 0.205 0.331 0.003 0.906 0.012 0.049 P
6648 23.7 23.6 29.2 22.3 P P 0.072 0.916 0.810 0.233 0.248 0.787 P
6650 21.6 24.3 29.5 17.9 P P 0.224 0.059 0.146 0.004 0.341 0.018 P
6653 21.2 24.0 26.8 18.3 P P 0.183 0.193 0.809 0.019 0.685 0.328 P
CA 02986787 2017-11-22
WO 2016/187655 PCT/AU2016/050388
- 69 -
Normal Controls Relative Controls
ce)
'-`;1 '-`;1
54, -E0 (,)
c-) ETo I 3 c<.j Lt7 r%t7 Lt7
c-jj N N
c-jj
C.) P-1 C.40
6656 24.0 24.3 28.5 22.3 P P 0.148 0.737 0.786 0.491 0.668 0.971 P
6657 22.4 23.2 26.9 21.2 P P 0.414 0.963 0.753 0.521 0.944 0.765 P
6658 22.0 24.3 31.1 21.4 P P 0.480 0.672 0.036 0.953 0.058 0.120 P
IPX-098 21.5 23.8 30.5 19.3 P P 0.433 0.422 0.041 0.155 0.072 0.025 P
IXP-080 23.9 24.4 25.2 20.0 P P 0.232 0.042 0.050 0.191 0.133 0.627 P
IXP-081 23.6 24.3 27.2 22.0 P P 0.368 0.778 0.451 0.725 0.719 0.628 P
IXP-082 23.2 25.2 28.5 21.9 P P 0.623 0.984 0.921 0.706 0.890 0.922 P
IXP-083 24.0 24.7 29.5 22.1 P P 0.317 0.592 0.820 0.879 0.458 0.608 P
IXP-087 23.1 23.7 26.4 21.1 P P 0.265 0.595 0.363 0.810 0.674 0.638 P
IXP-088 22.5 24.7 25.5 21.6 P P 0.489 0.816 0.263 0.800 0.122 0.270 P
IXP-089 21.2 23.1 28.8 20.4 P P 0.705 0.738 0.188 0.935 0.221 0.348 P
IXP-090 21.1 23.7 29.0 21.2 P P 0.256 0.319 0.142 0.810 0.313 0.498 P
IXP-095 22.6 25.2 27.4 18.7 P P 0.246 0.043 0.870 0.003 0.450 0.292 P
IXP-096 22.9 24.5 27.3 22.0 P P 0.954 0.779 0.708 0.797 0.666 0.624 P
IXP-097 24.0 25.0 28.8 21.9 P P 0.566 0.508 0.911 0.771 0.868 0.768 P
6681 25.2 26.0 30.3 23.1 P P 0.380 0.530 0.977 0.972 0.640 0.692 P
6694 21.4 24.3 27.3 21.7 P P 0.159 0.248 0.669 0.831 0.808 0.754 P
6706 22.7 24.4 28.2 20.7 P P 0.896 0.559 0.808 0.473 0.845 0.579 P
6709 21.5 24.5 26.9 21.3 P P 0.102 0.423 0.860 0.743 0.532 0.748 P
6713 21.4 24.2 26.1 19.5 P P 0.174 0.596 0.844 0.121 0.374 0.886 P
6718 23.2 24.3 29.7 19.6 P P 0.612 0.069 0.452 0.116 0.289 0.085 P
6735 23.1 25.7 27.4 23.2 P P 0.247 0.311 0.696 0.808 0.319 0.349 P
6744 20.5 23.7 31.1 19.1 P P 0.066 0.923 0.004 0.151 0.027 0.010 P
6746 21.1 23.2 26.1 18.2 P P 0.573 0.184 0.935 0.068 0.712 0.475 P
6750 22.3 23.6 26.1 21.0 P P 0.759 0.923 0.492 0.906 0.559 0.592 P
6888 23.4 24.5 26.3 22.2 P P 0.593 0.985 0.238 0.714 0.317 0.313 P
IXP 099 23.0 24.6 25.5 21.2 P P 0.997 0.639 0.175
0.619 0.146 0.372 P
IXP 102 24.8 26.2 28.2 22.8 P P 0.806 0.575 0.367
0.675 0.398 0.654 P
IXP 104 24.4 25.7 28.9 22.5 P P 0.783 0.646 0.763
0.772 0.852 0.992 P
IXP 105 22.4 24.2 28.1 19.6 P P 0.857 0.210 0.760
0.142 0.812 0.315 P
IXP 107 22.5 23.6 25.2 21.3 P P 0.532 0.996 0.214
0.648 0.307 0.282 P
CA 02986787 2017-11-22
WO 2016/187655 PCT/AU2016/050388
- 70 -
Normal Controls Relative Controls
ce)
54, 0' (,)
c-) ETo I 3 c<.j Lt7 r%t7 Lt7
c-jj N N
c-jj
C.) P-1 C.40
IXP 108 23.2 25.1 27.3 22.2 P P 0.759 0.852 0.597
0.982 0.471 0.571 P
IXP 110 22.1 23.9 29.4 19.5 P P 0.829 0.291 0.261
0.200 0.272 0.111 P
IXP 111 22.2 24.4 27.1 21.6 P P 0.472 0.630 0.907
0.994 0.629 0.700 P
IXP 112 24.2 25.2 27.2 22.9 P P 0.486 0.949 0.271
0.663 0.405 0.362 P
IXP 113 23.0 23.7 29.9 22.1 P P 0.306 0.802 0.333
0.314 0.121 0.492 P
IXP 117 22.0 22.7 28.3 19.6 P P 0.327 0.371 0.540
0.807 0.252 0.290 P
IXP 122 23.2 24.1 27.0 21.7 P P 0.420 0.836 0.499
0.716 0.746 0.644 P
6762 25.1 24.9 29.0 20.4 P P 0.050 0.008 0.531 0.164 0.761 0.310 P
6773 23.7 24.1 29.4 20.9 P P 0.181 0.238 0.725 0.771 0.296 0.316 P
6776 22.7 24.3 28.8 20.1 P P 0.998 0.298 0.587 0.266 0.561 0.278 P
6786 21.5 23.4 27.7 18.6 P P 0.730 0.190 0.587 0.100 0.681 0.214 P
6796 25.1 25.4 29.9 20.5 P P 0.169 0.011 0.889 0.085 0.592 0.166 P
6824 23.2 24.6 29.2 22.2 P P 0.882 0.828 0.625 0.734 0.549 0.769 P
6825 22.2 24.4 27.8 23.4 P P 0.517 0.065 0.779 0.135 0.982 0.397 P
6841 22.5 24.1 28.2 20.2 P P 0.939 0.412 0.765 0.413 0.720 0.458 P
6844 22.2 23.7 29.1 20.4 P P 0.973 0.690 0.329 0.688 0.287 0.281 P
6845 22.6 24.6 28.1 22.5 P P 0.624 0.385 0.800 0.568 0.979 0.768 P
6867 21.0 23.2 24.5 20.2 P P 0.474 0.731 0.411 0.880 0.215 0.361 P
IXP 123 24.4 24.7 28.3 22.4 P P 0.161 0.546 0.519
0.711 0.994 0.842 P
IXP 124 22.4 25.1 29.1 19.3 P P 0.200 0.174 0.398
0.017 0.789 0.125 P
IXP 129 23.4 24.7 27.1 23.2 P P 0.728 0.417 0.455
0.264 0.530 0.261 P
IXP 130 23.0 23.8 26.0 21.1 P P 0.404 0.607 0.278
0.956 0.454 0.527 P
IXP 131 22.2 24.5 26.8 20.3 P P 0.427 0.609 0.816
0.263 0.518 0.919 P
IXP 132 22.9 24.7 25.4 20.4 P P 0.841 0.351 0.182
0.255 0.125 0.547 P
IXP 135 22.0 24.5 28.4 19.4 P P 0.336 0.292 0.496
0.069 0.802 0.226 P
IXP 137 23.4 24.7 30.1 22.1 P P 0.808 0.964 0.398
0.898 0.303 0.449 P
IXP 142 23.3 24.3 27.3 21.2 P P 0.479 0.475 0.563
0.804 0.790 0.939 P
IXP 145 22.9 25.0 28.2 22.5 P P 0.561 0.530 0.892
0.803 0.885 0.799 P
6890 22.1 22.8 28.2 19.2 P P 0.325 0.215 0.587 0.542 0.283 0.229 P
6650 22.3 22.7 29.8 18.6 P P 0.175 0.060 0.209 0.306 0.043 0.028 P
6869 23.2 24.7 26.9 23.2 P P 0.898 0.359 0.439 0.285 0.443 0.226 P
CA 02986787 2017-11-22
WO 2016/187655 PCT/AU2016/050388
- 71 -
Normal Controls Relative Controls
ce)
'-`;1 '-`;1
54, -E0 (,)
c-) ETo I 3 c<.j Lt7 r%t7 Lt7
c-jj N N c-jj
C.) P-1 C.40
IXP 128 25.6 26.7 30.8 24.1 P P 0.560 0.869 0.935
0.805 0.705 0.867 P
6592 22.4 24.3 26.0 20.4 P P 0.712 0.524 0.410 0.344 0.285 0.737 P
6598 21.3 22.6 26.0 20.5 P P 0.739 0.698 0.872 0.512 0.995 0.713 P
6601 22.5 23.5 25.3 20.3 P P 0.523 0.458 0.228 0.742 0.329 0.547 P
6603 22.1 23.3 29.0 22.2 P P 0.651 0.328 0.360 0.170 0.227 0.832 P
6622 27.3 29.5 30.1 24.5 P P 0.429 0.233 0.234 0.065 0.094 0.746 P
6624 23.0 24.0 27.5 21.1 P P 0.492 0.611 0.736 0.964 0.985 0.992 P
6631 22.3 23.5 27.0 20.1 P P 0.641 0.431 0.810 0.615 0.980 0.796 P
6641 21.9 23.0 26.2 19.7 P P 0.559 0.466 0.678 0.723 0.878 0.942 P
6643 21.5 22.7 27.6 18.7 P P 0.677 0.250 0.575 0.354 0.418 0.244 P
6647 20.4 24.1 30.9 23.2 P P 0.016 0.002 0.004 0.129 0.064 0.516 P
6649 23.7 24.5 27.5 19.2 P P 0.381 0.013 0.509 0.043 0.786 0.365 P
6665 24.1 23.6 29.3 20.6 P P 0.017 0.082 0.990 0.905 0.227 0.299 P
IXP-084 21.1 23.3 31.4 19.4 P P 0.512 0.741 0.007 0.408 0.010 0.011 P
IXP-085 22.0 25.3 25.1 20.0 P P 0.066 0.555 0.292 0.050 0.041 0.575 P
IXP-086 22.6 24.2 31.8 19.7 P P 0.997 0.198 0.031 0.170 0.020 0.009 P
IXP-091 23.8 25.0 26.9 22.5 P P 0.692 0.945 0.291 0.832 0.350 0.384 P
IXP-092 24.3 26.1 28.0 22.5 P P 0.816 0.701 0.482 0.563 0.384 0.704 P
IXP-093 22.5 24.2 28.1 20.0 P P 0.966 0.324 0.794 0.278 0.795 0.418 P
IXP-094 23.8 25.4 26.8 22.0 P P 0.997 0.669 0.261 0.647 0.227 0.473 P
IXP-100 24.0 25.9 25.6 22.1 P P 0.730 0.594 0.064 0.413 0.031 0.200 P
IXP-101 21.9 24.0 27.9 19.0 P P 0.536 0.222 0.618 0.080 0.821 0.249 P
IXP-103 22.7 24.9 29.5 20.1 P P 0.473 0.318 0.378 0.113 0.557 0.177 P
IXP-106 23.2 24.4 27.9 20.2 P P 0.666 0.180 0.850 0.264 0.991 0.530 P
IXP-114 23.9 25.6 27.1 21.8 P P 0.918 0.477 0.307 0.405 0.251 0.644 P
6669 21.4 22.6 26.5 20.0 P P 0.659 0.897 0.995 0.856 0.821 0.935 P
6678 22.1 23.2 26.4 20.4 P P 0.584 0.717 0.680 0.991 0.866 0.887 P
6679 23.1 23.4 27.8 20.7 P P 0.141 0.366 0.860 0.919 0.586 0.703 P
6686 22.7 24.5 30.2 22.1 P P 0.801 0.602 0.202 0.708 0.214 0.428 P
6689 21.9 24.1 29.9 22.0 P P 0.497 0.297 0.124 0.535 0.190 0.477 P
6698 22.7 23.5 25.1 21.9 P P 0.397 0.706 0.160 0.310 0.277 0.151 P
CA 02986787 2017-11-22
WO 2016/187655 PCT/AU2016/050388
- 72 -
Normal Controls Relative Controls
ce)
'-`;1 '-`;1
54, -E0 (,)
L) ETo C.) P-1 C.40 c<.j Lt7 r%t7
Lt7
c-jj N N c-jj
6715 20.2 22.6 27.7 19.2 P P 0.362 0.830 0.203 0.666 0.362 0.331 P
6732 23.0 24.1 25.9 21.0 P P 0.565 0.536 0.249 0.808 0.341 0.528 P
6748 22.0 23.9 25.5 21.9 P P 0.739 0.386 0.406 0.494 0.290 0.218 P
6752 22.9 23.7 27.4 19.8 P P 0.394 0.163 0.756 0.385 0.927 0.579 P
6758 21.6 22.4 27.1 18.3 P P 0.407 0.125 0.830 0.301 0.520 0.275 P
6882 22.1 24.3 27.6 22.9 P P 0.459 0.114 0.826 0.251 0.894 0.457 P
IXP-115 22.4 24.1 26.4 20.5 P P 0.883 0.607 0.574 0.512 0.498 0.856 P
IXP-116 22.4 23.4 27.8 21.4 P P 0.469 0.913 0.870 0.522 0.591 0.939 P
IXP-118 21.2 24.4 27.6 22.9 P P 0.064 0.026 0.481 0.299 0.867 0.477 P
IXP-119 22.5 24.4 28.0 20.5 P P 0.771 0.542 0.840 0.390 0.942 0.593 P
IXP-120 22.5 24.0 28.0 21.8 P P 0.936 0.680 0.840 0.618 0.797 0.945 P
IXP-121 20.4 22.7 29.3 18.1 P P 0.407 0.426 0.044 0.147 0.080 0.027 P
IXP-125 22.7 25.1 28.8 22.7 P P 0.382 0.341 0.595 0.703 0.893 0.918 P
IXP-126 22.3 24.1 26.2 20.3 P P 0.838 0.567 0.546 0.448 0.453 0.854 P
IXP-127 23.0 24.4 26.2 21.2 P P 0.869 0.674 0.322 0.742 0.326 0.544 P
IXP-133 22.3 25.1 27.8 21.1 P P 0.188 0.989 0.832 0.348 0.669 0.861 P
IXP-134 23.2 25.9 25.4 19.0 P P 0.209 0.028 0.138 0.001 0.027 0.983 P
3967 24.6 26.0 29.3 21.3 P P 0.874 0.121 0.845 0.124 0.897 0.454 P
3746 20.7 23.1 24.9 20.9 P P 0.375 0.265 0.653 0.585 0.355 0.295 P
3555 23.0 25.7 29.7 22.7 P P 0.235 0.484 0.419 0.910 0.783 0.776 P
3469 20.1 23.0 26.8 19.8 P P 0.134 0.487 0.399 0.731 0.874 0.750 P
3179 22.9 24.3 27.2 21.4 P P 0.812 0.794 0.647 0.915 0.709 0.809 P
3363 21.0 23.4 25.3 19.5 P P 0.346 0.839 0.685 0.369 0.365 0.818 P
2732 22.3 23.5 28.1 20.1 P P 0.675 0.460 0.680 0.627 0.514 0.427 P
2603 22.3 23.9 26.1 21.6 P P 0.952 0.652 0.519 0.661 0.470 0.410 P
2553 21.6 24.2 26.9 19.5 P P 0.237 0.550 0.891 0.135 0.658 0.637 P
3974 23.1 25.4 30.5 22.5 P P 0.408 0.592 0.230 0.978 0.381 0.472 P
3729 2 21.9 24.4 30.1 22.0 P P 0.313 0.310 0.107
0.726 0.220 0.428 P
3499 24.6 24.9 27.8 22.2 P P 0.140 0.382 0.314 0.892 0.729 0.724 P
3447 22.1 24.3 27.8 20.2 P P 0.522 0.627 0.769 0.326 0.996 0.589 P
3248 22.3 24.3 27.6 19.7 P P 0.623 0.322 0.905 0.158 0.907 0.491 P
CA 02986787 2017-11-22
WO 2016/187655 PCT/AU2016/050388
- 73 -
Normal Controls Relative Controls
ce)
'-`;1 '-`;1
54, -E0 (,)
c-) ETo I 3 c<.j Lt7 r%t7 Lt7
c-jj N N c-jj
C.) P-1 C.40
3398 22.9 23.7 25.2 22.3 P P 0.342 0.641 0.146 0.236 0.277 0.126 P
3008 22.5 24.2 26.5 21.1 P P 0.935 0.874 0.552 0.820 0.497 0.674 P
2662 23.4 24.6 26.2 21.1 P P 0.677 0.449 0.236 0.612 0.288 0.565 P
2568 22.3 24.4 29.3 20.3 P P 0.548 0.564 0.298 0.293 0.414 0.215 P
3921 24.6 25.0 30.3 22.7 P P 0.180 0.581 0.762 0.702 0.321 0.557 P
3729_i 21.1 22.7 27.1 19.0 P P 0.959 0.485 0.638 0.434 0.632 0.413 P
3485 22.0 23.2 30.1 18.7 P P 0.649 0.122 0.117 0.188 0.056 0.023 P
3445 22.4 23.9 30.6 18.6 P P 0.965 0.049 0.104 0.039 0.077 0.010 P
3168 22.1 24.0 25.0 20.9 P P 0.706 0.995 0.262 0.789 0.164 0.331 P
3367 23.8 26.0 29.0 21.0 P P 0.447 0.243 0.946 0.073 0.759 0.454 P
3045 22.0 23.0 26.8 20.5 P P 0.525 0.814 0.891 0.834 0.865 0.984 P
2776 23.0 24.5 28.0 21.8 P P 0.918 0.979 0.993 0.919 0.967 0.982 P
2566 21.7 23.8 27.0 20.0 P P 0.605 0.726 0.942 0.454 0.857 0.787 P
3934 20.6 22.8 27.7 17.8 P P 0.507 0.238 0.277 0.082 0.404 0.102 P
3676 1 20.4 23.3 26.5 19.1 P P
0.146 0.932 0.616 0.253 0.852 0.629 P
3485 1 22.3 24.7 29.4 21.8 P P 0.387 0.610 0.312
0.934 0.513 0.567 P
3652 22.3 23.7 28.4 20.2 P P 0.811 0.490 0.605 0.574 0.500 0.393 P
3201 21.6 23.5 24.5 19.6 P P 0.666 0.563 0.250 0.353 0.147 0.515 P
3282 22.1 24.4 27.9 19.0 P P 0.420 0.158 0.698 0.037 0.988 0.242 P
2990 23.0 24.8 25.9 21.2 P P 0.862 0.650 0.245 0.542 0.182 0.462 P
2943 21.6 23.2 27.3 21.8 P P 0.989 0.259 0.740 0.225 0.716 0.704 P
2541 22.0 23.4 31.0 19.9 P P 0.858 0.545 0.039 0.605 0.021 0.032 P
3875 21.3 23.6 29.5 19.3 P P 0.409 0.538 0.107 0.210 0.187 0.079 P
3677 21.3 23.9 26.2 20.3 P P 0.245 0.852 0.926 0.520 0.497 0.849 P
3449 21.2 24.2 25.1 20.7 P P 0.117 0.582 0.515 0.585 0.139 0.375 P
3136 22.6 23.1 24.9 20.2 P P 0.262 0.398 0.149 0.929 0.322 0.455 P
3311 23.3 25.7 25.8 20.5 P P 0.350 0.234 0.169 0.052 0.052 0.627 P
3333 23.1 23.8 27.1 20.8 P P 0.317 0.408 0.538 0.876 0.872 0.965 P
3108 22.6 24.2 24.1 20.9 P P 0.988 0.736 0.066 0.711 0.048 0.165 P
2855 21.4 23.3 25.1 20.8 P P 0.735 0.639 0.448 0.798 0.325 0.351 P
2539 21.6 22.9 29.3 19.4 P P 0.766 0.480 0.174 0.590 0.108 0.111 P
CA 02986787 2017-11-22
WO 2016/187655 PCT/AU2016/050388
- 74 -
Normal Controls Relative Controls
ce)
'-`;1 '-`;1
54, -E0 (,)
c") ETo C.) P-1 C.40 c<.) Lt7 r%t7
Lt7
c-jj N N c-jj
3900 22.0 25.1 26.1 19.8 P P 0.092 0.461 0.605 0.045 0.163 0.991 P
3701 21.2 24.0 30.0 19.4 P P 0.167 0.685 0.051 0.152 0.160 0.054 P
3803 22.3 24.5 28.6 20.5 P P 0.486 0.670 0.505 0.337 0.713 0.408 P
3612 21.4 22.6 26.8 17.7 P P 0.692 0.070 0.851 0.099 0.689 0.217 P
3233 24.0 25.1 30.1 21.4 P P 0.543 0.274 0.624 0.468 0.406 0.284 P
3304 22.0 23.3 25.9 20.1 P P 0.773 0.637 0.536 0.768 0.602 0.798 P
3059 22.2 24.5 28.6 22.8 P P 0.422 0.165 0.496 0.369 0.741 0.816 P
3863 22.2 24.4 27.0 20.7 P P 0.503 0.841 0.880 0.484 0.620 0.990 P
3676 22.2 23.9 27.4 19.4 P P 0.957 0.238 0.968 0.194 0.987 0.464 P
3796 21.4 22.3 26.1 20.7 P P 0.455 0.680 0.824 0.327 0.894 0.663 P
3583 21.9 22.6 26.8 19.3 P P 0.312 0.288 0.933 0.689 0.678 0.578 P
3428 21.7 23.3 24.8 21.2 P P 0.997 0.599 0.289 0.574 0.256 0.220 P
3317 23.2 26.1 29.8 19.5 P P 0.159 0.063 0.437 0.003 0.894 0.076 P
3323 23.0 24.1 28.7 22.0 P P 0.537 0.854 0.758 0.521 0.523 0.875 P
2960 20.3 22.2 26.4 17.1 P P 0.727 0.145 0.574 0.071 0.668 0.178 P
3074 22.2 22.4 27.4 19.5 P P 0.108 0.247 0.972 0.942 0.402 0.475 P
3848 21.6 23.5 27.8 18.3 P P 0.746 0.110 0.561 0.052 0.643 0.148 P
3644 22.8 23.2 27.8 21.3 P P 0.191 0.843 0.950 0.462 0.559 0.950 P
3729 21.6 24.3 26.7 22.6 P P 0.226 0.089 0.984 0.348 0.532 0.306 P
3577 22.3 23.7 27.9 18.3 P P 0.789 0.037 0.790 0.042 0.675 0.143 P
3390_i 20.9 23.5 27.5 18.0 P P 0.299 0.183 0.435 0.030 0.749 0.144 P
3381 22.6 22.5 27.8 20.4 P P 0.054 0.467 0.945 0.537 0.301 0.624 P
3330 20.4 23.1 26.0 20.2 P P 0.238 0.445 0.786 0.969 0.766 0.828 P
2903 21.7 23.3 25.3 20.8 P P 0.994 0.827 0.410 0.820 0.374 0.400 P
2582 22.2 23.8 28.3 21.1 P P 0.903 0.889 0.590 0.952 0.605 0.702 P
3842 22.2 25.4 26.1 22.9 P P 0.084 0.136 0.529 0.736 0.124 0.155 P
4001 21.0 23.9 30.7 17.3 P P 0.158 0.051 0.017 0.002 0.062 0.001 P
3720 20.2 21.7 26.1 19.3 P P 0.969 0.773 0.650 0.737 0.612 0.825 P
3575 20.7 23.0 28.4 21.1 P P 0.429 0.208 0.179 0.441 0.294 0.677 P
3438 23.0 24.0 25.8 20.5 P P 0.485 0.330 0.214 0.594 0.324 0.618 P
3320 22.9 24.4 27.7 21.3 P P 0.929 0.793 0.849 0.830 0.873 0.992 P
CA 02986787 2017-11-22
WO 2016/187655 PCT/AU2016/050388
- 75 -
Normal Controls Relative Controls
ce)
54, 0' (,)
c") ETo C.) P-1 C.40 c<.j Lt7 r%t7
Lt7
c-jj N N
c-jj
3390 20.8 23.8 29.1 17.2 P P 0.105 0.069 0.089 0.002 0.308 0.011 P
2832 23.1 23.8 27.2 21.3 P P 0.350 0.700 0.617 0.791 0.944 0.839 P
2656_i 22.4 23.6 30.7 20.9 P P 0.654 0.854 0.097 0.898 0.045 0.123 P
2462055 21.8 23.4 27.7 20.0 P P 0.948 0.636 0.706 0.647 0.662 0.545 P
2724618 22.5 24.8 27.1 21.2 P P 0.435 0.975 0.810 0.549 0.517 0.850 P
2114572 21.2 22.9 24.9 20.9 P P 0.968 0.478 0.447 0.467 0.403 0.282 P
673 20.8
22.6 26.1 21.3 P P 0.828 0.177 0.920 0.199 0.999 0.477 P
2040977 21.0 22.6 24.9 21.2 P P 0.995 0.272 0.532 0.240 0.504 0.234 P
2110722 21.9 23.5 27.1 22.6 P P 0.983 0.134 0.962 0.106 0.951 0.398 P
2699937 21.7 24.1 26.7 21.7 P P 0.362 0.360 0.968 0.753 0.619 0.565 P
2965737 20.0 24.3 26.5 20.1 P P 0.002 0.301 0.459 0.247 0.446 0.977 P
2765556 21.9 24.5 26.3 19.6 P P 0.243 0.437 0.729 0.094 0.340 0.873 P
2690379 23.0 24.6 27.4 22.0 P P 0.956 0.865 0.714 0.825 0.715 0.677 P
2568313 23.9 24.0 27.1 20.6 P P 0.103 0.119 0.343 0.630 0.837 0.919 P
2746904 22.7 24.1 26.4 21.7 P P 0.830 0.870 0.447 0.741 0.478 0.451 P
2983402 23.3 24.3 28.1 22.7 P P 0.545 0.618 0.896 0.332 0.871 0.683 P
2661258 22.2 23.6 26.1 21.1 P P 0.800 0.927 0.551 0.779 0.607 0.569 P
2392555 23.2 25.3 30.4 22.2 P P 0.524 0.853 0.254 0.792 0.364 0.381 P
676 21.3 22.8 25.4 19.9 P P 0.908 0.920 0.607 0.981 0.621 0.700 P
870 22.7
23.1 24.6 19.9 P P 0.198 0.253 0.094 0.773 0.248 0.441 P
2235988 22.7 24.7 30.0 20.0 P P 0.629 0.252 0.254 0.116 0.325 0.097 P
2256503 24.3 25.8 30.4 21.9 P P 0.944 0.359 0.609 0.353 0.560 0.325 P
2258733 21.6 24.2 27.6 21.4 P P 0.280 0.417 0.643 0.933 0.968 0.937 P
2488145 23.9 26.5 29.0 20.7 P P 0.280 0.135 0.983 0.018 0.575 0.387 P
2140058 19.9 23.4 27.7 21.5 P P 0.034 0.031 0.153 0.442 0.635 0.965 P
2668849 21.7 23.4 28.3 20.2 P P 0.929 0.819 0.453 0.758 0.446 0.433 P
2752236 23.8 26.4 29.3 23.1 P P 0.254 0.726 0.860 0.651 0.705 0.957 P
2405147 23.5 26.8 32.0 23.0 P P 0.051 0.554 0.070 0.435 0.332 0.225 P
2267987 23.2 24.6 30.1 21.2 P P 0.765 0.525 0.365 0.645 0.262 0.247 P
2303930 23.1 25.6 25.6 22.5 P P 0.305 0.642 0.178 0.805 0.050 0.150 P
2268023 24.0 25.8 29.9 23.3 P P 0.783 0.698 0.690 0.831 0.772 0.909 P
CA 02986787 2017-11-22
WO 2016/187655 PCT/AU2016/050388
- 76 -
Normal Controls Relative Controls
ce)
'-`;1 '-`;1
54, -E0 (,)
c-) ETo I 3 c<.j Lt7 r%t7 Lt7
c-jj N N
c-jj
C.) P-1 C.40
2235292 22.1 23.4 27.6 18.4 P P 0.755 0.065 0.825 0.081 0.694 0.199 P
2260065 26.5 27.0 31.8 23.6 P P 0.226 0.215 0.895 0.655 0.456 0.397 P
2557316 22.0 24.4 28.1 19.8 P P 0.329 0.493 0.589 0.150 0.927 0.383 P
2564997 23.4 25.6 29.5 21.3 P P 0.461 0.494 0.591 0.207 0.835 0.386 P
2197899 23.1 24.2 28.5 21.1 P P 0.554 0.549 0.867 0.833 0.635 0.618 P
2202851 23.2 24.3 25.6 21.3 P P 0.567 0.591 0.161 0.874 0.223 0.372 P
2370415 23.6 27.2 29.4 24.2 P P 0.024 0.161 0.723 0.889 0.456 0.601 P
2387538 23.2 26.7 28.3 21.8 P P 0.034 0.875 0.988 0.089 0.298 0.916 P
2520432 23.0 23.5 26.3 21.9 P P 0.201 0.948 0.356 0.319 0.724 0.403 P
2469194 22.8 24.4 28.2 21.9 P P 0.982 0.819 0.867 0.820 0.866 0.993 P
2493616 22.6 25.6 28.3 19.5 P P 0.108 0.146 0.752 0.007 0.644 0.258 P
2511358 21.9 22.4 26.1 18.0 P P 0.216 0.041 0.640 0.200 0.908 0.422 P
620 22.8
24.2 26.5 21.2 P P 0.884 0.794 0.487 0.863 0.500 0.655 P
583 22.1
23.7 29.0 21.5 P P 0.971 0.614 0.354 0.572 0.311 0.616 P
512 21.9
23.6 29.6 21.3 P P 0.855 0.615 0.172 0.686 0.169 0.377 P
517 23.2
25.0 29.7 21.1 P P 0.832 0.497 0.460 0.380 0.492 0.299 P
514 21.9
24.0 25.9 21.4 P P 0.552 0.580 0.555 0.874 0.353 0.403 P
5678_i 20.9 22.9 27.1 16.9 P P 0.720 0.033 0.581 0.011 0.679 0.083 P
391 20.8
22.3 25.9 19.5 P P 0.935 0.977 0.995 0.978 0.962 0.982 P
333 23.0
23.7 31.3 19.2 P P 0.349 0.058 0.093 0.179 0.023 0.010 P
360 23.1
25.6 26.5 21.4 P P 0.330 0.720 0.377 0.277 0.151 0.581 P
330 21.3
23.6 25.3 21.6 P P 0.445 0.243 0.558 0.489 0.312 0.231 P
302 21.6
22.2 23.3 19.0 P P 0.300 0.320 0.082 0.756 0.177 0.360 P
2475364 23.0 24.8 25.5 21.5 P P 0.859 0.819 0.167 0.709 0.116 0.290 P
249291 22.4 24.2 27.0 22.5 P P 0.809 0.330 0.797 0.387 0.691 0.424 P
4186 20.9 23.2 26.4 20.3 P P 0.423 0.639 0.804 0.937 0.894 0.950 P
4109 23.3 25.3 30.8 19.1 P P 0.685 0.023 0.215 0.007 0.259 0.016 P
4087 21.7 23.7 27.4 19.1 P P 0.680 0.279 0.785 0.146 0.931 0.381 P
458 21.2
22.5 28.1 17.3 P P 0.744 0.041 0.337 0.052 0.232 0.042 P
454 1 21.4 23.2 26.1 19.6 P P
0.860 0.638 0.809 0.530 0.728 0.945 P
487 21.5
23.2 26.0 21.0 P P 0.950 0.577 0.733 0.583 0.691 0.532 P
CA 02986787 2017-11-22
WO 2016/187655 PCT/AU2016/050388
- 77 -
Normal Controls Relative Controls
ce)
54, 0' (,)
c-) ETo I 3 c<.j Lt7 r%t7 Lt7
c-jj N N
c-jj
C.) P-1 C.40
454 21.3
23.0 25.1 20.2 P P 0.937 0.928 0.497 0.969 0.442 0.522 P
450 24.6
25.2 28.1 22.2 P P 0.242 0.371 0.401 0.915 0.750 0.844 P
5769_i 23.1 25.9 30.3 21.2 P P 0.157 0.620 0.261 0.120 0.617 0.206 P
286 22.6
23.5 27.2 21.4 P P 0.447 0.989 0.800 0.571 0.914 0.820 P
204 20.3
22.7 25.7 21.1 P P 0.387 0.134 0.875 0.331 0.792 0.453 P
194 22.0
23.2 26.5 20.9 P P 0.640 0.925 0.756 0.661 0.920 0.746 P
4348 21.1 23.1 27.4 21.3 P P 0.672 0.289 0.533 0.410 0.647 0.930 P
4229 21.7 24.2 27.4 21.5 P P 0.291 0.414 0.746 0.915 0.858 0.839 P
4273 22.9 24.3 27.2 21.6 P P 0.811 0.951 0.683 0.914 0.750 0.752 P
4206 24.2 25.6 31.2 20.1 P P 0.839 0.025 0.320 0.025 0.242 0.029 P
4224 20.5 23.8 31.7 21.7 P P 0.054 0.064 0.001 0.563 0.013 0.095 P
1654 23.0 26.8 27.4 22.2 P P 0.012 0.725 0.696 0.152 0.096 0.586 P
3215498 22.6 24.1 26.3 21.9 P P 0.917 0.706 0.444 0.633 0.442 0.377 P
2875063 21.9 23.8 25.1 20.2 P P 0.706 0.750 0.322 0.540 0.211 0.504 P
2916462 23.2 25.2 30.3 23.3 P P 0.621 0.328 0.286 0.493 0.368 0.731 P
2989696 24.9 26.2 28.1 22.4 P P 0.725 0.345 0.338 0.452 0.393 0.787 P
3150468 22.0 22.3 25.7 18.5 P P 0.155 0.084 0.458 0.415 0.932 0.702 P
3269616 22.5 23.6 28.5 21.0 P P 0.661 0.840 0.613 0.919 0.446 0.578 P
2823098 21.2 24.3 31.1 21.8 P P 0.077 0.143 0.011 0.780 0.063 0.180 P
3253112 22.6 24.2 28.0 20.5 P P 0.994 0.481 0.869 0.449 0.862 0.576 P
3182559 20.5 22.1 24.3 19.9 P P 0.982 0.618 0.492 0.606 0.454 0.374 P
2892503 24.0 25.2 28.9 22.9 P P 0.712 0.912 0.931 0.701 0.927 0.889 P
2954473 22.0 24.0 26.5 21.0 P P 0.644 0.831 0.774 0.914 0.590 0.709 P
3075030 21.9 23.2 25.1 20.7 P P 0.695 0.981 0.301 0.757 0.360 0.364 P
3151800 24.2 25.3 30.3 21.9 P P 0.589 0.400 0.608 0.613 0.412 0.347 P
2842448 24.6 25.0 30.7 21.3 P P 0.205 0.114 0.584 0.442 0.223 0.159 P
2152744 21.4 23.5 29.1 22.9 P P 0.564 0.033 0.166 0.063 0.230 0.948 P
3285480 24.1 24.7 27.7 23.1 P P 0.285 0.854 0.447 0.332 0.777 0.444 P
3187134 21.8 21.3 24.7 19.3 P P 0.018 0.332 0.238 0.497 0.932 0.656 P
2996445 22.0 24.2 28.2 20.5 P P 0.533 0.844 0.585 0.508 0.783 0.557 P
2973087 21.8 23.3 25.3 19.5 P P 0.950 0.455 0.430 0.452 0.414 0.810 P
CA 02986787 2017-11-22
WO 2016/187655 PCT/AU2016/050388
- 78 -
Normal Controls Relative Controls
ce)
'-`;1'-`;1
54, -E0 (,)
c-) ETo I 3 c<.j Lt7 r%t7 Lt7
c-jj N N
c-jj
C.) P-1 C.40
3007078 23.2 24.7 29.3 19.1 P P 0.892 0.028 0.610 0.024 0.538 0.081 P
3143971 21.7 24.0 27.2 19.5 P P 0.441 0.456 0.831 0.177 0.877 0.532 P
3241087 21.8 22.2 25.0 20.0 P P 0.161 0.658 0.328 0.587 0.727 0.560 P
2801327 24.5 25.3 26.7 22.3 P P 0.380 0.453 0.121 0.869 0.220 0.370 P
2774672 22.9 24.4 26.8 19.8 P P 0.902 0.146 0.541 0.144 0.552 0.740 P
3267724 24.1 24.1 26.8 20.1 P P 0.070 0.032 0.214 0.329 0.667 0.846 P
3219499 24.8 25.5 26.9 20.5 P P 0.367 0.021 0.128 0.070 0.237 0.958 P
3022381 21.8 21.9 25.0 19.4 P P 0.105 0.399 0.325 0.786 0.803 0.725 P
2973476 24.2 25.3 30.1 22.0 P P 0.600 0.501 0.637 0.736 0.443 0.421 P
3143818 22.3 24.0 26.6 21.2 P P 0.874 0.930 0.691 0.983 0.613 0.692 P
3118227 24.2 24.6 29.2 23.8 P P 0.179 0.516 0.967 0.096 0.532 0.674 P
3250409 22.5 24.2 27.5 20.5 P P 0.878 0.583 0.954 0.486 0.890 0.783 P
2654918 24.0 25.2 26.7 21.5 P P 0.664 0.370 0.229 0.522 0.282 0.610 P
2163170 22.3 23.5 28.1 20.1 P P 0.695 0.489 0.678 0.650 0.522 0.443 P
3257803 23.4 24.7 28.6 21.8 P P 0.733 0.761 0.989 0.939 0.853 0.848 P
2911717 23.9 25.0 29.3 22.9 P P 0.563 0.875 0.873 0.558 0.645 0.964 P
3082897 24.7 25.3 30.7 20.3 P P 0.261 0.014 0.622 0.071 0.276 0.060 P
2893476 24.0 26.9 30.0 24.1 P P 0.167 0.306 0.668 0.928 0.818 0.814 P
3136847 22.1 23.2 26.1 21.7 P P 0.557 0.503 0.557 0.254 0.735 0.366 P
3161091 20.4 22.2 24.9 19.6 P P 0.761 0.740 0.762 0.893 0.634 0.647 P
3263354 23.2 24.0 26.9 20.1 P P 0.354 0.163 0.474 0.413 0.760 0.836 P
2156886 23.7 25.2 29.6 22.5 P P 0.999 0.958 0.655 0.956 0.632 0.723 P
3247954 20.6 24.1 26.8 20.8 P P 0.031 0.281 0.578 0.681 0.633 0.876 P
3042060 24.6 26.9 27.6 22.8 P P 0.373 0.670 0.289 0.272 0.114 0.507 P
2961182 25.1 26.5 32.4 23.7 P P 0.859 0.896 0.258 0.992 0.192 0.292 P
3141749 21.0 23.0 24.0 20.0 P P 0.610 0.844 0.287 0.873 0.162 0.300 P
3174398 22.5 23.4 27.2 22.2 P P 0.466 0.492 0.842 0.207 0.881 0.563 P
2425352 21.3 23.2 24.4 20.0 P P 0.713 0.969 0.287 0.758 0.185 0.370 P
2628334 21.1 25.0 27.1 22.4 P P 0.009 0.054 0.642 0.870 0.421 0.461 P
2156857 22.4 23.5 27.7 20.7 P P 0.553 0.753 0.893 0.925 0.660 0.762 P
3222786 22.9 24.0 27.4 20.9 P P 0.622 0.586 0.770 0.824 0.946 0.945 P
CA 02986787 2017-11-22
WO 2016/187655 PCT/AU2016/050388
- 79 -
Normal Controls Relative Controls
ce)
54, 0' (,)
c-) ETo I 3 c<.j Lt7 r%t7 Lt7
c-jj N N
c-jj
C.) P-1 C.40
3008502 23.1 24.4 28.1 19.3 P P 0.749 0.047 0.950 0.059 0.927 0.263 P
3007162 23.4 25.9 28.1 23.0 P P 0.335 0.536 0.845 0.969 0.490 0.593 P
3173057 24.3 24.8 31.1 21.7 P P 0.213 0.320 0.366 0.875 0.112 0.172 P
3111443 21.0 23.4 28.2 19.1 P P 0.353 0.625 0.265 0.233 0.463 0.211 P
2671979 24.0 25.8 29.6 22.7 P P 0.817 0.935 0.792 0.799 0.867 0.783 P
2627904 22.8 24.7 27.6 22.0 P P 0.686 0.703 0.900 0.909 0.737 0.739 P
2789061 22.2 25.3 29.6 24.1 P P 0.074 0.016 0.210 0.204 0.649 0.735 P
3269868 21.6 24.6 27.0 22.1 P P 0.118 0.197 0.865 0.806 0.550 0.538 P
3033996 22.4 24.5 26.8 21.4 P P 0.576 0.864 0.706 0.824 0.494 0.670 P
2910981 23.4 27.5 29.8 24.4 P P 0.005 0.095 0.503 0.815 0.505 0.684 P
3018183 22.0 24.3 28.9 21.1 P P 0.420 0.808 0.346 0.745 0.543 0.503 P
3125147 23.1 24.7 27.4 22.8 P P 0.981 0.485 0.687 0.467 0.657 0.447 P
3129468 21.0 24.5 28.4 22.1 P P 0.030 0.075 0.224 0.748 0.826 0.999 P
2857601 22.5 23.8 26.8 21.9 P P 0.784 0.616 0.682 0.463 0.762 0.515 P
2636623 25.4 27.0 31.6 24.4 P P 0.953 0.806 0.558 0.826 0.549 0.719 P
2781026 24.2 27.5 31.4 25.3 P P 0.045 0.073 0.260 0.641 0.833 0.929 P
3255360 23.1 24.7 27.4 21.5 P P 0.951 0.803 0.698 0.756 0.655 0.851 P
3029652 23.8 26.8 27.0 22.7 P P 0.115 0.966 0.313 0.273 0.062 0.370 P
2912013 25.7 27.1 33.5 25.4 P P 0.819 0.455 0.146 0.336 0.094 0.415 P
2880471 22.9 25.3 29.5 20.8 P P 0.419 0.497 0.442 0.190 0.673 0.286 P
3151473 22.3 23.1 25.3 20.5 P P 0.369 0.646 0.276 0.873 0.472 0.504 P
3131243 23.4 24.3 26.2 20.9 P P 0.444 0.328 0.234 0.625 0.371 0.653 P
2811174 22.3 26.2 27.9 21.9 P P 0.009 0.541 0.804 0.217 0.301 0.883 P
2768722 24.3 25.8 29.1 21.7 P P 0.953 0.324 0.895 0.314 0.911 0.639 P
2601748 22.3 23.1 27.1 20.2 P P 0.370 0.496 0.871 0.938 0.785 0.793 P
2793139 21.2 21.4 26.5 17.9 P P 0.103 0.114 0.900 0.615 0.343 0.297 P
175 22.8
23.6 28.7 18.0 P P 0.380 0.007 0.665 0.026 0.366 0.050 P
1528 23.9 24.2 29.4 20.6 P P 0.133 0.114 0.850 0.550 0.342 0.273 P
763 21.6
22.4 23.6 19.4 P P 0.402 0.467 0.104 0.866 0.185 0.330 P
2449113 23.7 25.2 28.5 22.7 P P 0.922 0.865 0.902 0.801 0.934 0.836 P
1239 23.7 25.9 27.6 23.1 P P 0.508 0.631 0.530 0.974 0.315 0.409 P
CA 02986787 2017-11-22
WO 2016/187655 PCT/AU2016/050388
- 80 -
Normal Controls Relative Controls
ce)
'-`;1 '-`;1
54, -E0 (,)
c") ETo C.) P-1 C.40 c<.) Lt7 r%t7
Lt7
c-jj N N
c-jj
2240 20.9 25.2 30.4 19.5 P P 0.002 0.865 0.021 0.016 0.343 0.036 P
1894 23.3 25.5 27.6 23.2 P P 0.475 0.390 0.691 0.690 0.434 0.395 P
1143 23.8 25.6 30.4 20.3 P P 0.855 0.086 0.445 0.049 0.466 0.094 P
2888477 21.3 23.4 28.7 19.6 P P 0.591 0.678 0.228 0.406 0.305 0.199 P
2786127 22.2 23.7 27.0 20.8 P P 0.920 0.894 0.871 0.944 0.901 0.951 P
1782 26.3 25.0 30.0 21.2 P P 0.001 0.003 0.492 0.443 0.376 0.255 P
2774321 24.8 26.2 31.1 19.8 P P 0.887 0.005 0.509 0.004 0.435 0.025 P
2512541 21.6 23.6 27.8 18.1 P P 0.612 0.089 0.571 0.029 0.723 0.135 P
2109 23.1 25.3 28.1 21.4 P P 0.514 0.728 0.934 0.399 0.679 0.893 P
2005 22.1 24.2 27.8 21.7 P P 0.543 0.518 0.768 0.803 0.989 0.899 P
1145 22.8 25.6 31.0 19.3 P P 0.168 0.088 0.097 0.005 0.275 0.015 P
2545687 19.7 21.6 28.4 19.0 P P 0.748 0.710 0.061 0.869 0.064 0.161 P
1824 26.1 25.2 30.0 21.0 P P 0.004 0.003 0.539 0.266 0.443 0.217 P
554 22.3
22.6 25.8 19.1 P P 0.150 0.131 0.405 0.572 0.860 0.864 P
2152399 25.2 25.0 31.4 20.1 P P 0.047 0.003 0.573 0.083 0.111 0.025 P
1630 23.9 24.9 26.2 23.0 P P 0.499 0.756 0.146 0.412 0.221 0.150 P
2089 22.5 24.3 28.3 20.3 P P 0.812 0.467 0.732 0.343 0.803 0.468 P
1914 21.0 22.0 25.5 18.5 P P 0.519 0.346 0.774 0.591 0.990 0.758 P
1189 20.9 24.5 28.0 20.3 P P 0.024 0.613 0.289 0.275 0.989 0.538 P
2677542 25.1 26.7 30.1 22.9 P P 0.989 0.472 0.952 0.438 0.943 0.710 P
2073538 23.5 23.5 29.5 20.4 P P 0.074 0.152 0.656 0.814 0.171 0.218 P
1967 21.6 23.1 26.2 19.5 P P 0.905 0.533 0.810 0.563 0.842 0.873 P
2550576 22.5 24.2 27.2 22.5 P P 0.911 0.372 0.810 0.384 0.754 0.462 P
438 22.7
22.3 26.9 18.0 P P 0.024 0.008 0.659 0.241 0.514 0.240 P
1550 25.1 26.0 30.1 23.2 P P 0.420 0.635 0.970 0.938 0.718 0.804 P
2087 21.4 23.4 26.7 19.4 P P 0.655 0.538 0.941 0.327 0.886 0.668 P
1902 22.4 24.4 26.5 21.4 P P 0.591 0.820 0.619 0.884 0.423 0.573 P
3485126 24.1 27.1 29.8 23.9 P P 0.108 0.421 0.720 0.761 0.678 0.868 P
1957 23.8 24.5 28.6 20.7 P P 0.306 0.138 0.848 0.400 0.761 0.477 P
278 24.3
25.4 31.7 21.3 P P 0.528 0.155 0.247 0.289 0.120 0.066 P
2276373 23.6 24.2 28.4 21.0 P P 0.312 0.297 0.904 0.705 0.708 0.609 P
CA 02986787 2017-11-22
WO 2016/187655 PCT/AU2016/050388
- 81 -
Normal Controls Relative Controls
ce)
54, 0' (,)
c") ETo C.) P-1 C.40 c<.) Lt7 r%t7
Lt7
c-jj N N
c-jj
2318175 21.7 23.9 28.5 21.0 P P 0.485 0.699 0.369 0.925 0.538 0.584 P
2079564 23.4 24.3 27.6 18.0 P P 0.426 0.001 0.647 0.005 0.925 0.136 P
2295511 26.3 26.1 29.3 22.7 P P 0.041 0.063 0.274 0.612 0.875 0.877 P
2495 23.5 25.5 27.0 21.3 P P 0.575 0.466 0.420 0.237 0.252 0.791 P
1837 25.2 26.9 32.1 23.3 P P 0.924 0.634 0.346 0.564 0.335 0.273 P
1223 24.8 26.3 28.9 23.1 P P 0.934 0.719 0.575 0.747 0.576 0.786 P
2193 25.1 26.4 31.2 23.4 P P 0.762 0.700 0.593 0.849 0.468 0.490 P
2045301 25.0 25.3 31.1 21.0 P P 0.176 0.041 0.570 0.229 0.199 0.089 P
2469217 21.2 22.5 27.3 19.9 P P 0.681 0.933 0.630 0.835 0.470 0.641 P
2351284 20.9 21.9 22.4 19.2 P P 0.466 0.733 0.057 0.870 0.094 0.150 P
2712378 21.6 23.2 26.5 19.3 P P 0.949 0.415 0.921 0.411 0.941 0.692 P
2739656 24.6 26.2 29.0 23.6 P P 0.984 0.856 0.704 0.858 0.676 0.664 P
2462 20.0 24.1 27.7 21.5 P P 0.006 0.041 0.186 0.834 0.953 0.945 P
1835 22.1 23.5 26.6 21.1 P P 0.848 0.837 0.767 0.720 0.824 0.705 P
1400 22.0 23.9 25.0 20.7 P P 0.694 0.990 0.286 0.766 0.180 0.361 P
2662486 24.7 24.7 27.6 22.1 P P 0.071 0.279 0.247 0.879 0.732 0.719 P
2654139 20.8 22.4 24.0 20.1 P P 0.905 0.679 0.339 0.723 0.278 0.284 P
2309104 23.0 25.8 28.6 20.0 P P 0.192 0.182 0.797 0.018 0.709 0.312 P
1426 23.4 24.1 28.9 21.7 P P 0.329 0.767 0.810 0.696 0.457 0.702 P
2661366 26.4 25.9 29.9 22.2 P P 0.018 0.022 0.410 0.466 0.765 0.519 P
2143801 25.0 25.6 28.9 22.6 P P 0.255 0.363 0.542 0.884 0.931 0.991 P
1717 23.3 24.7 28.5 20.9 P P 0.849 0.380 0.943 0.424 0.864 0.561 P
1863 23.7 25.6 26.9 22.4 P P 0.771 0.970 0.310 0.801 0.216 0.392 P
1218 24.9 26.4 29.3 23.1 P P 0.870 0.622 0.689 0.683 0.728 0.957 P
2566446 21.9 22.0 25.5 20.0 P P 0.080 0.589 0.431 0.490 0.979 0.718 P
2355070 23.3 26.3 30.2 20.0 P P 0.105 0.111 0.325 0.004 0.803 0.073 P
2512233 24.8 26.2 31.2 20.6 P P 0.808 0.023 0.495 0.024 0.393 0.053 P
2317 22.1 25.1 25.8 21.9 P P 0.111 0.428 0.489 0.757 0.124 0.287 P
2286 22.9 25.7 28.6 22.3 P P 0.179 0.636 0.761 0.639 0.731 0.986 P
1128 21.6 25.0 27.7 22.3 P P 0.037 0.131 0.605 0.923 0.626 0.656 P
1536 19.4 23.4 24.9 17.3 P P 0.008 0.492 0.840 0.008 0.266 0.561 P
CA 02986787 2017-11-22
WO 2016/187655 PCT/AU2016/050388
- 82 -
Normal Controls Relative Controls
ce)
'-`;1 '-`;1
54, -E0 (,)
c") ETo C.) P-1 C.40 c<.) Lt7 r%t7
Lt7
c-jj N N
c-jj
2257043 21.1 22.5 27.0 17.7 P P 0.786 0.098 0.660 0.117 0.544 0.174 P
2231993 22.7 23.1 25.9 20.1 P P 0.190 0.287 0.319 0.852 0.677 0.817 P
1521 25.5 24.8 27.5 22.3 P P 0.011 0.142 0.111 0.785 0.657 0.611 P
220 24.1 24.8 27.5 20.0 P P 0.338 0.027 0.360 0.097 0.614 0.606 P
893 23.8
24.8 28.5 20.8 P P 0.490 0.177 0.826 0.348 0.913 0.543 P
2138 23.6 25.5 30.3 23.0 P P 0.705 0.595 0.389 0.770 0.462 0.667 P
2076 22.3 24.3 25.8 22.6 P P 0.660 0.250 0.400 0.364 0.261 0.159 P
1142 23.1 26.8 28.7 24.6 P P 0.016 0.036 0.794 0.632 0.355 0.312 P
1539 22.8 24.3 30.3 20.8 P P 0.923 0.552 0.211 0.572 0.165 0.152 P
349 21.9
23.6 26.2 20.1 P P 0.887 0.652 0.672 0.560 0.599 0.921 P
1669 26.0 25.8 28.1 23.6 P P 0.042 0.367 0.116 0.610 0.501 0.410 P
2740095 21.3 24.7 28.6 22.1 P P 0.050 0.119 0.269 0.805 0.833 0.974 P
2855706 21.2 22.8 26.8 19.9 P P 0.962 0.982 0.793 0.954 0.796 0.810 P
2259 20.6 22.1 27.0 16.6 P P 0.908 0.032 0.502 0.027 0.436 0.064 P
2593636 22.0 22.6 28.3 17.2 P P 0.230 0.006 0.531 0.042 0.204 0.032 P
2937810 22.8 24.3 30.0 20.8 P P 0.862 0.540 0.270 0.597 0.204 0.189 P
2792222 24.2 25.4 29.2 23.2 P P 0.656 0.846 0.931 0.596 0.896 0.850 P
1853 22.2 23.3 26.3 19.6 P P 0.582 0.312 0.639 0.496 0.818 0.847 P
2802981 22.6 25.2 28.1 19.1 P P 0.225 0.092 0.797 0.008 0.743 0.223 P
2060742 21.4 22.3 25.5 18.8 P P 0.406 0.277 0.584 0.577 0.863 0.865 P
820 20.8
21.2 25.5 17.8 P P 0.213 0.181 0.866 0.599 0.660 0.518 P
922 21.7
22.1 28.0 18.7 P P 0.180 0.158 0.556 0.592 0.194 0.179 P
2319 25.9 25.8 34.3 21.2 P P 0.059 0.008 0.088 0.143 0.006 0.002 P
1532 23.9 25.9 30.4 24.1 P P 0.659 0.300 0.474 0.432 0.583 0.995 P
632 24.4
25.4 31.0 23.7 P P 0.483 0.734 0.438 0.384 0.238 0.640 P
2226 24.1 25.1 29.6 22.4 P P 0.507 0.721 0.830 0.920 0.575 0.692 P
2332187 21.5 23.7 26.8 18.3 P P 0.497 0.134 0.915 0.037 0.822 0.328 P
2423724 23.7 26.1 29.6 20.9 P P 0.391 0.222 0.692 0.055 0.998 0.287 P
2269 25.5 26.5 29.1 23.1 P P 0.574 0.381 0.455 0.598 0.602 0.899 P
893 1 24.8 26.3 28.5 21.0 P P
0.878 0.045 0.455 0.043 0.468 0.589 P
1016 24.8 24.9 26.8 21.4 P P 0.113 0.106 0.107 0.565 0.347 0.662 P
CA 02986787 2017-11-22
WO 2016/187655 PCT/AU2016/050388
- 83 -
Normal Controls Relative Controls
ce)
'-`;1 '-`;1
54, -E0 (,)
c-) ETo I 3 c<.j Lt7 r%t7 Lt7
c-jj N N
c-jj
C.) P-1 C.40
2914265 24.4 25.8 28.7 21.1 P P 0.912 0.130 0.687 0.125 0.705 0.585 P
2235173 23.6 24.5 31.8 19.8 P P 0.454 0.055 0.098 0.133 0.032 0.010 P
615 24.3
25.3 30.3 23.8 P P 0.525 0.592 0.629 0.302 0.404 0.920 P
2555715 24.5 26.5 30.7 21.5 P P 0.664 0.173 0.557 0.077 0.679 0.189 P
3032 25.0 26.3 31.2 21.1 P P 0.725 0.036 0.561 0.048 0.424 0.082 P
2533160 23.9 26.6 31.9 24.4 P P 0.203 0.181 0.138 0.614 0.338 0.623 P
2108553 25.0 25.6 30.4 21.1 P P 0.280 0.039 0.889 0.157 0.491 0.181 P
2855460 24.3 25.6 26.6 21.5 P P 0.718 0.223 0.149 0.299 0.171 0.598 P
2505890 25.3 26.9 30.1 21.5 P P 0.945 0.046 0.851 0.037 0.867 0.308 P
438_i 24.9 24.5 28.7 21.4 P P 0.028 0.089 0.522 0.820 0.685 0.651 P
1670 24.1 24.6 29.1 21.7 P P 0.196 0.344 0.939 0.941 0.574 0.622 P
2895821 26.2 26.8 30.2 23.4 P P 0.271 0.241 0.563 0.651 0.942 0.847 P
382 24.8
24.3 27.6 22.3 P P 0.020 0.322 0.222 0.533 0.878 0.639 P
923 23.4
24.2 26.0 19.6 P P 0.406 0.051 0.188 0.138 0.318 0.986 P
739 20.6
21.3 25.1 17.2 P P 0.319 0.109 0.775 0.324 0.850 0.484 P
1023 25.4 25.7 29.0 21.7 P P 0.127 0.058 0.431 0.358 0.932 0.659 P
2197135 26.2 26.7 33.0 22.2 P P 0.234 0.033 0.365 0.160 0.117 0.041 P
2442 23.8 24.7 29.8 20.3 P P 0.421 0.075 0.645 0.187 0.370 0.147 P
3245 23.0 25.3 29.1 21.8 P P 0.486 0.967 0.607 0.584 0.838 0.640 P
2214618 22.5 23.5 27.9 20.1 P P 0.502 0.375 0.865 0.645 0.605 0.502 P
2923104 25.6 28.3 31.1 24.1 P P 0.216 0.829 0.836 0.260 0.693 0.759 P
2577185 25.3 25.9 26.8 23.8 P P 0.229 0.839 0.058 0.513 0.152 0.130 P
2691741 25.6 25.9 29.1 23.6 P P 0.147 0.583 0.394 0.642 0.848 0.681 P
2067 26.1 27.6 29.9 23.7 P P 0.940 0.360 0.497 0.357 0.490 0.964 P
2866838 24.6 27.4 29.7 24.1 P P 0.193 0.592 0.993 0.711 0.510 0.746 P
651 24.2
25.8 25.2 19.1 P P 0.979 0.003 0.033 0.002 0.023 0.935 P
784 22.8
24.4 27.8 21.8 P P 0.991 0.854 0.966 0.851 0.959 0.884 P
2538 22.5 22.5 24.8 20.5 P P 0.072 0.530 0.135 0.526 0.479 0.357 P
243 22.6
22.8 25.3 18.1 P P 0.134 0.014 0.210 0.126 0.551 0.713 P
2024940 23.7 26.4 30.3 25.1 P P 0.195 0.043 0.428 0.222 0.839 0.608 P
2473497 25.3 26.5 29.8 21.3 P P 0.657 0.037 0.776 0.058 0.934 0.325 P
CA 02986787 2017-11-22
WO 2016/187655 PCT/AU2016/050388
- 84 -
Normal Controls Relative Controls
ce)
'-`;1 '-`;1
54, -E0 (,)
c") ETo C.) P-1 C.40 c<.) Lt7 r%t7
Lt7
c-jj N N
c-jj
2727912 24.6 25.6 27.0 21.1 P P 0.569 0.093 0.161 0.168 0.222 0.828 P
687 24.3
25.5 31.0 20.4 P P 0.662 0.039 0.400 0.059 0.262 0.051 P
160 24.3
24.8 29.0 21.2 P P 0.245 0.167 0.858 0.527 0.698 0.507 P
670 27.3
27.5 29.9 24.9 P P 0.109 0.394 0.200 0.802 0.565 0.547 P
2629101 26.5 26.9 30.3 24.4 P P 0.186 0.526 0.513 0.778 0.967 0.850 P
2532 23.1 24.3 28.2 17.7 P P 0.706 0.001 0.999 0.002 0.852 0.060 P
2071896 24.0 25.9 29.8 20.8 P P 0.713 0.132 0.725 0.061 0.846 0.233 P
2788747 25.9 27.6 29.8 22.6 P P 0.903 0.108 0.550 0.072 0.482 0.665 P
1611 22.8 24.3 27.6 17.9 P P 0.919 0.005 0.904 0.004 0.937 0.121 P
1248 21.8 23.1 28.7 18.9 P P 0.738 0.215 0.346 0.280 0.239 0.122 P
790 23.6
23.7 27.3 19.4 P P 0.091 0.021 0.454 0.216 0.969 0.474 P
1079 24.3 25.2 30.3 24.0 P P 0.483 0.438 0.624 0.182 0.381 0.972 P
3063 24.7 25.9 29.9 20.2 P P 0.651 0.013 0.947 0.020 0.767 0.127 P
3117 25.0 25.3 29.7 20.8 P P 0.143 0.024 0.865 0.176 0.583 0.234 P
852 25.5
26.2 29.4 22.6 P P 0.351 0.223 0.527 0.532 0.831 0.862 P
2295 23.8 23.8 25.1 20.4 P P 0.072 0.096 0.046 0.637 0.214 0.460 P
2912 25.1 26.1 31.0 20.9 P P 0.488 0.022 0.672 0.053 0.423 0.086 P
3137 24.9 25.8 29.1 22.5 P P 0.398 0.359 0.621 0.715 0.914 0.908 P
1206 22.0 22.5 25.0 20.1 P P 0.200 0.581 0.271 0.734 0.589 0.533 P
2974887 23.0 24.6 29.5 20.8 P P 0.972 0.464 0.446 0.450 0.404 0.275 P
2526 23.1 25.3 30.7 21.6 P P 0.495 0.809 0.190 0.452 0.286 0.202 P
3044 22.0 22.8 27.0 20.1 P P 0.336 0.586 0.960 0.907 0.669 0.780 P
2907847 22.8 23.6 26.6 19.1 P P 0.337 0.060 0.476 0.191 0.775 0.620 P
3210 23.3 25.0 26.2 22.1 P P 0.913 0.994 0.235 0.943 0.184 0.303 P
3199 25.4 25.1 30.0 21.4 P P 0.033 0.039 0.801 0.508 0.429 0.316 P
3318 26.5 27.4 32.4 22.5 P P 0.431 0.037 0.659 0.098 0.386 0.106 P
3111 24.5 26.1 29.1 21.3 P P 0.990 0.140 0.803 0.113 0.784 0.511 P
3210_i 26.4 26.7 29.5 23.2 P P 0.160 0.129 0.310 0.547 0.698 0.983 P
3088 24.0 24.8 26.9 20.0 P P 0.398 0.037 0.246 0.107 0.410 0.818 P
2912876 27.2 28.4 32.7 26.0 P P 0.635 0.995 0.831 0.726 0.642 0.857 P
2825793 25.6 25.4 30.2 22.1 P P 0.044 0.083 0.769 0.695 0.491 0.440 P
CA 02986787 2017-11-22
WO 2016/187655 PCT/AU2016/050388
- 85 -
Normal Controls Relative Controls
11)
ce3 -8 -8
0.0st2,0
`) L. ) `)
r<1 U L5 UL
ct c#A
cfDPr" <11 <11 <11 cl)
0-1 0-1
2761 20.7 21.2 25.9 17.4 P P 0.233 0.127 0.936 0.444 0.496 0.331 P
2440 22.1 22.4 26.1 20.0 P P 0.128 0.473 0.542 0.737 0.917 0.919 P
[0259] Table 8 shows raw data results for 2 samples (of 546) that failed both
the Normal
controls and Relative controls method.
Table 8
Normal Controls Relative Controls
ci
r<1 Lt 3'L5 C 3'L
2712753 21.30 22.23 36.06 18.67 F 0.460 0.286 0.000 0.547 0.000 0.000 F
2023537 25.29 25.22 37.02 21.26 F 0.062 0.032 0.001 0.351 0.000 0.000 F
[0260] Table 9 shows raw data results for 26 samples (of 546) that failed both
the Normal
controls but passed the Relative controls method.
Table 9
Normal Controls Relative Controls
CA 02986787 2017-11-22
WO 2016/187655 PCT/AU2016/050388
- 86 _
-c-t ,_c_t -c-t -c-t
_c.)c,0
-' C. U Lc3 g c'" .÷" t ',-,' c'" ',-,' t
L5 t-c'-' ,cg
g r-, 1 Tt,
cA -' - - cA
0
c.)
6759 22.5 23.6 26.5 22.0 F F 0.62 0.56 0.57 0.33 0.71 0.40 P
0 6 1 2 9 6 0 7 2 7
6769 23.8 24.0 27.3 21.3 F F 0.10 0.31 0.38 0.92 0.89 0.87 P
9 5 2 4 7 7 5 1 7 3
6789 22.5 23.2 26.8 21.7 F F 0.33 0.71 0.68 0.28 0.97 0.56 P
2 6 3 6 8 7 1 0 1 9
6812 21.9 23.7 26.1 22.1 F F 0.86 0.29 0.62 0.31 0.53 0.29 P
7 1 2 2 4 0 2 5 9 3
6829 22.0 23.9 26.7 22.4 F F 0.72 0.19 0.84 0.26 0.69 0.35 P
4 5 5 9 1 7 2 4 5 0
6834 21.2 23.9 29.1 20.8 F F 0.22 0.52 0.15 0.83 0.35 0.39 P
9 7 1 8 1 6 3 4 6 1
6836 21.2 23.5 27.8 20.3 F F 0.41 0.75 0.40 0.79 0.62 0.59 P
0 2 8 8 2 3 5 6 7 4
6843 21.4 22.5 24.0 20.4 F F 0.63 0.83 0.20 0.56 0.25 0.21 P
2 8 7 6 2 3 0 8 6 8
6852 21.9 24.0 26.3 22.6 F F 0.54 0.13 0.72 0.24 0.49 0.23 P
0 3 3 4 6 2 6 2 8 3
6853 23.8 24.4 25.9 21.2 F F 0.27 0.28 0.11 0.73 0.25 0.46 P
7 9 7 5 3 9 7 6 6 7
6870 24.1 25.3 28.1 22.1 F F 0.70 0.56 0.59 0.73 0.70 0.90 P
0 5 7 1 2 4 3 5 2 4
IXP- 22.6 24.0 27.7 20.5 F F 0.86 0.50 0.96 0.55 0.89 0.66 P
109 1 5 9 0 6 3 1 4 1 1
ixp-136 23.0 24.4 25.5 19.5 F F 0.80 0.09 0.17 0.10 0.18 0.87 P
4 1 6 9 8 0 8 3 5 1
IXP- 23.4 24.1 28.7 20.7 F F 0.29 0.27 0.92 0.68 0.52 0.46 P
138 7 2 5 9 1 2 0 3 6 1
IXP- 22.1 23.3 26.0 20.9 F F 0.68 0.94 0.55 0.71 0.66 0.58 P
139 2 5 9 7 8 7 5 8 5 3
IXP- 21.4 23.3 27.5 22.0 F F 0.74 0.16 0.60 0.21 0.69 0.71 P
140 8 6 5 4 4 8 7 8 7 1
IXP- 23.9 25.1 27.5 20.6 F F 0.63 0.11 0.43 0.17 0.54 0.78 P
141 5 2 5 3 7 1 4 4 6 9
IXP- 23.2 24.4 26.0 22.1 F F 0.63 0.90 0.24 0.63 0.30 0.27 P
143 4 0 9 6 5 3 0 5 6 7
IXP- 22.5 24.8 27.0 22.0 F F 0.37 0.57 0.77 0.96 0.45 0.56 P
144 2 9 6 1 8 9 4 3 5 4
IXP- 22.0 24.1 27.2 21.3 F F 0.53 0.68 0.97 0.98 0.78 0.83 P
146 5 9 0 5 1 2 4 6 1 0
IXP- 24.9 25.7 26.2 21.6 F F 0.33 0.11 0.04 0.32 0.09 0.42 P
CA 02986787 2017-11-22
WO 2016/187655 PCT/AU2016/050388
- 87 -
Normal Controls Relative Controls
cf, c,0 -
Po oc Po ,)
1 'cl) r-P.' L5 `3 L5
`3 - ';' `3 rt
-4., 1 eo eo cg c'A
w
147 9 2 4 9 2 5 4 9 4 0
IXP- 21.4 23.1 25.7 21.8 F F 0.88 0.22 0.67 0.23 0.60 0.28 P
148 6 8 5 0 7 8 4 7 2 2
IXP- 23.6 24.1 25.5 22.1 F F 0.22 0.82 0.08 0.52 0.21 0.17 P
149 7 9 0 4 6 1 7 6 8 9
6869 31.6 35.9 37.2 33.4 P F 0.00 0.01 0.78 0.80 0.20 0.24 P
0 9 2 6 2 8 4 9 1 5
IXP 12 31.8 33.3 38.0 28.1 P F 0.94 0.05
0.57 0.04 0.52 0.10 P
8 7 9 3 1 0 3 8 5 6 5
1357 27.2 27.0 35.0 22.1 P F 0.04 0.00 0.15 0.08 0.01 0.00 P
7 5 6 2 2 3 7 5 1 3
[0261] Table 10 shows raw data results for 13 samples (of 546) that passed the
Normal
controls but failed the Relative controls method.
Table 10
Normal Controls Relative Controls
O - -'t 3'L5 c't c.'
rE
cz _L, ci A
't t 't 0. 't ci
cfDeo Ed c'
o 'Lo'
c.,
240006 21.1 27.0 29.5 23.3 P P 0.00 0.00 0.07 0.50 0.60 0.95 F
1 1 8 7 0 8 7 8 0 6
249193 21.4 26.4 28.0 23.0 P P 0.00 0.03 0.44 0.62 0.28 0.55 F
0 8 2 4 1 0 5 3 8 7 7
228361 22.0 26.9 30.1 24.6 P P 0.00 0.00 0.11 0.65 0.85 0.68 F
4 5 5 3 9 0 3 8 1 2 8
254184 20.2 25.1 27.5 22.4 P P 0.00 0.01 0.25 0.95 0.52 0.58 F
5 8 7 3 1 0 0 9 6 1 5
3787 26.1 30.7 31.0 21.6 P P 0.00 0.01 0.92 0.00 0.07 0.16 F
CA 02986787 2017-11-22
WO 2016/187655 PCT/AU2016/050388
- 88 -
3 7 9 1 3 9 0 6 6
278105 22.2 27.4 29.0 24.3 P P 0.00 0.00 0.35 0.81 0.28 0.46 F
6 1 9 8 8 0 9 2 8 3 1
263694 19.6 24.7 27.1 21.2 P P 0.00 0.03 0.19 0.57 0.56 0.87 F
8 2 1 8 0 0 1 6 4 3 7
258073 27.2 26.5 29.7 20.6 P P 0.00 0.00 0.17 0.01 0.88 0.20 F
9 7 5 8 6 9 0 7 2 0 6
1329 26.1 24.0 30.8 22.3 P P 0.00 0.05 0.84 0.34 0.06 0.32 F
4 3 6 6 0 2 7 6 1 6
242311 23.9 26.7 32.4 19.8 P P 0.16 0.02 0.07 0.00 0.21 0.00 F
3 0 2 1 0 4 9 3 1 9 4
2791 25.5 23.5 31.4 19.1 P P 0.00 0.00 0.70 0.18 0.01 0.00 F
7 9 0 3 0 0 1 0 6 7
1914 24.6 26.2 29.9 17.7 P P 0.95 0.00 0.93 0.00 0.94 0.00 F
5 9 1 2 8 0 3 0 8 8
2452 23.4 22.9 26.3 17.5 P P 0.01 0.00 0.23 0.03 0.92 0.27 F
8 8 0 6 8 0 4 5 0 6
[0262] Throughout this specification and claims which follow, unless the
context requires
otherwise, the word "comprise", and variations such as "comprises" or
"comprising", will be
understood to imply the inclusion of a stated integer or group of integers or
steps but not the
exclusion of any other integer or group of integers.
[0263] Persons skilled in the art will appreciate that numerous variations and
modifications
will become apparent. All such variations and modifications which become
apparent to
persons skilled in the art, should be considered to fall within the spirit and
scope that the
invention broadly appearing before described.