Note : Les descriptions sont présentées dans la langue officielle dans laquelle elles ont été soumises.
CA 03032946 2019-02-04
WO 2018/031481 PCT/US2017/045776
Computer Architecture and Method for Recommending Asset Repairs
CROSS-REFERENCE TO RELATED APPLICATIONS
111 This application claims priority to U.S. Non-Provisional Patent App.
No. 15/231,587, filed
on August 8, 2016, and entitled "Computer Architecture and Method for
Recommending Asset
Repairs," which is incorporated herein by reference in its entirety.
BACKGROUND
[2] Today, machines (referred to herein as "assets") are ubiquitous in many
industries to the
modern economy. From locomotives that transfer cargo across countries to
farming equipment
that harvest crops, assets play an important role in everyday life. Depending
on the role that an
asset serves, its complexity, and cost may vary. For instance, some assets may
include multiple
subsystems that must operate in harmony for the asset to function properly
(e.g. an engine,
transmission, etc. of a locomotive).
131 Because of the increasing role that assets play, it is also becoming
increasingly desirable
to repair assets with limited downtime. To facilitate this, some have
developed mechanisms to
monitor and detect abnormal conditions within an asset to facilitate repairing
the asset, perhaps
with little downtime. For instance, one approach for monitoring assets
generally involves an on-
asset computer that receives signals from various sensors and/or actuators
distributed throughout
the asset that monitor the operating conditions of the asset. As one
representative example, if the
asset is a locomotive, the sensors and/or actuators may monitor parameters
such as temperatures,
voltages, and speeds, among other examples. If the sensor and/or actuator
signals from one or
more of these devices reach certain values, the on-asset computer may then
generate an abnormal-
condition indicator, such as a "fault code," which is an indication that an
abnormal condition has
occurred within the asset and repair or maintenance may be needed.
[4] In general, an abnormal condition may be a defect at an asset or
component thereof, which
may lead to a failure of the asset and/or component. As such, an abnormal
condition may be
associated with a given failure, or perhaps multiple failures, in that the
abnormal condition is
symptomatic of the given failure or failures. In practice, a user typically
defines the sensors and
respective sensor values associated with each abnormal-condition indicator.
That is, the user
defines an asset's "normal" operating conditions (e.g. those that do not
trigger fault codes and
"abnormal" operating conditions (e.g. those that trigger fault codes).
151 After the on-asset computer generates an abnormal-condition indicator,
the indicator
and/or the sensor and/or actuator signals (which may generally be referred to
as operating data)
1
CA 03032946 2019-02-04
WO 2018/031481 PCT/US2017/045776
may be passed to a remote location such as a remote asset-diagnostic system,
which may perform
analysis on such data and/or cause information regarding asset operation to be
output to a user.
OVERVIEW
[6] Disclosed herein are improved systems, devices, and methods for
generating
recommendations to repair an asset based on operating data. In some examples,
a network
configuration may include a communication network that facilitates
communications between one
or more assets, a remote computing system, and one or more data sources.
171 In accordance with the present disclosure, the remote computing system
may maintain a
hierarchy of conditions that correspond to recommendations for repairing a
given aspect of an
asset (e.g., a given subsystem) based on operating data. In general, the
hierarchy may comprise
conditions corresponding to at least two levels of repair recommendations
having differing levels
of precision. For instance, this hierarchy may include at least (1) a first
condition that corresponds
to a first repair recommendation having a first level of precision (e.g., a
more granular
recommendation), and (2) a second condition that corresponds to a second
repair recommendation
having a second level of precision (e.g., a less granular recommendation).
Additionally, the
hierarchy may include one or more other conditions, each of which may
correspond to a repair
recommendation having the first level of precision, the second level of
precision, or some other
level of precision.
[8] In such a hierarchy, each of the conditions may be based on a
predefined rule, a predictive
model, or some combination thereof For instance, in one embodiment, the first
condition may
be based on a predefined rule and the second condition may be based on a
predictive model (or
vice versa). Other embodiments are possible as well.
191 In practice, the remote computing system may apply the hierarchy to
data indicative of a
given asset's operating condition (i.e., operating data), such as
sensor/actuator data and/or
abnormal-condition data, which may be received from the given asset or some
other external data
source.
[10] For instance, according to one implementation, the remote computing
system may first
analyze the hierarchy's conditions to determine which of the hierarchy's
conditions (if any) are
satisfied by the operating data for the given asset and identify the repair
recommendations
corresponding to the satisfied conditions. If there are two or more two or
more identified repair
recommendations having differing levels of precision, the remote computing
system may then
select the identified repair recommendation having a highest level of
precision (e.g., the most
2
CA 03032946 2019-02-04
WO 2018/031481 PCT/US2017/045776
granular recommendation) and then cause that repair recommendation to be
output by a computing
device.
1111 As noted above, the recommendations for repairing a given asset may
correspond to the
conditions of the hierarchy. Generally, recommendations may be correlated to
the conditions of
the hierarchy by experts in the field (i.e. technicians) or by a computing
device, among other
entities. A recommendation, in one instance, may indicate which component(s)
of an asset are in
need of repair and/or provide instructions for how to repair such
component(s). In some examples,
the remote computing system's output of an indication of a recommendation may
cause display
of the recommendation via a graphical user interface and/or may cause
automated performance of
a repair-associated task (e.g., generation of a work order). Many other
examples are also possible.
[12] In example implementations, the precision level of a recommendation for
repairing a given
asset may vary dependent upon which condition of a hierarchy is satisfied (and
where that
condition falls within the hierarchy's levels). Broadly speaking, a
recommendation corresponding
a higher level of the hierarchy may be more precise/granular than a
recommendation
corresponding to a lower level of the hierarchy. For instance, a
recommendation having a higher
precision level may be directed to a specific aspect of a subsystem (e.g., a
specific mechanical
part such as a screw), whereas a recommendation having a lower precision level
may directed to
the subsystem more generally (e.g., an engine). Moreover, the difference in
precision between
recommendations corresponding to distinct levels of the hierarchy may vary by
any degree, and
such recommendations may encompass any portion of a given asset or group of
assets.
[13] In accordance with the present disclosure, at least one condition of the
hierarchy may be
based on a predefined rule, which may take various forms. In one instance, the
predefined rule
may a rule that is based on one or both of abnormal-condition indicators
(e.g., fault codes) and
sensor criteria. That is, a predefined rule may require the presence of one or
more abnormal-
condition indicators and/or one or more sensor measurement conditions in order
for the rule to be
triggered. In another instance, a predefined rule may comprise a plurality of
predefined rules,
each defined based on a respective set of abnormal-condition indicators and/or
sensor criteria.
Other examples of predefined rules may also be utilized.
[14] In one implementation, a condition based on a predefined rule may
additionally include a
confidence level associated with satisfaction of the predefined rule. A
confidence level, in
general, may be a fixed or variable metric (e.g., a number from 0 to 100) that
indicates a
confidence (or "trust worthiness") in a determination that the predefined rule
has been satisfied
and the first recommendation for repairing a given asset is to be output. The
confidence level
associated with a determination that the predefined rule has been satisfied
may be determined in
3
CA 03032946 2019-02-04
WO 2018/031481 PCT/US2017/045776
various manners. According to one example, the confidence level may be a
single fixed value
that is pre-associated with satisfaction of the predefined rule. According to
another example, the
confidence level may be a variable value that depends on the particular
operating data that led to
satisfaction of the predefined rule, among other examples.
[15] In such an implementation, the remote computing system may (1) determine
that the
predefined rule has been satisfied, (2) determine a confidence level
associated with the satisfaction
of the predefined rule, and then (3) compare that confidence level to a
confidence threshold (which
may be fixed or variable) in order to determine whether the first condition
has been satisfied.
[16] Further, in accordance with the present disclosure, at least one
condition of the hierarchy
may be based on a predictive model, which may also take various forms. In
general, such a
predictive model may take operating data for a given asset as input and may
predict a likelihood
that a given repair is needed (or will be needed in the future) based on that
operating data.
[17] The predictive model may be defined by the remote computing system based
on historical
data for an asset or a group of assets. This historical data may include at
least operating data that
indicates operating conditions of a given asset, or group of assets.
Specifically, operating data
may include historical abnormal-condition data identifying instances when
failures occurred at
assets and/or historical sensor data indicating one or more physical
properties measured at the
assets. The data may also include historical repair data indicating services
performed on assets in
the past and maintenance scheduling data detailing what services are to be
performed on assets in
the future, among other examples of historical data that may be used to define
the predictive
model.
[18] Based on the historical data, the remote computing system may define a
predictive model
that predicts a likelihood that a certain repair should be made. In one
instance, a predictive model
may output a probability value corresponding to a recommendation for repairing
a given asset. In
another instance, the predictive model may output multiple probabilities
corresponding to any
number of recommendations. Many other forms of predictive models may exist as
well.
[19] In operation, a condition based on a predictive model may then be
satisfied when the output
of the predictive model exceeds a confidence threshold. Generally, a
confidence threshold may
be defined by a user in the field or a computing system, among other
possibilities, and may further
be fixed or dynamic.
[20] Accordingly, in one aspect, disclosed herein is a method of providing a
recommendation
for repairing an asset that involves a computing system (a) maintaining a
hierarchy of conditions
that correspond to recommendations for repairing an asset based on operating
data, where the
hierarchy comprises at least (1) a first condition that is based on a
predefined rule and corresponds
4
CA 03032946 2019-02-04
WO 2018/031481 PCT/US2017/045776
to a first repair recommendation having a first level of precision and (2) a
second condition that
is based on a predictive model and corresponds to a second repair
recommendation having a
second level of precision, where the first and second levels of precision
differ, (b) receiving
operating data for a given asset of a plurality of assets, (c) determining
that the first and second
conditions of the hierarchy are satisfied by the received operating data and
thereby identifying the
first and second recommendations, (d) identifying which one of the first and
second
recommendations has a higher level of precision, and (e) causing a computing
device to output an
indication of the identified one of the first and second recommendations.
[21] In another aspect, disclosed herein is a computing system that includes
at least one
processor, a non-transitory computer-readable medium, and program instructions
stored on the
non-transitory computer-readable medium that are executable by the at least
one processor to
cause the computing system to carry out functions disclosed herein for
providing a
recommendation for repairing an asset.
[22] In yet another aspect, disclosed herein is a non-transitory computer
readable medium
having instructions stored thereon, where the instructions are executable by a
processor to cause
a computing system to carry out functions disclosed herein for providing a
recommendation for
repairing an asset.
[23] One of ordinary skill in the art will appreciate these as well as
numerous other aspects in
reading the following disclosure.
CA 03032946 2019-02-04
WO 2018/031481 PCT/US2017/045776
BRIEF DESCRIPTION OF THE DRAWINGS
[24] FIG. 1 depicts an example network configuration in which example
embodiments may be
implemented.
[25] FIG. 2 depicts a simplified block diagram of an example asset.
[26] FIG. 3 depicts a conceptual illustration of example abnormal-condition
indicators and
sensor criteria.
[27] FIG. 4 depicts a structural diagram of an example platform.
[28] FIG. 5 depicts an example flow diagram for analyzing a hierarchy of
conditions with
respect to received operating data in order to provide a repair recommendation
for a given asset.
[29] FIG. 6 depicts an example flow diagram of analyzing a condition of a
hierarchy that is
based on a predefined rule.
[30] FIG. 7 depicts a conceptual illustration of data utilized by a condition
of a hierarchy based
on a predefined rule.
[31] FIG. 8 depicts an example flow diagram of analyzing a condition of a
hierarchy that is
based on a predictive model.
[32] FIG. 9 depicts an example flow diagram of defining a predictive model
that may be used
to predict a likelihood that a repair is needed.
[33] FIG. 10 depicts an example flow diagram for applying a hierarchy of
conditions to
operating data in order to provide a repair recommendation for a given asset.
6
CA 03032946 2019-02-04
WO 2018/031481 PCT/US2017/045776
DETAILED DESCRIPTION
[30] The following disclosure makes reference to the accompanying figures and
several
exemplary scenarios. One of ordinary skill in the art will understand that
such references are for
the purpose of explanation only and are therefore not meant to be limiting.
Part or all of the
disclosed systems, devices, and methods may be rearranged, combined, added to,
and/or removed
in a variety of manners, each of which is contemplated herein.
I. EXAMPLE NETWORK CONFIGURATION
[31] Turning now to the figures, FIG. 1 depicts an example network
configuration 100 in which
example embodiments may be implemented. As shown, the network configuration
100 includes
an asset 102, an asset 104, a communication network 106, a remote computing
system 108 that
may take the form of an analytics platform, an output system 110, and a data
source 112.
[32] The communication network 106 may communicatively connect each of the
components
in the network configuration 100. For instance, the assets 102 and 104 may
communicate with
the analytics platform 108 via the communication network 106. In some cases,
the assets 102 and
104 may communicate with one or more intermediary systems, such as an asset
gateway or an
organization's existing platform (not pictured), that in turn communicates
with the analytics
platform 108. Likewise, the analytics platform 108 may communicate with the
output system 110
via the communication network 106. In some cases, the analytics platform 108
may communicate
with one or more intermediary systems, such as a host server (not pictured),
that in turn
communicates with the output system 110. Many other configurations are also
possible. In
example cases, the communication network 106 may facilitate secure
communications between
network components (e.g., via encryption or other security measures).
[33] In general, the assets 102 and 104 may take the form of any device
configured to perform
one or more operations (which may be defined based on the field) and may also
include equipment
configured to transmit data indicative of one or more operating conditions of
the given asset. In
some examples, an asset may include one or more subsystems configured to
perform one or more
respective operations. In practice, multiple subsystems may operate in
parallel or sequentially in
order for an asset to operate.
[34] Example assets may include transportation machines (e.g., locomotives,
aircraft,
passenger vehicles, semi-trailer trucks, ships, etc.), industrial machines
(e.g., mining equipment,
construction equipment, processing equipment, assembly equipment, etc.), and
unmanned aerial
vehicles, among other examples. Those of ordinary skill in the art will
appreciate that these are
but a few examples of assets and that numerous others are possible and
contemplated herein.
7
CA 03032946 2019-02-04
WO 2018/031481 PCT/US2017/045776
[35] In example implementations, the assets 102 and 104 may each be of the
same type (e.g., a
fleet of locomotives or aircrafts, a group of wind turbines, a pool of milling
machines, or a set of
magnetic resonance imagining (Mill) machines, among other examples) and
perhaps may be of
the same class (e.g., same equipment type, brand, and/or model). In other
examples, the assets
102 and 104 may differ by type, by brand, by model, etc. For example, assets
102 and 104 may
be different pieces of equipment at a job site (e.g., an excavation site) or a
production facility,
among numerous other examples. The assets are discussed in further detail
below with reference
to FIG. 2.
[36] As shown, the assets 102 and 104, and perhaps the data source 112, may
communicate
with the analytics platform 108 via the communication network 106. In general,
the
communication network 106 may include one or more computing systems and
network
infrastructure configured to facilitate transferring data between network
components. The
communication network 106 may be or may include one or more Wide-Area Networks
(WANs)
and/or Local-Area Networks (LANs), which may be wired and/or wireless and may
support secure
communication. In some examples, the communication network 106 may include one
or more
cellular networks and/or the Internet, among other networks. The communication
network 106
may operate according to one or more communication protocols, such as LTE,
CDMA, GSM,
LPWAN, WiFi, Bluetooth, Ethernet, HTTP/S, TCP, CoAP/DTLS and the like.
Although the
communication network 106 is shown as a single network, it should be
understood that the
communication network 106 may include multiple, distinct networks that are
themselves
communicatively linked. The communication network 106 could take other forms
as well.
[37] As noted above, the analytics platform 108 (sometimes referred to herein
as a "remote-
asset monitoring system") may be configured to receive data from the assets
102 and 104 and the
data source 112. Broadly speaking, the analytics platform 108 may include one
or more
computing systems, such as servers and databases, configured to receive,
process, analyze, and
output data. The analytics platform 108 may be configured according to a given
dataflow
technology, such as TPL Dataflow or NiFi, among other examples. The analytics
platform 108 is
discussed in further detail below with reference to FIG. 4.
[38] As shown, the analytics platform 108 may be configured to transmit data
to the assets 102
and 104 and/or to the output system 110. The particular data transmitted may
take various forms
and will be described in further detail below.
[39] In general, the output system 110 may take the form of a computing system
or device
configured to receive data and provide some form of output based on the
received data. The
output system 110 may take various forms. In one example, the output system
110 may be or
8
CA 03032946 2019-02-04
WO 2018/031481 PCT/US2017/045776
include a client station that is generally configured to configured to
communicate with other
computing systems and/or devices via the communication network 106, receive
user input,
process data, and provide a visual, audio, and/or tactile output to a user
(e.g., based on data
received via the communication network 106). Examples of client stations
include tablets,
smartphones, laptop computers, other mobile computing devices, desktop
computers, smart
televisions, and the like.
[40] Another example of the output system 110 may take the form of a work-
order system
configured to output a request for a mechanic or the like to repair an asset.
Yet another example
of the output system 110 may take the form of a parts-ordering system
configured to place an
order for a part of an asset and output a receipt thereof Numerous other
examples of output
systems are also possible.
[41] The data source 112 may be configured to communicate with the analytics
platform 108.
In general, the data source 112 may be or include one or more computing
systems configured to
collect, store, and/or provide to other systems, such as the analytics
platform 108, data that may
be relevant to the functions performed by the analytics platform 108. The data
source 112 may
be configured to generate and/or obtain data independently from the assets 102
and 104. As such,
the data provided by the data source 112 may be referred to herein as
"external data." The data
source 112 may be configured to provide current and/or historical data. In
practice, the analytics
platform 108 may receive data from the data source 112 by "subscribing" to a
service provided
by the data source. However, the analytics platform 108 may receive data from
the data source
112 in other manners as well. Examples of the data source 112 include asset-
management data
sources, environment data sources, and other data sources.
[42] In general, asset-management data sources provide data indicating events
or statuses of
entities (e.g., other assets) that may affect the operation or maintenance of
assets (e.g., when and
where an asset may operate or receive maintenance). Examples of asset-
management data sources
include asset-repair servers that provide information regarding repairs and
services that have been
performed and/or are scheduled to be performed on assets, repair-shop servers
that provide
information regarding repair shop capacity and the like, traffic-data servers
that provide
information regarding air, water, and/or ground traffic, asset-schedule
servers that provide
information regarding expected routes and/or locations of assets on particular
dates and/or at
particular times, defect detector systems (also known as "hotbox" detectors)
that provide
information regarding one or more operating conditions of an asset that passes
in proximity to the
defect detector system, and part-supplier servers that provide information
regarding parts that
particular suppliers have in stock and prices thereof, among other examples.
9
CA 03032946 2019-02-04
WO 2018/031481 PCT/US2017/045776
[43] In general, environment data sources provide data indicating some
characteristic of the
environment in which assets are operated. Examples of environment data sources
include
weather-data servers, global navigation satellite systems (GNSS) servers, map-
data servers, and
topography-data servers that provide information regarding natural and
artificial features of a
given area, among other examples.
[44] Examples of other data sources include power-grid servers that provide
information
regarding electricity consumption and external databases that store historical
operating data for
assets, among other examples. One of ordinary skill in the art will appreciate
that these are but a
few examples of data sources and that numerous others are possible.
[45] It should be understood that the network configuration 100 is one example
of a network in
which embodiments described herein may be implemented. Numerous other
arrangements are
possible and contemplated herein. For instance, other network configurations
may include
additional components not pictured and/or more or less of the pictured
components.
EXAMPLE ASSET
[46] Turning to FIG. 2, a simplified block diagram of an example asset 200 is
depicted. Either
or both of assets 102 and 104 from FIG. 1 may be configured like the asset
200. As shown, the
asset 200 may include one or more subsystems 202, one or more sensors 204, one
or more
actuators 205, a central processing unit 206, data storage 208, a network
interface 210, a user
interface 212, a position unit 214, and perhaps also a local analytics device
220, all of which may
be communicatively linked (either directly or indirectly) by a system bus,
network, or other
connection mechanism. One of ordinary skill in the art will appreciate that
the asset 200 may
include additional components not shown and/or more or less of the depicted
components.
[47] Broadly speaking, the asset 200 may include one or more electrical,
mechanical, and/or
electromechanical components configured to perform one or more operations. In
some cases, one
or more components may be grouped into a given subsystem 202.
[48] Generally, a subsystem 202 may include a group of related components that
are part of the
asset 200. A single subsystem 202 may independently perform one or more
operations or the
single subsystem 202 may operate along with one or more other subsystems to
perform one or
more operations. Typically, different types of assets, and even different
classes of the same type
of assets, may include different subsystems.
[49] For instance, in the context of transportation assets, examples of
subsystems 202 may
include engines, transmissions, drivetrains, fuel systems, battery systems,
exhaust systems,
braking systems, electrical systems, signal processing systems, generators,
gear boxes, rotors, and
hydraulic systems, among numerous other subsystems.
CA 03032946 2019-02-04
WO 2018/031481 PCT/US2017/045776
[50] As suggested above, the asset 200 may be outfitted with various
sensors 204 that are
configured to monitor operating conditions of the asset 200 and various
actuators 205 that are
configured to interact with the asset 200 or a component thereof and monitor
operating conditions
of the asset 200. In some cases, some of the sensors 204 and/or actuators 205
may be grouped
based on a particular subsystem 202. In this way, the group of sensors 204
and/or actuators 205
may be configured to monitor operating conditions of the particular subsystem
202, and the
actuators from that group may be configured to interact with the particular
subsystem 202 in some
way that may alter the subsystem's behavior based on those operating
conditions.
[51] In general, a sensor 204 may be configured to detect a physical property,
which may be
indicative of one or more operating conditions of the asset 200, and provide
an indication, such as
an electrical signal, of the detected physical property. In operation, the
sensors 204 may be
configured to obtain measurements continuously, periodically (e.g., based on a
sampling
frequency), and/or in response to some triggering event. In some examples, the
sensors 204 may
be preconfigured with operating parameters for performing measurements and/or
may perform
measurements in accordance with operating parameters provided by the central
processing unit
206 (e.g., sampling signals that instruct the sensors 204 to obtain
measurements). In examples,
different sensors 204 may have different operating parameters (e.g., some
sensors may sample
based on a first frequency, while other sensors sample based on a second,
different frequency). In
any event, the sensors 204 may be configured to transmit electrical signals
indicative of a
measured physical property to the central processing unit 206. The sensors 204
may continuously
or periodically provide such signals to the central processing unit 206.
[52] For instance, sensors 204 may be configured to measure physical
properties such as the
location and/or movement of the asset 200, in which case the sensors may take
the form of GNSS
sensors, dead-reckoning-based sensors, accelerometers, gyroscopes, pedometers,
magnetometers,
or the like. In example embodiments, one or more such sensors may be
integrated with or located
separate from the position unit 214, discussed below.
[53] Additionally, various sensors 204 may be configured to measure other
operating
conditions of the asset 200, examples of which may include temperatures,
pressures, speeds,
acceleration or deceleration rates, friction, power usages, fuel usages, fluid
levels, runtimes,
voltages and currents, magnetic fields, electric fields, presence or absence
of objects, positions of
components, and power generation, among other examples. One of ordinary skill
in the art will
appreciate that these are but a few example operating conditions that sensors
may be configured
to measure. Additional or fewer sensors may be used depending on the
industrial application or
specific asset.
11
CA 03032946 2019-02-04
WO 2018/031481 PCT/US2017/045776
[54] As suggested above, an actuator 205 may be configured similar in some
respects to a
sensor 204. Specifically, an actuator 205 may be configured to detect a
physical property
indicative of an operating condition of the asset 200 and provide an
indication thereof in a manner
similar to the sensor 204.
[55] Moreover, an actuator 205 may be configured to interact with the asset
200, one or more
subsystems 202, and/or some component thereof. As such, an actuator 205 may
include a motor
or the like that is configured to perform a mechanical operation (e.g., move)
or otherwise control
a component, subsystem, or system. In a particular example, an actuator may be
configured to
measure a fuel flow and alter the fuel flow (e.g., restrict the fuel flow), or
an actuator may be
configured to measure a hydraulic pressure and alter the hydraulic pressure
(e.g., increase or
decrease the hydraulic pressure). Numerous other example interactions of an
actuator are also
possible and contemplated herein.
[56] Generally, the central processing unit 206 may include one or more
processors and/or
controllers, which may take the form of a general- or special-purpose
processor or controller. In
particular, in example implementations, the central processing unit 206 may be
or include
microprocessors, microcontrollers, application specific integrated circuits,
digital signal
processors, and the like. In turn, the data storage 208 may be or include one
or more non-transitory
computer-readable storage media, such as optical, magnetic, organic, or flash
memory, among
other examples.
[57] The central processing unit 206 may be configured to store, access, and
execute
computer-readable program instructions stored in the data storage 208 to
perform the operations
of an asset described herein. For instance, as suggested above, the central
processing unit 206
may be configured to receive respective sensor signals from the sensors 204
and/or actuators 205.
The central processing unit 206 may be configured to store sensor and/or
actuator data in and later
access it from the data storage 208.
[58] The central processing unit 206 may also be configured to determine
whether received
sensor and/or actuator signals trigger any abnormal-condition indicators, such
as fault codes. For
instance, the central processing unit 206 may be configured to store in the
data storage 208
abnormal-condition rules, each of which include a given abnormal-condition
indicator
representing a particular abnormal condition and respective triggering
criteria that trigger the
abnormal-condition indicator. That is, each abnormal-condition indicator
corresponds with one
or more sensor and/or actuator measurement values that must be satisfied
before the abnormal-
condition indicator is triggered. In practice, the asset 200 may be pre-
programmed with the
12
CA 03032946 2019-02-04
WO 2018/031481 PCT/US2017/045776
abnormal-condition rules and/or may receive new abnormal-condition rules or
updates to existing
rules from a computing system, such as the analytics platform 108.
[59] In any event, the central processing unit 206 may be configured to
determine whether
received sensor and/or actuator signals trigger any abnormal-condition
indicators. That is, the
central processing unit 206 may determine whether received sensor and/or
actuator signals satisfy
any triggering criteria. When such a determination is affirmative, the central
processing unit 206
may generate abnormal-condition data and then may also cause the asset's
network interface 210
to transmit the abnormal-condition data to the analytics platform 108 and/or
cause the asset's user
interface 212 to output an indication of the abnormal condition, such as a
visual and/or audible
alert. Additionally, the central processing unit 206 may log the occurrence of
the abnormal-
condition indicator being triggered in the data storage 208, perhaps with a
timestamp.
[60] FIG. 3 depicts a conceptual illustration of example abnormal-condition
indicators and
respective triggering criteria for an asset. In particular, FIG. 3 depicts a
conceptual illustration of
example fault codes. As shown, table 300 includes columns 302, 304, and 306
that correspond to
Sensor A, Actuator B, and Sensor C, respectively, and rows 308, 310, and 312
that correspond to
Fault Codes 1, 2, and 3, respectively. Entries 314 then specify sensor
criteria (e.g., sensor value
thresholds) that correspond to the given fault codes.
[61] For example, Fault Code 1 will be triggered when Sensor A detects a
rotational
measurement greater than 135 revolutions per minute (RPM) and Sensor C detects
a temperature
measurement greater than 65 Celsius (C), Fault Code 2 will be triggered when
Actuator B detects
a voltage measurement greater than 1000 Volts (V) and Sensor C detects a
temperature
measurement less than 55 C, and Fault Code 3 will be triggered when Sensor A
detects a rotational
measurement greater than 100 RPM, Actuator B detects a voltage measurement
greater than 750
V, and Sensor C detects a temperature measurement greater than 60 C. One of
ordinary skill in
the art will appreciate that FIG. 3 is provided for purposes of example and
explanation only and
that numerous other fault codes and/or triggering criteria are possible and
contemplated herein.
[62] Referring back to FIG. 2, the central processing unit 206 may be
configured to carry out
various additional functions for managing and/or controlling operations of the
asset 200 as well.
For example, the central processing unit 206 may be configured to provide
instruction signals to
the subsystems 202 and/or the actuators 205 that cause the subsystems 202
and/or the actuators
205 to perform some operation, such as modifying a throttle position.
Additionally, the central
processing unit 206 may be configured to modify the rate at which it processes
data from the
sensors 204 and/or the actuators 205, or the central processing unit 206 may
be configured to
provide instruction signals to the sensors 204 and/or actuators 205 that cause
the sensors 204
13
CA 03032946 2019-02-04
WO 2018/031481 PCT/US2017/045776
and/or actuators 205 to, for example, modify a sampling rate. Moreover, the
central processing
unit 206 may be configured to receive signals from the subsystems 202, the
sensors 204, the
actuators 205, the network interfaces 210, the user interfaces 212, and/or the
position unit 214 and
based on such signals, cause an operation to occur. Further still, the central
processing unit 206
may be configured to receive signals from a computing device, such as a
diagnostic device, that
cause the central processing unit 206 to execute one or more diagnostic tools
in accordance with
diagnostic rules stored in the data storage 208. Other functionalities of the
central processing unit
206 are discussed below.
[63] The network interface 210 may be configured to provide for communication
between the
asset 200 and various network components connected to the communication
network 106. For
example, the network interface 210 may be configured to facilitate wireless
communications to
and from the communication network 106 and may thus take the form of an
antenna structure and
associated equipment for transmitting and receiving various over-the-air
signals. Other examples
are possible as well. In practice, the network interface 210 may be configured
according to a
communication protocol, such as but not limited to any of those described
above.
[64] The user interface 212 may be configured to facilitate user
interaction with the asset 200
and may also be configured to facilitate causing the asset 200 to perform an
operation in response
to user interaction. Examples of user interfaces 212 include touch-sensitive
interfaces, mechanical
interfaces (e.g., levers, buttons, wheels, dials, keyboards, etc.), and other
input interfaces (e.g.,
microphones), among other examples. In some cases, the user interface 212 may
include or
provide connectivity to output components, such as display screens, speakers,
headphone jacks,
and the like.
[65] The position unit 214 may be generally configured to facilitate
performing functions
related to geo-spatial location/position and/or navigation. More specifically,
the position unit 214
may be configured to facilitate determining the location/position of the asset
200 and/or tracking
the asset 200's movements via one or more positioning technologies, such as a
GNSS technology
(e.g., GPS, GLONASS, Galileo, BeiDou, or the like), triangulation technology,
and the like. As
such, the position unit 214 may include one or more sensors and/or receivers
that are configured
according to one or more particular positioning technologies.
[66] In example embodiments, the position unit 214 may allow the asset 200 to
provide to other
systems and/or devices (e.g., the analytics platform 108) position data that
indicates the position
of the asset 200, which may take the form of GPS coordinates, among other
forms. In some
implementations, the asset 200 may provide to other systems position data
continuously,
periodically, based on triggers, or in some other manner. Moreover, the asset
200 may provide
14
CA 03032946 2019-02-04
WO 2018/031481 PCT/US2017/045776
position data independent of or along with other asset-related data (e.g.,
along with operating
data).
[67] The local analytics device 220 may generally be configured to receive and
analyze data
related to the asset 200 and based on such analysis, may cause one or more
operations to occur at
the asset 200. For instance, the local analytics device 220 may receive
operating data for the asset
200 (e.g., data generated by the sensors 204 and/or actuators 205) and based
on such data, may
provide instructions to the central processing unit 206, the sensors 204,
and/or the actuators 205
that cause the asset 200 to perform an operation. In another example, the
local analytics device
220 may receive location data from the position unit 214 and based on such
data, may modify
how it handles predictive models and/or workflows for the asset 200. Other
example analyses
and corresponding operations are also possible.
[68] To facilitate some of these operations, the local analytics device 220
may include one or
more asset interfaces that are configured to couple the local analytics device
220 to one or more
of the asset's on-board systems. For instance, as shown in Figure 2, the local
analytics device 220
may have an interface to the asset's central processing unit 206, which may
enable the local
analytics device 220 to receive data from the central processing unit 206
(e.g., operating data that
is generated by sensors 204 and/or actuators 205 and sent to the central
processing unit 206, or
position data generated by the position unit 214) and then provide
instructions to the central
processing unit 206. In this way, the local analytics device 220 may
indirectly interface with and
receive data from other on-board systems of the asset 200 (e.g., the sensors
204 and/or actuators
205) via the central processing unit 206. Additionally or alternatively, as
shown in FIG. 2, the
local analytics device 220 could have an interface to one or more sensors 204
and/or actuators
205, which may enable the local analytics device 220 to communicate directly
with the sensors
204 and/or actuators 205. The local analytics device 220 may interface with
the on-board systems
of the asset 200 in other manners as well, including the possibility that the
interfaces illustrated in
FIG. 2 are facilitated by one or more intermediary systems that are not shown.
[69] In practice, the local analytics device 220 may enable the asset 200 to
locally perform
advanced analytics and associated operations, such as executing a predictive
model and
corresponding workflow, that may otherwise not be able to be performed with
the other on-asset
components. As such, the local analytics device 220 may help provide
additional processing
power and/or intelligence to the asset 200.
[70] It should be understood that the local analytics device 220 may also be
configured to cause
the asset 200 to perform operations that are not related to a predictive
model. For example, the
local analytics device 220 may receive data from a remote source, such as the
analytics platform
CA 03032946 2019-02-04
WO 2018/031481 PCT/US2017/045776
108 or the output system 110, and based on the received data cause the asset
200 to perform one
or more operations. One particular example may involve the local analytics
device 220 receiving
a firmware update for the asset 200 from a remote source and then causing the
asset 200 to update
its firmware. Another particular example may involve the local analytics
device 220 receiving a
diagnosis instruction from a remote source and then causing the asset 200 to
execute a local
diagnostic tool in accordance with the received instruction. Numerous other
examples are also
possible.
[71] As shown, in addition to the one or more asset interfaces discussed
above, the local
analytics device 220 may also include a processing unit 222, a data storage
224, and a network
interface 226, all of which may be communicatively linked by a system bus,
network, or other
connection mechanism. The processing unit 222 may include any of the
components discussed
above with respect to the central processing unit 206. In turn, the data
storage 224 may be or
include one or more non-transitory computer-readable storage media, which may
take any of the
forms of computer-readable storage media discussed above.
[72] The processing unit 222 may be configured to store, access, and execute
computer-readable program instructions stored in the data storage 224 to
perform the operations
of a local analytics device described herein. For instance, the processing
unit 222 may be
configured to receive respective sensor and/or actuator signals generated by
the sensors 204 and/or
actuators 205 and may execute a predictive model and corresponding workflow
based on such
signals. Other functions are described below.
[73] The network interface 226 may be the same or similar to the network
interfaces described
above. In practice, the network interface 226 may facilitate communication
between the local
analytics device 220 and the analytics platform 108.
[74] In some example implementations, the local analytics device 220 may
include and/or
communicate with a user interface that may be similar to the user interface
212. In practice, the
user interface may be located remote from the local analytics device 220 (and
the asset 200).
Other examples are also possible.
[75] While FIG. 2 shows the local analytics device 220 physically and
communicatively
coupled to its associated asset (e.g., the asset 200) via one or more asset
interfaces, it should also
be understood that this might not always be the case. For example, in some
implementations, the
local analytics device 220 may not be physically coupled to its associated
asset and instead may
be located remote from the asset 200. In an example of such an implementation,
the local analytics
device 220 may be wirelessly, communicatively coupled to the asset 200. Other
arrangements
and configurations are also possible.
16
CA 03032946 2019-02-04
WO 2018/031481 PCT/US2017/045776
[76] For more detail regarding the configuration and operation of a local
analytics device,
please refer to U.S. Patent Application No. 14/963,207, which is incorporated
by reference herein
in its entirety.
[77] One of ordinary skill in the art will appreciate that the asset 200 shown
in FIG. 2 is but
one example of a simplified representation of an asset and that numerous
others are also possible.
For instance, other assets may include additional components not pictured
and/or more or less of
the pictured components. Moreover, a given asset may include multiple,
individual assets that are
operated in concert to perform operations of the given asset. Other examples
are also possible.
III. EXAMPLE PLATFORM
[78] Referring now to FIG. 4, a simplified block diagram of an example
analytics platform 400
is depicted. As suggested above, the analytics platform 400 may include one or
more computing
systems communicatively linked and arranged to carry out various operations
described herein.
For instance, as shown, the analytics platform 400 may include a data intake
system 402, a data
analysis system 404, and one or more databases 406. These system components
may be
communicatively coupled via one or more wireless and/or wired connections,
which may be
configured to facilitate secure communications. Further, two or more of these
components may
be integrated together in whole or in part.
[79] The data intake system 402 may generally function to receive data and
then ingest at least
a portion of the received data for output to the data analysis system 404. As
such, the data intake
system 402 may include one or more network interfaces configured to receive
data from various
network components of the network configuration 100, such as the assets 102
and 104, the output
system 110, the data source 112, and/or one or more intermediary systems.
Specifically, the data
intake system 402 may be configured to receive analog signals, data streams,
and/or network
packets, among other examples. As such, the network interfaces may include one
or more wired
network interfaces, such as a port or the like, and/or wireless network
interfaces, similar to those
described above. In some examples, the data intake system 402 may be or
include components
configured according to a given dataflow technology, such as a NiFi receiver
or the like.
[80] The data intake system 402 may include one or more processing components
configured
to perform one or more operations. Example operations may include compression
and/or
decompression, encryption and/or de-encryption, analog-to-digital and/or
digital-to-analog
conversion, amplification, formatting, and packaging, among other operations.
Moreover, the
data intake system 402 may be configured to filter, parse, sort, organize,
route, and/or store data
in accordance with one or more intake parameters. For example, the data intake
system 402 may
operate in accordance with an intake parameter that defines the particular set
of data variables to
17
CA 03032946 2019-02-04
WO 2018/031481 PCT/US2017/045776
intake from an asset (e.g., the particular set of asset sensor/actuator
readings to be ingested). As
another example, the data intake system 402 may operate in accordance with an
intake parameter
that defines a rate at which to intake data from an asset (e.g., a sampling
frequency). As yet
another example, the data intake system 402 may operate in accordance with an
intake parameter
that defines a storage location for data ingested from an asset. The data
intake system 402 may
operate in accordance with other intake parameters as well.
[81] In general, the data received by the data intake system 402 may take
various forms. For
example, the payload of the data may include operating data such as a single
sensor or actuator
measurement, multiple sensor and/or actuator measurements, abnormal-condition
data, and/or
other data regarding the operation of an asset. Other examples are also
possible.
[82] Moreover, the received data may include other data corresponding to the
operating data,
such as a source identifier, a timestamp (e.g., a date and/or time at which
the information was
obtained), and/or location data. For instance, a unique identifier (e.g., a
computer generated
alphabetic, numeric, alphanumeric, or the like identifier) may be assigned to
each asset, and
perhaps to each sensor and actuator. Such identifiers may be operable to
identify the asset, sensor,
or actuator from which data originates. Further, the location data may
represent the location of
the asset (e.g., in the form of GPS coordinates or the like), and in certain
cases, the location data
may correspond to the location of the asset when certain information was
obtained, such as
operating data. In practice, the other data corresponding to the operating
data may take the form
of signal signatures or metadata, among other examples.
[83] The data analysis system 404 may generally function to receive (e.g.,
from the data intake
system 402) and analyze data and based on such analysis, cause one or more
operations to occur.
As such, the data analysis system 404 may include one or more network
interfaces 408, a
processing unit 410, and data storage 412, all of which may be communicatively
linked by a
system bus, network, or other connection mechanism. In some cases, the data
analysis system
404 may be configured to store and/or access one or more application program
interfaces (APIs)
that facilitate carrying out some of the functionality disclosed herein.
[84] The network interfaces 408 may be the same or similar to any network
interface described
above. In practice, the network interfaces 408 may facilitate communication
(e.g., with some
level of security) between the data analysis system 404 and various other
entities, such as the data
intake system 402, the databases 406, the assets 102, the output system 110,
etc.
[85] The processing unit 410 may include one or more processors, which may
take any of the
processor forms described above. In turn, the data storage 412 may be or
include one or more
non-transitory computer-readable storage media, which may take any of the
forms of
18
CA 03032946 2019-02-04
WO 2018/031481 PCT/US2017/045776
computer-readable storage media discussed above. The processing unit 410 may
be configured
to store, access, and execute computer-readable program instructions stored in
the data storage
412 to perform the operations of an analytics platform described herein.
[86] In general, the processing unit 410 may be configured to perform
analytics on data
received from the data intake system 402. To that end, the processing unit 410
may be configured
to execute one or more modules, which may each take the form of one or more
sets of program
instructions that are stored in the data storage 412. The modules may be
configured to facilitate
causing an outcome to occur based on the execution of the respective program
instructions. An
example outcome from a given module may include outputting data into another
module, updating
the program instructions of the given module and/or of another module, and
outputting data to a
network interface 408 for transmission to an asset and/or the output system
110, among other
examples.
[87] The databases 406 may generally function to receive (e.g., from the data
analysis system
404) and store data. As such, each database 406 may include one or more non-
transitory
computer-readable storage media, such as any of the examples provided above.
In practice, the
databases 406 may be separate from or integrated with the data storage 412.
[88] The databases 406 may be configured to store numerous types of data, some
of which is
discussed below. In practice, some of the data stored in the databases 406 may
include a
timestamp indicating a date and time at which the data was generated or added
to the database.
Additionally or alternatively, some of the data stored in the databases 406
may include repair data
for various assets. The data stored in databases 406 may take various other
forms as well.
[89] Moreover, data may be stored in a number of manners in the databases
406. For instance,
data may be stored in time sequence, in a tabular manner, and/or organized
based on data source
type (e.g., based on asset, asset type, sensor, sensor type, actuator,
actuator type, or asset position)
or abnormal-condition indicator, among other examples. The databases may also
have different
storage characteristics, such as different levels of durability, accessibility
and/or reliability.
Representative examples of database types may include time-series databases,
document
databases, relational databases, and graph databases, among others.
[90] It should be understood that the analytics platform 400 may take other
forms and include
other systems and/or components as well. For example, the analytics platform
400 could include
a system that determines and/or tracks asset location. Other examples are
possible as well.
IV. EXAMPLE OPERATIONS
[91] The operations of the example network configuration 100 depicted in FIG.
1 will now be
discussed in further detail below. To help describe some of these operations,
flow diagrams may
19
CA 03032946 2019-02-04
WO 2018/031481 PCT/US2017/045776
be referenced to describe combinations of operations that may be performed. In
some cases, each
block may represent a module or portion of program code that includes
instructions that are
executable by a processor to implement specific logical functions or steps in
a process. The
program code may be stored on any type of computer-readable medium, such as
non-transitory
computer-readable media. In other cases, each block may represent circuitry
that is wired to
perform specific logical functions or steps in a process. Moreover, the blocks
shown in the flow
diagrams may be rearranged into different orders, combined into fewer blocks,
separated into
additional blocks, and/or removed based upon the particular embodiment.
[92] The following description may reference examples where a single data
source, such as the
asset 200, provides data to the analytics platform 400 that then performs one
or more functions.
It should be understood that this is done merely for sake of clarity and
explanation and is not
meant to be limiting. In practice, the analytics platform 400 generally
receives data from multiple
sources, perhaps simultaneously, and performs operations based on such
aggregate received data.
A. COLLECTION OF OPERATING DATA
[93] As mentioned above, each of the representative assets 102 and 104 may
take various forms
and may be configured to perform a number of operations. In a non-limiting
example, the asset
102 may take the form of a locomotive that is operable to transfer cargo
across the United States.
While in transit, the sensors and/or actuators of the asset 102 may obtain
data that reflects one or
more operating conditions of the asset 102. The sensors and/or actuators may
transmit the data to
a processing unit of the asset 102.
[94] The processing unit may be configured to receive the data from the
sensors and/or
actuators. In practice, the processing unit may receive sensor data from
multiple sensors and/or
actuator data from multiple actuators simultaneously or sequentially. As
discussed above, while
receiving this data, the processing unit may also be configured to determine
whether the data
satisfies triggering criteria that trigger any abnormal-condition indicators,
such as fault codes. In
the event the processing unit determines that one or more abnormal-condition
indicators are
triggered, the processing unit may be configured to perform one or more local
operations, such as
outputting an indication of the triggered indicator via a user interface.
[95] The asset 102 may then transmit operating data to the analytics platform
108 via a network
interface of the asset 102 and the communication network 106. In operation,
the asset 102 may
transmit operating data to the analytics platform 108 continuously,
periodically, and/or in response
to triggering events (e.g., abnormal conditions). Specifically, the asset 102
may transmit operating
data periodically based on a particular frequency (e.g., daily, hourly, every
fifteen minutes, once
per minute, once per second, etc.), or the asset 102 may be configured to
transmit a continuous,
CA 03032946 2019-02-04
WO 2018/031481 PCT/US2017/045776
real-time feed of operating data. Additionally or alternatively, the asset 102
may be configured
to transmit operating data based on certain triggers, such as when sensor
and/or actuator
measurements satisfy triggering criteria for any abnormal-condition
indicators. The asset 102
may transmit operating data in other manners as well.
[96] In practice, operating data for the asset 102 may include sensor data,
actuator data,
abnormal-condition data, and/or other asset event data (e.g., data indicating
asset shutdowns,
restarts, etc.). In some implementations, the asset 102 may be configured to
provide the operating
data in a single data stream, while in other implementations the asset 102 may
be configured to
provide the operating data in multiple, distinct data streams. For example,
the asset 102 may
provide to the analytics system 108 a first data stream of sensor and/or
actuator data and a second
data stream of abnormal-condition data. As another example, the asset 102 may
provide to the
analytics system 108 a separate data stream for each respective sensor and/or
actuator on the asset
102. Other possibilities also exist.
[97] Sensor and actuator data may take various forms. For example, at times,
sensor data (or
actuator data) may include measurements obtained by each of the sensors (or
actuators) of the
asset 102. While at other times, sensor data (or actuator data) may include
measurements obtained
by a subset of the sensors (or actuators) of the asset 102.
[98] Specifically, the sensor and/or actuator data may include measurements
obtained by the
sensors and/or actuators associated with a given triggered abnormal-condition
indicator. For
example, if a triggered fault code is Fault Code 1 from FIG. 3, then sensor
data may include raw
measurements obtained by Sensors A and C. Additionally or alternatively, the
data may include
measurements obtained by one or more sensors or actuators not directly
associated with the
triggered fault code. Continuing off the last example, the data may
additionally include
measurements obtained by Actuator B and/or other sensors or actuators. In some
examples, the
asset 102 may include particular sensor data in the operating data based on a
fault-code rule or
instruction provided by the analytics system 108, which may have, for example,
determined that
there is a correlation between that which Actuator B is measuring and that
which caused the Fault
Code 1 to be triggered in the first place. Other examples are also possible.
[99] Further still, the data may include one or more sensor and/or actuator
measurements from
each sensor and/or actuator of interest based on a particular time of
interest, which may be selected
based on a number of factors. In some examples, the particular time of
interest may be based on
a sampling rate. In other examples, the particular time of interest may be
based on the time at
which an abnormal-condition indicator is triggered.
21
CA 03032946 2019-02-04
WO 2018/031481 PCT/US2017/045776
[100] In particular, based on the time at which an abnormal-condition
indicator is triggered, the
data may include one or more respective sensor and/or actuator measurements
from each sensor
and/or actuator of interest (e.g., sensors and/or actuators directly and
indirectly associated with
the triggered indicator). The one or more measurements may be based on a
particular number of
measurements or particular duration of time around the time of the triggered
abnormal-condition
indicator.
[101] For example, if a triggered fault code is Fault Code 2 from FIG. 3, the
sensors and actuators
of interest might include Actuator B and Sensor C. The one or more
measurements may include
the most recent respective measurements obtained by Actuator B and Sensor C
prior to the
triggering of the fault code (e.g., triggering measurements) or a respective
set of measurements
before, after, or about the triggering measurements. For example, a set of
five measurements may
include the five measurements before or after the triggering measurement
(e.g., excluding the
triggering measurement), the four measurements before or after the triggering
measurement and
the triggering measurement, or the two measurements before and the two after
as well as the
triggering measurement, among other possibilities.
[102] Similar to sensor and actuator data, the abnormal-condition data may
take various forms.
In general, the abnormal-condition data may include or take the form of an
indicator that is
operable to uniquely identify a particular abnormal condition that occurred at
the asset 102 from
all other abnormal conditions that may occur at the asset 102. The abnormal-
condition indicator
may take the form of an alphabetic, numeric, or alphanumeric identifier, among
other examples.
Moreover, the abnormal-condition indicator may take the form of a string of
words that is
descriptive of the abnormal condition, such as "Overheated Engine" or "Out of
Fuel", among
other examples.
[103] The analytics platform 108, and in particular, the data intake system of
the analytics
platform 108, may be configured to receive operating data from one or more
assets and/or data
sources. The data intake system may be configured to intake at least a portion
of the received
data, perform one or more operations to the received data, and then relay the
data to the data
analysis system of the analytics platform 108. In turn, the data analysis
system may analyze the
received data and based on such analysis, perform one or more operations.
B. GENERATING RECOMMENDATIONS FOR REPAIRING AN AS SET
[104] As one example, the analytics platform 108 may be configured to generate
recommendations for repairing a given asset. In general, generating a
recommendation for
repairing a given asset may involve the analytics platform 108 maintaining and
applying a
hierarchy of conditions to operating data received from a given asset, such as
asset 102.
22
CA 03032946 2019-02-04
WO 2018/031481 PCT/US2017/045776
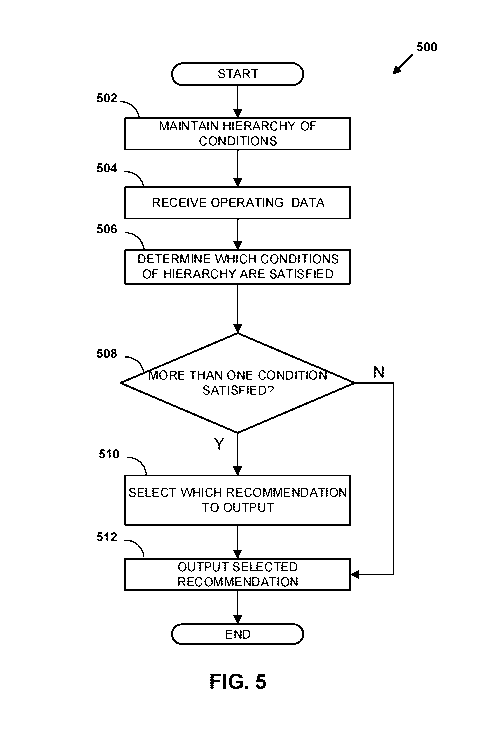
[105] FIG. 5 is a flow diagram 500 that generally depicts one possible example
of analyzing a
hierarchy of conditions with respect to a given asset's operating data in
order to provide a repair
recommendation for the given asset. For the purposes of illustration, the
example process of
analyzing a hierarchy of conditions with respect to a given asset's operating
data is described as
being carried out by the analytics platform 108, but this example process may
be carried out by
other devices and/or systems as well. For example, if an asset includes a
local analytics device
such as the one described above, then such an asset may also be configured to
carry out this process
either alone or in combination with the analytics platform 108. One of
ordinary skill in the art
will also appreciate that flow diagram 500 is provided for sake of clarity and
explanation and that
numerous other combinations of operations may be utilized to determine a
recommendation for
repairing a given asset.
[106] As shown in FIG. 5, at block 502, the analytics platform 108 may be
maintaining a
hierarchy of conditions that each correspond to a recommendation for repairing
a given aspect of
an asset (e.g., a given subsystem) based on operating data. At block 504, the
analytics platform
108 may receive operating data (e.g., sensor/actuator data, abnormal-condition
data, etc.) for a
given asset that relates to the given asset of the given asset. At block 506,
the analytics platform
108 may analyze the hierarchy's conditions to determine which one or more
conditions (if any)
of the hierarchy are satisfied by the operating data for the given asset. In
turn, at step 508, the
analytics platform 108 may check whether more than one condition of the
hierarchy has been
satisfied, and thus whether more than repair commendation has been identified.
If so, the analytics
platform 108 may proceed to block 510 and select the identified recommendation
having the
highest level of precision (e.g., most granular recommendation).
Alternatively, if only one
condition is satisfied, the analytics platform 108 may simply select the one
recommendation
corresponding to the one condition. Lastly, the analytics platform 108 may
proceed to block 512
and cause the selected recommendation having the to be output by the computing
device. These
functions will now be described in further detail below.
[107] Starting at block 502, the analytics platform 108 may be maintaining a
hierarchy of
conditions that correspond to recommendations for repairing a given aspect of
an asset (e.g.,
subsystem) based on operating data. In practice, a given hierarchy may
comprise conditions
corresponding to at least two levels of recommendations having differing
levels of precision for
repairing the same general asset-related issue (i.e., a failure or asset
malfunction).
[108] For instance, in accordance with one example embodiment, the hierarchy
may include at
least (1) a first condition that corresponds to a first repair recommendation
having a first level of
precision, and (2) a second condition that corresponds to a second repair
recommendation having
23
CA 03032946 2019-02-04
WO 2018/031481 PCT/US2017/045776
a second level of precision, where the first and second levels of precision
differ (e.g., the first level
of precision may be higher than the second level of precision, in which case
the first
recommendation may be more granular than the second recommendation). Moreover,
the
hierarchy may include one or more other conditions, each of which may
correspond to a repair
recommendation having the first level of precision, the second level of
precision, or some other
level of precision. In this respect, a given precision level of the hierarchy
could possibly include
more than condition and thus more than one repair option. (It should also be
understood that,
while the terms "first" and "second" are used to describe the hierarchy's
levels here, this does not
necessarily mean that these levels exist consecutively within the hierarchy,
and it is possible one
or more intermediate levels may exist between the first and second levels).
[109] In example implementations, each of the conditions of the hierarchy may
be based on a
predefined rule, predictive model, or a combination thereof For instance, in
one embodiment, the
first condition may be based on a predefined rule and the second condition may
be based on a
predictive model (or vice versa). Other embodiments are possible as well
[110] The differing levels of precision between the levels of repair
recommendations in the
hierarchy may take various forms. As one illustrative example, a repair
recommendation having
a higher level of precision could be to repair a specific component of a
subsystem at the given
asset (e.g., a specific mechanical part such as a screw, a cylinder bore,
etc.), whereas a repair
recommendation having a lower level of precision could be to repair the
subsystem more generally
(e.g., an engine). There could also be more than two precision levels in the
hierarchy, where the
recommendation(s) at each intermediate precision level may be less precise
than the higher
precision level and more precise than lower level. (For the purposes of this
description, a higher
level of the precision is generally intended to refer to a more
precise/granular recommendation
whereas a lower level of the precision is generally intended to refer to a
less precise/granular
recommendation. However, other conventions are also possible.)
11111 Further, as noted above, a given precision level of the hierarchy could
possible include a
set of different conditions/recommendations. For example, a given level of the
hierarchy may
include a set of different conditions corresponding to different respective
recommendations
having the same level of precision, such as recommendations that relate to
specific mechanical
parts of a given asset (e.g., cylinder bore, oil pan, air intake filter, etc.)
or to different subsystems
of the given asset (i.e., engine block, engine oil system, air intake system).
The aforementioned
examples are not meant to be limiting and it is contemplated herein that the
difference in precision
between recommendations corresponding to the various levels of the hierarchy
may vary by any
degree, and such recommendations may encompass any portion of a given asset or
group of assets.
24
CA 03032946 2019-02-04
WO 2018/031481 PCT/US2017/045776
[112] The aforementioned predefined rule(s) that may serve as the basis for at
least one condition
of the hierarchy may take a number of forms. In one implementation, for
instance, a given
predefined rule may be a rule that is defined based on a set of criteria for
one or both of abnormal-
condition data (e.g., fault codes) and sensor data and, when satisfied,
triggers a recommendation
for repairing an asset. That is, the given predefined rule may be configured
to output the repair
recommendations based on the presence of one or more abnormal-condition
indicators and/or one
or more sensor measurement conditions. In another implementation, a predefined
rule may be
comprised of a plurality of predefined rules, each defined based on a
respective set of criteria for
one or both of abnormal-condition data and sensor data. Other examples of
predefined rules may
also be utilized.
[113] In examples, predefined rules may be defined by a user (e.g., an expert
in the field) and/or
or by a computing device, among other possibilities. Further, the predefined
rules may be stored
in the analytics platform's data storage (e.g., database(s) 406 and/or data
storage 412) and/or at
some other storage location.
[114] Furthermore, the predictive model(s) that may form the basis of at least
one condition of
the hierarchy may in general be configured to predict a likelihood that a
given repair is needed
and/or will be needed in the future based on operating data for an asset. The
analytics platform
108 may maintain data defining the predictive model(s) in data storage. The
process of defining
the predictive model(s) that may form the basis of one or more conditions of
the hierarchy will be
detailed further below in reference to FIG. 9.
[115] At block 504, while maintaining the hierarchy, the analytics platform
108 may receive
data that reflects the current operating conditions of a given asset, such as
representative asset
102. In particular, the operating data received by analytics platform 108 may
include sensor data,
actuator data, and/or abnormal-conditions data, as examples.
[116] At block 506, the analytics platform 108 may analyze the hierarchy's
conditions to
determine which conditions (if any) are satisfied by the operating data for
the given asset.
According to one implementation, the analytics platform 108 may analyze the
conditions of the
hierarchy in parallel to determine which conditions are satisfied by the
operating data for the given
asset. In another implementation, the analytics platform 108 may analyze the
conditions of the
hierarchy sequentially, either on a condition-by-condition basis or in batches
(e.g., any condition
corresponding a recommendation having a first level of precision first, then
any condition
corresponding a recommendation having a second level of precision next, etc.).
In yet another
implementation, the analytics platform 108 may make a preliminary selection of
which conditions
CA 03032946 2019-02-04
WO 2018/031481 PCT/US2017/045776
to evaluate based on the nature of the operating data. The analytics platform
108 may analyze the
conditions of the hierarchy in other manners as well.
[117] The function of determining whether a given condition of the hierarchy
is satisfied by the
operating data for the given asset may take also various forms. In line with
the discussion above,
at least one condition of the hierarchy may be based on a predefined rule, in
which case
determining whether such a condition is satisfied may generally involve
determine whether the
predefined rule has been satisfied with a sufficient level of confidence.
[118] FIG. 6 depicts one possible example of analyzing a condition of the
hierarchy that is based
on a predefined rule. At block 602, the analytics platform 108 may determine
whether the received
operating data for the asset 102 satisfies at least one condition based on a
predefined rule for
providing a repair recommendation.
[119] In one implementation, an affirmative determination at block 602 that
the predefined rule
is satisfied may also mean that the condition of the hierarchy based on the
predefined rule is also
satisfied. In such an implementation, the process depicted in FIG. 6 may
proceed directly from
block 602 to block 608, thereby causing analytics platform 108 to identify the
recommendation
corresponding to the satisfied condition.
[120] In another implementation, an affirmative determination at block 602
that the at least one
predefined rule is satisfied may cause analytics platform 108 to perform
additional functions in
order to determine whether the condition based on the predefined rule is
satisfied. For instance,
as shown in FIG. 6, a determination that the predefined rule is satisfied may
cause the analytics
platform 108 to proceed to block 604 and determine a confidence level
associated with the
satisfaction of the predefined rule. Generally, a confidence level may be
metric (e.g., a number
from 0-100 or a percentage value) that indicates the confidence (or
"trustworthiness") in a
determination that, because the predefined rule is satisfied, the first
recommendation for repairing
the asset 102 is to be identified. This confidence level may take various
forms.
[121] According to one embodiment, the confidence level may be a single fixed
value that is
pre-associated with the predefined rule and its corresponding recommendation.
For example, the
confidence level for the predefined rule may be determined by a computing
system, such as the
analytics platform 108, based on historical repair data and/or user input.
[122] One way this might be accomplished is by having the computing system
electronically
present questionnaires to users (e.g., experts in the field) that enable the
computing system to
gather information regarding the confidence level associated with the
predefined rule. For
instance, such a questionnaire may present a set of operating data that
satisfies the predefined rule
and asks the user to decide whether a given repair is needed in that scenario
(e.g., whether the user
26
CA 03032946 2019-02-04
WO 2018/031481 PCT/US2017/045776
agrees or disagrees with the repair recommendation). The presented
questionnaire may enable a
user to input his or her responses in a binary manner (e.g. yes/no,
agree/disagree, etc.), upon a
Likert-type scale, by assigning a percentage value corresponding to their
certainty (e.g. 60% sure
a repair is needed, 20% likely that a specific repair recommendation will
resolve an issue, etc.),
textually in structured or unstructured format, or in some other manner.
[123] The computing system (e.g., analytics platform 108) may then process the
responses to the
questionnaire in order to determine a confidence level associated with the
predefined rule and its
corresponding repair recommendation. For instance, this processing may involve
grouping
response data by scenario and inputting the response data to a computer-based
algorithm to output
a confidence level for the predefined rule. Additionally, the processing may
involve weighting
the response data. For example, responses of a user with many years of
experience in the field
may be afforded greater weight (i.e. impact an aggregate confidence level more
significantly) than
responses of a user with relatively fewer years of experience. The processing
of the response data
to determine a confidence level may take other forms as well.
[124] According to another embodiment, the confidence level may vary based on
criteria such
as the inputs to the predefined rule. For example, as the number of abnormal-
condition indicators
input to the rule grows and/or the amount by which sensor measurements exceed
the rule's criteria
increases, the confidence level associated with the predefined rule may also
increase. Other
examples are possible as well.
[125] In such an embodiment, the determination of the confidence level may
also account for
other factors, such as the perceived reliability of sensor data. That is, the
analytics platform 108
may perceive that certain sensor data may be less or more reliable due to
factors such as sensor
type, weather conditions an asset is operating in, among others. For example,
if a given asset is
determined to be operating in an artic environment and one or more particular
sensor types are
known by analytics platform 108 to output faulty readings in extreme cold
conditions, the
confidence level that a predefined rule, based at least in part on one or more
of those sensor types,
is satisfied may be relatively lower than if the asset were determined to be
operating in a temperate
climate. In another example, analytics platform 108 may be aware that certain
sensor types (i.e.
brand, model) are inherently unreliable (i.e. prone to error) and may vary the
confidence level in
relation to the satisfaction of the predefined rule accordingly. Other
examples are possible.
[126] In practice, the analytics platform 108 may be made aware the sensor
type and other
conditions (e.g. weather, asset type, asset age) that may affect the
reliability of the sensor data
through analyzing metadata corresponding to the received operating data. The
analytics platform
108 may then compare the results of the metadata analysis to sensor
reliability data that may be
27
CA 03032946 2019-02-04
WO 2018/031481 PCT/US2017/045776
stored in data storage to determine if any adjustments to a confidence level
should be made. Other
methods and configurations may also be employed.
[127] Still further, the analytics platform 108 may vary the confidence level
for the predefined
rule dynamically based on user feedback. For instance, after a repair
recommendation is triggered
by the predefined rule, a user may provide feedback, via an output system such
as the output
system 110, to analytics platform 108 indicating an opinion as to whether they
agree or disagree
with the repair recommendation. Such feedback, in some examples, may take the
form of a binary
value (e.g. yes, no) or percentage levels (e.g. 70% confident in the
recommendation) and may be
based on, for instance, the success of an outputted repair recommendation
addressing an asset-
related issue, among other possibilities. Upon receiving such feedback, the
analytics platform 108
may identify the predefined rule the feedback is directed to and adjust the
confidence level
corresponding to the identified predefined rule accordingly.
[128] At block 606, the analytics platform 108 may compare the determined
confidence level
associated with the satisfaction of the predefined rule to a confidence level
threshold and thereby
determine whether the confidence level exceeds the confidence level threshold.
[129] The confidence level threshold represented at block 606, in essence, is
a numerical value
that serves as a gatekeeper to prevent the output of a recommendation that is
unnecessary and/or
unlikely to result in an asset related issue being solved. In some examples,
the confidence level
threshold may be a value that is defined by a user, the analytics system 108,
and/or some other
computer system based on various considerations.
[130] If the analytics platform 108 determines at block 606 that the
confidence level associated
with the satisfaction of the predefined rule exceeds the confidence level
threshold, and thus that
the condition of the hierarchy based on the predefined rule is satisfied, the
analytics platform 108
may proceed to block 608 and identify the recommendation corresponding to the
condition.
Alternatively, if the analytics platform 108 determines at block 610 that the
confidence level
associated with the satisfaction of the predefined rule does not exceed the
confidence level
threshold, and thus that the condition is not satisfied, the analytics
platform 108 may end the
analysis depicted in FIG. 6 or continue to analyze remaining conditions of the
hierarchy based on
predefined rules and/or predictive models.
[131] While the discussion above focuses on an implementation where a given
condition is based
on a single predefined rule, there may be another implementation where the
given condition is
based on a plurality of predefined rules. In such an implementation, the
determination at block
602 may take the form of a determination that the operating data satisfies any
one of the plurality
of predefined rules, a determination that the operating data satisfies some
threshold number of the
28
CA 03032946 2019-02-04
WO 2018/031481 PCT/US2017/045776
plurality of predefined rules, or a determination that the operating data
satisfies all of the plurality
of predefined rules. Similarly, the determination at block 606 may take the
form of a
determination that the confidence level associated with any one of the
plurality of predefined rules
exceeds the confidence level threshold, a determination that the confidence
level associated with
some threshold number of the plurality of predefined rules exceeds the
confidence level threshold,
or a determination that the confidence level associated with all of the
plurality of predefined rules
exceeds the confidence level threshold. In this respect, the confidence level
threshold used for
each of the plurality of predefined rules may either be the same or may vary
based on the
underlying predefined rule (i.e. unique confidence level thresholds for
individual predefined
rules).
[132] FIG. 7 depicts a conceptual illustration of a plurality of predefined
rules and associated
confidence levels that may form the basis for a hierarchy's first condition.
As shown, table 700
includes columns 702 and 704 that correspond to recommendations and confidence
levels,
respectively, and rows 706, 708, and 710 that correspond to Predefined Rules
1, 2, and 3,
respectively. Entries at the intersection of the columns and rows specify
recommendations and
confidence levels that correspond to each predefined rule. FIG. 7 will be now
be used to further
explain the example process described above with reference to FIG. 6.
[133] As shown in FIG. 7, the predefined rules identified in rows 706-710 may
trigger the
respective recommendations for repairing an asset identified in column 702.
For example,
Predefined Rule 1 (706) may trigger Recommendation A (e.g., repairing an
engine screw),
whereas Predefined Rules 2 and 3 (708, 710) may both trigger Recommendation B
(e.g., repairing
an engine spark plug). Furthermore, the predefined rules may be associated
with the confidence
levels of column 704. For example, Predefined Rules 2 and 3 both have fixed
confidence levels,
whereas Predefined Rule 1 (706) has a variable confidence level (25% or 75%)
that depends on
the inputs to the rule. As described above, these confidence levels may be
determined in various
manners.
[134] For purposes of illustration, the following example assumes that
Predefined Rule 1 (706),
which corresponds to Recommendation A, requires the presence of sensor Fault
Codes 1 (308)
and 3 (312) of FIG. 3 to be satisfied. That is, Predefined Rule 1(706) may be
satisfied when the
received Sensor A (302) value is greater than 135 RPM, received Actuator B
value is greater than
750V, and the received Sensor C value is greater than 65 C. As such,
Predefined Rule 1 may be
minimally satisfied by the received sensor values barely exceeding the
threshold sensor values
(i.e. Sensor A=136 RPM, Actuator B=76V, and Sensor C=66 C), or may be
satisfied to a greater
degree as one or more of the received sensor values increases (i.e sensor
A=180 RPM, Actuator
29
CA 03032946 2019-02-04
WO 2018/031481 PCT/US2017/045776
B=800V sensor C=80 C). In such an example, the analytics platform 108 may
take into account
the degree by which Predefined Rule 1 is satisfied to determine the associated
confidence level.
For example, the analytics platform 108 may select a lower confidence level
(25%) when the
Predefined Rule 1 (706) is minimally satisfied and a higher confidence level
(75%) when the
Predefined Rule 1 (706) is satisfied by a greater degree. The previous example
is not intended to
be limiting as the confidence level may be varied based on various criteria.
[135] As discussed above, in one implementation, the analytics platform 108
may use a
predefined rule's confidence level to determine whether to output the rule's
repair
recommendation. For example, if Predefined Rule 3 (710) is determined to be
satisfied with an
associated confidence level of 85% and the confidence level threshold is 80%,
the analytics
platform 108 may determine that the confidence level threshold has been
exceeded and may thus
output an indication of Recommendation B. On the other hand, if Predefined
Rule 2 (708) is
determined to be satisfied with its associated confidence level of 75% and the
confidence level
threshold is 80%, analytics platform 108 may determine that the confidence
level threshold has
not been exceeded and may not output an indication of Recommendation B.
[136] Referring back to FIG. 5, at least one other condition of the hierarchy
may be based on a
predictive model, in which case determining whether such a condition is
satisfied may generally
involve determining whether the predictive model's output meets a given
confidence threshold.
[116] FIG. 8 depicts one possible example of analyzing a given condition of
the hierarchy that
is based on a predictive model. In general, the predictive model may be
configured to predict a
likelihood that a given repair is needed and/or will be needed in the future
based on operating data
for an asset.
[117] At block 802, the analytics platform 108 may execute the predictive
model by inputting
the operating data for the asset 102 into the predictive model. In turn, at
block 804, the predictive
model may cause the analytics platform 108 to determine and output an
indicator of a likelihood
(e.g., a probability value between 0-1) that a given repair is needed and/or
will be needed in the
future at the asset 102.
[118] At block 806, the analytics platform 108 may determine whether the
outputted likelihood
indicator exceeds a confidence level threshold. As with the previously-
mentioned confidence level
threshold, this confidence level threshold may be a probability value (e.g. a
value between 0-1)
that defines the likelihood level at which a repair recommendation is to be
identified by the
analytics platform 108. Also, as with the previously-mentioned confidence
level threshold, this
confidence level threshold may be a fixed or variable value that is defined by
a computing device
or a user.
CA 03032946 2019-02-04
WO 2018/031481 PCT/US2017/045776
[137] If the analytics platform 108 determines at block 806 that the outputted
likelihood indicator
exceeds a confidence level threshold, the analytics platform 108 may then
proceed to block 808
and identify a recommendation corresponding to the given condition.
Alternatively, if the
analytics platform 108 determines that the outputted likelihood indicator does
not exceed the
confidence level threshold, then the analytics platform 108 may end the
analysis of the given
condition.
[138] In line with the discussion above, the hierarchy of conditions may
include multiple
conditions that are each based on a respective predictive model, in which case
the analytics
platform 108 may perform this analysis for each such condition.
[139] In some implementations, a condition could also be based on a predictive
model that is
capable of calculating respective likelihood values for multiple different
repair options (which
may have the same precision level or different precision levels). In such an
implementation, the
analytics platform's analysis of the condition may additionally involve
identifying the repair
option with the highest likelihood value.
[140] Returning again to FIG. 5, after the data analytics system 108 has
analyzed the hierarchy's
conditions at block 506, the analytics platform 108 may proceed to block 508
to check whether
more than one condition of the hierarchy has been satisfied, and thus whether
more than repair
recommendation has been identified. If so, the analytics platform 108 may then
proceed to block
510 to select which recommendation to output. (Alternatively, if the analytics
platform 108
determines only one condition was satisfied and thus only one recommendation
was identified,
the analytics platform 108 may skip block 510).
[141] In accordance with the present disclosure, the analytics platform 108
will preferably be
configured to select, from the identified more than one recommendation, the
recommendation
having the highest level of precision (e.g., most granular recommendation).
For example, if the
analytics platform 108 identifies a first recommendation directed to a
specific aspect of a
subsystem (e.g. a screw) and a second recommendation directed to the subsystem
more generally
(e.g., an engine), the analytics platform 108 may be configured to select the
first recommendation
because it has a higher level of precision relative to the second
recommendation. Various other
examples are possible.
[142] It should also be understood that, in some situations, the analytics
platform's analysis
could result in the identification of two or more different recommendations
having the same level
of precision, which may be identified as the highest level of precision of the
identified
recommendations. In such a situation, the analytics platform's selection of
the recommendation
at block 510 may additionally involve selecting between two recommendations
having the same
31
CA 03032946 2019-02-04
WO 2018/031481 PCT/US2017/045776
level of precision. According to one implementation, the analytics platform
108 could be
configured to perform this selection based on a set of one or more "tie-
breaker" rules, which may
take various forms.
[143] In one instance, a "tie-breaker" rule may be based on a type of
conditions to which the
identified recommendations correspond, and in particular, whether the
conditions are based on a
predefined rule, a predictive model, or the like. For example, such a "tie-
breaker" rule may specify
that for recommendations having the same level of precision, a recommendation
corresponding to
a condition based on a predictive model takes precedence over a recommendation
corresponding
to a condition based on a predefined rule.
[144] In another instance, a "tie-breaker" rule may be based on the confidence
level associated
with an identified recommendation corresponding to a condition based on a
predefined rule (see
block 604) and/or the outputted likelihood associated with a condition based
on a predictive model
(see block 808). For example, such a "tie-breaker" rule may specify that for
recommendations
having the same level of precision, a recommendation corresponding to a
highest confidence
level/outputted likelihood value takes precedence.
[145] The "tie-breaker" rules may take various other forms as well, including
the possibility that
the two or more different types of "tie-breaker" rules may be combined
together.
[146] In another implementation, instead of selecting between two or more
identified
recommendations each having the highest level of precision, the analytics
system 108 may be
configured to select all such recommendations for output.
[147] After selecting a recommendation, the analytics system 108 may proceed
to block 512 and
cause the selected repair recommendation to be output to a computing device.
This function of
causing the repair recommendation to be output may take various forms. In one
implementation,
the analytics platform may output the recommendation for repairing an asset to
the output system
110, and this may in turn cause the output system 110 to output various
information regarding the
recommendation for repairing an asset corresponding. Such outputted
information may take the
form of a visual or audio output. For example, the outputted information may
include an
identification of the repair that is needed and perhaps also instructions to
perform the repair,
among other possibilities.
[148] In another implementation, the analytics platform may output the
recommendation for
repairing an asset to the output system 110, and this may in turn cause the
output system 110 to
perform one or more actions to facilitate repairing the asset, such as
automatically ordering parts
required by the repair recommendation and/or automatically scheduling a time,
shop location,
32
CA 03032946 2019-02-04
WO 2018/031481 PCT/US2017/045776
and/or technician to perform the repair corresponding to the recommendation.
Other examples of
triggered actions are possible.
[119] Turning now to Fig. 9, a flow diagram is shown that depicts one possible
example of
defining a predictive model for outputting an indicator of the likelihood that
a given repair is or
may be needed at an asset. For purposes of illustration, the process of
defining the predictive
model is described as being carried out by the analytics platform 108, but the
predictive model
may be defined by other systems as well. One of ordinary skill in the art will
appreciate that the
flow diagram 900 is provided for sake of clarity and explanation and that
numerous other
combinations may be utilized to define a model that may predict the likelihood
that a given repair
is or may be needed.
[120] As shown in Fig. 9, at block 902, the analytics platform 108 may begin
by identifying a
given repair to be recommended when the second condition is satisfied. In
practice, the given
repair may be utilized to address a variety of asset-related issues such as
faults, failures, and non-
optimal operation, among other possibilities. In turn, the analytics platform
108 may then define
a model for predicting a likelihood that the given repair is needed and/or
will be needed in the
future.
[121] In particular, at block 904, the analytics platform 108 may analyze
historical repair data
for a group of one or more assets to identify past occurrences of the given
repair. At block 906,
analytics platform 108 may identify a respective set of historical operating
data that is associated
with each identified past occurrence of the given repair (e.g., abnormal-
condition data and/or
sensor data from a timeframe shortly before and/or after the occurrence of the
given repair).
[122] At block 908, the analytics platform 108 may then analyze the identified
sets of historical
operating data associated with past occurrences of the given repair to define
a relationship between
(1) the values for a given set of operating data parameters (e.g., abnormal-
condition indicators
and/or sensor values) and (2) the likelihood of the given repair being needed
currently and/or
within a timeframe in the future. This relationship may be stored as the
predictive model for the
given repair.
[123] As the analytics platform 108 continues to receive historical repair and
operating data for
the group of one or more assets, the analytics platform 108 may also continue
to refine the
predictive model for the given repair by repeating blocks 904-908.
[124] The functions of the example definition phase in Fig. 9 will now be
describe in further
detail. Starting with block 902, as noted above, the analytics platform 108
may begin by
identifying a given repair to be recommended when the second condition is
satisfied. The
analytics platform 108 may perform this function in various manners.
33
CA 03032946 2019-02-04
WO 2018/031481 PCT/US2017/045776
[125] In one implementation, the given repair may be identified based on user
input. For
example, the analytics platform 108 may receive from a computing device
operated by a user,
such as output system 108, input data indicating a user selection of the given
repair.
[126] In another implementation, the given repair may be identified based on
determinations
made by the analytics platform 108. For example, the analytics platform 108
may be configured
to identify the given repair based on information regarding the particular
hierarchy being defined,
the particular types of assets in the system, etc. As another example, the
analytics platform 108
may be configured to identify the given repair based on historical repair
data. Other examples are
possible as well.
[127] In yet another implementation, the given repair may be identified based
on a combination
of user inputs and determinations made by the analytics platform 108. Other
implementations are
also possible.
[128] At block 904, the analytics platform 108 may analyze historical repair
data for a group of
one or more assets to identify past occurrences of the given repair. The group
of the one or more
assets may include a single asset, such as asset 102, or multiple assets that
may be of the same or
similar type, such as a fleet of assets. The analytics platform 108 may
analyze a particular amount
of historical repair data, such as a certain amount of time's worth data (e.g.
a month's worth) or a
certain number of data-points (e.g., the most recent thousand data-points),
among other examples.
In practice, the analytics platform 108 may search the historical repair data
for indicators that
represent the given repair, such as a repair code or a textual description of
the given repair. For
each occurrence of the given repair that is located in the historical repair
data, the analytics
platform 108 may record identifying information for that occurrence such as
the given asset at
which the repair was made, the time at which the repair was made, etc.
[129] At block 906, the analytics platform 108 may identify a set of
respective operating data
that is associated with each identified past occurrence of the given repair.
In particular, the
analytics platform 108 may identify a set of historical operating data (e.g.,
abnormal-condition
data and/or sensor data) from a certain timeframe around the time of the given
occurrence of the
given repair. For example, the set of data may be from a particular timeframe
(e.g. two weeks)
before, after, or around the given occurrence of the given repair. In other
cases, the set of data
may be identified from a certain number of data-points before, after, or
around the given
occurrence of the repair. Other examples are possible as well. Further, in
practice, the analytics
platform 108 either may identify all historical operating data for the asset
102 in the identified
timeframe or may obtain a subset of the historical operating data for the
asset 102 in the identified
timeframe (e.g., only abnormal-condition data and/or sensor data that relates
to the given repair).
34
CA 03032946 2019-02-04
WO 2018/031481 PCT/US2017/045776
[130] In addition to the methods described above, the analytics platform 108
may identify a set
of respective operating data that consists of continuous signal data and
asynchronous event data
by utilizing the methods for pattern matching of time series arrays described
in U.S. Patent
Application No. 14/996,154, which is incorporated by reference herein in its
entirety. These
methods identify one or more historical time series data arrays similar to the
operating data for
the recommended repair. Then associated event data particular to the
historical repairs, e.g., data
from oil sample results, results of system tests performed by mechanics, parts
utilized in the repair,
may be utilized to filter the one or more historical time series data arrays
to obtain the one or more
filtered historical time series data arrays that are most relevant to the
recommended repair.
[131] After the analytics platform 108 identifies the set of operating data
for the given occurrence
of a given repair, the analytics platform 108 may determine whether there are
any remaining
occurrences for which a set of operating data should be identified. In the
event that there is a
remaining occurrence, block 906 would be repeated for each remaining
occurrence.
[132] Thereafter, at block 908, the analytics platform 108 may analyze the
identified sets of
historical operating data associated with the past occurrences of the given
repair to define a
relationship between (1) a given set of operating data parameters and (2) the
likelihood of the
given repair being needed currently and/or within the given timeframe in the
future. This defined
relationship may embody the predictive model for the given repair.
[133] In practice, this relationship (and thus the predictive model) may be
defined in a number
of manners. In example implementations, the analytics platform 108 may define
the predictive
model by utilizing one or more modeling techniques that return a probability
between zero and
one, such as a random forest technique, logistic regression technique, or
other regression
techniques. Other examples are possible as well.
[134] In a particular example, defining the predictive model may involve the
analytics platform
108 implementing a localized temporal model of U.S. Patent Application No.
14/996,154, which
as noted above is incorporated by reference. The filtered historical time
series data arrays that are
most relevant to the recommended repair are used to train a time series
forecast model, which then
generates a forecast of one or more future values of at least one operating
data parameters. The
predicted future values of operating data parameters may be associated with a
probability between
zero and one that a given repair is needed within the timeframe in the future.
[135] In another example, defining the predictive model may involve the
analytics platform 108
generating a response variable based on the historical operating data
identified at 906.
Specifically, the analytics platform 108 may determine an associated response
variable for each
CA 03032946 2019-02-04
WO 2018/031481 PCT/US2017/045776
set of operating data received at a particular point in time. As such, the
response variable may
take the form of a data set associated with the predictive model.
[136] The response variable may indicate whether the given set of operating
data is within any
of the timeframes identified at block 906. That is, a response variable may
reflect whether a given
set of operating data is from a time of interest about the occurrence of a
repair. The response
variable may be a binary-values response variable such that if the given set
of operating data is
within any of the determined timeframes, the associated response variable is
assigned a value of
one, and otherwise, the associated response variable is assigned a value of
zero.
[137] Continuing in the particular example of defining the predictive model
based on a response
variable, the analytics platform 108 may train the predictive model with the
historical operating
data identified at block 906 and the generated response variable. Based on
this training process,
the analytics platform 108 may then define the predictive model that receives
as inputs various
operating data and outputs a probability between zero and one that a repair is
needed within a
timeframe equivalent to the timeframe used to generate the response variable.
[138] In some cases, training with the historical operating data identified at
block 906 and the
generated response variable may result in variable importance statistics for
each operating data
parameter. A given variable importance statistic may indicate the operating
data parameter's
relative effect on the probability that the given repair is or will be needed.
[139] Additionally or alternatively, the analytics platform 108 may be
configured to define the
predictive model based on one or more survival analysis techniques, such as a
Cox proportional
hazard technique. The analytics platform 108 may utilize a survival analysis
technique similarly
in some respects to the above-discussed modeling technique, but the analytics
platform 108 may
determine a survival time-response variable that indicates an amount of time
from the last failure
to a next expected event. A next expected event may be either reception of
operating data or an
occurrence of a repair, whichever occurs first. This response variable may
include a pair of values
that are associated with each of the particular points in time at which
operating data is received.
The response variable may then be utilized to determine a probability that the
given repair is or
will be needed.
[140] In some implementations, in addition to the received operating data, the
predictive model
may also be defined based on other data. For example, the predictive model may
be defined based
on features, which may be derived from the operating data. Examples of such
features may
include an average range of sensor values that were historically measured when
a repair was
needed, an average range of sensor-values gradients (e.g., a rate of change in
sensor
measurements) that were historically measured prior to an occurrence of a
repair being needed, a
36
CA 03032946 2019-02-04
WO 2018/031481 PCT/US2017/045776
duration of time between repairs (e.g., an amount of time or number of data-
points between a first
occurrence of a repair and a second occurrence of a repair), and/or one or
more patterns indicating
sensor measurements around the occurrence of a failure. One of ordinary skill
in the art will
appreciate that these are but a few example features that can be derived from
operating data and
that numerous other features are possible.
[141] As another example, the predictive model may be defined based in part on
external data,
such as weather data and/or "hot box" data, among other data. For instance,
based on such data,
the predictive model may increase or decrease the likelihood that a repair is
needed.
[142] In practice, external data may be observed at points in time that do not
coincide with times
at which the operating data was captured. For example, the time at which "hot
box" data is
collected (e.g., time at which a locomotive passes along a section of railroad
track that is outfitted
with hot box sensor) may be in disagreement with operating data times. In such
cases, the
analytics platform 108 may be configured to perform one or more operations to
determine external
data observations that would have been observed at time that correspond to the
sensor
measurement times.
[143] Specifically, the analytics platform 108 may utilize the times of the
external data
observations and times of the operating data to interpolate the external data
observations to
produce external values for times corresponding to the operating data times.
Interpolation of the
external data may allow external data observations or features derived
therefrom to be included
as inputs into the predictive model. In practice various techniques may be
used to interpolate the
external data with the operating data, such as nearest-neighbor interpolation,
linear interpolation,
polynomial interpolation, and spline interpolation, among other examples.
[144] It should also be understood that the analytics platform 108 may repeat
blocks 902-908 to
define a predictive model for each of a plurality of different repair options.
As noted above, it
may also be possible to define a predictive model that is capable of
outputting likelihood values
for multiple different repair options.
[145] Turning now to FIG. 10, another example process is shown that may serve
an alternative
implementation for the process discussed above in reference to FIG. 5. For the
purposes of
illustration, this example process of is also described as being carried out
by the analytics platform
108, but this example process may be carried out by other devices and/or
systems as well. For
example, if an asset includes a local analytics device such as the one
described above, then such
an asset may also be configured to carry out this process either alone or in
combination with the
analytics platform 108. One of ordinary skill in the art will also appreciate
that flow diagram 1000
37
CA 03032946 2019-02-04
WO 2018/031481 PCT/US2017/045776
is provided for sake of clarity and explanation and that numerous other
combinations of operations
may be utilized to determine a recommendation for repairing a given asset.
[146] As shown in FIG. 10, at block 1002, the analytics platform 108 may be
maintaining a
hierarchy of conditions that correspond to respective recommendations for
repairing an asset
based on operating data. In the example process depicted in FIG. 10, the
hierarchy may include
at least (1) a first condition that is based on a predefined rule and
corresponds to a first repair
recommendation having a higher level of precision and (2) a second condition
that is based on a
predictive model and corresponds to a second repair recommendation having a
lower level of
precision. However, this example hierarchy may take various other forms as
well, including the
possibility that the first condition is based on a predictive model and the
second condition is based
on a predefined rule, that the first and second conditions are both based on a
predefined rule, and
that the first and second conditions are both based on a predictive model.
[147] At block 1004, while maintaining the hierarchy, the analytics platform
108 may receive
data that reflects the current operating conditions of a given asset.
[148] At block 1006, the analytics platform 108 may utilize the received
operating data to
determine whether the first condition of the hierarchy is satisfied (e.g., in
a manner similar to that
discussed above with reference to FIG. 6). If analytics platform 108
determines that the first
condition of the hierarchy of conditions is satisfied, then at block 1008, the
analytics platform 108
may cause an indication of the first recommendation having the higher level of
precision to be
output by the output system 110.
[149] On the other hand, if the analytics platform 108 determines that the
first condition of the
hierarchy of conditions is not satisfied, the process may proceed to block
1010 to determine
whether the second condition of the hierarchy is satisfied (e.g., in a manner
similar to that
discussed above with reference to FIG. 8). If the analytics platform 108
determines at block 1010
that the second condition is satisfied, then at block 1012, the analytics
platform 108 may cause an
indication of the second recommendation having the lower level of precision to
be output by the
output system 110.
[150] If the second condition is also not satisfied, the analytics platform
108 may then continue
to proceed through any other levels of the hierarchy sequentially until (1) a
condition is found to
be satisfied or (2) all the conditions of the hierarchy fail to be satisfied.
In other implementations,
analytics platform 108 may process the conditions of the hierarchy
simultaneously or batches of
conditions sequentially.
[151] As shown in FIG. 10, in some implementations, the analytics platform 108
may terminate
the example process after identifying a recommendation for output. In other
implementations, the
38
CA 03032946 2019-02-04
WO 2018/031481 PCT/US2017/045776
analytics platform 108 may continue to proceed through lower levels of the
hierarchy even after
identifying a recommendation for output at a higher level of the hierarchy.
[149] While FIG. 10 is discussed in the context of an example hierarchy having
one
condition/recommendation per level of precision, it should again be understood
that a hierarchy
may include multiple conditions/recommendations per level of precision. For
example, such a
hierarchy may include (1) a first set of conditions that each correspond to a
respective repair
recommendation having a first level of precision and (2) a second set of
conditions that each
correspond to a respective repair recommendation having a second level of
precision, where the
first and second levels of precision differ. In such an example, the analytics
platform 108 may
analyze each of the first set of conditions at block 1006, and if more than
one of the first set of
conditions is satisfied, the analytics platform 108 may use a "tiebreaker
rule" such as those
described above to select which recommendation to output at block 1008.
Further, if none of the
first set of conditions is satisfied at block 1006, the analytics platform 108
may perform a similar
analysis for the second set of conditions/recommendations.
V. CONCLUSION
[152] Example embodiments of the disclosed innovations have been described
above. Those
skilled in the art will understand, however, that embodiments may be combined
and that changes
and modifications may be made to the embodiments described without departing
from the true
scope and sprit of the present invention, which will be defined by the claims.
[153] Further, to the extent that examples described herein involve operations
performed or
initiated by actors, such as "humans", "operators", "users" or other entities,
this is for purposes of
example and explanation only. The claims should not be construed as requiring
action by such
actors unless explicitly recited in the claim language.
39