Note : Les descriptions sont présentées dans la langue officielle dans laquelle elles ont été soumises.
SYSTEM AND METHOD FOR IMAGING TISSUE
FIELD OF THE INVENTION
The invention generally relates to imaging a tissue with a magnetic resonance
imaging (MRI) device. More specifically, the invention relates to systems and
methods
for detection of local susceptibility variations within a tissue using an MRI
device.
BACKGROUND
Hemorrhaging in a brain can be paramagnetic, and can have a distinctly
different
magnetic susceptibility than surrounding tissue. When taking an MRI image of a
brain
that has a hemorrhage, the hemorrhage typically appears darker (e.g., hypo-
intense) on
images obtained with a gradient-echo (GRE) sequence having a sufficiently long
time
(e.g., 10 ¨ 40 ms) between signal excitation and the occurrence of the
detected echo
signal (TE) (e.g., T2* weighted images) in comparison to non-hemorrhage areas
of the
brain due to, for example, the presence of local internal magnetic field
gradients at the
location of the hemorrhage. However, the mere appearance of hypo-intensity in
an MRI
image is typically not sufficient for declaring a hemorrhage because other
factors can
cause the hypo-intensity in the MRI image. For example, a tissue having a
short T2
relaxation time (e.g., 100 ms or below) can also appear hypo-intense.
Current methods for determining whether hypo-intense regions in an MRI image
are due to a hemorrhage typically include susceptibility-weighted-imaging
(SWI).
Locations of hemorrhaging can be identified by identifying local phase changes
which
can indicate paramagnetic centers. Location of hemorrhaging can be identified
by sign
(e.g., a negative phase), magnitude (e.g., in excess of a predefined value),
and/or by
spatial frequency (e.g., a change that occurs over small distances). SWI can
include
combining magnitude of the MRI images obtained with the GRE sequence and phase
maps.
One difficulty with SWI for identifying brain hemorrhaging can include the
fact
that local phase shifts caused by the hemorrhage can be very small (e.g.,
phase shifts in
the order of 10 degrees) in comparison with the phase shifts caused by the non-
homogeneous field of the main magnet. Thus, for a MRI acquired in a
nonhomogeneous
1
CA 3047661 2019-06-20
magnetic field, the inhomogeneity of the main magnetic field can hide the
local gradients,
making it difficult to detect the hemorrhaging. Therefore, it can be desirable
to reliably
detect local magnetic susceptibility variations within a tissue (e.g.,
hemorrhaging within a
brain).
SUMMARY
Embodiments include detecting a portion within a tissue that has a variation
of
local magnetic susceptibility using a magnetic resonance imaging (MRI) device,
including for example transmitting, by the MRI device, a first spin-echo pulse
sequence
to the tissue, wherein the first spin-echo pulse sequence includes a first
number of refocus
pulses and a first echo time (TE) value, obtaining, by the MRI device, a first
image of the
tissue, transmitting, by the MIZI device, a second spin-echo pulse sequence to
the tissue,
wherein the second spin-echo pulse sequence includes a second number of
refocus pulses
and a second TE value, obtaining, by the MRI device, a second image of the
tissue,
determining one or more locations within the second image of the tissue having
a signal
intensity that is different than the signal intensity of the same one or more
locations
within the first image of the tissue, and identifying a portion of tissue that
has a varied
local magnetic susceptibility based on the determined one or more locations
within the
second image of the tissue.
In some embodiments, the first number of refocus pulses and the second number
of refocus pulses are different. In some embodiments, the first TE value and
the second
TE value are different. In some embodiments, identifying the portion of tissue
can
include identifying a location within the tissue where an effective TE of the
first pulse
sequence and second pulse sequence are identical.
In some embodiments, identifying the portion of the tissue can include
applying a
correction matrix to the first image of the tissue and the second image of the
tissue, and
wherein the correction matrix is based on at least two calibration images
taken using the
MRI device. In some embodiments, the first number of refocus pulses is less
than the
second number of refocus pulses. In some embodiments, the second number of
refocus
pulses is less than the first number of refocus pulses. In some embodiments,
one or more
2
CA 3047661 2019-06-20
calibration images can be acquired from a phantom which is void of internal
susceptibility gradients.
In some embodiments, a correction matrix can be generated based on the one or
more calibration images, and the generated correction matrix can be applied on
at least
one of the first image of the tissue and the second image the second image of
the tissue.
In some embodiments, the tissue is a brain. In some embodiments, the MRI is a
permanent magnet MRI. In some embodiments, the identified portion of the
tissue can be
transmitted to a display.
In some embodiments, the signal intensity difference between the first image
of
the tissue and the second image of the tissue can be caused by the strength of
local
magnetic susceptibility gradients. In some embodiments, an image mask can be
generated, the first image of the tissue and the second image of the tissue
can be weighted
with relaxation time T2, and the image mask can be superimposed on the
weighted first
image of the tissue and the second image of the tissue.
In some embodiments, at least one of the first spin-echo pulse sequence and
the
second spin-echo pulse sequence can be a 3-dimensional sequence. In
some
embodiments, fast spin-echo sequence can be applied to the tissue to obtain a
readout of
the tissue. In some embodiments, multiple spin-echo pulse sequences can be
applied
during a predetermined time period prior to applying the fast spin-echo
sequence.
Embodiments include a system for detection of a portion within a tissue that
has a
variation of local magnetic susceptibility, including for example a magnetic
resonance
imaging (MRI) device, to: transmit a first spin-echo pulse sequence to the
tissue, wherein
the first spin-echo pulse sequence includes a first number of refocus pulses
and a first
echo time (TE) value, obtain a first image of the tissue, transmit a second
spin-echo pulse
sequence to the tissue, wherein the second spin-echo pulse sequence includes a
second
number of refocus pulses and a second TE value, obtain a second image of the
tissue,
determine one or more locations within the second image of the tissue having a
signal
intensity that is different than the signal intensity of the same one or more
locations
within the first image of the tissue, and identify a portion of tissue that
has a varied local
magnetic susceptibility based on the determined one or more locations within
the second
image of the tissue.
3
CA 3047661 2019-06-20
Embodiments include a computer program product including instructions which,
when the program is executed by a computer, cause the computer to instruct a
magnetic
resonance imaging (MRI) device to detect a portion within a tissue that has a
variation of
local magnetic susceptibility, the instructions including for example
transmitting, by the
MRI device, a first spin-echo pulse sequence to the tissue, wherein the first
spin-echo
pulse sequence includes a first number of refocus pulses and a first echo time
(TE) value,
obtaining, by the MRI device, a first image of the tissue, transmitting, by
the MRI device,
a second spin-echo pulse sequence to the tissue, wherein the second spin-echo
pulse
sequence includes a second number of refocus pulses and a second TE value,
obtaining,
by the MRI device, a second image of the tissue, determining one or more
locations
within the second image of the tissue having a signal intensity that is
different than the
signal intensity of the same one or more locations within the first image of
the tissue,
identifying a portion of tissue that has a varied local magnetic
susceptibility based on the
determined one or more locations within the second image of the tissue.
BRIEF DESCRIPTION OF THE DRAWINGS
Non-limiting examples of embodiments of the disclosure are described below
with reference to figures attached hereto that are listed following this
paragraph.
Dimensions of features shown in the figures are chosen for convenience and
clarity of
presentation and are not necessarily shown to scale.
The subject matter regarded as the invention is particularly pointed out and
distinctly claimed in the concluding portion of the specification. The
invention, however,
both as to organization and method of operation, together with objects,
features and
advantages thereof, can be understood by reference to the following detailed
description
when read with the accompanied drawings. Embodiments of the invention are
illustrated
by way of example and not limitation in the figures of the accompanying
drawings, in
which like reference numerals indicate corresponding, analogous or similar
elements, and
in which:
Fig. 1 schematically illustrates a pulse sequence for a spin echo MRI,
according to
some embodiments of the invention;
4
CA 3047661 2019-06-20
Figs. 2A and 2B show a flow chart of a method to detect a portion within a
tissue
that has a variation of local magnetic susceptibility, with a MRI device,
according to
some embodiments of the invention;
Figs. 3A and 3B show examples of images of a tissue (e.g., a sample tissue)
obtained with a first pulse sequence and a second pulse sequence, with a MRI
device,
according to some embodiments of the invention;
Fig. 3C shows a desired local susceptibility-specific MRI image as determine
from the MRI images of Fig. 3A and 3B, according to some embodiments of the
invention;
Figs. 4A and 4B show examples of MRI images of a tissue obtained with a first
pulse sequence and a second pulse sequence, with a MRI device, according to
some
embodiments of the invention;
Fig. 5A and Fig. 5B show examples of MRI images of a tissue obtained with a
first pulse sequence and a second pulse sequence, according to some
embodiments of the
invention; and
Fig. 6 shows another pulse sequence for spin echo MRI, according to some
embodiments of the invention.
It will be appreciated that for simplicity and clarity of illustration,
elements shown
in the figures have not necessarily been drawn to scale. For example, the
dimensions of
some of the elements may be exaggerated relative to other elements for
clarity. Further,
where considered appropriate, reference numerals may be repeated among the
figures to
indicate corresponding or analogous elements.
DETAILED DESCRIPTION
In the following detailed description, numerous specific details are set forth
in
order to provide a thorough understanding of the invention. However, it will
be
understood by those skilled in the art that the present invention may be
practiced without
these specific details. In
other instances, well-known methods, procedures, and
components, modules, units and/or circuits have not been described in detail
so as not to
obscure the invention Some features or elements described with respect to one
embodiment may be combined with features or elements described with respect to
other
5
CA 3047661 2019-06-20
embodiments. For the sake of clarity, discussion of same or similar features
or elements
may not be repeated.
Although embodiments of the invention are not limited in this regard,
discussions
utilizing terms such as, for example, "processing", "computing",
"calculating",
"determining", "establishing", "analyzing", "checking", or the like, may refer
to
operation(s) and/or process(es) of a computer, a computing platform, a
computing
system, or other electronic computing device, that manipulates and/or
transforms data
represented as physical (e.g., electronic) quantities within the computer's
registers and/or
memories into other data similarly represented as physical quantities within
the
computer's registers and/or memories or other information non-transitory
storage
medium that may store instructions to perform operations and/or processes.
Although
embodiments of the invention are not limited in this regard, the terms
"plurality" and "a
plurality" as used herein may include, for example, "multiple" or "two or
more." The
terms "plurality" or "a plurality" may be used throughout the specification to
describe
two or more components, devices, elements, units, parameters, or the like. The
term
"set" when used herein may include one or more items. Unless explicitly
stated, the
method embodiments described herein are not constrained to a particular order
or
sequence. Additionally, some of the described method embodiments or elements
thereof
can occur or be performed simultaneously, at the same point in time, or
concurrently.
Advantages of the invention can include an ability to detect local magnetic
susceptibility variations within a tissue, for example, local susceptibility
caused by a
hemorrhage within a brain
When obtaining an MRI of an object, there can be a spin-echo decay in the
object
in the presence of a non-uniform magnetic field (e.g., a Bo field). The
relaxation time T2
can indicate a decay of a transverse magnetization (e.g., signal intensity vs.
echo time
(TE)) in spin-echo (SE) pulse sequences. The decay can be exponential, as
shown below
in equation No. 1:
_TE
A(TE) Ac, e T2
Equation No. 1
where A is a measured signal intensity at an echo time (TE), and Ao is an
available signal intensity, which can depend, for example, upon spin density
and/or other
parameters of the object that the MRI is being taken of and/or the pulse
sequence. The
6
CA 3047661 2019-06-20
parameters and/or variables equation No. 1 can be local values, in other
words, they can
be functions of the spatial coordinates (x,y,z).
In a spin-echo pulse sequence, the signal can be created by an excitation
pulse
(e.g, with flip angle of 900), which can be followed by a series of n (n 1)
refocus
pulses (e.g., with a flip angle of 180 ). For the sake of simplicity, in one
example, the
refocus pulses can be assumed to have 180 flip angles. In this example, each
of the
refocus pulses can create an echo signal. The echo signal can have an
intensity that
obeys equation No. 1 at each time of occurrence of an echo peak. The echo time
(TE)
can be time between an excitation pulse and the peak of the echo signal.
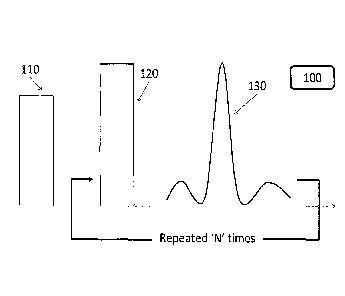
Reference is made to Fig. 1, which schematically illustrates a pulse sequence
for a
spin echo MRI, according to some embodiments of the invention. An excitation
pulse 110 can be generated by an MRI device 100, followed by a refocus pulse
120.
Once the refocus pulse 120 is generated, the MRI can detect a signal 130. The
refocus
pulse 120 can be repreated 'N' times, where 'N' is an integer greater than 1.
The echo
time (TE) can be the time between the excitation pulse and the detected
signal. The pulse
sequence of Fig. 1 can also form the basis for single-SE pulse sequences,
multi-SE pulse
sequences, and/or fast-SE (FSE) pulse sequences. For a FSE pulse sequence,
each echo
can have different phase encoding (in contrast to SE pulse sequences where all
echoes
experience the same phase-encode gradient), and a single MRI image can be
reconstructed from all of the echos. The contrast in the FSE can be determined
by one
echo at the center of `k-space' (e.g., the echo acquired with zero phase-
encoding).
The value of the relaxation time T2 can depend on homogeneity of the magnetic
field Bo and/or details of the particular pulse sequence that is used for
measuring T2. The
phenomenon of the spin echo can rely upon the fact that the resonance
frequencies of
each of the nuclei in the observed volume, between signal excitation and
signal refocus
pulses, can be identical to the frequencies between the refocus pulses and the
formation
of the echo. But this condition may not apply if, for example, the nuclei move
in a non-
uniform Bo field between the two time intervals (e.g., the time intervals
being the periods
before and after the refocus pulses). In the presence of the nuclei moving
(e.g., due to
diffusion and/or flow), the signal refocusing can be incomplete, and/or the
amplitude of
7
CA 3047661 2019-06-20
the echo signal can be lower than expected from considering only the value of
T2 that
occurs absent the nuclei moving (e.g., as can be implied by equation No. 1).
If the diffusion of the nuclear spins in a non-uniform Bo field is taken into
account, the equation describing the decay of the echo implied as shown in
equation
No. 1 can be modified as follows:
AHE(TE) = Aoexp(--TE - 12-1Dg2(TE)3)
T2
Equation No. 2
where "HE" is a 'Hahn Echo', that can indicate that equation No. 2 can
describes
an echo signal intensity following a single 1800 refocus pulse, which can be
applied at
time TE/2 after the excitation pulse (corresponding to 'N'=1 in Fig.
1). The
parameter 'D' is the molecular self-diffusion coefficient, and 'g' is the
value of the local
field gradient (e.g., assuming that the Bo field variation in space is
linear). Neglecting the
second term in the exponent of equation No. 2 can result in the decay of the
echo
intensities being the same as described by equation No. 1. Neglecting the
second term
can be justified if `D' and/or 'g' are small, and if the times TE at which the
signal is
measured are short However, if the magnitude of the second term is significant
(or even
dominant), the decay of the echo amplitude may no longer be exponential, and
can be
strongly affected by local non-uniformities of Bo. In various scenarios,
'local non-
uniformities of Bo' can be due to the inherent field of the magnet and/or
field non-
uniformities (e.g., from susceptibility gradients in the sample and/or at the
sample-air
interface).
Another consideration with respect to MRI measurments can be an effect type of
nuclei, a molecular environment and/or a temperature on the relaxation time
12. As can
be seen by viewing equation No. 2, measuring T2 by creating a single echo
signal at
varying times can result in inaccuracies in T2 and/or difficulties in
obtaining a T2
measurement In some embodiments, repeating the application of the refocus
pulses
(e.g., at equal time intervals) can create a series (e.g., or a 'train') of
echo signals that can
reduce the effect of the second term in equation No. 2. In some embodiments,
reapeating
the application of the refocus pulses can be done in accordance with a 'Carr-
Purcell-
Meiboom-Gill' (CPMG) echo-train pulse sequence to, for example, measure
transverse or
spin-spin 12 relaxation times of any nucleus. In these embodiments, multiple
echoes at
8
CA 3047661 2019-06-20
varying values of TE can be detected. In some embodiments, 'N' refocus pulses
can be
applied to detect and/or measure n echo signals, as indicated, for example, in
Fig. 1.
In some embodiments, the contribution of the second term in equation No. 2 can
be reduced by increasing the number of refocus pulses as, for example, shown
in
Equation No. 4, below: let the time interval between successive refocus pulses
and
refocus echo signals be denoted by IED (inter-echo-delay). The time between
the
excitation pulse and the first refocus pulse is equal to IED/2. The echo time
TE of each
of the echoes in the train can be:
TE = n (IED) Equation No. 3
The decay of the echo signal can be given by:
TE 1 (TE)3
T2 12 n2 )
Equation No. 4
As can be seen from equation No. 4, the relative contribution of the second
term
(which can due to diffusion in local gradients), can be reduced by increasing
the number
of refocus pulses 'n' within a given TE (which can be equivalent to shortening
IED). In
some embodiemnts, where the magnitude of the second term is negligible
compared to
that of the first term, the relaxation time T2 can be accurately (or
substantially accurately)
measured from the decay of the signals in the echo train, even when, for
example, the
field Bo is strongly non-uniform and TE is long. In some embodiments, T2 can
be
measured with a single signal excitation.
As described above, it can be desirable to create contrast in an MRI image
based
upon the presence of strong internal field gradients to, for example, detect
brain
hemmoraging. It can be desirable to obtain MRI images in which the intensities
depend
exclusively (or substantially exclusively) on the strength of the local
gradients (as
.. represented by `g'), without being affected (or being substantially
effected) by any other
factors (such as Ti, T2, etc.) and/or to create a mathematical MRI image mask,
which
can be super-imposed on T2-weighted MRI images to highlight and/or emphasize
internal susceptibility gradients. As can be verified in equation No. 4,
variations in IED
(which can be seen as equivalent to variations in 'n') for embedding different
levels of
sensitivity to internal gradients into the signal intensities in the MRI
images can be used.
9
CA 3047661 2019-06-20
In some embodiments, two sets of MRI images are acquired, for which all
acquisition parameters (including TE) are the same (or substantially the
same), and only
the number of refocus pulses (n) is different. In these embodiments, the only
differences
(or the only substantial differences) between the two MRI image sets is due to
the
strength of the local magnetic susceptibility gradients.
According to some embodiments, an MRI device is used to detect a particular
portion of interest within a tissue that has a variation of local magnetic
susceptibility, for
example to detect brain hemmoraging. Reference is made to Figs. 2A-2B, which
show a
flow chart of a method to detect a portion within a tissue that has a
variation of local
magnetic susceptibility with an MRI device, according to some embodiments of
the
invention.
The method involves, transmitting, by an MRI device, a first spin-echo pulse
sequence to the tissue, wherein the first spin-echo pulse sequence includes a
first number
of refocus pulses and a first echo time (TE) value (at Step 210).
The method also invovles, obtaining, by the MRI device, a first image of the
tissue (at Step 220).
The method also involves, transmitting, by the MRI device, a second spin-echo
pulse sequence to the tissue, wherein the second spin-echo pulse sequence
includes a
second number of refocus pulses and a second echo time (TE) value (at Step
230).
The method also invovles, obtaining, by the MRI device, a second image of the
tissue (at Step 240). In some embodiments, the first number of refocus pulses
and the
second number of refocus pulses are different. In some embodiments, the first
TE value
and the second TE value are different.
The method also invovles, determining one or more locations within the second
image of the tissue having a signal intensity that is different than the
signal intensity of
the same one or more locations within the first image of the tissue (at Step
250). The
determining can be performed by an MRI device and/or computer processing
device.
The method also involves, identifying a portion of tissue that has a varied
local
magnetic susceptibility based on the determined one or more locations within
the second
image of the tissue (at Step 260). The identification of the portion of tissue
that has local
magnetic susceptibility variation can be carried out by detection of algebraic
post-
CA 3047661 2019-06-20
processing of the images. The identifying can be performed by an MRI device
and/or
computer processing device.
In various embodiments, the first spin-echo pulse sequence and/or the second
spin-echo pulse sequence is a 3-dimensional sequence, with acquisition matrix
64x64x28,
slice thickness equal to 1.5 mm, field-of-view (FOV) equal to 32 mm, TR equal
to 400
ms and TE equal to 22.4 ms.
In various embodiments, the first number of refocus pulses is between 1 and
'n',
where 'n' is an integer number greater than 1. In various embodiments, the
second
number of refocus pulses is between 1 and 'm', where m is an integer number
greater
than 1. In some embodiments, 'n' and 'm' are different In some embodiments,
'n' is
greater than 'm'. In some embodiments, 'm' is greater than 'n'.
In some embodiments, an indicator of the detected local magnetic
susceptibility
variation within the tissue is transmitted to a display, for example to be
viewed by an
operator of the MRI device.
In various embodiments, there can be any number of scans (e.g., a first spin-
echo
sequence, second spin-echo sequency, a third spin-echo sequece,
'n' spin-echo
sequence, where 'n' is an integer greater tham 1). In these embodiments, for
each spin-
echo sequence in the 'n' spin-echo sequences, the number of refocus pulses can
be any
integer value. In these embodiments, for each spin-echo sequence in the 'n'
spin-echo
sequences, the number of refocus pulses can be different for each of the 'n'
spin-echo
sequences. In these embodiments, for each spin-echo sequence in the 'n' spin-
echo
sequences, the TE values can be different for each of the n spin-echo
sequences. In these
embodiments, a strength of the local magnetic susceptibility gradients can be
determined
based on non-least-squares fitting, exponential fitting for creating maps of
'effective' T2
or R2 values, Principal Component Analysis (PCA), and/or any mathematical
analysis as
is known to be suitable in the art.
In some scenarios, because the radio-frequency field during the first and
second
pulse sequences can lack uniformity, the method can include acquiring
calibration MRI
images from a object which is void of internal susceptibility gradients at
significant levels
(e.g., phantom) and using the calibration MRI images to generate a correction
matrix that
can be applied to each of the MRI images received during the first and second
pulse
11
CA 3047661 2019-06-20
sequences. The correction matrix can be dependent upon the particular RF coil
used
during imaging and on the number of refocus pulses, but typically not on other
parameters such as field of view, acquisition matrix, TR and/or TE. The
calibration can
be performed once for each coil at a range of values for the number of refocus
pulses.
The radio-frequency field variations are typically not sample dependents such
that the
calibration may not be repeated for each scanned object.
Reference is made to Figs. 3A-3B, which show examples of MRI images of a
tissue (e.g., a sample tissue) obtained with a first pulse sequence and a
second pulse
sequence scanned on an MRI device (e.g., an MRI device as manufactured by
Aspect
Imaging), according to some embodiments of the invention. The sample tissue is
a
phantom contained in a test tube with 37 mm length and 10 mm i.d with a small
amount
of magnetite gel in a concentration of 44 [ig iron oxide powder per ml gel.
GRE-derived
phase maps on the sample can indicate that the difference in bulk
susceptibility between
the magnetite and background gels (Ax) is 1.0 ppm. A value of 1.0 ppm can be
viewed at
a high end of values estimated for certain hemorrhagic lesions, for example
compared to
Ax values for hemorrhage being in the range of 0.1-1.5 ppm.
The MRI device can be a permanent magnet MRI device having a field strength at
1.0 Tesla with a vertical Bo field direction (e.g., perpendendicular to a long
axis of
cylindrical sample tubes). The transmit/receive RF coils are solenoids with 35
mm i.d.
In Figs. 3A and 3B, the MRI images are obtained based on a first and second
pulse sequences of a 3-dimensional sequence, an acquisition matrix 64x64x28,
slice
thickness equal to 1.5 mm, field-of-view (FOY) equal to 32 mm, TR equal to 400
ms and
TE equal to 22.4 ms. For Fig. 3A the number of refocus pulses was 'n'=4, and
for FIG.
3B the number of refocus pulses was 'm'=1. For the first pulse sequence of
Fig. 3A, the
inter-echo-delay (TED) is 5.6 ms. Fig. 3A is from the 4th echo in the echo
train of the first
pulse sequence, therefore its TE = 5.6x4 = 22.4 ms, which is identical to the
TE in the
second pulse sequence where 'm'=1.
As shown in Fig. 3A and Fig. 3B, the signal intensity of the magnetite gel (in
which there are substantial internal gradients) is much lower on the 'n' =1
MRI image
(Fig 3A), compared to the 'n'=4 MRI image (Fig. 3B), while the intensity of
the
surrounding gel (in which the gradients are much weaker) is practically
identical. In this
12
CA 3047661 2019-06-20
particular example, the signal intensities are quantitatively comparable
between the two
scans. Thus, an MRI image showing the normalized difference between the two
scans
(dn), can be defined as:
An,-A1
dn = Equation No. 5
An,
Reference is made to Fig. 3C, which shows a desired local susceptibility-
specific
MRI image as determine from the MRI images of Fig. 3A and 3B, according to
some
embodiments of the invention. In Fig. 3C, only regions with sufficiently
strong internal
gradients exhibit dn pixel values (e.g., intensity in a pixel of the MRI
image) which are
larger than 0, while all other regions, regardless of their tissue type,
relaxation times etc.,
-- have MRI image intensities which are close to 0 (e.g., within experimental
uncertainty).
Fig 3C shows an example of an MRI image which is fully equivalent to an
ideally filtered conventional susceptibility-weighted-imaging (SWI) phase map,
with the
distinction that SW1 typically shows blood vessels and hemorrhage as hypo-
intense.
The graph of Fig. 3C is determined by (14- 11)/14, where 14 is the intensity
of the
-- MRI image of FIG. 3A, and Ii is the intensity of the MRI image from 3B.
In some embodiments, the MRI can generate an MR' image mask and weight the
first MRI image of the tissue and the second MRI image of the tissue with
relaxation time
T2 by superimposing of the MRI image mask on the weighted first MRI image of
the
tissue and the second MRI image of the tissue.
Reference is made to Figs. 4A and 4B, which show examples of MR' images of a
tissue (e.g., a sample) obtained with a first pulse sequence and a second
pulse sequence,
according to some embodiments of the invention. The sample includes a phantom
positioned within the MRI to be in a region with very poor Bo homogeneity. In
this
example, the phantom consists of a tube with length of 10 cm, and i.d. of 16
mm. The
-- magnetite gel contains a concentration of 22 [ig iron oxide powder per ml
gel.
In Fig. 4A, the MRI images are obtained with the first pulse sequence of a 2-
dimensional Fast-Spin-Echo sequence, and Fig. 4B the MR' images are obtained
with a
second pulse sequence of a 2-dimensional Spin-Echo sequence.
The MRI images in Fig. 4A and 4B are obtained with first and second pulse
-- sequences having slice thickness equal to 2 mm, field-of-view (FOV) equal
to 50 X 100
mm, acquisition matrix = 128X140, TR equal to 2000 ms and TE equal to 40 ms.
The
13
CA 3047661 2019-06-20
first pulse sequence includes an echo train length = 16, and TED = 5.0ms, and
the second
pulse sequence includes an echo train length = 1 and IED = 40ms. The first
pulse
sequence has a number of refocus pulses 'n'=8, and the second pulse sequence
has a
number of refocus pulses 'm'=1. The phase-encode pattern in the first pulse
sequence is
set such that the center of `k-space' is acquired at the 8th echo, resulting
in an effective
TE of 39.9 ms. In some embodiments, identification of the portion of tissue
can include
identifying a location within the tissue where an effective TE of the first
pulse sequence
and second pulse sequence are identical.
The magnetite gel appears with distinctly different contrast on the two MRI
-- images, and its intensity is much lower on Fig. 4B compared to Fig. 4A.
Fig. 4B shows a
lower part of the MRI image (the regions surrounded by the white rectangles),
which
appears with distortions due to a non-uniformity of the Bo field in this
region of the
magnet (e.g., caused by higher-order background gradients). The appearance of
this
region (e.g., in terms of geometry and intensity) is substantially identical
in Fig. 4A and
Fig. 413. This can indicate that the magnitude of the background gradients was
not big
enough to cause a significant effect and the presence of the magnetite gel is
detectable.
In some embodiments, the magnetite gel can be detected without application of
a high-
pass filter which can be required for the post-processing of conventional SWI
results.
As is apparent to one of ordinary skill in the art, the invention can be
implemented
within any type of MRI device. The MRI device can be any MRI device as is
known in
the art. The MRI device can be a permanent magnet MRI. The MRI device can have
a
field strength at 1.0 Tesla. The MRI device can have a vertical Bo field
direction
(e.g., perpendendicular to a long axis of cylindrical sample tubes). The MRI
device can
be an MRI scanner from Aspect Imaging (Shoham, Isreal). The transmit/receive
RF
-- coils can be solenoids. The transmit/receive RF coils can be solenoids with
35 mm i.d.
Reference is made to Figs. 5A and 5B, which show examples of MRI images of a
tissue (e.g., a sample) obtained with a first pulse sequence and a second
pulse sequence,
according to some embodiments of the invention. The sample includes a
magnetite gel
phantom containing 2.95 tg iron oxide powder per ml gel with a Ax to the
surrounding
background gel of 0.14 ppm, which is approximately equal to the expected
susceptibility
14
CA 3047661 2019-06-20
difference between venous blood and surrounding tissue. The effective TE for
the MRI
images is 28 ms.
Fig. 5A shows an MRI image for a particular slice from the first echo (n=1) of
a
3-dimensional multi-echo SE (MESE) acquisition, using the following
acquisition
parameters: 64x64x13 acquisition matrix, TR=400ms, sampling dwell time=12 s,
FOV=45mm, slice thickness=3.0mm, IED=28ms, total imaging time=5.5 minutes.
Fig.
5B shows an MRI image for a second 3-dimensional MESE acquisition using the
same
parameters, except that in this acquisition IED=5.6ms. The MRI image shows the
same
particular slide of Fig. 5A, reconstructed from the 5th echo ('n'=5).
The magnetite gel (indicated by the white arrow) shows a reduced intensity on
the
MRI image on Fig. 5A compared to its intensity in Fig. 5B, on which it is
barely
distinguishable. The difference is weaker than that seen in Figs. 3A and 3B
which is due
to, for example, a more dilute presence of the iron oxide particles in the
sample of
Figs. 5A and 5B.
In contrast to the results shown in Figs. 3A and 3B, the MRI images in Figs.
5A
and 5B reveal that the intensity of the background gel is not equal for the
scans shown in
parts Fig. 5A and Fig. 5B of the figure. As pointed out by the black arrows,
there are
regions in the sample in which the intensity in Fig. 5B is lower compared to
Fig. 5A.
This can be due to refocus pulse imperfections due to, for example, a non-
uniform B1
field. Such imperfection can be expected to have a stronger effect for echoes
detected
after a higher number of refocus pulses (in this case, 5 refocus pulses in
Fig. 5B vs. a
single refocus pulse in Fig. 5A). In some ebodiments, the intensity difference
in Figs.
5A and 5B, that is not present in Figs. 3A and 3B can be due to the fact that
Figs. 3A and
3B show MRI images of a region that is smaller then the region shown in Figs.
5A and
5B, and closer to the center of a magnet of the MRI device, over which the B1
field is
relatively homogeneous. The MRI images in Figs. 5A and 5B cover an entire
length of
the sample tube, where the edges approach the edges of the RF coil length, and
stronger
variations in B I are expected.
In some embodiments, the method can include performing during in-vivo
applications. Some desirables for in-vivo applications can include good
spatial resolution,
thin and contiguous slices (which can requires 3-dimensional acquisition
protocols),
CA 3047661 2019-06-20
and/or reasonably short scan time, for example, slice thickness of the order
of 2-3 mm,
spatial resolution of the order of 1 mm, and scan times of the oder of 5-10
minutes.
Conventional SWI can use GRE sequences where these requirements are met
without too
much difficulty. SE sequences (particularly their 3-dimensional versions) can
be usually
much more time-consuming to acquire MRI images. One approach for overcoming
this
problem can include the application of various methods of performance time
reduction
such as the use of multiple receive coils and/or compressed sensing. In some
embodiments, a generated pulse sequence can enables rapid (e.g., 5-10 minutes)
acquisition for both the required n= 1, and n=n' scans.
Reference is made to Fig. 6, which shows a pulse sequence for spin echo MRI,
for
implementation of susceptibility imaging spin-echo, according to some
embodiments of
the invention. The pulse sequence can include a preparation portion and a
readout
portion. The preparation portion can include signal 630 (AO) that can follow
an
excitation pulse 610 and a refocus pulse 620. The signal 630 can have a high
sensitivity
to local internal gradients when n=1, and much lower sensitivity to such
gradients when
n=n'. The readout portion can include a rapid, segmented FSE sequence, using
center-
out phase-encoding and minimal TED and TE (e.g., minimal IED and TE can be 5
ms).
In the preparation portion (e.g., between the n=1 and n=n' scans) the
transverse
magnetization is prepared with T2-weighting which has either low sensitivity
(n=n'), or
high sensitivity (n=1) to internal gradients. The prepared protion can be
further refocused
by a FSE train (e.g., repeated 'N' times) for creating 2D or 3D MRI images. In
some
embodiments, in order to, for example, preserve the contrast created by the
preparation,
the FSE sequence can be acquired with center-out phase encoding and an
effective TE
value which is as short as possible. The sequence can be applied in 3D mode,
in which
case the IED in both the preparation and readout parts can be minimized by
using non-
selective rectangular RF pulses.
The sequence shown in Fig. 6 can have the following advantages: first, it can
enable relatively short imaging times even in 3D mode (the acquisition can be
combined
with multiple-coil and compressed sensing for additional savings in scan
time), and
second, the fact that the readout portion of the sequence can be identical for
the n = 1 and
16
CA 3047661 2019-06-20
n = n' acquisitions, which can assure that regions where internal
susceptibility gradients
are small can have the same absolute intensities for both acquisitions.
Unless explicitly stated, the method embodiments described herein are not
constrained to a particular order or sequence.
Additionally, some of the
described method embodiments or elements thereof can occur or be performed
simultaneously, at the same point in time, or concurrently.
Various embodiments have been presented. Each of these embodiments may of
course include features from other embodiments presented, and embodiments not
specifically described may include various features described herein.
17
CA 3047661 2019-06-20