Note : Les descriptions sont présentées dans la langue officielle dans laquelle elles ont été soumises.
FACTORY RISK ESTIMATION USING HISTORICAL INSPECTION DATA
BACKGROUND
[0001] Embodiments of the present disclosure relate to factory risk
estimation, and more
specifically, to factory risk estimation using historical inspection data.
BRIEF SUMMARY
[0002] According to embodiments of the present disclosure, methods of and
computer
program products for factory risk estimation are provided. In various
embodiments, data of a
factory is received, wherein the data comprise historical inspection data of a
factory. A
plurality of features are extracted from the data. The plurality of features
are provided to a
trained classifier. A risk score corresponding to the probability that the
factory will fail to
meet predetermined performance metrics is obtained from the trained
classifier.
[0003] In various embodiments, the data are preprocessed. In various
embodiments,
preprocessing the data comprises aggregating the data. In various embodiments,
pre-
processing the data further comprises filtering the data prior to aggregating.
[0004] In various embodiments, the data further comprise performance history
of the factory.
In various embodiments, the data further comprise geographic information of
the factory. In
various embodiments, the data further comprise ground truth risk scores. In
various
embodiments, the data further comprise product data of the factory. In various
embodiments,
the data span a predetermined time window.
[0005] In various embodiments, providing the plurality of features to the
trained classifier
comprises sending the plurality of features to a remote risk prediction
server, and
Page 1 of 43
CA 3050951 2019-07-31
obtaining from the trained classifier a risk score comprises receiving a risk
score from the risk
prediction server.
[0006] In various embodiments, extracting the plurality of features comprises
removing
features with a low correlation to a target variable. In various embodiments,
extracting the
plurality of features comprises applying a dimensionality reduction algorithm.
In various
embodiments, extracting a plurality of features from the data comprises
applying an artificial
neural network. In various embodiments, applying the artificial neural network
comprises
receiving a first feature vector as input, and outputting a second feature
vector, the second
feature vector having a lower dimensionality than the first feature vector.
[0007] In various embodiments, the risk score is provided to a user. In
various embodiments,
providing the risk score to the user comprises sending the risk score to a
mobile or web
application. In various embodiments, said sending is performed via a wide area
network.
[0008] In various embodiments, the trained classifier comprises an artificial
neural network.
In various embodiments, the trained classifier comprises a support vector
machine. In various
embodiments, obtaining from the trained classifier a risk score comprises
applying a gradient
boosting algorithm.
[0009] In various embodiments, the risk score is related to the probability by
a linear
mapping. In various embodiments, obtaining the risk score comprises applying a
scorecard
model.
[0010] In various embodiments, the performance of the trained classifier is
measured by
comparing the risk score to a ground truth risk score, and parameters of the
trained classifier
are optimized according to the performance. In various embodiments, optimizing
the
parameters of the trained classifier comprises modifying hyperparameters of a
trained
Page 2 of 43
CA 3050951 2019-07-31
machine learning model. In various embodiments, optimizing the parameters of
the trained
classifier comprises replacing a first machine learning algorithm with a
second machine
learning algorithm, the second machine learning algorithm comprising
hyperparameters
configured to improve the performance of the trained classifier.
BRIEF DESCRIPTION OF THE SEVERAL VIEWS OF THE DRAWINGS
[0011] Fig. 1 is a schematic view of an exemplary system for factory risk
estimation
according to embodiments of the present disclosure.
[0012] Fig. 2 illustrates a process for factory risk estimation according to
embodiments of the
present disclosure.
[0013] Fig. 3 illustrates a process for training a factory risk estimation
system according to
embodiments of the present disclosure.
[0014] Fig. 4 illustrates a process for updating a factory risk estimation
system according to
embodiments of the present disclosure.
[0015] Fig. 5 illustrates a process for training a factory risk estimation
system according to
embodiments of the present disclosure.
[0016] Fig. 6 illustrates a process for training a factory risk estimation
system according to
embodiments of the present disclosure.
[0017] Fig. 7 illustrates a process for training a factory risk estimation
system according to
embodiments of the present disclosure.
[0018] Fig. 8 depicts a computing node according to embodiments of the present
disclosure.
Page 3 of 43
CA 3050951 2019-07-31
DETAILED DESCRIPTION
[0019] Factory risk estimation is an important step in assessing potential
manufacturing
partners. Factory risk estimation generally involves the manual application of
statistical
methods on an annual basis. This approach is costly and time consuming, and
fails to provide
timely advice on factory risk.
[0020] To address these and other shortcomings of alternative methods, the
present disclosure
provides a framework for estimating the risk of failure of a factory using
historical inspection
data.
[0021] As used herein, the term risk refers to the probability of a factory
not meeting
predetermined quality and quantity metrics. In other words, risk refers to the
risk that a
manufacturing partner will fail to meet overall performance targets. Such risk
is an important
aspect of evaluation of potential and current manufacturing partners, and is
an important
criterion in deciding what level of oversight must be provided for a given
partner. For
example, a manufacturing partner that is identified as high-risk may require
addition
inspections or other elevated quality control measures. Various factors may
contribute to
overall risk. For example, the chance of injury, chance of equipment failure,
chance of
adverse weather event, chance of unfavorable labor conditions. Potentially
volatile events
such as management changes, a worker strike, or previous bankruptcy may also
contribute to
a factory being classified as high-risk, as might certain work conditions and
tendencies in a
workplace, such as a prolonged lack of inspections, poor production planning,
lack of
leadership commitment to quality, inconsistent quality, a lack of empowerment
within a
quality assurance (QA) team, and lack of automation in the manufacturing
process.
Page 4 of 43
CA 3050951 2019-07-31
[0022] It should be noted that the risk of a manufacturing partner may change
and improve if
it begins to perform well in inspections, e.g., exhibits low failure rate and
consistent quality,
as well as if it improves its machinery, management, or overall quality of the
work
environment.
[0023] In embodiments of the present disclosure, factory risk estimation is
performed by
obtaining data related to a factory, extracting a plurality of features from
the data, providing
the features to a trained classifier, and obtaining from the trained
classifier a risk score
indicative of the probability that the factory will fail to meet predetermined
performance
metrics. In some embodiments, a feature vector is generated and inputted into
the trained
classifier, which in some embodiments comprises a machine learning model.
[0024] In embodiments of the present disclosure, data may be obtained in a
variety of
formats. Data may be structured or unstructured, and may comprise information
stored in a
plurality of media. Data may be inputted manually into a computer, or may be
obtained
automatically from a file via a computer. It will be appreciated that a
variety of methods are
known for obtaining data via a computer, including, but not limited to,
parsing written
documents or text files using optical character recognition, text parsing
techniques (e.g.,
finding key/value pairs using regular expressions), and/or natural language
processing,
scraping web pages, and obtaining values for various measurements from a
database (e.g., a
relational database), XML file, CSV file, or JSON object.
[0025] In some embodiments, factory or inspection data may be obtained
directly from an
inspection management system, or other system comprising a database. In some
embodiments, the inspection management system is configured to store
information related to
factories and/or inspections. The inspection management system may collect and
store
Page 5 of 43
CA 3050951 2019-07-31
various types of information related to factories and inspections, such as
information
pertaining to purchase orders, inspection bookings, assignments, reports,
corrective and
preventive action (CAPA), inspection results, and other data obtained during
inspections. It
will be appreciated that a large set of data may be available, and in some
embodiments, only a
subset of the available data is used for input into a prediction model. The
subset of data may
contain a sufficient number of attributes to successfully predict factory
risk.
[0026] As used herein, an inspection booking refers to a request for a future
inspection to take
place at a proposed date. The inspection booking may be initiated by a vendor,
brand, or
retailer, and may contain information of a purchase order corresponding to the
future
inspection. As used herein, an assignment refers to a confirmed inspection
booking. The
assignment may contain a confirmation of the proposed date of the inspection
booking, as
well as an identification of an assigned inspector and information related to
the booking.
[0027] Data may be obtained via a data pipeline that collects data from
various sources of
factory and inspection data. A data pipeline may be implemented via an
Application
Programming Interface (API) with permission to access and obtain desired data
and calculate
various features of the data. The API may be internally facing, e.g., it may
provide access to
internal databases containing factory or inspection data, or externally
facing, e.g., it may
provide access to factory or inspection data from external brands, retailers,
or factories. In
some embodiments, data are provided by entities wishing to obtain a prediction
result from a
prediction model. The data provided may be input into the model in order to
obtain a
prediction result, and may also be stored to train and test various prediction
models.
[0028] The factory and inspection data may also be aggregated and statistical
analysis may be
performed on the data. According to embodiments of the present disclosure,
data may be
Page 6 of 43
CA 3050951 2019-07-31
aggregated and analyzed in a variety of ways, including, but not limited to,
adding the values
for a given measurement over a given time window (e.g., 7 days, 14 days, 30
days, 60 days,
90 days, 180 days, or a year), obtaining the maximum and minimum values, mean,
median,
and mode for a distribution of values for a given measurement over a given
time window, and
obtaining measures of the prevalence of certain values or value ranges among
the data. For
any feature or measurement of the data, one can also measure the variance,
standard
deviation, skewness, kurtosis, hyperskewness, hypertailedness, and various
percentile values
(e.g., 5%, 10%, 25%, 50%, 75%, 90%, 95%, 99%) of the distribution of the
feature or
measurement over a given time window.
[0029] The data may also be filtered prior to aggregating or performing
statistical or
aggregated analyses. Data may be aggregated by certain characteristics, and
statistical
analysis may be performed on the subset of data bearing the characteristics.
For example, the
above metrics can be calculated for data related only to inspections that
passed or failed,
related to during product (DUPRO) inspections, or to inspections of above a
minimum sample
size.
[0030] Aggregation and statistical analysis may also be performed on data
resulting from
prior aggregation or statistical analysis. For example, the statistical values
of a given
measurement over a given time period may be measured over a number of
consecutive time
windows, and the resulting values may be analyzed to obtain values regarding
their variation
over time. For example, the average inspection fail rate of a factory may be
calculated for
various consecutive 7-day windows, and the change in the average fail rate may
be measured
over the 7-day windows.
Page 7 of 43
CA 3050951 2019-07-31
[0031] In embodiments of the present disclosure, factory data include
information correlated
with a risk score of the factory. Examples of suitable data for predicting the
risk score
include: data obtained from previous inspections at the same factory, data
obtained from
inspections at other factories, data obtained from inspections at other
factories with similar
products or product lines to the factory, data obtained from the factory
across multiple
inspections, data regarding future inspection bookings (e.g., the geographic
location, time,
entity performing the inspection, and/or the type of inspection), data related
to the business
operations of the factory, data related to product quality of the factory,
general information
regarding the factory, data related to the sustainability of the factory or
other similar factories,
and/or data related to the performance of the factory or other similar
factories. The data may
comprise the results of past inspections (e.g., whether the inspection was
passed or not). The
data may comprise information obtained from customer reviews on products or
product lines
similar to those produced by the factory, and/or customer reviews on products
or product lines
originating at the factory. It will be appreciated that for some metrics, a
factory may be
divided into various divisions, with different metrics obtained for each
division.
[0032] Examples of data related to factory risk include: the number of orders
placed at the
factory, the quantity of the orders, the quality of the orders, the monetary
value of the orders,
general information regarding the orders, the description of each product at
the factory, (e.g.,
the product's stock keeping unit (SKU), size, style, color, quantity, and
packaging method),
the financial performance of the factory, the number of inspected items at the
factory, the
number of inspected items at the factory during inspections of procedures such
as
workmanship, packaging, and measurement, information regarding the acceptable
quality
limit (AQL) of processes at the factory (e.g., the sampling number used to
test quality), the
Page 8 of 43
CA 3050951 2019-07-31
inspection results of past inspections at the factory, the inspection results
of past inspections
for a particular product/product line, the inspection results at other
factories with similar
products, the inspection results of past inspections at business partners of
the factory, the
values for various metrics collected over the course of inspections, the
geographic location of
the factory, the factory's size, the factory's working conditions and hours of
operation, and
aggregations and statistical metrics of the aforementioned data.
[0033] As used herein, a product or product line's style refers to a
distinctive appearance of
an item based a corresponding design. A style may have a unique identification
(ID) within a
particular brand, retailer, or factory. Style IDs may be used as an
identifying feature by which
other measurements may be aggregated in order to extract meaningful features
related to
inspection results and risk calculation.
[0034] It will be appreciated that a large number of features may be extracted
by a variety of
methods, such as manual feature extraction, whereby features with a
significant correlation to
the target variable (e.g., the estimated risk score) are calculated or
extracted from the obtained
data. A feature may be extracted directly from the data, or may require
processing and/or
further calculation to be formatted in such a way that the desired metric may
be extracted.
For example, given the results of various inspections at a factory over the
last year, one may
wish to calculate the percentage of failed inspections over the time period.
In some
embodiments, extracting features results in a feature vector, which may be
preprocessed by
applying dimensionality reduction algorithms (such as principal component
analysis and
linear discriminant analysis) or inputting the feature vector into a neural
network, thereby
reducing the vector's size and improving the performance of the overall
system.
Page 9 of 43
CA 3050951 2019-07-31
[0035] In some embodiments, the trained classifier is a random decision
forest. However, it
will be appreciated that a variety of other classifiers are suitable for use
according to the
present disclosure, including linear classifiers, support vector machines
(SVM), gradient
boosting classifiers, or neural networks such as convolutional neural networks
(CNN) or
recurrent neural networks (RNN).
[0036] Suitable artificial neural networks include but are not limited to a
feedforward neural
network, a radial basis function network, a self-organizing map, learning
vector quantization,
a recurrent neural network, a Hopfield network, a Boltzmann machine, an echo
state network,
long short term memory, a bi-directional recurrent neural network, a
hierarchical recurrent
neural network, a stochastic neural network, a modular neural network, an
associative neural
network, a deep neural network, a deep belief network, a convolutional neural
networks, a
convolutional deep belief network, a large memory storage and retrieval neural
network, a
deep Boltzmann machine, a deep stacking network, a tensor deep stacking
network, a spike
and slab restricted Boltzmann machine, a compound hierarchical-deep model, a
deep coding
network, a multilayer kernel machine, or a deep Q-network.
[0037] In some embodiments, an estimated risk score comprises a value in a
specified range,
e.g., a value in the range [0,100]. For example, a factory with perfect
performance that has
never failed an inspection may achieve a score of 0, while a factory with poor
performance
that has failed every inspection may achieve a score of 100. In some
embodiments, the
estimated risk score may be compared against a threshold value, and a binary
value may be
generated, indicating whether the factory is considered to be high-risk or not
(e.g., 0 if the
score is below the threshold, and 1 otherwise). The threshold may be chosen
heuristically, or
may be adaptively calculated during the training of the machine learning
model. In some
Page 10 of 43
CA 3050951 2019-07-31
embodiments, the estimated risk score comprises a vector indicating a
probability for various
types of estimated risk.
[0038] The performance of machine learning models according to embodiments of
the present
disclosure may be tested against new data, and the machine learning model may
be updated in
order to improve its performance. In some embodiments, updating the machine
learning
model comprises modifying hyperparameters of the model. In some embodiments,
updating
the machine learning model comprises using a different machine learning method
than the one
currently used in the model, and modifying the hyperparameters of the
different machine
learning method in order to achieve a desired performance.
[0039] In some embodiments of the present disclosure, a factory is classified
as either high-
performance or low-performance. A factory classified as high-performance has
low risk,
while a factory classified as low-performance has high risk.
[0040] In embodiments of the present disclosure, historical inspection data
from a given time
window are used in estimating the risk of a factory. It will be appreciated
that a variety of
time windows may be used, e.g., three months, six months, nine months, or a
year. In some
embodiments, the evaluation may be updated at a regular frequency, e.g., every
week, every
two weeks, or every month. Obtaining updated risk estimation of factories will
assist brands
and retailers in reducing their potential risk when working with a factory.
[0041] In some embodiments, the predicted risk results are converted to a
corresponding risk
score of the factory, wherein the risk score represents the performance of the
company as of
the risk estimation date. As noted above, overall performance of a factory may
correspond to
the conformity of the factory to predetermined performance criteria, e.g.,
with respect to
volume or quality.
Page 11 of 43
CA 3050951 2019-07-31
[0042] In embodiments of the present disclosure, a machine learning model is
trained by
assembling a training dataset comprising inspection data of factories during a
variety of time
windows, and corresponding performance evaluations for these factories over
their respective
time windows. In some embodiments, the performance evaluations comprise expert
evaluations.
[0043] In some embodiments, the performance evaluations comprise feedback on
previously
estimated risk measurements (e.g, from customers or business partners of the
factory). In
some embodiments, factories are assigned a label indicating whether they are
low-
performance, and thus high-risk, or not, e.g., 1 for high-risk, and 0
otherwise. This data
collection process results in an initial training dataset, to which machine
learning techniques
may be applied to generate an optimal model for predicting factory risk.
[0044] In some embodiments, training the machine learning model comprises a
feature
extraction step. In some embodiments, the selected features to be extracted
have a high
correlation to a target variable. In some embodiments, the number of features
is reduced in
order to reduce the calculation cost in training and deploying the risk
estimation model. In
some embodiments, a number of machine learning methods and classification
approaches are
tested on the training dataset, and a model with the most desired performance
is chosen for
deployment in the risk estimation model. It will be appreciated that a variety
of machine
learning algorithms may be used for risk assessment, including logistic
regression models,
random forest, support vector machines (SVM), deep neural networks, or
boosting methods,
(e.g., gradient boosting, Catboost). The hyperparameters of each model may be
learned to
achieve a desired performance. It will be appreciated that the performance of
a machine
learning model may be measured by different metrics. In some embodiments, the
metrics
Page 12 of 43
CA 3050951 2019-07-31
used to measure the machine learning model's performance comprise accuracy,
precision,
recall, AUC, and/or Fl score.
[0045] In embodiments of the present disclosure, the hyperparameters for
various machine
learning risk estimation models are learned, and the performance of each model
is measured.
In some embodiments, the metrics used to measure the machine learning model's
performance comprise accuracy, precision, recall, AUC, and/or Fl score. In
some
embodiments, the initial dataset is divided into three subsets: a training
dataset, a validation
dataset, and a testing dataset.
[0046] In some embodiments, 60% of the data are used for the training dataset,
20% is used
for the validation set, and the remaining 20% is used for the testing dataset.
In some
embodiments, cross validation techniques are used to estimate the performance
of each risk
estimation model. Performance results may be validated by subjecting the
trained risk
prediction model to new inspection data.
[0047] It will be appreciated that predicting the risk of a factory is useful
in achieving
dynamic, risk-based quality control. For example, given the risk of a
particular inspection or
a particular factory, a specific inspection workflow or template may be
automatically
generated based on the requirements of either the factory or a business
partner of the factory.
The calculated risk may be applied to the critical path or time and action
plan of a purchase
order or style in order to modify the number of inspections required. Based on
the calculated
level of risk of a particular factory, an inspection team may assess whether
they should waive
or confirm an inspection booking. Estimated risk may also be leveraged to make
determinations as to the nature of inspections. For example, for a high risk
factory, the
inspection might be performed via an internal, independent team, while a low
risk factory
Page 13 of 43
CA 3050951 2019-07-31
might have the personnel responsible for the performance of the factory
performing the
inspections themselves.
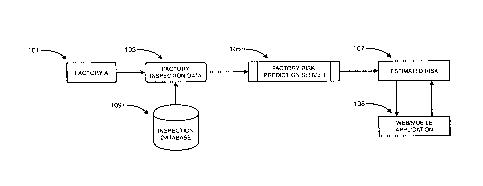
[0048] Referring now to Fig. 1, a schematic view of an exemplary system for
factory risk
estimation according to embodiments of the present disclosure is shown.
Historical factory
inspection data 103 is input into factory risk prediction server 105, and an
estimated risk score
107 is obtained. Factory inspection data 103 may be obtained from factory 101,
from
inspection database 109, or from any combination of sources. The inspection
data may
comprise data related to inspections at the factory, data related to the
performance of the
factory, and/or data related to the factory in general, as discussed above. In
some
embodiments, estimated risk score 107 is sent to mobile or web application
108, where it may
be used for further analysis or decision making. The mobile application may be
implemented
on a smartphone, tablet, or other mobile device, and may run on a variety of
operating
systems, e.g., i0S, Android, or Windows. In various embodiments, estimated
risk score 107
is sent to mobile or web application 108 via a wide area network.
[0049] Referring now to Fig. 2, a process for factory risk estimation
according to
embodiments of the present disclosure is shown. Factory inspection data 210
are input into
factory risk prediction system 220 to obtain predicted risk results 260. In
some embodiments,
the inspection data are obtained from a variety of sources, as discussed
above. In some
embodiments, factory risk prediction system 220 employs a machine learning
model to
estimate the risk associated with a factory. In some embodiments, factory risk
prediction
system 220 is deployed on a server. In some embodiments, the server is a
remote server. In
some embodiments, factory risk estimation process 200 comprises performing
data processing
step 230 on the input factory data. Data processing may comprise various forms
of
Page 14 of 43
CA 3050951 2019-07-31
aggregating the data, obtaining statistical metrics of the data, and
formatting the data in such a
way that features can be extracted from them. In some embodiments, process 200
comprises
performing feature extraction step 240 on the input data to extract various
features. In some
embodiments, feature extraction step 240 is performed on data that has been
processed at step
230. In some embodiments, a feature vector is output. In some embodiments, the
features
extracted at 240 are input into a classifier at 250. In some embodiments, the
classifier
comprises a trained machine learning model. In some embodiments, the
classifier outputs
prediction results 260. In some embodiments, steps 230, 240, and 250 are
performed by
factory risk prediction system 220. The steps of process 200 may be performed
locally to the
factory site, may be performed by a remote server, e.g., a cloud server, or
may be shared
among a local computation device and a remote server.
[0050] Referring now to Fig. 3, a process for training a factory risk
estimation system
according to embodiments of the present disclosure is shown. The steps of
process 300 may
be performed to train a factory risk estimation model. In some embodiments,
the model is
deployed on a prediction server. The steps of process 300 may be performed
locally to the
factory site, may be performed by a remote server, e.g., a cloud server, or
may be shared
among a local computation device and a remote server. At 302, an initial
training dataset is
created. In some embodiments, the training dataset may comprise historical
inspection data of
a large number of factories. The inspection data may be based on the results
of inspections,
and may comprise various values corresponding to various measurements made
during the
inspections, as discussed above. In some embodiments, the training dataset
comprises
evaluation data corresponding to the inspection data of each factory. The
evaluation data may
comprise a performance score within a range of possible scores, a binary score
indicating
Page 15 of 43
CA 3050951 2019-07-31
whether a particular factory passed or failed an inspection, or a number of
scores in various
categories indicating the factory's performance in those categories. In some
embodiments,
the evaluation data comprises expert evaluations. In some embodiments,
inspection and
corresponding evaluation data are timestamped. In some embodiments, the data
for a factory
may be aggregated over a given length of time or number of inspections. In
some
embodiments, the data obtained for a factory are collected only from
inspections during a
given time window.
[0051] It will be appreciated that a well-performing factory may be considered
low-risk,
while a poorly performing factory may be considered high-risk. In some
embodiments, a list
of factories and inspection results may be obtained, with evaluation data as
labels for the
inspection data. For example, in embodiments where the evaluation data are
given as a binary
value, a value of I may indicates that the factory is high risk, and a value
of 0 may indicate
that the factory is low-risk.
[0052] Useful features are then extracted from the initial training dataset.
The extracted
features may correspond to different time windows, e.g., three months, six
months, nine
months, or a year. The importance of each feature in estimating a final risk
result for a
factory is calculated. In some embodiments, the importance of each feature is
calculated by
measuring the feature's correlation with the target label (e.g., the
evaluation data). At 306, a
number of machine learning models are trained on the training dataset, and the
performance
of each model is evaluated. It will be appreciated that acceptable machine
learning models
include a Catboost classifier, a neural network (e.g., a neural network with 4
fully-connected
hidden layers and a ReLU activation function), a decision tree, extreme
boosting machines,
random forest classifier, SVM, and logistic regression, in addition to those
described above.
Page 16 of 43
CA 3050951 2019-07-31
The hyperparameters of each model may be tuned so as to optimize the
performance of the
model. In some embodiments, the metrics used to measure the machine learning
model's
performance comprise accuracy, precision, recall, AUC, or Fl score. The most
useful
features for performing the desired estimation are selected. At 308, the
performance of the
machine learning models are compared. The model with the most desired
performance is
chosen at 310. At 312, the chosen model is deployed onto a prediction server.
[0053] Referring now to Fig. 4, a process for updating a factory risk
estimation system
according to embodiments of the present disclosure is shown. In some
embodiments of
process 400, an existing factory risk prediction model is updated. In some
embodiments,
updating the prediction model comprises inputting new data and modifying the
parameters of
the learning system accordingly to improve the performance of the system. In
some
embodiments, a new machine learning model may be chosen to perform the
estimation. The
factory risk prediction model may be updated at regular intervals, e.g.,
monthly, bimonthly, or
quarterly, or may be updated when a certain amount of new data are
accumulated. It will be
appreciated that an updated risk estimation system provides for more accurate
risk estimation
compared to existing methods.
[0054] In some embodiments, customer feedback on previous prediction results
402 and/or
new data 404 are collected and used to generate a new dataset 406 with labels
corresponding
to the data for each factory. Customer feedback 402 may include ground truth
risk scores
comprising indications of the accuracy of prior predictions, such as which
predictions made
by the prediction model were incorrect, as well as corrected results for the
predictions. The
data obtained from customer feedback may be used to create new labels for the
inspection
data of a factory. New data 404 may comprise new inspection data and
evaluation data for a
Page 17 of 43
CA 3050951 2019-07-31
number of factories. It will be appreciated that new dataset 406 may be
structured in a similar
way to the initial dataset described above. In some embodiments, new dataset
406 is
combined with an existing training dataset 408 to create a new training
dataset 410. In some
embodiments, the performance of the latest version of the trained risk
prediction model 424,
comprising factory risk predictor 412, is measured on the new training
dataset. In some
embodiments, if the performance of the latest version of the trained risk
prediction model 424
and predictor 412 is under a certain threshold, feature re-engineering step
414 is performed,
and/or a new machine learning model 418 is introduced prior to retraining 416.
The threshold
may be chosen heuristically, or may be adaptively calculated during training.
[0055] It will be appreciated that the methods of re-training the prediction
model at 416 may
be similar to those used in initially training the factory risk estimation
model, as described
above. The process of re-training the prediction model may be repeated a
number of times
until the performance of the model on the new training dataset reaches an
acceptable
threshold. In some embodiments, the latest version of the trained risk
prediction model 424 is
updated at 420 with the new model trained at 416. The updated risk prediction
model may
then be deployed on prediction server 422. Existing training dataset 408 may
also be updated
to reflect the newly obtained data.
[0056] Referring now to Figs. 5-7, various processes for training factory risk
estimation
systems according to embodiments of the present disclosure are shown. In
various
embodiments of the present disclosure, generating a trained risk estimation
system comprises
four primary steps: data collection, feature extraction, model training, and
risk prediction. In
some embodiments, data collection comprises creating an initial training
dataset using the
methods described above. In some embodiments, feature extraction comprises
extracting a
Page 18 of 43
CA 3050951 2019-07-31
number of useful features from the initial training dataset. The features
extracted may be a
subset of a larger number of features that may be extracted from the initial
training dataset. In
some embodiments, the importance of each feature to the risk prediction
calculation is
measured. In some embodiments, the features with the least relevance to the
prediction
calculation are not used in the risk prediction model. In some embodiments,
determining the
relevance of a feature to the prediction calculation comprises measuring the
correlation of the
feature with the risk prediction results. In some embodiments, a fixed number
of features are
extracted. In some embodiments, the feature extraction step comprises manual
feature
extraction. In some embodiments, a dimensionality reduction technique (e.g.,
principal
component analysis or linear discriminant analysis) may be applied to the
extracted features.
In some embodiments, the extracted features are passed through a neural
network, resulting in
a feature vector with reduced dimensions. Model training comprises measuring
the
performance of a number of machine learning models on the extracted features.
The model
with the most desired performance may be selected to perform risk prediction.
[0057] Referring now to Fig. 5, a process for training a factory risk
estimation system
according to embodiments of the present disclosure is shown. In some
embodiments, manual
feature extraction 502 is performed on an initial training dataset 501
comprising factory
inspection data. Features may be extracted for each factory, or for various
divisions within
factories, in the manner described above. Features may be extracted based on
inspection data
during a specific time window (e.g., one year). In some embodiments, a feature
vector
corresponding to each factory's inspection data are generated from the feature
extraction step.
In some embodiments, a label is assigned to each feature vector. In some
embodiments, the
labels are obtained from the initial training dataset 501. In some
embodiments, the label is a
Page 19 of 43
CA 3050951 2019-07-31
binary value indicating whether the factory is high-risk or low-risk. In some
embodiments,
the risk estimation of a factory is transformed into a binary classification
problem, wherein a
factory can be classified as high risk or not high risk. These categories
correspond to a
factory that has low-performance and high-performance, respectively. Various
machine
learning models (e.g., support vector machine, decision tree, random forest,
or neural
networks) and boosting methods (e.g., Catboost or XGBoost) may be tested at
503 on the
initial training dataset.
[0058] In training the various machine learning models and boosting methods,
the initial
training dataset may be divided into a training dataset and a testing dataset.
For example,
80% of the initial training dataset can be used to create a training dataset,
and the remaining
20% is used to form a testing dataset. In some embodiments, the initial
training dataset may
be divided into a training dataset, a testing dataset, and a validation
dataset. In some
embodiments, the hyper-parameters of the machine learning models and boosting
methods are
tuned to achieve the most desired performance. The model with the most desired
performance may then be selected to provide risk estimation on input factory
data. In some
embodiments, the selected model is deployed onto a prediction server to
providing for future
risk predictions.
[0059] In some embodiments of the present disclosure, a feature vector is
calculated from
inspection data for a factory. The feature vector is input into a risk
prediction model and a
predicted risk probability is obtained. The probability may be compared with a
given
threshold to determine whether the factory should be classified as high-risk
or not. In some
embodiments, a factory is considered high-risk if the predicted probability is
greater than or
equal to the threshold. In some embodiments, a risk score is obtained based on
the calculated
Page 20 of 43
CA 3050951 2019-07-31
probability. In some embodiments, the risk score is a function of the average
fail rate of
inspections at the factory. In some embodiments, the risk score comprises a
value in a
predetermined range, e.g., [0, 100]. For example, a factory with perfect
performance that has
never failed an inspection may achieve a score of 0, while a factory with poor
performance
that has failed every inspection may achieve a score of 100. In some
embodiments, testing
the risk prediction model comprises comparing the predicted risk scores and/or
the
classification of the factory as high-risk with known data.
[0060] In some embodiments, a risk score R is obtained based on the calculated
probability p
using the following procedure.
[0061] A range [A, B] defining the upper and lower bounds of the risk score is
chosen. For
example, one may consider the risk score R to be within the range [0, 100],
where R = 0
represents a lowest possible risk of a factory (e.g., the factory has perfect
performance with no
failed inspections during a given time window), and R = 100 represents a
highest possible
risk of a factory (e.g., the factory has failed all of its inspections and has
poor performance).
Given that the predicted probability p is within the unit interval [1, 0], one
can determine a
mapping F to assign a predicted probability to a corresponding risk score R:
F: [0, 1] ¨) [A, B]
Equation 1
[0062] For a given p,
F (p) = p -4 R
Equation 2
Page 21 of 43
CA 3050951 2019-07-31
[0063] F is chosen such that F(0) = A and F(1) = B. For example, a linear
mapping may be
used:
F(p) = Ax p + (1 ¨ p) x B
Equation 3
[0064] In some embodiments, a risk score R may be calculated by using a
scorecard model as
follows:
[0065] A machine learning technique is applied to a training dataset to obtain
a list L =
f f3, fN), wherein each fi corresponds to a feature related to the value
being
predicted. Next, one can perform a binning process to transform a numerical
feature in the
list L into a categorical value, wherein multiple attributes are grouped
together under one
value, and categorical features may be regrouped and consolidated. It will be
appreciated that
grouping similar attributes with similar predictive strengths may increase the
accuracy of a
prediction model. For example, one extracted feature from the training dataset
may be the
average failed inspection rate of a factory during the last 180 days. As the
extracted feature is
an average rate of success, it may take on a value in the unit interval [0,
1]. By applying a
binning process to the feature values, the feature may be transformed from a
numerical feature
to a categorical feature. For example, one may transform the values into one
of the following
groups:
a) Less than 2%
b) [2%, 5%)
c) [5%, 10%)
d) [10%, 15%)
Page 22 of 43
CA 3050951 2019-07-31
e) 15% or greater.
[0066] For example, if a factory had a 3.4% average failed inspection rate, it
would be
assigned to group (b). In this way, continuous and discrete feature values may
be categorized
into a number of categories.
[0067] Weight of Evidence (WOE) may be calculated for each category, and may
replace the
categorical values for later calculations. WOE is a measure of the logarithm
of the ratio of
favorable events to unfavorable events, and measures the predictive strength
of an attribute of
a feature in differentiating between high-performance factories from low-
performance
factories. For each feature, one may also obtain the Information Value (IV) of
each group.
IV is a measure of the sum of differences between the percentages of
unfavorable events and
favorable events, multiplied by the WOE. IV is a useful metric for determining
the
importance of variables in a predictive model. It will be appreciated that
during the feature
engineering phase, the IV may be calculated for each feature in the list L to
verify that the
features have good information values, and thus, are relevant to the
prediction problem.
[0068] Using all of the features tf1,f2, f3, === fN), a suitable logistic
regression model may be
trained to classify factories as either high-performance or low-performance,
and regression
coefficients W1,1%, /33, ..., igN) and intercept term a corresponding to each
feature may be
obtained. Finally, for each fi in the list L, a corresponding score point may
be calculated
using the following formula, where Ki is the number of groups of attributes in
the feature f,
N is the number of the (most important) features chosen, WoEj is the Weight of
Evidence
value of the j-th group of attributes in the feature f, determined in the
binning process, and
Factor and Offset are the scaling parameters to make sure the final score is
within a chosen
range.
Page 23 of 43
CA 3050951 2019-07-31
Ki
a Offset
Score(f1) = 1¨[WoEj x + ¨Nix Factor + _____________________
j=1
Equation 4
[0069] Finally, the risk score of a factory may be calculated as the sum of
all of the scores of
the features
Risk Score = 1Score(fi)
1=1
Equation 5
[0070] Referring now to Fig. 6, a process for training a factory risk
estimation system
according to embodiments of the present disclosure is shown. In some
embodiments, features
are obtained from inspection data 601 of a factory using manual feature
extraction 602. It will
be appreciated that feature extraction may result in a large number of
extracted features for
each factory, and thus, large feature vectors. The number of features
extracted may number in
the hundreds. Reducing the dimensionality of the feature vectors may result in
more efficient
training, deployment, and operation of the prediction model. In some
embodiments, the
dimensionality of a feature vector is reduced at 603 by calculating the
correlation of each
feature to the target variable, and only keeping those features with high
correlation to the
target variable. In some embodiments, the dimensionality of a feature vector
is reduced at
603 by applying a dimensionality reduction algorithm to the vector, such as
principal
component analysis (PCA) or linear discriminant analysis (LDA). In some
embodiments, the
features computed in the resulting smaller-dimension vectors for a number of
factories are
Page 24 of 43
CA 3050951 2019-07-31
input into various machine learning and/or gradient boosting models at 604,
and the model
with the most desired performance is selected, as described above.
[0071] Referring now to Fig. 7, a process for training a factory risk
estimation system
according to embodiments of the present disclosure is shown. In some
embodiments, features
are obtained from inspection data 701 using manual feature extraction 702. In
some
embodiments, the feature extraction step results in a feature vector. In some
embodiments,
the feature vector is input into a neural network at 703. In some embodiments,
the neural
network comprises a deep neural network. In some embodiments, the neural
network
comprises an input layer, a number of fully-connected hidden layers, and an
output later with
a predetermined activation function. In some embodiments, the activation
function comprises
a ReLU or sigmoid activation function, although it will be appreciated that a
variety of
activation functions may be suitable. The output of the neural network may be
considered as
a new feature vector, and may be input into various machine learning models at
704 using
similar steps to those described above. In some embodiments, the new feature
vector is of
smaller dimensionality than the input feature vector.
[0072] Table 1 lists a number of features that may be extracted from
inspection data of a
factory using the methods described above. In various exemplary embodiments,
gradient
boosting on decision trees is applied, for example using Catboost. In
exemplary embodiments
of the present disclosure, these features have high correlation with the
target variable.
The standard deviation of failed inspection rate of the factory during the
last one year
The average inspection fail rate of the factory among all inspections during
the last one year
Page 25 of 43
CA 3050951 2019-07-31
The difference, in number of days, between the first failed inspection date
and the evaluation
date over a time window of the last one year
The average of order quantity for an inspection during last 90 days
The geographic location of the factory (e.g., country, city, office)
The difference, in number of days, between the latest failed inspection date
and the evaluation
date over a time window of the last one year
The average failed inspection rate of the factory during the last 180 days
The percentage of During Production Check (DUPRO) inspections failed during
the last one
year
The maximum defective product rate of the factory during the measurement
process during the
last 180 days
The average number of product items in one failed inspection during the last
180 days
The standard deviation of the defective product rate of the factory during the
measurement
process during the last 180 days
The average number of product items in one failed inspection during the last
one year
The percentage of DUPRO inspections failed due to a failure of the packaging
procedure during
the last one year
The maximum number of units ordered in a passed inspection during the last one
year
The standard deviation of order size during the last 180 days
The maximum order quantity during the last year
The standard deviation of the local defect score of the factory in workmanship
during the last
one year
Page 26 of 43
CA 3050951 2019-07-31
The standard deviation of the defective rate during the measurement process of
an inspection of
the factory during the last 1 year
The percentage of Final Random Inspection (FRI) inspections failed during the
last one year
The maximum value of the measurement defective rate of the factory during last
90 days
The percentage of DUPRO inspections failed by the workmanship during the last
one year
The difference, in days, between the latest inspection date and the evaluation
date
The minimum value of the local major defect score in workmanship during the
last one year
The total number of DUPRO inspections failed during the last one year
The minimum value of the factory local defect score in workmanship during the
last one year
The total number of FRI inspections failed during the last one year
The percentage of failed DUPRO inspections with different sample sizes during
the last one year
Table 1
[0073] It will be appreciated that a variety of additional features and
statistical measures may
be used in accordance with the present disclosure.
[0074] Referring now to Fig. 8, a schematic of an example of a computing node
is shown.
Computing node 10 is only one example of a suitable computing node and is not
intended to
suggest any limitation as to the scope of use or functionality of embodiments
described
herein. Regardless, computing node 10 is capable of being implemented and/or
performing
any of the functionality set forth hereinabove.
[0075] In computing node 10 there is a computer system/server 12, which is
operational with
numerous other general purpose or special purpose computing system
environments or
configurations. Examples of well-known computing systems, environments, and/or
Page 27 of 43
CA 3050951 2019-07-31
configurations that may be suitable for use with computer system/server 12
include, but are
not limited to, personal computer systems, server computer systems, thin
clients, thick clients,
handheld or laptop devices, multiprocessor systems, microprocessor-based
systems, set top
boxes, programmable consumer electronics, network PCs, minicomputer systems,
mainframe
computer systems, and distributed cloud computing environments that include
any of the
above systems or devices, and the like.
[0076] Computer system/server 12 may be described in the general context of
computer
system-executable instructions, such as program modules, being executed by a
computer
system. Generally, program modules may include routines, programs, objects,
components,
logic, data structures, and so on that perform particular tasks or implement
particular abstract
data types. Computer system/server 12 may be practiced in distributed cloud
computing
environments where tasks are performed by remote processing devices that are
linked through
a communications network. In a distributed cloud computing environment,
program modules
may be located in both local and remote computer system storage media
including memory
storage devices.
[0077] As shown in Fig. 8, computer system/server 12 in computing node 10 is
shown in the
form of a general-purpose computing device. The components of computer
system/server 12
may include, but are not limited to, one or more processors or processing
units 16, a system
memory 28, and a bus 18 that couples various system components including
system memory
28 to processor 16.
[0078] Bus 18 represents one or more of any of several types of bus
structures, including a
memory bus or memory controller, a peripheral bus, an accelerated graphics
port, and a
processor or local bus using any of a variety of bus architectures. By way of
example, and not
Page 28 of 43
CA 3050951 2019-07-31
limitation, such architectures include Industry Standard Architecture (ISA)
bus, Micro
Channel Architecture (MCA) bus, Enhanced ISA (EISA) bus, Video Electronics
Standards
Association (VESA) local bus, Peripheral Component Interconnect (PCI) bus,
Peripheral
Component Interconnect Express (PCIe), and Advanced Microcontroller Bus
Architecture
(AMBA).
[0079] Computer system/server 12 typically includes a variety of computer
system readable
media. Such media may be any available media that is accessible by computer
system/server
12, and it includes both volatile and non-volatile media, removable and non-
removable media.
[0080] System memory 28 can include computer system readable media in the form
of
volatile memory, such as random access memory (RAM) 30 and/or cache memory 32.
Computer system/server 12 may further include other removable/non-removable,
volatile/non-volatile computer system storage media. By way of example only,
storage
system 34 can be provided for reading from and writing to a non-removable, non-
volatile
magnetic media (not shown and typically called a "hard drive"). Although not
shown, a
magnetic disk drive for reading from and writing to a removable, non-volatile
magnetic disk
(e.g., a "floppy disk"), and an optical disk drive for reading from or writing
to a removable,
non-volatile optical disk such as a CD-ROM, DVD-ROM or other optical media can
be
provided. In such instances, each can be connected to bus 18 by one or more
data media
interfaces. As will be further depicted and described below, memory 28 may
include at least
one program product having a set (e.g., at least one) of program modules that
are configured
to carry out the functions of embodiments of the disclosure.
[0081] Program/utility 40, having a set (at least one) of program modules 42,
may be stored in
memory 28 by way of example, and not limitation, as well as an operating
system, one or
Page 29 of 43
CA 3050951 2019-07-31
more application programs, other program modules, and program data. Each of
the operating
system, one or more application programs, other program modules, and program
data or some
combination thereof, may include an implementation of a networking
environment. Program
modules 42 generally carry out the functions and/or methodologies of
embodiments as
described herein.
[0082] Computer system/server 12 may also communicate with one or more
external devices
14 such as a keyboard, a pointing device, a display 24, etc.; one or more
devices that enable a
user to interact with computer system/server 12; and/or any devices (e.g.,
network card,
modem, etc.) that enable computer system/server 12 to communicate with one or
more other
computing devices. Such communication can occur via Input/Output (I/O)
interfaces 22. Still
yet, computer system/server 12 can communicate with one or more networks such
as a local
area network (LAN), a general wide area network (WAN), and/or a public network
(e.g., the
Internet) via network adapter 20. As depicted, network adapter 20 communicates
with the
other components of computer system/server 12 via bus 18. It should be
understood that
although not shown, other hardware and/or software components could be used in
conjunction
with computer system/server 12. Examples, include, but are not limited to:
microcode, device
drivers, redundant processing units, external disk drive arrays, RAID systems,
tape drives, and
data archival storage systems, etc.
[0083] The present disclosure may be embodied as a system, a method, and/or a
computer
program product. The computer program product may include a computer readable
storage
medium (or media) having computer readable program instructions thereon for
causing a
processor to carry out aspects of the present disclosure.
Page 30 of 43
CA 3050951 2019-07-31
[0084] The computer readable storage medium can be a tangible device that can
retain and
store instructions for use by an instruction execution device. The computer
readable storage
medium may be, for example, but is not limited to, an electronic storage
device, a magnetic
storage device, an optical storage device, an electromagnetic storage device,
a semiconductor
storage device, or any suitable combination of the foregoing. A non-exhaustive
list of more
specific examples of the computer readable storage medium includes the
following: a portable
computer diskette, a hard disk, a random access memory (RAM), a read-only
memory
(ROM), an erasable programmable read-only memory (EPROM or Flash memory), a
static
random access memory (SRAM), a portable compact disc read-only memory (CD-
ROM), a
digital versatile disk (DVD), a memory stick, a floppy disk, a mechanically
encoded device
such as punch-cards or raised structures in a groove having instructions
recorded thereon, and
any suitable combination of the foregoing. A computer readable storage medium,
as used
herein, is not to be construed as being transitory signals per se, such as
radio waves or other
freely propagating electromagnetic waves, electromagnetic waves propagating
through a
waveguide or other transmission media (e.g., light pulses passing through a
fiber-optic cable),
or electrical signals transmitted through a wire.
[0085] Computer readable program instructions described herein can be
downloaded to
respective computing/processing devices from a computer readable storage
medium or to an
external computer or external storage device via a network, for example, the
Internet, a local
area network, a wide area network and/or a wireless network. The network may
comprise
copper transmission cables, optical transmission fibers, wireless
transmission, routers,
firewalls, switches, gateway computers and/or edge servers. A network adapter
card or
network interface in each computing/processing device receives computer
readable program
Page 3 1 of 43
CA 3050951 2019-07-31
instructions from the network and forwards the computer readable program
instructions for
storage in a computer readable storage medium within the respective
computing/processing
device.
[0086] Computer readable program instructions for carrying out operations of
the present
disclosure may be assembler instructions, instruction-set-architecture (ISA)
instructions,
machine instructions, machine dependent instructions, microcode, firmware
instructions,
state-setting data, or either source code or object code written in any
combination of one or
more programming languages, including an object oriented programming language
such as
Smalltalk, C++ or the like, and conventional procedural programming languages,
such as the
"C" programming language or similar programming languages. The computer
readable
program instructions may execute entirely on the user's computer, partly on
the user's
computer, as a stand-alone software package, partly on the user's computer and
partly on a
remote computer or entirely on the remote computer or server. In the latter
scenario, the
remote computer may be connected to the user's computer through any type of
network,
including a local area network (LAN) or a wide area network (WAN), or the
connection may
be made to an external computer (for example, through the Internet using an
Internet Service
Provider). In some embodiments, electronic circuitry including, for example,
programmable
logic circuitry, field-programmable gate arrays (FPGA), or programmable logic
arrays (PLA)
may execute the computer readable program instructions by utilizing state
information of the
computer readable program instructions to personalize the electronic
circuitry, in order to
perform aspects of the present disclosure.
[0087] Aspects of the present disclosure are described herein with reference
to flowchart
illustrations and/or block diagrams of methods, apparatus (systems), and
computer program
Page 32 of 43
CA 3050951 2019-07-31
products according to embodiments of the disclosure. It will be understood
that each block of
the flowchart illustrations and/or block diagrams, and combinations of blocks
in the flowchart
illustrations and/or block diagrams, can be implemented by computer readable
program
instructions.
[0088] These computer readable program instructions may be provided to a
processor of a
general purpose computer, special purpose computer, or other programmable data
processing
apparatus to produce a machine, such that the instructions, which execute via
the processor of
the computer or other programmable data processing apparatus, create means for
implementing the functions/acts specified in the flowchart and/or block
diagram block or
blocks. These computer readable program instructions may also be stored in a
computer
readable storage medium that can direct a computer, a programmable data
processing
apparatus, and/or other devices to function in a particular manner, such that
the computer
readable storage medium having instructions stored therein comprises an
article of
manufacture including instructions which implement aspects of the function/act
specified in
the flowchart and/or block diagram block or blocks.
[0089] The computer readable program instructions may also be loaded onto a
computer,
other programmable data processing apparatus, or other device to cause a
series of operational
steps to be performed on the computer, other programmable apparatus or other
device to
produce a computer implemented process, such that the instructions which
execute on the
computer, other programmable apparatus, or other device implement the
functions/acts
specified in the flowchart and/or block diagram block or blocks.
[0090] The flowchart and block diagrams in the Figures illustrate the
architecture,
functionality, and operation of possible implementations of systems, methods,
and computer
Page 33 of 43
CA 3050951 2019-07-31
program products according to various embodiments of the present disclosure.
In this regard,
each block in the flowchart or block diagrams may represent a module, segment,
or portion of
instructions, which comprises one or more executable instructions for
implementing the
specified logical function(s). In some alternative implementations, the
functions noted in the
block may occur out of the order noted in the figures. For example, two blocks
shown in
succession may, in fact, be executed substantially concurrently, or the blocks
may sometimes
be executed in the reverse order, depending upon the functionality involved.
It will also be
noted that each block of the block diagrams and/or flowchart illustration, and
combinations of
blocks in the block diagrams and/or flowchart illustration, can be implemented
by special
purpose hardware-based systems that perform the specified functions or acts or
carry out
combinations of special purpose hardware and computer instructions.
[0091] The descriptions of the various embodiments of the present disclosure
have been
presented for purposes of illustration, but are not intended to be exhaustive
or limited to the
embodiments disclosed. Many modifications and variations will be apparent to
those of
ordinary skill in the art without departing from the scope and spirit of the
described
embodiments. The terminology used herein was chosen to best explain the
principles of the
embodiments, the practical application or technical improvement over
technologies found in
the marketplace, or to enable others of ordinary skill in the art to
understand the embodiments
disclosed herein.
Page 34 of 43
CA 3050951 2019-07-31