Note : Les descriptions sont présentées dans la langue officielle dans laquelle elles ont été soumises.
1
Method and System for Locatino an Acoustic Source
Technical Field
The present invention relates to the field of locating acoustic sources and
provides a method and a system for locating acoustic sources in which a
plurality
of acoustic sensors are distributed in space and acoustic signals received at
the
plurality of acoustic sensors are processed in order to determine the position
of
the acoustic source. In a particular embodiment, the plurality of acoustic
sensors
is provided in a distributed optical fibre sensor.
Background to the Invention
There are many applications in which it is desirable to determine, with
accuracy,
the location of an acoustic source. For example, in the fracturing of oil or
gas-
bearing shale by injecting water and chemicals under high pressure (hydraulic
fracturing or "fracking") acoustic energy is produced and it is advantageous
to
know the positions at which these acoustic events take place.
Conventional sensor systems include acoustic arrays of hydrophones or
geophones, commonly termed 'passive seismic' or 'micro seismic' detectors, and
are typically deployed either in linear form inserted into a borehole within a
few
hundred metres of the point of injection of fracturing fluids, or in the form
of a two
dimensional grid on or just below the surface adjacent to the injection point.
A
(imitation of this prior art is that the number of sensors that may be
deployed is
limited at typically less than one hundred, and their spatial locations are
either
constant or may only be changed by laborious and time-consuming re-
deployment of the sensor array.
Another important application is in security applications such as intruder
detection. It is desirable to detect breaching of a perimeter fence, sabotage
or
illegal tapping of oil and gas pipelines. Each of these events will result in
an
acoustic signal being produced which, if detected, would allow an alarm to be
raised. In this case, in detecting an acoustic event knowledge of position is
also
desirable. However, the strength of an acoustic source is usually unknown and
so the strength of a signal as detected by an acoustic sensor is not a
reliable
CA 3055030 2019-09-11
2
indicator of the distance between the source and the sensor and therefore of
position.
It is therefore an object of at least one embodiment of the present invention
to
provide a method of locating an acoustic source that obviates or mitigates one
or
more said limitations of the prior art.
Summary of the Invention
According to a first aspect of the present invention, there is provided a
method of
determining the location of an acoustic source, the method comprising:
providing a plurality of acoustic sensors;
receiving an acoustic signal from the acoustic source at the plurality of
acoustic sensors; and
processing the received acoustic signals to determine the location of the
acoustic source relative to at least one of the acoustic sensors.
The present invention provides a method for the measurement of the position of
an acoustic source in the vicinity of a plurality of acoustic sensors. The
skilled
person will also realise that the present invention is also able to determine
the
position of several acoustic sources simultaneously, by measuring the several
acoustic signals at the plurality of acoustic sensors.
Most preferably, providing a plurality of acoustic sensors comprises providing
a
distributed optical fibre sensor. A distributed optical fibre sensor acts like
a string
of discrete acoustic sensors, and provides several advantages including
coherence between the discrete acoustic measurements. Most preferably the
distributed optical fibre sensor employs an interferometer arrangement such as
described in further detail below. It is also envisaged that distributed
optical fibre
sensors employing coherent Rayleigh noise methodologies may be utilised. It is
also envisaged that a plurality of independent, synchronised, point sensors
would
allow realisation of the invention.
CA 3055030 2019-09-11
3
In one preferred embodiment of the invention, processing the received acoustic
signals comprises determining a plurality of loci data, each loci data
comprising
the position of a corresponding acoustic sensor and the time of arrival of the
acoustic signal at the respective acoustic sensor, and determining the
location of
the acoustic source by determining a fit between the loci data and a
predetermined relationship between source position and loci data.
In an alternative preferred embodiment of the invention, processing the
received
acoustic data comprises evaluating a plurality of cost functions by cross-
correlating the received acoustic signals with one or more received acoustic
signals delayed according to a pre-determined relationship between source
position and acoustic sensor position, and selecting a maximum cost function
from the plurality.
Most preferably, processing the received acoustic signals comprises
determining
a delay between the acoustic signals received at two different acoustic
sensors.
Optionally, processing the received acoustic signals comprises determining the
relative phase between the acoustic signals received at two different acoustic
sensors. Preferably, a plurality of delays is determined between a
corresponding
plurality of pairs of acoustic sensors. Based on the known positions of the
acoustic sensors, the location of the acoustic source can be determined based
on the at least one determined delay.
Preferably, the method further comprises identifying the acoustic sensor that
is
closest to the acoustic source. Optionally the acoustic sensor closest to the
acoustic source is determined by comparison of a plurality of delays.
Yet further alternatively, the method comprises correlating received acoustic
signals from adjacent acoustic sensors. Preferably, the acoustic sensor
closest
to the acoustic source is determined by determining a minimum correlation
between received acoustic signals from adjacent acoustic sensors.
Preferably, the method comprises determining a distance between the acoustic
source and the acoustic sensor that is closest to the acoustic source.
Alternatively, the distance is determined by comparing the delay between the
acoustic signal received at the acoustic sensor that is closest to the
acoustic
CA 3055030 2019-09-11
4
source and the acoustic signal received at one or more other acoustic sensors.
Optionally, the distance is determined by determining a first distance
relating to
the acoustic sensors on a first side of the acoustic sensor that is closest to
the
acoustic source, determining a second distance based on the acoustic sensors
on a second side of the acoustic sensor that is closest to the acoustic
source,
and calculating a mean. The mean may be weighted.
Optionally, providing a plurality of acoustic sensors comprises arranging the
acoustic sensors in one or more straight lines.
Alternatively, and
advantageously, providing a plurality of acoustic sensors comprises arranging
the
acoustic sensors in a two-dimensional geometry. For example, a circle, square,
grid, triangle, serpentine line or other non-linear arrangement. Most
preferably,
the acoustic sensors are arranged around an event or an item to be Monitored.
In one embodiment the processing that is performed comprises separating the
received acoustic signals into their component frequencies and determining the
location in dependence on at least one (or more) of the component frequencies
and the known speed of sound for that frequency through the surrounding
medium. This provides advantages that it then becomes possible to account for
local dispersion characteristics in the area being monitored, without
requiring
extensive and laborious calibration of the system upon installation. Instead,
a
frequency is used the speed of sound for which is known from a priori
dispersion
measurements.
Within the above embodiment the processing further comprises evaluating a
plurality of cost functions that relate acoustic sensor position to source
position in
dependence on the respective time delays experienced by component
frequencies of the received acoustic signal; and determining a cost function
indicative of the distance to the source position. Hence, it becomes possible
to
determine distance to the source taking into account local dispersion
conditions
across a number of frequencies, which should improve accuracy.
According to a second aspect of the present invention, there is provided a
method of monitoring a hydraulic fracturing process comprising the method of
the
first aspect.
CA 3055030 2019-09-11
S
Optionally, the method comprises deploying a distributed optical fibre sensor
in
the vicinity of oil- or gas-bearing shale to be fractured by the hydraulic
fracturing
process.
Optionally, the method comprises injecting water and/or chemicals into the oil-
or
gas-bearing shale and determining the location of at least one resulting
acoustic
event.
Embodiments of this aspect of the invention may comprise preferred and
optional
features of other aspects of the invention, and vice versa.
According to a third aspect of the present invention, there is provided a
surveillance method comprising the method of the first aspect. This method may
be employed to monitor an asset such as an oil or gas pipeline.
Optionally, the method comprises deploying a distributed optical fibre sensor
in
the vicinity of an asset or location to be monitored. Optionally, the
distributed
optical fibre sensor is deployed on or along the asset, or around the
location.
Advantageously, the method comprises burying the distributed optical fibre
sensor. Alternatively, or advantageously, the distributed fibre sensor is
deployed
in a predetermined geometric configuration.
Optionally, the method comprises correlating the determined position of an
acoustic source with one or more position related data. For example, the
position
of the acoustic source could be overlaid on a corresponding map of an area
being monitored.
The nature of the acoustic source may be determined as a function of the
duration of a corresponding acoustic event, the frequency of the acoustic
signal,
and/or the amplitude of the acoustic event.
Optionally, the method comprises sounding an alarm, or providing an alert,
dependent on one or more measured characteristics of the acoustic signal. For
example, the measured position of the acoustic source with respect to the
acoustic sensor can be used to determine the spatial relationship between the
source and an asset to be protected and an alarm or alert produced responsive
CA 3055030 2019-09-11
6
to a determination that the spatial relationship corresponds to a threat (or
perceived threat) to the asset.
Embodiments of this aspect of the invention may comprise preferred and
optional
features of other aspects of the invention, and vice versa.
According to a fourth aspect of the present invention, there is provided a
computer readable medium comprising computer code which, when executed on
a computer, causes the computer to perform the method of any preceding
aspect.
The computer readable medium may be volatile or non-volatile, contained in
RAM, ROM, firmware or otherwise, and the fourth aspect shall be understood to
extend to transient copies of said computer code.
According to a fifth aspect of the present invention, there is provided an
apparatus for locating an acoustic source, the apparatus comprising:
a plurality of acoustic sensors arranged to receive an acoustic signal from
the acoustic source; and
processing means configured to process the received acoustic signals to
determine the location of the acoustic source relative to at least one of the
acoustic sensors.
Most preferably, the plurality of acoustic sensors comprises at least one
distributed optical fibre sensor. A distributed optical fibre sensor acts like
a string
of discrete acoustic sensors, and provides several advantages including
coherence between the discrete acoustic measurements. Most preferably the
distributed optical fibre sensor employ's an interferometer arrangement such
as
described in further detail below. It is also envisaged that distributed
optical fibre
sensors employing coherent Rayleigh noise methodologies may be utilised. It is
also envisaged that a plurality of independent, synchronised, point sensors
would
allow realisation of the invention.
Most preferably, the processing means is configured to determine a delay
between acoustic signals received at two different acoustic sensors.
Optionally,
CA 3055030 2019-09-11
7
the processing means is configured to determine the relative phase between the
acoustic signals received at two different acoustic sensors. Preferably, the
processing means is configured to determine a plurality of delays between a
corresponding plurality of pairs of acoustic sensors.
Preferably, the processing means is configured to determine the acoustic
sensor
that is closest to the acoustic source.
Preferably, the processing means is configured to determine a distance between
the acoustic source and the acoustic sensor that is closest to the acoustic
source.
Optionally, the plurality of acoustic sensors are arranged in one or more
straight
lines. Alternatively, and advantageously, the acoustic sensors are arranged in
a
two-dimensional geometry. For example, a circle, square, grid, triangle,
serpentine line or other non-linear arrangement. Most preferably, the acoustic
sensors are arranged around an event or an item to be monitored. A three-
dimensional geometry may also be employed.
Embodiments of this aspect of the invention may comprise preferred and
optional
features of other aspects of the invention, and vice versa.
According to a sixth aspect of the present invention, there is provided a
downhole
monitoring apparatus comprising the apparatus of the fifth aspect.
Optionally, the apparatus comprises a distributed optical fibre sensor
deployed in
the vicinity of oil- or gas-bearing shale to be fractured by a hydraulic
fracturing
process.
Embodiments of this aspect of the invention may comprise preferred and
optional
features of other aspects of the invention, and vice versa.
According to a seventh aspect of the present invention, there is provided a
surveillance apparatus comprising the apparatus of the fifth aspect. This
apparatus may be employed to monitor an asset such as an oil or gas pipeline.
CA 3055030 2019-09-11
8
Optionally, the apparatus comprises a distributed optical fibre sensor
deployed in
the vicinity of an asset or location to be monitored. Optionally, the
distributed
optical fibre sensor is deployed on or along the asset, or around the
location.
Advantageously, the apparatus comprises a bUried distributed optical fibre
sensor. Alternatively, or advantageously, the distributed fibre sensor is
deployed
in a predetermined geometric configuration.
Optionally, the apparatus is configured to display the position of an acoustic
source overlaid on a corresponding map of an area being monitored. Optionally,
the apparatus is configured to an alarm dependent on one or more measured
characteristics of the acoustic signal.
Embodiments of this aspect of the invention may comprise preferred and
optional
features of other aspects of the invention, and vice versa. =
CA 3055030 2019-09-11
9
Brief description of Drawings
The present invention will now be described by way of example with reference
to
the accompanying drawings in which:
Figure 1 is a summary of the different components of the invention;
Figure lb illustrates in schematic form an interferometer for measuring the
optical
amplitude, phase and frequency of an optical signal from which the acoustic
amplitude, phase and frequency may be derived, and which may be comprised in
a detection means in accordance with an embodiment of the present invention;
Figure 2 shows the relationship of an acoustic source and positions of
detection
at a detector means;
Figure 3 shows a locus created by positions of detection of an acoustic
source'by
a detector means;
Figure 4 shows a cross-sectional view of an acoustic source on a ground
surface
and a detection Means buried beneath the surface;
Figure 5 shows a cross-sectional view of an acoustic source on a ground
surface
and two detection means buried beneath the surface;
Figure 6 shows a surface map of an acoustic source on a ground surface and
two detection means buried beneath the surface;
Figure 7 shows a surface map of an acoustic source on a ground surface and a
detection means buried beneath the surface, including different surface zones;
Figure 8 shows a surface map in which the detection means is not aligned along
a straight line;
Figure 9 shows a surface map in which the detection means encloses a region;
Figure 10 is an example dispersion curve from the prior art; and
Figure 11 is an example dispersion analysis and shear wave profile of the
prior
art.
CA 3055030 2019-09-11
10
Detailed description of preferred embodiments
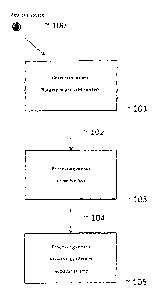
With reference to Figure 1, the present invention consists of one or more
detection means each consisting of a plurality of acoustic sensors (101) from
which one or a plurality of signals (102) as a function of space and time may
be
obtained which results from acoustic energy from one or a plurality of optical
sources (100) falling on the detection means (101), a processing means (103)
which derives one or a plurality of loci (104) from the signal (102), and a
processing means (105) which derives a position for one or a plurality of
acoustic
sources(100) from the one or plurality of loci (104). In preferred embodiments
of
the invention, the plurality of acoustic sensors is high and they are closely
placed,
preferably implemented with a distributed acoustic sensor, and more
preferably,
a distributed optical fibre acoustic sensor, and still more preferably, where
both
the acoustic amplitude and phase are provided. An example of such preferred
detection means is described in patent applications W02010/136809A2 and
W02010/136810A2 and in further detail in relation to Figure lb below.
The time of first arrival of acoustic energy from an acoustic source (100)
identified
in the signal (102) may be used by the processing means (103) to obtain the
required loci (104), but higher signal to noise and overall enhanced
performance
is realisable if a substantial duration of acoustic energy may be included in
obtaining the loci (104). This requires coherence of the acoustic energy
detected
by the detection means (101) and this is preferably obtained by implementing
the
detection means (101) with an optical fibre acoustic sensor in which the
detection
of both acoustic amplitude and phase is achieved.
The loci (104) consist of sets of co-ordinates in time and space at which a
characteristic, common to the signal detected by many of the acoustic sensors
of
the detector means (101), of the acoustic energy occurs in the signal (102)
produced by the detector means (101). The processing means (103) may take
any features of the acoustic energy detected by the detector means (101) to
derive the loci (102) by cross correlation if the acoustic energy is
transmitted
isotropically from the acoustic sources (100) to the detection means (101)
with
CA 3055030 2019-09-11
11
low dispersion so that the signal detected by each acoustic sensor in the
detection means (101) has substantially the same shape. However, in a
preferred embodiment of the present invention the processing means (103)
obtains the phase or phases of one or a plurality of substantially single
acoustic
frequency components of the signal detected at each acoustic sensor of the
detector means (101). In this way the effects of dispersion may be reduced. A
person skilled in the art of signal processing knows how to apply suitable
methods, such as narrow band filtering and Fourier transforms, to obtain the
phases and such details are therefore not given here.
The spatial arrangement of the acoustic sensors in the detection means (101)
may take a variety of forms which may be taken into account by the processing
means (105) when processing the loci (104). 'However, in one embodiment of
the present invention, the detection means (101) is such that the plurality of
acoustic sensors lie on one or a plurality of substantially straight lines in
space
which simplifies the processing carried out by the processing means (105).
In a particular embodiment of the invention, described here in order to
provide an
example of a preferred implementation of the present invention, and as
suggested above the plurality of acoustic sensors is provided in a distributed
optical fibre sensor which comprises a length of optical fibre ¨ located in a
location or environment to be monitored ¨ coupled to an interferometer such as
illustrated in Figure lb.
Light emitted by a laser (21) is modulated by a pulse signal (22). An optical
amplifier (25) is used to boost the pulsed laser light, and this is followed
by a
band-pass filter (26) to filter out the ASE noise of the amplifier. The
optical signal
is then sent to an optical circulator (27). An additional optical filter (28)
may be
used at one port of the circulator (27). The light is sent to sensing fibre
(32),
which is for example a single mode fibre or a multimode fibre. A length of the
fibre may be isolated and used as a reference section (30), for example in a
"quiet" location or with a controlled reference signal. The reference section
(30)
may be formed between reflectors or a combination of beam splitters and
reflectors (29) and (31). The reflected and the backscattered light generated
CA 3055030 2019-09-11
12
along the sensing fibre (32) is directed through the circulator (27) and into
the
interferometer (33).
Within the interferometer, the incoming light is amplified in an optical
amplifier (1),
and transmitted to the optical filter (2). The filter (2) filters the out of
band
Amplified Spontaneous Emission noise (ASE) of the amplifier (1). The light
then
enters into an optical circulator (3) which is connected to a 3x3 optical
coupler
(4). A portion of the light is directed to the photodetector (12) to monitor
the light
intensity of the input light. The other portions of light are directed along
first and
second optical paths (5) and (6), with a path length difference between the
two
paths. Faraday-rotator mirrors (FRMs) (7) and (8) reflect the light back
through
the first and second paths (5) and (6), respectively. The Faraday rotator
mirrors
provide self-polarisation compensation along optical paths (5) and (6) such
that
the two portions of light efficiently interfere at each of the 3x3 coupler (4)
ports.
The optical coupler (4) introduces relative phase shifts of 0 degrees, +120
degrees and -120 degrees to the interference signal, such that first, second
and
third interference signal components are produced, each at a different
relative
phase.
First and second interference signal components are directed by the optical
coupler (4) to photodetectors (13) and (14), and the third interference signal
component incident on the optical circulator (3) is directed towards
photodetector
(15).
The photodetectors (12), (13), (14) and (15) convert the light into electrical
signals. The electrical signals are digitised and then the relative optical
phase
modulation along the reference fibre (30) and the sensing fibre (32) is
computed
using a fast processor unit (34). The processor unit is time synchronised with
the
pulse signal (22). The path length difference between path (5) and path (6)
defines the spatial resolution.
Methods for calculating the relative phase and amplitude from three phase
shifted components of an interference signal are known from the literature.
For
example, Zhigiang Zhao et al. ("Improved Demodulation Scheme for Fiber Optic
Interferometers Using an Asymmetric 3x3 Coupler", J. Light-wave Technology,
CA 3055030 2019-09-11
13
Vol.13, ('lo.11, November 1997, pp. 2059 ¨ 2068) and Huang et al (US
5,946,429) describe techniques for demodulating the outputs of 3x3 couplers in
continuous wave multiplexing applications.
The phase angle data is sensitive to acoustic perturbations experienced by the
sensing fibre. As an acoustic wave passes through the optical fibre, it causes
the
glass structure to contract and expand. This varies the optical path length
between the backscattered light reflected from two locations in the fibre
(i.e. the
light propagating down the two paths in the interferometer), which is measured
in
the interferometer as a relative phase change. In this way, the optical phase
angle data can be processed to measure the acoustic signal at the point at
which
the light is reflected.
With reference to Figure 3, the processing means (103) may consist of manual
sketching of loci (104) on a graphical plot of intensity with time axis (301)
and
spatial axis (302) which may be useful for rapid assessment of particular
acoustic
behaviour of an acoustic source (100). However, in a preferred embodiment of
the invention, processing means (103) may be implemented by means of a
cornputer and computer programmes executing mathematical algorithms.
The processing means (105) used to obtain the distance of an acoustic source
(100) from the detection means (101) is now described with reference to the
preferred embodiment described above in which the detection means consists of
a plurality of acoustic sensors aligned in a straight line over a distance
approximately commensurate with the expected distance from the source.
With reference to Figure 2, an acoustic source S (200) is located at
orthogonal
distance d (203) from the point 0 (201) designated as position zO. An acoustic
wave travelling at uniform velocity and leaving S (200) at time Ps will reach
0
(201) at time tO before reaching any other part of the detector means at time
such as 0 (202) at position z. If the average velocity of propagation of the
acoustic energy is represented by v, then the following:
v2(t. ts)2 ¨ z0)2 +- d2 (expression 1)
CA 3055030 2019-09-11
14
may be obtained by invoking the theorem of Pythagoras and relates the position
and time at which any particular point of a spherical acoustic wave emanating
from acoustic source S (200) reaches any particular point Q (202) relative to
the
point of first detection 0 (201). However, the time taken for the acoustic
energy
to reach the point of first detection 0 (201) is given by the following:
d =-- (to¨ ts)v (expression 2)
And so, combining expressions 1 and 2 leads to the following:
(Z ZO)2 ="172(t - tOY 1- 2 dv (t ¨to)
(expression 3)
Although in particular circumstances it may be possible to determine the
values
of z0 and 10 or is independently, it will be usual that z0 and 10 at 0 (201)
or ts at
S (200), along with the distance d (203) and the velocity v are to be treated
as
unknowns to be obtained by processing means (105). The loci (104) consist of
co-ordinate pairs (z,t) and so using well-known mathematical techniques, such
as
least squares curve fitting, a person skilled in the art of signal processing
may
derive best estimates for the unknowns in expression 1 or expression 3,
realising
the value of the distance d (203), which is a preferred aim of the present
invention. Expression 1 and expression 3 rely on the assumption that the
velocity of propagation of the acoustic energy is a constant and so any
deviation
between the result of expression 1 or expression 3 and the measured loci (104)
may be an indication of the variation in the average velocity between
different
parts of the loci (104) and the acoustic source (100). If the average velocity
in
the vicinity of the detection means is known, perhaps from previous
measurements, then a comparison between the value obtained by processing
means (105) from expression 1 or expression 3 and that previously known
provides a check on the quality of the value of. d obtained at the same time
from
expression 1 or expression 3. Small differences in the values of v so obtained
would give confidence in the value of d whereas large differences in the
average
velocity would imply unexpected behaviour and hence cast doubt on the value of
d obtained.
CA 3055030 2019-09-11
15
The inventors have observed that under some conditions in practice, the
acoustic
energy reaching the acoustic detection means (101) may have a different shape
when detected at Q (202) where the values of z is greater than z0 compared
with
when detected where z is less than zO. The difference in shape may be
sufficiently great to permit using the point of difference at which the change
takes
place as the point of earliest impact 0 (201) thereby obtaining values for tO
and
zO. In addition, the average velocity of sound v between the detection means
(101) and the acoustic source (100) may be known either from knowledge of the
material, or more accurately, by prior measurement. Substituting expression 2
into expression 1 gives the following:
,z.
1.72(t - tO + "A)) =(z- z0)2+ d2
(expression 4)
Thus, with tO, zO, and v known, expression 4 gives an estimate of d for each
measurement of the distance z at the time t on the locus (104). In this case,
the
processing means to derive the loci (103) and the processing means to derive
the position of the acoustic source (105) may be combined advantageously as is
now explained.
Expression 4 may be re-arranged to give the following:
-Liz) = r0 = jc:3-5 )2+4'
(expression 5)
where rz is the delay between a point on the acoustic signal reaching the
point
of first impact 0 (201) and position Q (202). The signal (102) obtained from
the
detection means (101) may be represented as a two dimensional matrix of
samples A[i,j] where the rows (index i) contain the samples in space (z[i]) as
the
first dimension and the columns (index j) contain the samples in time (t[j])
as the
second dimension. A second two dimensional matrix of samples B[i,j,k] may be
obtained from A[i,j) by shifting each row by the appropriate amount obtained
from
the time delay given by the appropriate value of zli) substituted into
expression 5
together with an estimated value of dikl. By deriving a set of matrices B for
a
range of estimated values of d[k], a correlation or cost function may be
defined in
the space dimension as the following:
CA 3055030 2019-09-11
=
16
B(i, kl)2
CCU()¨ j,k)2
(expression 6)
which takes the value of one if for each value of j the 131i,j,k) are equal
for all
and takes a value of less than one for non-equality. Since the shape of the
detected acoustic energy is assumed to be substantially the same, the value of
C(kj that is a maximum indicates the value of d[k] that is most likely, that
is, best
describes the measured pattern of the acoustic energy received by the detector
means (101). In those circumstances where the shape of the acoustic energy
differs for z>z0 and z<z0, it will be necessary to evaluate expression 6
separately
for each of the two spatial regions z>z0 and z<z0, and then the resultant two
values for the most likely value of d (203) may be combined to give a single
optimum value using a weighted average where the weights are the peak values
of the cost function C[k] for each region.
A further, multi-channel, embodiment will now be described, that builds upon
the
above described multi-spectral time of arrival embodiment. In the further
embodiment multiple frequencies from an incident acoustic wave on the fibre
detector can be separated (e.g. using a fast fourier transform (FFT)) and
processed separately to determine localisation of the source. This provides
additional advantages over the multi-spectral time of arrival approach
described
above in that it allows the acoustic transmission properties of the earth on
acoustic surface waves to be taken into account. In this respect, the earth
acts as
a distance dependent filter to surface. acoustic waves, attenuating different
frequencies to different extents depending on the distance from the source to
the
detector. Therefore, using the time of arrival approach described above
requires
very careful calibration, to determine for each possible target source
distance the
overall velocity of sound through the earth from that target source to the
detector
array. The present multi-channel embodiment addresses the need for such
careful calibration, by instead separating the incident sound into its
component
frequencies, and then using frequencies the velocity for which is known from a
priori dispersion measurements of the site.
CA 3055030 2019-09-11
=
17
More particularly, in security applications, a distributed optical fibre
acoustic
sensor would typically be buried about one metre below ground. In similar
setups, when a compressional wave source is used, more than two thirds of the
total energy emitted is conveyed into Rayleigh waves. Each frequency
component of the surface wave has a different propagation velocity. This
property is called dispersion. Dispersion curves can be extracted by analysing
the data recorded by an array of conventional geophones (see Figure. 10, taken
from Park CB, Miller RD, Xia J (1999). Mut(ichannel analysis of surface
Waves (Masw); Geophys., 64: 800-8.)
Figure 11 (taken from Gabriels, P., Snider, R., and Nolet, G., 1987, In situ
measurements of shear-wave velocity in sediments with higher-mode Rayleigh
waves: Geophys. Prospecting, 35, 187-196) shows an example of the first
documented multichannel approach for surface-wave analysis that goes back to
the 1980s, when investigators in The Netherlands used a 24-channel acquisition
system to deduce shear-wave velocity structure of tidal flats by analyzing
recorded surface waves.
In order to use multi channel analysis to localise a source, first obtain the
two
dimensional matrix of samples Ati,j1, as described previously. That is, the
signal
(102) obtained from the detection means (101) may be represented as the two
dimensional matrix of samples A[i,j] where the rows (index i) contain the
samples
in space (z[i]) as the first dimension and the columns (index j) contain the
samples in time (t[j)) as the second dimension. Then, a third two dimensional
matrix of samples Gji,n,k) may be obtained from AN) by obtaining the frequency
spectrum of the temporal dimension (e.g. using FFT) and phase shifting each
row
n by multiplying it bye32nf'l1 where fn is the frequency dictated by the raw
index n
and t is the appropriate amount obtained from the time delay given by the
appropriate value of z[i] substituted into expression 5 together with an
estimated
value of dIk] and the speed of sound at that frequency. In this respect, the
speed
of sound at a particular frequency is obtained from an a priori dispersion
analysis
of the installation site to obtain the appropriate dispersion curve relating
to the
geographic location which is being monitored. Having performed the above, the
CA 3055030 2019-09-11
18
same cost function as described previously in expression 6 can then be used to
estimate the source location as:
Y.i kl).7
C [k] =
Ei G [i, 71, kl7- (Expression 6-2)
Again, as previously, the value of C[() that is a maximum indicates the value
of
d[k] that is most likely, that is, best describes the measured pattern of the
acoustic energy received by the detector means (101). In those circumstances
where the shape of the acoustic energy differs for z>z0 and z<z0, it will be
necessary to evaluate expression 6-2 separately for each of the two spatial
regions z>z0 and z<z0, and then the resultant two values for the most likely
value
of d (203) may be combined to give a single optimum value using a weighted
average where the weights are the peak values of the cost function C[k) for
each
region.
Regarding obtaining the a priori dispersion curves, note that the described
apparatus of the present embodiments is appropriate for dispersion analysis
applications. The dispersion analysis can be used to infer dynamic engineering
elastic properties of the near surface earth and can be used in many
geotechnical studies. In other words, the same apparatus described can be used
to extract the dispersion curves in different sites of interest. The shear
velocity
profile of the layers in the site can then be constructed by analysing the
dispersive properties of the surface waves. This can provide ground stiffness
in
1-D, 2-0, and 3-D formats for various types of geotechnical engineering
projects.
So far this description describes finding the distance between a single source
and the detection means but it is understood that there may be independent
detection means and that the results obtained may be combined to give
enhanced information about the position of a source. For example in a security
application, there may be an ambiguity in which side of a single detection
means
an acoustic source is located on the surface of the ground under which the
detection means may be buried. In many cases, this ambiguity would be
resolved by independent information relevant to the installation, such as
known
barriers or other features that distinguish the two sides of the detector
means.
CA 3055030 2019-09-11
19
The provision of two detector means at a known separation may be used to
resolve this ambiguity by combining the estimates of the distance between the
source and detector means. With reference to Figure 4, the detector means
(101) is showed buried distance h (401) below a surface (402) of a ground and
thus the detection of an acoustic source at a distance d (203) implies that
the
acoustic source S (200) lies on the surface (402) at either position A (403)
or B
(404) at a distance y (405) from a point C (406) on the surface (402)
vertically
above the detection means (101). The value of y is given by:
h2 (expression 7)
With reference to Figure 5, one way of resolving the ambiguity in position,
when
there is one detection means (101) as shown in Figure 4, is to provide two
detection means (501) and (502) buried beneath the surface (401). Solving
expression 7 for the values of dl (503), hl (504), d2(505) and h2 (506) leads
to a
single value of y1 (507) so locating the source at a single position Al (508)
on
the surface (401).
With reference to Figure 6 which shows a surface map viewed from above, for
example, the results of locating sources on a surface with the detection means
(501) and (502) and buried beneath a surface of a ground may be displayed as a
map with the position of each source Al (508) determined from the value y1
(507) and position z0 (201) along the detection means (501) for that source.
With reference to Figure 7 which shows a surface map including zones, in
addition, to locating the source spatially on the map, it is informative to
display
either a size or a colour of the indication of the position of the source
(701) as a
means of displaying an intensity of the acoustic energy of the source (701).
Such
an indication, for example, may arise from a person walking across the surface
of
the ground under which the detection means (101) is buried. In many
applications, for example, it is useful also to delineate zones by boundaries
such
as inner (702) and outer (703). Thus a zone within the inner boundary (702)
could be designated an alarm zone (704), zones between inner (702) and outer
(703) boundaries could be designated a warning zone (705), and zones outside
the outer (703) boundary could be designated a clear zone.
CA 3055030 2019-09-11
20
A map exemplified by Figure 7 is useful in giving a rapid assessment of the
position of an acoustic source particularly using colour- and size-coded
symbols.
For example, a sound source (701) following a trajectory (707) on the ground
surface could be seen, for example, to pass from a clear zone, perhaps coded
in
green for display, into a warning zone, perhaps coded in orange for display,
through an alarm zone, perhaps coded in red, a warning zone, and into a clear
zone. The size or shape of the symbol identifying the location could encode
the
estimated intensity of the acoustic source, for example, by using a person
walking symbol for lower intensity sources, a person digging symbol for medium
intensity sources, and an excavator symbol for high intensity sources. Figure
7
also demonstrates the usefulness of being able to locate an acoustic source on
a
surface as provided by the present invention without using knowledge of the
relative intensities of the acoustic sources. Thus, with reference to Figure
7,
acoustic source (708) is shown located in a clear zone but may have a much
larger intensity than sources much closer to the detection means (101) but
could
be disregarded because of its position.
Embodiments of the present invention have been described with respect to
detection means which is aligned substantially along a straight line, which is
advantageous for applications that relate to detection over many tens of
kilometres. In this form, the location along the detection means (101) and the
longitudinal position in space are one and the same parameter which simplifies
the processing provided by processing means (105). However, there are
advantages in installing the detection means in different layouts to that of a
straight line, but then the processing means (105) also provides the
relationship
between the position along the fibre and the position in space so that the
loci
(104) may be converted to a spatial position of an acoustic source.
With reference to Figure 8, acoustic sources (801) and (802) are shown on a
surface of a ground under which detection means (803) is buried and aligned in
a
quasi-repetitive curve, and preferably, in a periodic curve, along a spatial
axis
(804). In this case the ambiguity shown in Figure 4 of the position of the
source
(200) is resolved by the difference in the loci, for example, obtained from
source
(801) and (802) on different sides of the detector means at positions (805)
for
CA 3055030 2019-09-11
21
source (801) and positions (806) for source (802) and common position (807)
for
both sources (801, 802).
With reference to Figure 9, the detection means (101) is shown as enclosing a
region of interest (901) such that acoustic energy from a single source (902)
or
(903) may be detected by different sections (904) of the detection means (101)
and so the information on the distance from the detecting means (101) provided
by processing means (105) from the different sections (904) may be combined to
enhance a localisation of the source and or signal to noise performance
enhancing the likelihood of detection.
With layouts of the detection means (101) exemplified in Figures 8 and 9,
processing means (105) provides additional filtering and other known
techniques
familiar to a person skilled in the art of signal processing for the purposes
of
distinguishing between different sources, for example, (902) and (903), and
the
same source detected at distinct and separate positions, for example, (905)
and
(906), along the detection means (101). A wide variety of layout of the
detection
means (101) may be used where the choice will mainly be determined by the
location and purpose of the application and the present invention is
understood to
incorporate this variety including the provision of a plurality of detection
means
used either independently or in combination. The dimensions of any layout of
the
detection means and any depth of burial are understood to depend upon context
of use, such as size and nature of region of interest and range of intensity
of
acoustic source required to be detected.
In the present application an acoustic sensor refers to a means of converting
acoustic energy into a signal as a function of time at a single location in
space at
which the sensor is located, a distributed acoustic sensor refers to a
plurality of
acoustic sensors located at adjacent positions in space to form a continuum in
space, and a distributed optical fibre acoustic sensor refers to a distributed
acoustic sensor realised by an optical fibre (such as described in relation to
Figure lb). One particular advantage of a distributed sensor is that it is
equivalent to a very large number of point sensors distributed over great
distances. Typical distributed optical fibre sensors extend to 10 kilometres
with 1
metre resolution thus realising the equivalent of 10,000 point sensors.
CA 3055030 2019-09-11
22
Accordingly, it is desirable to combine the advantages of a distributed
optical
fibre sensor and acoustic sensors providing acoustic amplitude and phase.
This description mainly describes examples of detection in two dimensions but
it
is understood that a surface need not be planar, a surface is not required,
and
that location may be achieved in three dimensions. In particular, the optical
fibre
sensor cable may extend in a planar manner on the surface or located
subsurface, and may also extend outside the general plane of deployment, into
three dimensions. For example, for seismic or micro-seismic monitoring a
sensor
deployment may extend on the surface and within a subsurface wellbore, to
enable multi-directional localisation.
In addition, the cable structure may be enhanced to improve localisation, by
adapting the cable casing and inner sleeves to permit acoustic wave conduction
to the sensor fibre within.
As stated above, there are several industrial applications where knowing the
distance to an acoustic source is advantageous. One such application is in the
fracturing of oil or gas-bearing shale by injecting water and chemicals under
high
pressure. As the shale fractures acoustic energy is released in a narrow
region
of space and may therefore be considered to be a point source. The overall
progress and extent of the fracturing can be monitored by measuring the
distribution of position and intensity of these point sources.
As mentioned in the background section, the strength of an acoustic source is
usually unknown and so the strength of a signal as detected by an acoustic
sensor is not a reliable indicator of the distance between the source and the
sensor. However, as the present invention provides an independent means of
obtaining the distance between the source and the sensor, then the strength of
acoustic energy detected can be used as a measure of the strength of the
source
assuming that an average attenuation propagation coefficient is known for the
medium between the source and the sensor.
In prior art, the acoustic sensor is in the form of an acoustic array
consisting of a
plurality of acoustic point detectors, such as, hydrophones or geophones,
commonly termed 'passive seismic' or 'micro seismic' detection. Typically,
these
CA 3055030 2019-09-11
23
sensor arrays are deployed either in linear form inserted into a borehole
within a
few hundred metres of the point of injection of fracturing fluids, or in the
form of a
two dimensional grid on or just below the surface adjacent to the injection
point.
A limitation of this prior art is that the number of sensors that may be
deployed is
limited at typically less than one hundred, and their spatial locations are
either
constant or may only be changed by laborious and time-consuming re-
deployment of the sensor array. A distributed optical fibre sensor of acoustic
amplitude and phase, such as disclosed herein, provides the equivalent of many
thousands of point acoustic sensors and which may be deployed in a wide
variety
of geometric configurations, overcomes this limitation of the prior art as
well as
providing advantageously high acoustic frequency capability at over 5kHz.
Another important application is for security such as detecting intruders
breaching a perimeter fence or in pipeline surveillance for detection of
potential
saboteurs or illegal tapping of oil and gas pipelines. In this application,
which
may extend for tens of kilometres of region to be secured, a distributed
sensor
has clear advantages which the present invention seeks to exploit. A
distributed
optical fibre acoustic sensor would typically be buried about one metre below
ground and extend for many tens of kilometres with a spatial resolution of the
order of one metre realising detailed monitoring of the extended distance.
The present invention teaches a method of obtaining the distance from the
distributed sensor which may be projected onto the ground surface under which
the sensor is buried, thereby creating a map on which an acoustic source may
be
located when detected, for example, a person walking near the sensor. Since,
in
general, not all sources need to be detected, it is advantageous to be able to
use
the distance of the source from the distributed detector as a means of
discriminating between acoustic sources to be ignored and those that indicate
action is required, such as the deployment of security personnel to
investigate.
The discrimination may be easily portrayed as different zones on a spatial
map,
such as that provided by the UK Ordnance Survey (TM) or satellite pictures
available from Google Maps (TM), and identification of the significance of
detected sources could be indicated by a variety of means such as colour coded
variably sized symbols. In addition the coordinates of the distributed sensor
CA 3055030 2019-09-11
24
and/or a localised acoustic source may be referenced to a global positioning
system (GPS).
This description often refers to the location of a single acoustic source but
it is
understood that the present invention is not restricted to the detection of a
single
source and is capable of detecting a plurality of sources at different times
and
positions only limited by the spatial and time resolutions of the detecting
means,
and the signal amplitudes available from the acoustic sources.
Furthermore, while the invention has been exemplified by describing a
distributed
optical fibre sensor with an associated interferometer arrangement (to provide
high spatial resolution) it will be readily understood that the invention can
be
realised using distributed optical fibre sensors employing coherent Rayleigh
noise methodologies, or indeed a plurality of synchronised point sensors. The
skilled person will be readily able to apply the present invention to these
alternative detection schemes.
A person skilled in the art of signal processing will know how and when to
apply a
variety of common signal processing procedures, such as Fourier transforms,
filtering and averaging, to achieve and improve performance of the present
invention and these are understood thereby to be incorporated herein.
Various modifications may be made within the scope of the invention as herein
intended, and embodiments of the invention may include combinations of
features other than those expressly claimed.
CA 3055030 2019-09-11