Note : Les descriptions sont présentées dans la langue officielle dans laquelle elles ont été soumises.
MAPPING OF ACTIVATION WAVEFRONTS
FIELD OF THE INVENTION
The present invention relates to mapping cardiac electrical activity,
and in particular, but not exclusively to, mapping of activation wavefronts.
BACKGROUND
By way of introduction, maps of cardiac electrical activity are
typically presented by overlaying different colors for the different local
activation
times (LATs) on a representation of the heart.
US Published Patent Application 2017/0055864 describes a map of
cardiac activation wavefronts that can be created from a plurality of mesh
nodes,
each of which is assigned a conduction velocity vector. The cardiac activation
wavefronts can be displayed on a graphical representation of the cardiac
geometry.
US Published Patent Application 2017/0311833 describes a system
for diagnosing arrhythmias and directing catheter therapies that may allow for
measuring, classifying, analyzing, and mapping spatial electrophysiological
(EP)
patterns within a body. The system may also use an electronic control system
for
computing and providing the user with a variety of metrics, derivative
metrics, high
definition (HD) maps, HD composite maps, and general visual aids for
association
with a geometrical anatomical model shown on a display device.
US Published Patent Application 2015/0228254 describes a method
of generating an anatomical map that includes acquiring geometry information
and
biological information for an anatomical region. The geometry and biological
information are associated with each other, for example by associating
measured
biological attributes with the anatomical locations at which they were
measured. A
graphical representation of the anatomical region, including a map of at least
two
biological attributes, can then be superimposed upon a geometric model of the
anatomical region. The map can be a blended map and/or can utilize glyphs to
represent the displayed biological attributes.
1
CA 3055473 2019-09-16
US Patent 6,301,496 describes a method of diagnosing an abnormal
condition in a biological structure, such as the heart, including the steps of
measuring a physiological response at at least three sampled points on a
surface of
the biological structure, calculating a vector function related to the
response,
displaying a representation of the vector function, and inferring the abnormal
condition from the representation. The method is said to be particularly
useful for
diagnosing cardiac arrhythmias, in which case the physiological response is a
voltage, from which is inferred a local activation time and the vector
function is a
gradient of the local activation time, specifically, a conduction velocity.
SUMMARY
There is provided in accordance with an embodiment of the present
disclosure, a cardiac mapping system including a medical examination device to
capture data over time at multiple sample locations over a surface of at least
one
chamber of a heart, a display screen, and processing circuitry configured to
process
the captured data to determine a description of a propagation of activation
wavefronts associated with a plurality of activation times over the surface of
the at
least one chamber of the heart, calculate a plurality of activation wavefront
propagation path traces wherein each one activation wavefront propagation path
trace of the plurality of activation wavefront propagation path traces
describes a
point on one activation wavefront of the activation wavefronts being
propagated
over the surface of the at least one chamber of the heart an advancement of
the one
activation wavefront such that the plurality of activation wavefront
propagation path
traces describe the propagation of a plurality of different points
corresponding ones
of the activation wavefronts, prepare a visualization showing the plurality of
activation wavefront propagation path traces on a representation of the at
least one
chamber of the heart, and render the visualization to the display screen.
Further in accordance with an embodiment of the present disclosure
the visualization is an animated visualization, and the processing circuitry
is
operative to prepare the animated visualization showing a growth of the
plurality of
activation wavefront propagation path traces on the representation of the at
least one
chamber of the heart the advancement of the activation wavefronts over the
surface.
2
CA 3055473 2019-09-16
Still further in accordance with an embodiment of the present
disclosure the processing circuitry is configured to animate the growth of the
one
activation wavefront propagation path trace in the animated visualization by
moving
the point of the one activation wavefront propagation path trace a direction
of
movement of the one activation wavefront at a current location of the point.
Additionally, in accordance with an embodiment of the present
disclosure the processing circuitry is configured to calculate a speed of the
growth
of the one activation wavefront propagation path trace as a function of a
speed of
movement of the one activation wavefront at the current location of the point.
Moreover in accordance with an embodiment of the present
disclosure the processing circuitry is configured to select, in a random or a
pseudo-
random manner, a plurality of start locations on the representation of the at
least one
chamber of the heart, assign the plurality of start locations as start
positions of the
plurality of activation wavefront propagation path traces from which to
commence
the respective activation wavefront propagation path traces, the one
activation
wavefront propagation path trace being assigned one start position of the
start
positions, and animate the growth of each one activation wavefront propagation
path
trace of the plurality of activation wavefront propagation path traces from
the one
start position to an end position.
Further in accordance with an embodiment of the present disclosure
the processing circuitry is configured to commence the animation of the growth
of
the plurality of activation wavefront propagation path traces from the start
positions
at substantially a same time.
Still further in accordance with an embodiment of the present
disclosure the processing circuitry is configured, for each one activation
wavefront
propagation path trace of the plurality of activation wavefront propagation
path
traces, to animate the one activation wavefront propagation path trace from
the one
start position to the end position in a cyclical manner.
Additionally, in accordance with an embodiment of the present
disclosure the processing circuitry is configured to add a head indicator at
the front
3
CA 3055473 2019-09-16
of each one activation wavefront propagation path trace of the plurality of
activation
wavefront propagation path traces.
Moreover, in accordance with an embodiment of the present
disclosure the processing circuitry is configured to add an indicator to one
of the
plurality of activation wavefront propagation path traces to indicate a non-
conductive area of the at least one chamber of the heart.
Further in accordance with an embodiment of the present disclosure
the medical examination device is a probe configured to capture electrical
potentials
over time at the multiple sample locations over the surface of the at least
one
chamber of the heart.
Still further in accordance with an embodiment of the present
disclosure the processing circuitry is configured to prepare a vector map
including
a plurality of velocity vectors describing the propagation of the activation
wavefronts, prepare an animated visualization showing a growth of the
plurality of
activation wavefront propagation path traces on the representation of the at
least one
chamber of the heart the advancement of the activation wavefronts over the
surface,
and animate each one activation wavefront propagation path trace of the
plurality of
activation wavefront propagation path traces by moving the point of the one
activation wavefront propagation path trace a first plurality of times a first
direction
of a first vector of the plurality of velocity vectors and then continuing
moving the
point of the one activation wavefront a second plurality of times a second
direction
of a second vector of the plurality of velocity vectors.
There is also provided in accordance with still another embodiment
of the present disclosure a cardiac mapping method including capturing data
over
time at multiple sample locations over a surface of at least one chamber of a
heart,
processing the captured data to determine a description of a propagation of
activation wavefronts associated with a plurality of activation times over the
surface
of the at least one chamber of the heart, calculating a plurality of
activation
wavefront propagation path traces wherein each one activation wavefront
propagation path trace of the plurality of activation wavefront propagation
path
traces describes a point on one activation wavefront of the activation
wavefronts
4
CA 3055473 2019-09-16
being propagated over the surface of the at least one chamber of the heart an
advancement of the one activation wavefront such that the plurality of
activation
wavefront propagation path traces describe the propagation of a plurality of
different
points corresponding ones of the activation wavefronts, preparing a
visualization
showing the plurality of activation wavefront propagation path traces on a
representation of the at least one chamber of the heart, and rendering the
visualization to a display screen.
Additionally, in accordance with an embodiment of the present
disclosure the visualization is an animated visualization, and the method
further
includes preparing the animated visualization showing a growth of the
plurality of
activation wavefront propagation path traces on the representation of the at
least one
chamber of the heart the advancement of the activation wavefronts over the
surface.
Moreover, in accordance with an embodiment of the present
disclosure the preparing the animated visualization includes moving the point
of the
one activation wavefront propagation path trace a direction of movement of the
one
activation wavefront at a current location of the point.
Further in accordance with an embodiment of the present disclosure,
the method includes calculating a speed of the growth of the one activation
wavefront propagation path trace as a function of a speed of movement of the
one
activation wavefront at the current location of the point.
Still further in accordance with an embodiment of the present
disclosure, the method includes selecting, in a random or a pseudo-random
manner,
a plurality of start locations on the representation of the at least one
chamber of the
heart, assigning the plurality of start locations as start positions of the
plurality of
activation wavefront propagation path traces from which to commence the
respective activation wavefront propagation path traces, the one activation
wavefront propagation path trace being assigned one start position of the
start
positions, and animating the growth of each one activation wavefront
propagation
path trace of the plurality of activation wavefront propagation path traces
from the
one start position to an end position.
5
CA 3055473 2019-09-16
Additionally, in accordance with an embodiment of the present
disclosure, the method includes commencing the animation of the growth of the
plurality of activation wavefront propagation path traces from the start
positions at
substantially a same time.
Moreover, in accordance with an embodiment of the present
disclosure, the method includes, for each one activation wavefront propagation
path
trace of the plurality of activation wavefront propagation path traces,
animating the
one activation wavefront propagation path trace from the one start position to
the
end position in a cyclical manner.
Further in accordance with an embodiment of the present disclosure,
the method includes adding a head indicator at the front of each one
activation
wavefront propagation path trace of the plurality of activation wavefront
propagation path traces.
Still further in accordance with an embodiment of the present
disclosure, the method includes adding an indicator to one of the plurality of
activation wavefront propagation path traces to indicate a non-conductive area
of
the at least one chamber of the heart.
Additionally in accordance with an embodiment of the present
disclosure, the method includes preparing a vector map including a plurality
of
velocity vectors describing the propagation of the activation wavefronts,
preparing
an animated visualization showing a growth of the plurality of activation
wavefront
propagation path traces on the representation of the at least one chamber of
the heart
the advancement of the activation wavefronts over the surface, and animating
each
one activation wavefront propagation path trace of the plurality of activation
wavefront propagation path traces by moving the point of the one activation
wavefront propagation path trace a first plurality of times a first direction
of a first
vector of the plurality of velocity vectors and then continuing moving the
point of
the one activation wavefront a second plurality of times a second direction of
a
second vector of the plurality of velocity vectors.
There is also provided in accordance with still another embodiment
of the present disclosure a cardiac visualization system including a memory to
store
6
CA 3055473 2019-09-16
a description of a propagation of activation wavefronts associated with a
plurality
of activation times over a surface of at least one chamber of a heart, and
processing
circuitry configured to process the captured data to determine a description
of a
propagation of activation wavefronts associated with a plurality of activation
times
over the surface of the at least one chamber of the heart, calculate a
plurality of
activation wavefront propagation path traces wherein each one activation
wavefront
propagation path trace of the plurality of activation wavefront propagation
path
traces describes a point on one activation wavefront of the activation
wavefronts
being propagated over the surface of the at least one chamber of the heart an
advancement of the one activation wavefront such that the plurality of
activation
wavefront propagation path traces describe the propagation of a plurality of
different
points corresponding ones of the activation wavefronts, prepare a
visualization
showing the plurality of activation wavefront propagation path traces on a
representation of the at least one chamber of the heart, and render the
visualization
to a display screen.
Moreover, in accordance with an embodiment of the present
disclosure the visualization is an animated visualization, and the processing
circuitry
is operative to prepare the animated visualization showing a growth of the
plurality
of activation wavefront propagation path traces on the representation of the
at least
one chamber of the heart the advancement of the activation wavefronts over the
surface.
Further in accordance with an embodiment of the present disclosure
the processing circuitry is configured to animate the growth of the one
activation
wavefront propagation path trace in the animated visualization by moving the
point
of the one activation wavefront propagation path trace a direction of movement
of
the one activation wavefront at a current location of the point.
Still further in accordance with an embodiment of the present
disclosure the processing circuitry is configured to calculate a speed of the
growth
of the one activation wavefront propagation path trace as a function of a
speed of
movement of the one activation wavefront at the current location of the point.
7
CA 3055473 2019-09-16
Additionally in accordance with an embodiment of the present
disclosure the processing circuitry is configured to select, in a random or a
pseudo-
random manner, a plurality of start locations on the representation of the at
least one
chamber of the heart, assign the plurality of start locations as start
positions of the
plurality of activation wavefront propagation path traces from which to
commence
the respective activation wavefront propagation path traces, the one
activation
wavefront propagation path trace being assigned one start position of the
start
positions, and animate the growth of each one activation wavefront propagation
path
trace of the plurality of activation wavefront propagation path traces from
the one
start position to an end position.
There is also provided in accordance with still another embodiment
of the present disclosure a cardiac visualization method including storing a
description of a propagation of activation wavefronts associated with a
plurality of
activation times over a surface of at least one chamber of a heart, processing
the
captured data to determine a description of a propagation of activation
wavefronts
associated with a plurality of activation times over the surface of the at
least one
chamber of the heart, calculating a plurality of activation wavefront
propagation
path traces wherein each one activation wavefront propagation path trace of
the
plurality of activation wavefront propagation path traces describes a point on
one
activation wavefront of the activation wavefronts being propagated over the
surface
of the at least one chamber of the heart an advancement of the one activation
wavefront such that the plurality of activation wavefront propagation path
traces
describe the propagation of a plurality of different points corresponding ones
of the
activation wavefronts, preparing a visualization showing the plurality of
activation
wavefront propagation path traces on a representation of the at least one
chamber of
the heart, and rendering the visualization to a display screen.
Moreover, in accordance with an embodiment of the present
disclosure the visualization is an animated visualization, and the method
further
includes preparing the animated visualization showing a growth of the
plurality of
activation wavefront propagation path traces on the representation of the at
least one
chamber of the heart the advancement of the activation wavefronts over the
surface.
8
CA 3055473 2019-09-16
Further in accordance with an embodiment of the present disclosure,
the method includes animating the growth of the one activation wavefront
propagation path trace in the animated visualization by moving the point of
the one
activation wavefront propagation path trace a direction of movement of the one
activation wavefront at a current location of the point.
Still further in accordance with an embodiment of the present
disclosure, the method includes calculating a speed of the growth of the one
activation wavefront propagation path trace as a function of a speed of
movement
of the one activation wavefront at the current location of the point.
Additionally in accordance with an embodiment of the present
disclosure, the method includes selecting, in a random or a pseudo-random
manner,
a plurality of start locations on the representation of the at least one
chamber of the
heart, assigning the plurality of start locations as start positions of the
plurality of
activation wavefront propagation path traces from which to commence the
respective activation wavefront propagation path traces, the one activation
wavefront propagation path trace being assigned one start position of the
start
positions, and animating the growth of each one activation wavefront
propagation
path trace of the plurality of activation wavefront propagation path traces
from the
one start position to an end position.
There is also provided in accordance with still another embodiment
of the present disclosure a software product, including a non-transient
computer-
readable medium in which program instructions are stored, which instructions,
when read by a central processing unit (CPU), cause the CPU to store a
description
of a propagation of activation wavefronts associated with a plurality of
activation
times over a surface of at least one chamber of a heart, calculate a plurality
of
activation wavefront propagation path traces wherein each one activation
wavefront
propagation path trace of the plurality of activation wavefront propagation
path
traces describes a point on one activation wavefront of the activation
wavefronts
being propagated over the surface of the at least one chamber of the heart an
advancement of the one activation wavefront such that the plurality of
activation
wavefront propagation path traces describe the propagation of a plurality of
different
9
CA 3055473 2019-09-16
points corresponding ones of the activation wavefronts, prepare a
visualization
showing the plurality of activation wavefront propagation path traces on a
representation of the at least one chamber of the heart, and render the
visualization
to the display screen.
BRIEF DESCRIPTION OF THE DRAWINGS
The present invention will be understood from the following detailed
description, taken in conjunction with the drawings in which:
Fig. 1 is a partly pictorial, partly block diagram view of a cardiac
mapping system constructed and operative in accordance with an embodiment of
the present invention;
Figs. 2-5 are various views of cardiac images showing activation
wavefront propagation path traces on a representation of at least one chamber
of a
heart generated by the system of Fig. 1 in accordance with an embodiment of
the
present invention;
Fig. 6 is a view of the activation wavefront propagation path traces of
a portion of the heart shown in Figs. 3-5 at three different times;
Fig. 7 is a view of a vector map generated by the system of Fig. 1 in
accordance with an embodiment of the present invention;
Fig. 8 illustrates a plurality of random start locations of activation
wavefront propagation path traces on the representation of the chamber(s) of
the
heart selected by the system of Fig. 1 in accordance with an embodiment of the
present invention;
Figs. 9-11 illustrate animation of the activation wavefront
propagation path traces in accordance with an embodiment of the present
invention;
Fig. 12 is a flow chart showing exemplary steps in a method of
operation of the system of Fig. 1; and
Fig. 13 is a view of a detailed illustration of an exemplary animation
of one activation wavefront propagation path trace in accordance with an
embodiment of the present invention.
CA 3055473 2019-09-16
DESCRIPTION OF EXAMPLE EMBODIMENTS
OVERVIEW
By way of introduction, maps of cardiac electrical activity are
typically presented by overlaying different colors for the corresponding to
different
local activation times (LATs) on a representation of the heart. However,
deriving
medical information from these maps may be mentally demanding.
Embodiments of the present invention provide a map of cardiac
electrical activity showing how cardiac electrical activity flows over the
representation of the heart using an intuitive (static or animated) three-
dimensional
(3D) visualization including activation wavefront propagation path traces. The
activation wavefront propagation path traces indicate a direction of movement
of
activation wavefronts associated with a plurality of activation times over the
surface
of at least one chamber of the heart. A growth of the activation wavefront
propagation path traces may also be animated according to a speed of the
activation
wavefronts. The activation wavefront propagation path traces enable easy
derivation
of medical information from the maps, such as identification of non-conductive
areas and other propagation related issues such as circular activity, by way
of
example only.
In a data capture stage, underlying cardiac activity is captured using
a medical examination device to capture data over time at multiple sample
locations
over the surface of the chamber(s) of the heart. The captured data is
processed to
determine a description of the propagation of the activation wavefronts
associated
with the activation times over the surface of the chamber(s) of the heart. The
medical
examination device may include a probe to capture electrical cardiac activity.
Additionally, or alternatively, body surface vests may be used to estimate the
propagation of the activation wavefronts. Additionally, or alternatively, an
inter-
cardiac and/or trans-thoracic ultrasound-based system may be used to estimate
mechanical wavefronts.
The description of the propagation of the activation wavefronts may
be represented using any suitable representation, for example, but not limited
to, a
11
CA 3055473 2019-09-16
spline function or as a vector map including velocity vectors describing the
propagation of the activation wavefronts associated with the activation times.
It
should be carefully noted that a velocity vector simply describes the velocity
of an
activation wavefront at a single point and does not describe any path of
propagation.
Therefore, the wavefront propagation path traces cannot be described as long
velocity vectors.
Using the description of the propagation of the activation wavefronts,
a static visualization may be prepared on a computer display, showing the
activation
wavefront propagation path traces on a representation of the chamber(s) of the
heart.
When the visualization is animated, the visualization may show a growth of the
activation wavefront propagation path traces on the representation of the
chamber(s)
of the heart according to the advancement of the activation wavefronts over
the
surface. The static and/or animated visualization may show a rotation of the
three-
dimensional representation of the chamber(s) of the heart.
As part of an initialization process in order to generate this
visualization, start positions of the activation wavefront propagation path
traces may
be assigned randomly, pseudo-randomly, or according to a given pattern, over
the
3D representation of the chamber(s) of the heart. A density of the start
positions
may be user-configurable.
Each activation wavefront propagation path trace is calculated so that
it describes a point on one activation wavefront of the activation wavefronts
being
propagated from its start position over the surface of the chamber(s) of the
heart
according to an advancement of that activation wavefront. Therefore, the
activation
wavefront propagation path traces describe the propagation of different points
with
different corresponding start positions according to corresponding activation
wavefronts.
The direction(s) that each activation wavefront propagation path
trace follows is determined according to a direction of movement of the one
activation wavefront at a current location of the point being propagated.
Similarly,
when the visualization is animated, the speed of growth of each activation
wavefront
propagation path trace is a function of a speed of movement of the activation
12
CA 3055473 2019-09-16
wavefront at the current location of the point being propagated. In one
example
using velocity vectors, the point which is being propagated is moved multiple
times
according to a velocity vector associated with the current location of the
point and
is then moved another multiple times according to a different velocity vector
associated with a new location of the point, and so on.
The point may be propagated according to a given time period or a
given distance over the surface of the chamber(s) of the heart thereby
defining an
end position of the associated activation wavefront propagation path trace
according
to the given time period or given distance. When the visualization is animated
and
an activation wavefront propagation path trace reaches the end of its path,
the path
trace may then be removed from the visualization and start growing again from
its
start position according to the speed of its activation wavefront. This may be
repeated in a cyclical manner.
In accordance with some embodiments, the propagation of a point
may be calculated based on the following formula:
LN = Lc + 17 = At , where LN is the next location of the point being
propagated, Lc is the current location of the point being propagated, f) is a
velocity
vector from the description of the propagation of the activation wavefronts
(e.g.,
from a function describing the propagation of the activation wavefronts)
associated
with the current location of the point, and At is a time value, which may be
user
configurable in order to increase and decrease the granularity of the movement
of
the point being propagated. When the visualization is animated, adjusting At
may
be used to adjust the speed of the animation.
A visible head is generally added at the front of each activation
wavefront propagation path trace to emphasize the direction of movement of the
activation wavefront propagation path trace. The visible head provides a
useful
direction indicator whether the visualization is static or animated. The
visible head
is generally thicker than the rest of the activation wavefront propagation
path trace.
A format (e.g., color, shading and/or pattern) and/or a size (e.g., length
and/or width)
of each activation wavefront propagation path trace may indicate a magnitude
of the
13
CA 3055473 2019-09-16
underlying velocity of the activation wavefront. For example, a darker color
may
indicate a faster travelling trace associated with a higher speed wavefront.
Optionally, an indicator may be added to an activation wavefront
propagation path trace to indicate a non-conductive area of the chamber(s) of
the
heart in the visualization.
In some embodiments, user interaction with the visualization may
enable a user to initiate an action corresponding to a position which was
selected by
a user on the representation of the chamber(s) of the heart. The action may
include
any suitable action, for example, but not limited to, displaying additional
information about the selected position, outputting a control command to
perform
an ablation at the selected position, outputting a control command to perform
further
investigation at the selected position; and/or adding an annotation at the
selected
position. Automatic analysis of the visualization may result in any suitable
action,
for example, but not limited to, outputting a control command to perform an
ablation
at a given position, outputting a control command to perform further
investigation
at a given position.
Documents incorporated by reference herein are to be considered an
integral part of the application except that, to the extent that any terms are
defined
in these incorporated documents in a manner that conflicts with definitions
made
explicitly or implicitly in the present specification, only the definitions in
the pre-
sent specification should be considered.
SYSTEM DESCRIPTION
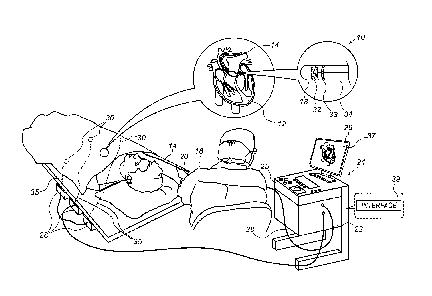
Turning now to the drawings, reference is initially made to Fig. 1,
which is a pictorial illustration of a cardiac mapping system 10, constructed
and
operative in accordance with a disclosed embodiment of the invention, for
evaluating electrical activity and optionally for performing ablative
procedures on a
heart 12 of a living subject. The system comprises a probe 14, such as a
catheter,
which is percutaneously inserted by an operator 16 through the patient's
vascular
system into a chamber or vascular structure of the heart 12. The operator 16,
who is
typically a physician, brings a distal tip 18 of the probe 14 into contact
with the heart
14
CA 3055473 2019-09-16
wall, for example, at an ablation target site or to capture electrical
potentials over
time at multiple sample location over a surface of one or more chambers of the
heart 12. Electrical activation maps may be prepared, according to the methods
disclosed in U.S. Patent Nos. 6,226,542, and 6,301,496, and in commonly
assigned
U.S. Patent No. 6,892,091, whose disclosures are herein incorporated by
reference.
One commercial product embodying elements of the system 10 is available as the
CARTO 3 System, available from Biosense Webster, Inc., 33 Technology Drive,
Irvine, CA 92618 USA. This system may be modified by those skilled in the art
to
embody the principles of the invention described herein.
Areas determined to be abnormal, for example by evaluation of the
electrical activation maps, can be ablated by application of thermal energy,
e.g., by
passage of radiofrequency electrical current through wires in the probe to one
or
more electrodes at the distal tip 18, which apply the radiofrequency energy to
the
myocardium. The energy is absorbed in the tissue, heating it to a temperature
(typically about 50 C) at which it permanently loses its electrical
excitability. When
successful, this procedure creates non-conducting lesions in the cardiac
tissue,
which disrupt the abnormal electrical pathway causing the arrhythmia. The
principles of the invention can be applied to different heart chambers to
diagnose
and treat many different cardiac arrhythmias.
The probe 14 typically comprises a handle 20, having suitable
controls on the handle to enable the operator 16 to steer, position and orient
the
distal tip 18 of the probe 14 as desired for the ablation. To aid the operator
16, a
distal portion of the probe 14 contains position sensors (not shown) that
provide
signals to processing circuitry 22, located in a console 24. The processing
circuitry 22 may fulfill several processing functions as described below.
Ablation energy and electrical signals can be conveyed to and from
the heart 12 through one or more ablation electrodes 32 located at or near the
distal
tip 18 via cable 34 to the console 24. In such a manner, the ablation
electrodes 32
are configured to capture electrical potentials over time at multiple sample
location
over a surface of one or more chambers of the heart 12. Additionally, or
alternatively, other electrodes may be configured to capture electrical
potentials
CA 3055473 2019-09-16
over time at multiple sample location over a surface of one or more chambers
of the
heart 12. Pacing signals and other control signals may be conveyed from the
console 24 through the cable 34 and the electrodes 32 to the heart 12. Sensing
electrodes 33, also connected to the console 24 are disposed between the
ablation
electrodes 32 and have connections to the cable 34. The probe 14 may be
implemented without the ablation electrodes 32 as an exploratory device having
electrodes configured to capture electrical potentials over time at multiple
sample
location over a surface of one or more chambers of the heart 12.
Wire connections 35 link the console 24 with body surface
electrodes 30 and other components of a positioning sub-system for measuring
location and orientation coordinates of the probe 14. The processing circuitry
22 or
another processor (not shown) may be an element of the positioning subsystem.
The
electrodes 32 and the body surface electrodes 30 may be used to measure tissue
impedance at the ablation site as taught in U.S. Patent No. 7,536,218, issued
to
Govari et al., which is herein incorporated by reference. A sensor for
bioelectric
information, e.g., a temperature sensor (not shown), typically a thermocouple
or
thermistor, may be mounted on or near each of the electrodes 32.
The console 24 typically contains one or more ablation power
generators 25. The probe 14 may be adapted to conduct ablative energy to the
heart
using any known ablation technique, e.g., radiofrequency energy, ultrasound
energy, and laser-produced light energy. Such methods are disclosed in
commonly
assigned U.S. Patent Nos. 6,814,733, 6,997,924, and 7.156,816, which are
herein incorporated by reference.
In one embodiment, the positioning subsystem comprises a magnetic
position tracking arrangement that determines the position and orientation of
the
probe 14 by generating magnetic fields in a predefined working volume and
sensing
these fields at the probe 14, using field generating coils 28. The positioning
subsystem is described in U.S. Patent No. 7,756,576, which is hereby
incorporated
by reference, and in the above-noted U.S. Patent No. 7,536,218.
As noted above, the probe 14 is coupled to the console 24, which
enables the operator 16 to observe and regulate the functions of the probe 14.
The
16
CA 3055473 2019-09-16
processing circuitry 22 may be embodied as a computer with appropriate signal
processing circuits. The processing circuitry 22 is coupled to drive a monitor
29
including a display screen 37. The signal processing circuits typically
receive,
amplify, filter and digitize signals from the probe 14, including signals
generated by
sensors such as electrical, temperature and contact force sensors, and a
plurality of
location sensing electrodes (not shown) located distally in the probe 14. The
digitized signals are received and used by the console 24 and the positioning
system
to compute the position and orientation of the probe 14, and to analyze the
electrical
signals from the electrodes.
In order to generate electroanatomic maps, the processing circuitry 22
typically comprises an electroanatomic map generator, an image registration
program, an image or data analysis program and a graphical user interface
configured to present graphical information on the monitor 29.
In practice, some or all of these functions of the processing
circuitry 22 may be combined in a single physical component or, alternatively,
implemented using multiple physical components. These physical components may
comprise hard-wired or programmable devices, or a combination of the two. In
some embodiments, at least some of the functions of the processing circuitry
may
be carried out by a programmable processor under the control of suitable
software.
This software may be downloaded to a device in electronic form, over a
network,
for example. Alternatively, or additionally, the software may be stored in
tangible,
non-transitory computer-readable storage media, such as optical, magnetic, or
electronic memory.
The console 24 may also include an interface 39 to receive input
commands from the operator 16 via any suitable user input device, for example,
but
not limited to, a pointing device (such as a mouse of stylus), a keyboard,
and/or a
touch sensitive screen implemented in the display screen 37.
Typically, the system 10 includes other elements, which are not
shown in the figures for the sake of simplicity. For example, the system 10
may
include an electrocardiogram (ECG) monitor, coupled to receive signals from
the
body surface electrodes 30, in order to provide an ECG synchronization signal
to
17
CA 3055473 2019-09-16
the console 24. As mentioned above, the system 10 typically also includes a
reference position sensor, either on an externally applied reference patch
attached
to the exterior of the subject's body, or on an internally placed probe, which
is
inserted into the heart 12 maintained in a fixed position relative to the
heart 12.
Conventional pumps and lines for circulating liquids through the probe 14 for
cooling the ablation site are provided. The system 10 may receive image data
from
an external imaging modality, such as an MRI unit or the like and includes
image
processors that can be incorporated in or invoked by the processing circuitry
22 for
generating and displaying images.
Reference is now made to Figs. 2-5, which are various views of
cardiac images showing a plurality of activation wavefront propagation path
traces 42 on a representation of one or more chambers of the heart 12
generated by
the system 10 of Fig. 1 in accordance with an embodiment of the present
invention.
Fig. 2 shows the heart 12 viewed from one angle, while Figs. 3-5 show the
heart 12
viewed from a different angle.
The processing circuitry 22 (Fig. 1) is configured prepare a (static or
animated) visualization 46 showing activation wavefront propagation path
traces 42
on a 3D representation of the chamber(s) of the heart 12. The processing
circuitry 22
is configured to render the visualization 46 to the display screen 37 (Fig.
1). The
preparation of the visualization 46 is described in more detail with respect
to
Figs. 7-12. The format of the visualization 46 is now described in more detail
with
respect to Figs. 2-5.
Figs. 2-5 show the activation wavefront propagation path traces 42 at
various stages of growth on the representation of the chamber(s) of the heart
12. For
the sake of simplicity only some of the activation wavefront propagation path
traces 42 have been labeled. Figs. 3-5 show the state of growth of the
activation
wavefront propagation path traces 42 at different times illustrating that the
activation wavefront propagation path traces 42 grow when the visualization 46
is
animated.
It should be noted that some of the activation wavefront propagation
path traces 42 included in the visualization 46 may continue along a surface
of the
18
CA 3055473 2019-09-16
chamber(s) of the heart which is not currently in view on the visualization
46. When
the visualization 46 is animated, these activation wavefront propagation path
traces 42 may continue to the end of their path (on the surface which is not
in view)
and once the activation wavefront propagation path traces 42 grow to the end
of
their respective path, the activation wavefront propagation path traces 42 may
be
removed from the visualization 46 and start growing again from the beginning
of
their respective paths which are currently in view. Similarly, activation
wavefront
propagation path traces 42 which start their paths on a surface of the heart
12 which
is currently not in view may appear on the surface currently in view at a
later time.
In other words, the activation wavefront propagation path traces 42 are
generally
calculated for one or more chambers of the heart 12 whether or not the surface
of
the chamber(s) of the heart 12 will be in view in the visualization 46 at any
one time.
The processing circuitry 22 (Fig. 1) is configured to prepare the
visualization 46 showing a rotation of the three-dimensional representation of
the
chamber(s) of the heart 12. The visualization 46 may be manipulated by the
operator 16 (Fig. 1) to be rotated to any suitable viewing angle. The
processing
circuitry 22 may also be configured to prepare the visualization 46 as a video
which
may be played showing the rotation of the three-dimensional representation of
the
chamber(s) of the heart 12 and/or the growing of the activation wavefront
propagation path traces 42 along their respective paths.
The interface 39 (Fig. 1) may be configured to receive a user input
selecting a position on the representation of the chamber(s) of the heart 12
in the
visualization 46. The processing circuitry 22 (Fig. 1) is configured, in
response to
the user input, to perform an action corresponding to the selected position on
the
representation of the chamber(s) of the heart 12. The action may include any
one or
more of the following: (a) generating a display of additional information
about the
selected position, for example, but not limited to, levels of electrical
conductivity, a
local activation time (LAT), and/or an MRI scan; (b) outputting a control
command
to perform an ablation at the selected position; (c) outputting a control
command to
perform further investigation at the selected position; and/or (d) adding
annotations
on the animated visualization 46 at the selected position.
19
CA 3055473 2019-09-16
The sources and sinks of the activation wavefront propagation path
traces 42 may be annotated manually by the operator 16 (Fig. 1) or may be
identified
automatically by the system 10 (Fig. 1) and annotated automatically on the
visualization 46 by the system 10.
Reference is now made to Fig. 6, which is a view of the electric-
potential-flows 42 shown in Figs. 3-5 at three different times (T1-T3) when
the
visualization 46 is animated for one portion of the heart 12. Fig. 6
illustrates the
activation wavefront propagation path traces 42 growing by showing a single
portion of the heart 12 at the three different times in a single figure.
Reference is now made to Fig. 7, which is a view of a vector map 70
generated by the system 10 of Fig. 1 in accordance with an embodiment of the
present invention. The processing circuitry 22 (Fig. 1) is configured to
process
electrical potentials captured by the probe 14 (Fig. 1) over time at multiple
sample
locations over the surface of the chamber(s) of the heart 12 to determine
respective
activation times at the multiple locations over the surface of the chamber(s)
of the
heart 12. It should be noted that the captured electric potentials may be
exported by
the processing circuitry 22 to a processor which is remote to the console 24
(Fig. 1),
such as a processor of a PC or laptop, and processed in the remote processor
for
rendering on any suitable display screen.
The processing circuitry 22 is configured to prepare the vector
map 70 including a plurality of velocity vectors 72 (only some labeled for the
sake
of simplicity) describing the propagation of activation wavefronts associated
with
the activation times. One method for preparing the vector map 70 is described
in US
Patent 6,301,496, which is herein incorporated by reference. Any suitable
method
for preparing the vector map 70 may also be used.
It should be noted that the description of the propagation of activation
wavefronts used to prepare the visualization 46 may be derived from any
suitable
apparatus and by any suitable method. For example, body surface vests or any
suitable medical examination device may be used using to estimate the
activation
wavefronts. Additionally, or alternatively, an inter-cardiac and/or trans-
thoracic
ultrasound-based system may be used to estimate mechanical wavefronts.
CA 3055473 2019-09-16
In the examples of Figs. 8-13, the activation wavefront propagation
path traces 42 are determined based on underlying velocity vectors from the
vector
map 70. However, the activation wavefront propagation path traces 42 may be
calculated based on the description of the propagation of the activation
wavefronts
without the need to calculate the vector map 70.
Reference is now made to Fig. 8, which illustrates a plurality of
random start locations 74 of activation wavefront propagation path traces 42
(Figs.
2-6) on the representation of the chamber(s) of the heart 12 selected by the
system 10 of Fig. 1 in accordance with an embodiment of the present invention.
As
part of an initialization process, the processing circuitry 22 (Fig. 1) is
configured to
select, in a random or a pseudo-random manner, the start locations 74 on the
representation of the chamber(s) of the heart 12. Additionally, or
alternatively, the
start locations 74 may be selected according to a given pattern (e.g., a grid
pattern),
over the surface of the chamber(s) of the heart 12. A density of the start
locations 74
may be user-configurable. Only some of the start locations 74 are shown in
Fig. 8
for the sake of simplicity. The processing circuitry 22 is configured to
assign the
start locations 74 as start positions of the activation wavefront propagation
path
traces 42 (Figs. 2-6) so that each activation wavefront propagation path trace
42 is
assigned one start position 74.
Reference is now made to Figs. 9-11, which illustrate generation of
the activation wavefront propagation path traces 42 in accordance with an
embodiment of the present invention. Fig. 9 is a duplication of the vector map
70 of
Fig. 7, which has been repeated here to aid understanding of Figs. 10 and 11.
Fig. 10
shows four activation wavefront propagation path traces 42 starting at their
respective start locations 74 and continuing until an end-of-path is reached
(e.g.,
based on a given time or a given distance). Arrows 76 show the direction in
which
the activation wavefront propagation path traces 42 grow when the
visualization 46
is animated. It will be seen, by careful comparison to the velocity vectors 72
shown
in Fig. 9 that the respective directions of the activation wavefront
propagation path
traces 42 shown in Fig. 10 are according to the underlying velocity vectors 72
of
Fig. 9. For example, a direction of an activation wavefront propagation path
trace 42-1 at a point 78 shown in Fig. 10 is determined by the direction of a
vector
21
CA 3055473 2019-09-16
72-1 shown in Fig. 9. It should be noted that the velocity vector 72-1 does
not
describe a path of the propagation of the activation wavefront. The velocity
vector 72-1 simply describes the velocity of the activation wavefront at a
single
point and does not describe any path of propagation.
Fig. 11 shows the growth of the activation wavefront propagation
path trace 42-1 along a path 44-1 from a start location 74-1 in the direction
shown
by the arrow 76-1. Fig. 11 also shows that the activation wavefront
propagation path
trace 42-1 has a head 83 at its front, thereby indicating the direction in
which the
showing the activation wavefront propagation path trace 42-1 is growing.
Therefore, the processing circuitry 22 is configured to animate the
growth of each activation wavefront propagation path trace 42 in the animated
visualization 46 from its start position 74 to an end position. The processing
circuitry 22 is generally configured to commence the animation of the growth
of the
activation wavefront propagation path traces 42 from their respective start
positions 74 at substantially the same time. The processing circuitry 22 is
generally
configured, for each activation wavefront propagation path traces 42, to
animate the
growth of each activation wavefront propagation path traces 42 from its start
position 74 to its end position in a cyclical manner. The processing circuitry
22 is
configured to add a head indicator (e.g., the head 83) at the front of some,
or all,
activation wavefront propagation path traces 42, generally having a different
format
from the rest of the activation wavefront propagation path traces 42. The head
indicator may be added whether the visualization 46 is animated or static.
When the
visualization 46 is animated, the processing circuitry 22 may be configured to
fade
each activation wavefront propagation path trace 42 over time and/or to remove
one
of the activation wavefront propagation path traces 42 when that activation
wavefront propagation path trace 42 completes growing to the end of its path.
Non-conductive areas of the heart 12 may be of particular interest to
a health professional. The processing circuitry 22 may be configured to add an
indicator (e.g., a symbol and/or color) to the activation wavefront
propagation path
traces 42 to indicate a non-conductive area of the chamber(s) of the heart 12
in the
visualization 46.
22
CA 3055473 2019-09-16
Reference is now made to Fig. 12, which is a flow chart showing
exemplary steps in a method of operation of the system 10 of Fig. 1. The steps
of
blocks 84-88 were described above with reference to Figs. 1 and 7. As
described
above, steps 84-88 may be replaced by other data capture methods and/or other
ways
to describe the propagation of the activation wavefronts. The steps of blocks
90 and
92 were described above with reference to Fig. 8. The remainder of the blocks
of
Fig. 12 are now described in more detail below.
The processing circuitry 22 is configured to calculate (block 94) the
activation wavefront propagation path traces 42. Each activation wavefront
propagation path trace 42 describes a point on one activation wavefront being
propagated over the surface of the chamber(s) of the heart according to an
advancement of the activation wavefront. The activation wavefront propagation
path traces 42 describe the propagation of different points according to
corresponding activation wavefronts.
When the visualization 46 is an animated visualization, the
processing circuitry 22 is operative to prepare (block 96) the animated
visualization
showing a growth of the activation wavefront propagation path traces 42 on the
representation of the chamber(s) of the heart according to the advancement of
the
activation wavefronts over the surface. The processing circuitry 22 is
configured to
animate (block 98) the growth of each one of the activation wavefront
propagation
path traces 42 in the animated visualization by moving the point of that
activation
wavefront propagation path trace 42 according to a direction of movement of
the
activation wavefront at a current location of the point being propagated. The
processing circuitry 42 is configured to calculate (block 100) a speed of the
growth
of one of the activation wavefront propagation path traces 42 as a function of
a speed
of movement of the activation wavefront at the current location of the point
being
propagated.
In accordance with some embodiments, the processing circuitry 22 is
configured to animate each activation wavefront propagation path trace 42 by
moving the point of the activation wavefront propagation path trace 42 a first
plurality of times according to a first direction and magnitude of a first
vector of the
23
CA 3055473 2019-09-16
plurality of velocity vectors 72 and then continuing moving the point of the
activation wavefront propagation path trace a second plurality of times
according to
a second direction of a second vector of the plurality of velocity vectors 72.
In accordance with some embodiments, the propagation of the point
may be calculated based on the following formula:
LN = Lc + ü = At , where LN is the next location of the point being
propagated, Lc is the current location of the point being propagated, ü is a
velocity
vector from the description of the propagation of the activation wavefronts
(e.g.,
from a function describing the propagation of the activation wavefronts)
associated
with the current location of the point and At is a time value, which may be
user
configurable in order to increase and decrease the granularity of the movement
of
the point being propagated. When the visualization is animated, adjusting At
may
be used to adjust the speed of the animation. At may be any suitable value.
For
example, At may be in the sub-millisecond (ms) range, e.g., 0.1 ms to 6 ms.
The
value of At may be influenced by the range of the magnitudes of the velocity
vectors 72. The value of At could be user configurable or automatically set by
the
cardiac mapping system 10 to a suitable value, for example, but not limited
to, 10%
of the average velocity of the velocity vectors 72. Reducing the value of At
generally leads to a smoother, but slower, animation.
The processing circuitry 22 may be configured to assign a format
(e.g., color, shading and/or pattern) and/or a size (e.g., length and/or
width) to the
activation wavefront propagation path traces 42 and/or the head indicator of
the
activation wavefront propagation path traces 42 in the animated visualization
46
(Figs. 2-5) as a function of the speed of the activation wavefront at the
current
location of the point of one of the activation wavefront propagation path
traces 42.
For example, a darker color may indicate a point associated with a faster
activation
wavefront.
An example of an implementation of certain steps in the flow chart
of Fig. 12 is now described with reference to Fig. 13, which is a view of a
detailed
illustration of an exemplary animation of the growth of one activation
wavefront
24
CA 3055473 2019-09-16
propagation path trace 42 in accordance with an embodiment of the present
invention.
The top left corner of Fig. 13 shows a grid 82 which represents a
portion of the vector map 70 of Fig. 7 over a portion of the heart 12 (Fig.
7). For the
sake of simplicity, the vector map 70 has been divided into rectangles.
However, the
vector map 70 may be divided using any suitable shapes which tessellate by
themselves, such as triangles, squares and hexagons. In accordance with other
embodiments the vector map 70 may be replaced with a function or other
description describing the propagation of the activation wavefronts. For the
sake of
easy reference, each of the rectangles may be referenced by a column letter (A
to E)
and a row number (1 to 3). The vector map 70 includes velocity vectors 72 of
which
only some have been labeled for the sake of simplicity.
The grid 82 is duplicated thirteen times in Fig. 13 to show the extent
of the activation wavefront propagation path trace 42 at various times, from
time TO
to time T13.
Fig. 13 shows the start location of the activation wavefront
propagation path trace 42 at time TO. The activation wavefront propagation
path
trace 42 then grows according to the corresponding velocity vectors 72 in the
grid 82 over a time period from time T1 to time T13 as will now be described
in
more detail.
At time TO, the activation wavefront propagation path trace 42 is
located in rectangle A3 of the grid 82 and therefore grows according to the
direction
and the magnitude of the velocity vector 72 located in rectangle A3 of the
grid 82.
At time Ti, the activation wavefront propagation path trace 42 is still
located in the
rectangle A3 of the grid 82 and therefore grows again according to the
direction and
the magnitude of the velocity vector 72 located in rectangle A3 of the grid
thereby
moving the front of the activation wavefront propagation path trace 42 into
the
rectangle B3 at time T2.
From times T2 to T6, the front of the activation wavefront
propagation path trace 42 is located in the rectangle B3. Therefore, the
activation
CA 3055473 2019-09-16
wavefront propagation path trace 42 grows according to the velocity vector 72
located in the rectangle B3.
It should be noted that the direction and size of the velocity vectors 72
in the rectangles A3 and B3 have the same direction and magnitude. Therefore,
the
activation wavefront propagation path trace 42 grows at a constant speed and
direction across the rectangles A3 and B3.
From time T7 to 19, the front of the activation wavefront propagation
path trace 42 is located in the rectangle C3. Therefore, the activation
wavefront
propagation path trace 42 grows according to the velocity vector 72 located in
rectangle C3. It should be noted that the velocity vector 72 located in the
rectangle
C3 represents a change of direction with respect to the velocity vector 72
located in
the rectangle B3.
At time TIO, the front of the activation wavefront propagation path
trace 42 is located in the rectangle D2. Therefore, the activation wavefront
propagation path trace 42 now grows according to the direction and magnitude
of
the velocity vector 72 in rectangle D2. The velocity vector 72 in rectangle D2
is in
the same direction as the velocity vector 72 of rectangle B3, but has a larger
magnitude. Therefore, the activation wavefront propagation path trace 42 now
grows faster, which is indicated by the distance travelled in one time period
and a
shading of the head 83 of the activation wavefront propagation path trace 42.
At time Ti!, the activation wavefront propagation path trace 42 still
grows according to the velocity vector 72 of rectangle D2, thereby taking the
front
of the activation wavefront propagation path trace 42 into the rectangle E2 at
time
T12.
The velocity vector 72 of rectangle E2 is in a different direction to,
and has a faster magnitude than, the velocity vector 72 of rectangle D2.
Therefore,
the activation wavefront propagation path trace 42 grows according to the
direction
and magnitude of the velocity vector 72 of rectangle D2 into rectangle El at
time
T13. It will be noted that the head 83 of the activation wavefront propagation
path
trace 42 now has a solid fill to indicate the faster speed.
26
CA 3055473 2019-09-16
The processing circuitry 22 (Fig. 1) determines to end activation
wavefront propagation path trace 42 in rectangle El either because the
activation
wavefront propagation path trace 42 has a grown over a given distance or the
activation wavefront propagation path trace 42 has grown for a time period
equal to
a given time period.
Additionally, it should be noted that the location of the front of the
activation wavefront propagation path trace 42 has been used to determine
which
velocity vector 72 from the grid 82 should be used to determine direction and
speed
of growth. However, it will be appreciated that the location of any other part
of the
activation wavefront propagation path trace 42, e.g., the middle of the
activation
wavefront propagation path trace 42, may be used to determine which velocity
vector 72 from the grid 82 should be used to determine growth.
Various features of the invention which are, for clarity, described in
the contexts of separate embodiments may also be provided in combination in a
single embodiment. Conversely, various features of the invention which are,
for
brevity, described in the context of a single embodiment may also be provided
separately or in any suitable sub-combination.
The present invention is not limited by what has been particularly
shown and described hereinabove. Rather the scope of the invention is defined
by
the appended claims and equivalents thereof.
27
CA 3055473 2019-09-16