Note : Les descriptions sont présentées dans la langue officielle dans laquelle elles ont été soumises.
85757390
METHOD AND DEVICE FOR DETERMINING THE CONCENTRATION OF
ANALYTE IN WHOLE BLOOD
[0001] This application claims priority to U.S. Provisional Application No.
62/520,087, filed
June 15, 2017.
FIELD OF TECHNOLOGY
[0002] The present disclosure relates to the field of analysis of whole blood
and more
particularly to the field of determining the concentration of analyte in whole
blood.
BACKGROUND
[0003] Hemolysis is a phenomenon wherein the blood cells rupture in whole
blood, releasing
their content into the blood plasma. This condition may occur due to various
reasons such as
immune reactions, infections, and medications. Hemolysis may occur within the
body of an
individual or after the blood has been extracted out of the body. A major
cause of hemolysis
is the pre-analytical steps of blood sample handling, including collection of
the blood sample
from the body of an individual. As a result, the individual may have a
hemolytic condition,
such as sickle cell anemia. During hemolysis, the composition of the blood
plasma is altered
because of the contents of the blood cells spilling into the blood plasma. If
the composition
of the blood plasma is altered beyond a certain threshold, the blood sample is
flagged for
hemolysis. If the composition of the blood plasma is altered beyond a higher
threshold, the
blood sample may become incapable of further use and therefore has to be
rejected.
Therefore, the object of the invention is to provide a method to determine
concentration of
analytes, particularly extracellular hemoglobin, in a whole blood sample.
1
Date Recue/Date Received 2021-06-28
85757390
SUMMARY
[0004] A method for determining the concentration of an analyte in whole blood
sample is disclosed.
In one aspect of the invention, the method includes generating a plasma layer
in the whole blood
sample. The method also includes exposing the plasma layer to light
Furthermore, the method includes
capturing light reflected fiom the plasma layer. Additionally, the method also
includes analyzing the
reflected light to determine the concentration of the analyte.
100051 In another aspect, a device for determining the concentration of an
analyte in whole blood
sample includes a channel configured to carry whole blood; a light source
configured to direct light on
the channel; and a measuring unit The measuring unit is configured to capture
light reflected from the
surface of the channel. Furthermore, the measuring unit is configured to
compute a change in
wavelength of the reflected light, wherein the change is the wavelength of the
reflected light is
proportional to the concentration of the analyte in the whole blood.
10005a1 In another aspect, there is provided a method of determining the
concentration of an analyte
in a whole blood sample, the method comprising: flowing a whole blood sample
through a microfluidic
channel including an outer surface and an inner surface and wherein an optical
fiber is used inside the
channel, wherein the whole blood surrounds the optical fiber as it flows
through the channel, and
wherein the optical fiber is placed parallel to the central axis of the
channel such that the optical fiber
is not in contact with the inner surface of the microfluidic channel,
generating a cell-free plasma layer
around the optical fiber, and a cell-free plasma layer formed along the outer
surface of the microfluidic
channel, using Fahraeus Effect, and a layer of red blood cells in between the
cell-free plasma layers;
directing light at the plasma layer; capturing light reflected off of the
plasma layer; and analyzing the
reflected light to determine the concentration of the analyte.
100061 This summary is provided to introduce a selection of concepts in a
simplified form that are
further described below in the following description. It is not intended to
identify features or essential
features of the claimed subject matter. Furtheimore, the claimed subject
matter is not limited to
implementations that solve any or all disadvantages noted in any part of this
disclosure.
BRIEF DESCRIPTION OF THE DRAWINGS
100071 The present invention is further described hereinafter with reference
to illustrated embodiments
shown in the accompanying drawings, in which:
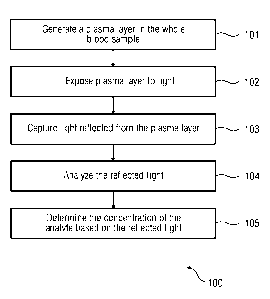
[0008] Figure 1 illustrates a flowchart of an exemplary method of detemiining
the concentration of an
analyte in whole blood.
2
Date Recue/Date Received 2022-09-30
CA 03067020 2019-12-11
WO 2018/231625
PCT/US2018/036434
[0009] Figure 2A illustrates a side view of an illustrative device which can
be used to
determine the concentration of an analyte in plasma.
[0010] Figure 2B illustrates a vertical cross sectional view of the
illustrative device which
can be used to determine the concentration of an analyte in plasma.
[0011] Figure 3A illustrates a side view of another embodiment of an
illustrative device
which can be used to determine the concentration of an analyte in plasma.
[0012] Figure 3B illustrates a schematic representation of a cross sectional
view of the
illustrative device which can be used to determine the concentration of
analyte in plasma.
DETAILED DESCRIPTION
[0013] Hereinafter, embodiments for carrying out the present invention are
described in
detail. The various embodiments are described with reference to the drawings,
wherein like
reference numerals are used to refer to like elements throughout. In the
following description,
for purpose of explanation, numerous specific details are set forth in order
to provide a
thorough understanding of one or more embodiments. It may be evident that such
embodiments may be practiced without these specific details. In other
instances, well known
materials or methods have not been described in detail in order to avoid
unnecessarily
obscuring embodiments of the present disclosure. While the disclosure is
susceptible to
various modifications and alternative forms, specific embodiments thereof are
shown by way
of example in the drawings and will herein be described in detail. It should
be understood,
however, that there is no intent to limit the disclosure to the particular
forms disclosed, but on
the contrary, the disclosure is to cover all modifications, equivalents, and
alternatives falling
within the spirit and scope of the present disclosure.
[0014] Optical detection of hemolysis in whole blood can be challenging
because of high
interference from blood cells, specifically red blood cells (RBCs). Separating
blood plasma
3
CA 03067020 2019-12-11
WO 2018/231625
PCT/US2018/036434
from whole blood in order to detect hemolysis is time consuming and arduous.
Therefore,
there exists a need for a method that can detect hemolysis which does not
require separation
of blood plasma from whole blood, which is faster and cost efficient.
100151 Figure 1 illustrates a flowchart of an embodiment of an exemplary
method 100 of
determining the concentration of an analyte present in whole blood. The method
100 includes
step 101 of generating a plasma layer in the whole blood sample. The plasma
layer in the
whole blood sample can be generated by passing the sample through a fluidic
channel, for
example, a microfluidic channel. The fluidic channel may be made of a
transparent medium,
for example, glass and includes an outer surface and an inner surface, When
whole blood
flows through a channel with a narrow diameter, the blood cells migrate to the
center of the
channel, thereby generating a layer of plasma at the walls of the channel.
This phenomenon
is termed as `Fahraeus effect'. Fahraeus
effect results in decrease in the average
concentration of red blood cells when the diameter of the channel through
which the blood
flows decreases. During hemolysis, the red blood cells rupture, thereby
resulting in spilling of
the contents of the red blood cells, including analytes such as hemoglobin
into the plasma.
[0016] By utilizing the Fahraeus effect, the concentration of the red blood
cells can be
decreased along the walls of the microfluidic channel. Therefore, the plasma
layer generated
along the walls of the microfluidic channel is devoid of red blood cells.
Thus, the
concentration of analytes, such as hemoglobin, in the plasma layer can be
effectively
determined without interference from the blood cells.
[0017] At step 102, the generated plasma layer is exposed to light. The plasma
layer is
irradiated with light of a wavelength in the range between 400-750 nm at an
angle greater
than the total internal reflection critical angle. The total internal
reflection critical angle is the
angle of incidence for which the light totally reflects from an interface. The
incident light
passes through the medium of the microfluidic channel and interacts with the
plasma layer
4
CA 03067020 2019-12-11
WO 2018/231625
PCT/US2018/036434
generated at the walls of the channel. In an embodiment, an index matching
substance may
be used along with the microfluidic channel so as to ensure that the
irradiated light is
reflected off the plasma layer and not the surface of the microfluidic
channel. Examples of
index matching substances include fluids and solids. Examples of index
matching fluids
include, but are not limited to, paraffin, glycerin, and sugar solution.
Examples of index
matching solids include, but are not limited to, glass. In an alternate
embodiment, the
microfluidic channel may also be pasted on to another piece of glass. The
refractive index of
the adhesive used between the microfluidic channel and the piece of glass
should be the same
as the refractive index of glass. Alternatively, the microfluidic channel may
also be etched
on a glass surface using techniques well known in the state of the art.
[0018] The irradiated light may be reflected multiple times by the plasma
layer, as depicted
in Figure 2A. Figure 2A illustrates a side view of an illustrative device 200
which can be
used to determine the concentration of an analyte in plasma. The device is a
fluidic device,
such as a microfluidic device. In the embodiment, a channel 209 is etched on a
first layer of
transparent material 208. The channel 209 may be, for example, a tnicrofluidic
channel. The
first layer of transparent material 208 includes an outer surface 202 and an
inner surface 203.
The microfluidic channel 209 is defined by the inner surface 203 of the
transparent material
208. A second layer of transparent material 207 is placed over the first layer
of transparent
material 208. The layers of transparent material 207, 208 may be made of index
matching
substances, for example, glass. The microfluidic channel 209 contains a whole
blood sample.
Using the Fahraeus Effect, the red blood cells 206 migrate to the center of
the microfluidic
channel 209, thereby generating a cell-free plasma layer 204 along the inner
surface 203 of
the microfluidic channel 209. Figure 2B illustrates a vertical cross sectional
view of the
illustrative device 200. The red blood cells 206 gather at the center of the
microfluidic
channel 209 using Fahraeus Effect. A layer of plasma 204 is generated around
the red blood
CA 03067020 2019-12-11
WO 2018/231625
PCT/US2018/036434
cells. The irradiated light 201 enters the glass surface and interacts with
the plasma layer 204
at the inner surface 203 of the micro fluidic channel 209. On hitting the
inner surface 203 of
the microfluidic channel 209, the light can be reflected multiple times
between the inner and
outer surfaces of the microfluidic channel 209. The critical angles for total
internal reflection
are different for the air-glass interface and glass-plasma interface. The
chosen incident angle
in Figs. 2A and 2B is greater than the critical angles for the air-glass
interface and glass-
plasma interface to ensure multiple reflections. At step 103, the reflected
light 205 is
captured. The reflected light 205 may be captured using a spectrophotometer.
At step 104,
the captured reflected light 205 is analyzed to detect a change in the
wavelength. The
wavelength of the reflected light 205 may vary according to the concentration
of the analyte
in the separated plasma layer 204. At step 105, the concentration of the
analyte is determined
based on the wavelength of the reflected light 205.
100191 Figure 3A illustrates a side view of another embodiment of an
illustrative device 300
which can be used to determine the concentration of an analyte in plasma. In
the
embodiment, the device 300 includes an optical Fiber 301 that is located
within the channel
309. The channel 309 may be a microfluidic channel. In illustrative
embodiments, the
optical fiber 301 may be located in or towards the center of the channel 309
or adjacent to the
interior surface of the channel 309. The whole blood sample flows through the
microfluidic
channel 309 at a constant flow rate. The rate at which the whole blood flows
through the
microfluidic channel 309 may be within a range at which Fahraeus Effect can be
effectively
achieved. The optical fiber 301 may be a thin, transparent fiber of glass or
plastic and is
without cladding. Figure 3B illustrates a vertical cross sectional view of the
device 300,
having a channel 309 with the optical fiber 301 located in the center. The
channel 309 is
defined by the outer surface 307 of the device 300. The optical fiber 301 is
placed parallel to
the central axis of the microfluidic channel 309. The central axis of the
microfluidic channel
6
CA 03067020 2019-12-11
WO 2018/231625
PCT/US2018/036434
309 is parallel to the flow path of the whole blood in the microfluidic
channel 309. In one
embodiment, the optical fiber 301 may be placed parallel to the central axis
such that the
optical fiber 301 is not in contact with the inner surface of the microfluidic
channel 309. Due
to the placement of the optical fiber 301 inside the microfluidic channel 309,
a layer of cell-
free plasma 302 is generated using Fahraeus Effect, around the optical fiber
301. An
additional layer of plasma 308 may also be Ruined along the walls of the
microfluidic
channel 309 using Fahraeus Effect. In between cell-free plasma layers 302 and
308, a layer
of red blood cells 306 is formed. In the embodiment illustrated in Figs. 3A
and 3B, this layer
of red blood cells 306 extends along, and encircles, the optical fiber. In an
alternate
embodiment, the optical fiber 301 may be placed in contact with the inner
surface of the
microfluidic channel 309. When light 303 is irradiated into the optical fiber
301, the light
303 interacts with the separated layer of plasma and gets reflected. Within
the optical fiber
301, the light 303 may be reflected multiple times 304 between the surfaces of
the optical
fiber 301. The phenomenon of multiple reflections 304 of the irradiated light
303 allows for
signal amplification and therefore enables accurate determination of the
concentration of the
analyte present in the whole blood sample. Therefore, the reflected light 305
is further
captured by the spectrophotometer and a change in the wavelength of the
reflected light 305
is detected. Based on the wavelength of the reflected light 305, the
concentration of the
analyte in the whole blood sample is determined, wherein the concentration of
the analyte is
proportional to the wavelength of the reflected light 305.
[0020] The method 100 enables measurement of hemolysis in the whole blood
sample in a
microfluidic environment. Therefore, the sample volume requirements are low.
Furthermore,
as no additional reagents are required for the determination of the
concentration of the
analyte, the method is cost effective. The whole blood sample may also be
retrieved for
7
CA 03067020 2019-12-11
WO 2018/231625
PCT/US2018/036434
further analysis or downstream processing once the process of determination of
the
concentration of the analyte is completed.
8