Note : Les descriptions sont présentées dans la langue officielle dans laquelle elles ont été soumises.
CA 03081569 2020-05-01
WO 2019/089990
PCT/US2018/058792
ENTITY SEGMENTATION FOR ANALYSIS OF SENSITIVITIES TO
POTENTIAL DISRUPTIONS
[001] This application claims priority to U.S. Serial No. 15/801,265, filed
November
1, 2017, the contents of which are fully incorporated by reference.
TECHNICAL FIELD
[002] The subject matter described herein relates to analysis of potential
disruptions
to a population, and more particularly to an entity segmentation and risk
calculating systems
and methods.
BACKGROUND
[003] Risk scoring is widely used by banks and other financial institutions
for
assessing, and reporting, a measure of the creditworthiness of individuals.
Often, risk scores
are generated for an individual for a particular transaction, such as
obtaining a mortgage or
other loan, or opening up a new credit line such as applying for a credit
card. To generate a
risk score, a risk management reporting agency, such as Experian, and
typically at the request
of a bank or financial institution, applies a modeling algorithm to the credit
data associated
with an individual.
[004] Often, the individual is pre-sorted into one of a number of segments
or
scorecards within the overall modeling algorithm ("risk scoring system"). Each
scorecard in
the system has its own a unique set of characteristics or attributes to be
calculated from an
individual's risk report data. Based on what is typically a highly proprietary
algorithm and
weighting scheme, a risk scoring system will generate a score within a range
of scores.
Where the individual's score lands within the range of scores is a primary
indication of that
1
CA 03081569 2020-05-01
WO 2019/089990
PCT/US2018/058792
individual's creditworthiness. For instance, a score at a higher level of the
range indicates
that the individual may be a very low default risk and is likely to be
extended credit by the
bank or financial institution. Conversely, a score at a lower level of the
range indicates that
the individual may be a very high default risk, and is likely to be denied
credit by the bank or
financial institution. Risk scores have application in other areas as well,
such as being a
factor to determine the interest rate to charge for the loan or in determining
a credit line
adjustment.
[005] Most of the effective and reliable risk scoring systems, such as the
FICO
Scores produced by Fair Isaac Corporation of San Jose, CA, focus their scoring
on a
comprehensive set of categories of information from the risk report, depending
on the
objective of the risk scoring system. For example, the FICO Score is driven
by a number of
categories including, without limitation or particular weighting, payment
history, amount of
debt, length of credit history, type of new credit requested, and credit mix.
A risk scoring
algorithm may calculate characteristics from each of these categories, assign
component
score weights based on the characteristic values, and then produce an
aggregate score.
[006] When outputting a risk score, a risk bureau will usually also output
up to five
risk score factors indicating the top reasons why that score was not higher.
For example, a
report can include a risk score, as well as a list of factors that have
weighed adversely on that
score, such as the number of late payments, the ratio of balance to available
credit, and/or a
duration over which certain credit accounts have been held by the individual.
Such factors
may be helpful to the individual for understanding what might be affecting
their risk score.
[007] Conventional techniques do not take into account how certain
financial and
economic disruptions may affect a consumer's future payment performance and
their future
risk score. That is, given a consumer's history, conventional techniques do
not take into
account whether a risk score may move in a positive direction or negative
direction.
2
CA 03081569 2020-05-01
WO 2019/089990
PCT/US2018/058792
[008] Accordingly, what is needed is a solution that provides more accurate
risk
score predictions in response to future conditions that could affect a
consumer's future
payment performance or future risk score. Further, there is a need to segment
a seemingly
homogenous population into different groups in order to more accurately
reflect their
response to a future condition.
SUMMARY
[009] This document presents systems, methods, and techniques to analyze an
entity's sensitivity index value and calculate a risk score based on the
sensitivity index value,
the sensitivity index value can indicate the entity's predicted response to a
future
condition/event.
[0010] In one
aspect, a computer implemented method is provided. The method
includes receiving, at a computer processor, one or more attributes associated
with a first
entity. The method further includes calculating, by the computer processor, a
sensitivity
index for the first entity based on the one or more attributes. The
calculating the sensitivity
index includes creating a matched sample of entities, the entities sharing at
least one attribute
value of the one or more attributes, the matched sample of entities comprising
a first sub-
population of the entities experiencing a first condition and a second sub-
population of the
entities experiencing a second condition, the first sub-population different
from the second
sub-population. Calculating the sensitivity index further includes
calculating, for each entity
of the matched sample of entities, a sensitivity value associated with the
entity, the
calculating comprising subtracting an expected performance under the first
condition with an
expected performance under the second condition. Calculating the sensitivity
index further
includes segmenting, by the computer processor, any sample of entities into
two or more
segments based on the sensitivity value of each entity, the sensitivity index
comprising one of
3
CA 03081569 2020-05-01
WO 2019/089990
PCT/US2018/058792
the two or more segments. The method further includes calculating, by the
computer
processor, a second risk score for the first entity based on the sensitivity
index and the first
risk score of the entity. The method further includes outputting, by the
computer processor,
the second risk score to a user interface.
[0011] In
another aspect, a non-transitory computer program product storing
instructions that, when executed by at least one programmable processor, cause
at least one
programmable processor to perform operations is provided. The operations
include receiving,
at a computer processor, one or more attributes associated with a first
entity. The operations
further include calculating, by the computer processor, a sensitivity index
for the first entity
based on the one or more attributes. Calculating the sensitivity index
includes creating a
matched sample of entities, the entities sharing at least one attribute value
of the one or more
attributes, the matched sample of entities comprising a first sub-population
of the entities
experiencing a first condition and a second sub-population of the entities
experiencing a
second condition, the first sub-population different from the second sub-
population.
Calculating the sensitivity index further includes calculating, for each
entity of the matched
sample of entities, a sensitivity value associated with the entity, the
calculating comprising
subtracting an expected performance under the first condition with an expected
performance
under the second condition. Calculating the sensitivity index further includes
segmenting, by
the computer processor, any sample of entities into two or more segments based
on the
sensitivity value of each entity, the sensitivity index comprising one of the
two or more
segments. The operations further include calculating, by the computer
processor, a second
risk score for the first entity based on the sensitivity index and the first
risk score of the
entity. The operations further include outputting, by the computer processor,
the second risk
score to a user interface.
4
CA 03081569 2020-05-01
WO 2019/089990
PCT/US2018/058792
[0012] In
another aspect a system is provided. The system includes at least one
programmable processor. The system further includes a machine-readable medium
storing
instructions that, when executed by the at least one processor, cause the at
least one
programmable processor to perform operations. The operations include
receiving, at a
computer processor, one or more attributes associated with a first entity. The
operations
further include calculating, by the computer processor, a sensitivity index
for the first entity
based on the one or more attributes. Calculating the sensitivity index
includes creating a
matched sample of entities, the entities sharing at least one attribute value
of the one or more
attributes, the matched sample of entities comprising a first sub-population
of the entities
experiencing a first condition and a second sub-population of the entities
experiencing a
second condition, the first sub-population different from the second sub-
population.
Calculating the sensitivity index further includes calculating, for each
entity of the matched
sample of entities, a sensitivity value associated with the entity, the
calculating comprising
subtracting an expected performance under the first condition with an expected
performance
under the second condition. Calculating the sensitivity index further includes
segmenting, by
the computer processor, any sample of entities into two or more segments based
on the
sensitivity value of each entity, the sensitivity index comprising one of the
two or more
segments. The operations further include calculating, by the computer
processor, a second
risk score for the first entity based on the sensitivity index and the first
risk score of the
entity. The operations further include outputting, by the computer processor,
the second risk
score to a user interface.
[0013] In some
variations one or more of the following can optionally be included.
Calculating the sensitivity index further includes determining a number of
matched entities of
a population that share similar attribute values of the at least on attribute
at a start time but
subsequently experience two different conditions, the number of entities
satisfying a
CA 03081569 2020-05-01
WO 2019/089990
PCT/US2018/058792
threshold, the matched sample of entities comprising the number of entities.
Determining a
number of matched entities of a population that share similar attribute values
is based on a
propensity score. Calculating the sensitivity index further includes
regressing the matched
entities' credit performance values based on the matched entities' attributes
at the scoring
date and based on the conditions subsequently experienced by the matched
entities.
Calculating the sensitivity index further includes generating, based on the
regressing, a
regression model to predict sensitivity values from the matched entities'
attributes.
Calculating the sensitivity index further includes predicting, based on the
regression model, a
sensitivity value of any entity of interest. Calculating the sensitivity index
further includes
predicting a first outcome for each matched entity under the first condition.
Calculating the
sensitivity index further includes predicting a second outcome for each
matched entity under
the second condition. Calculating the sensitivity index further includes
calculating, based on
the predicted first and second outcomes, a sensitivity index for each matched
entity.
Calculating the sensitivity index further includes subtracting the predicted
first outcome
under the first condition from the predicted second outcome under the second
condition
[0014] The
first condition can include a stressed condition and the second condition
can include a normal condition. The stressed condition can include one or more
of: a
recession, a depression, a change in debt, a change in job position, an
injury, an accident, a
marriage, a divorce, a new child, a change in interest rates, a change in a
stock market, a
change in debt, a change in credit balance, a new vehicle or home purchase, a
severe weather
event, a change in health insurance, an exam result, a change in residence, a
change in diet, a
change in expenses, enrollment in a coaching, or a change in income. The
sensitivity index
can include at least two segment values, the at least two segment values
comprising a first
sensitivity index value and a second sensitivity index value, wherein the
first sensitivity index
value indicates substantially no change in a probability of payment default,
and wherein the
6
CA 03081569 2020-05-01
WO 2019/089990
PCT/US2018/058792
second sensitivity index value indicates an increased probability of payment
default. The
sensitivity index for the first entity can include the second sensitivity
index value, wherein
the second risk score is lower than the first risk score. The method and/or
operations can
further include calculating a probability of repayment for the first entity
based on the first risk
score and the second risk score.
[0015]
Implementations of the current subject matter can include, but are not limited
to, systems and methods consistent including one or more features are
described as well as
articles that comprise a tangibly embodied machine-readable medium operable to
cause one
or more machines (e.g., computers, etc.) to result in operations described
herein. Similarly,
computer systems are also described that may include one or more processors
and one or
more memories coupled to the one or more processors. A memory, which can
include a
computer-readable storage medium, may include, encode, store, or the like one
or more
programs that cause one or more processors to perform one or more of the
operations
described herein.
Computer implemented methods consistent with one or more
implementations of the current subject matter can be implemented by one or
more data
processors residing in a single computing system or multiple computing
systems. Such
multiple computing systems can be connected and can exchange data and/or
commands or
other instructions or the like via one or more connections, including but not
limited to a
connection over a network (e.g. the Internet, a wireless wide area network, a
local area
network, a wide area network, a wired network, or the like), via a direct
connection between
one or more of the multiple computing systems, etc.
[0016] The
details of one or more variations of the subj ect matter described herein are
set forth in the accompanying drawings and the description below. Other
features and
advantages of the subject matter described herein will be apparent from the
description and
drawings, and from the claims. While certain features of the currently
disclosed subject
7
CA 03081569 2020-05-01
WO 2019/089990
PCT/US2018/058792
matter are described for illustrative purposes in relation to an enterprise
resource software
system or other business software solution or architecture, it should be
readily understood
that such features are not intended to be limiting. The claims that follow
this disclosure are
intended to define the scope of the protected subject matter.
DESCRIPTION OF DRAWINGS
[0017] The
accompanying drawings, which are incorporated in and constitute a part
of this specification, show certain aspects of the subject matter disclosed
herein and, together
with the description, help explain some of the principles associated with the
disclosed
implementations. In the drawings,
[0018] FIG. 1
is a diagram illustrating schematically the interplay of predictions,
disruptions, and future payment performance, in accordance with aspects
described herein;
[0019] FIG. 2
is a diagram illustrating how different consumers may react to different
stress factors, in accordance with aspects described herein;
[0020] FIG. 3
is a diagram of a table illustrating economic sensitivity and balance
change sensitivity, in accordance with aspects described herein;
[0021] FIG. 4
is a diagram of a table illustrating risk scores and economic sensitivity
for a plurality of consumers, in accordance with aspects described herein;
[0022] FIG. 5
is a diagram of a scoring system utilizing a custom model predicting
point estimates of repayment odds based on a risk score and other attribute
values, in
accordance with aspects described herein;
[0023] FIG. 6
is a diagram of a scoring system utilizing a custom model predicting
scenario estimates of repayment odds based on a risk score, a recessionary
risk score and
other attribute values, in accordance with aspects described herein;
8
CA 03081569 2020-05-01
WO 2019/089990
PCT/US2018/058792
[0024] FIG. 7
is a diagram of a table illustrating different consumers associated with
different risk scores based on their economic sensitivity index (ESI) values,
in accordance
with aspects described herein;
[0025] FIG. 8A
is a diagram of a table illustrating different consumers associated
with different risk scores and different balance change sensitivity values, in
accordance with
aspects described herein;
[0026] FIG. 8B
is a diagram illustrating an exemplary decision tree lenders may use
to incorporate sensitivities to make a credit card limit strategy, in
accordance with aspects
described herein;
[0027] FIG. 9
is a diagram of an individual's sensitivity with respect to two different
conditions (e.g., a normal and stressed condition), in accordance with aspects
described
herein;
[0028] FIG. 10
is a time diagram that illustrates a longitudinal study design, in
accordance with aspects described herein;
[0029] FIG.
11A is a diagram illustrating a difference between an average number of
inquiries for the 20% most economic sensitive and the 20% least economic
sensitive
consumers within a risk score band, in accordance with aspects described
herein;
[0030] FIG.
11B is a diagram illustrating a difference between an average total trade
line balance for the 20% most economic sensitive and the 20% least economic
sensitive
consumers within a risk score band, in accordance with aspects described
herein;
[0031] FIG.
11Cis a diagram illustrating a difference between an average number of
months since the most recent trade line for the 20% most economic sensitive
and the 20%
least economic sensitive consumers within a risk score band, in accordance
with aspects
described herein;
9
CA 03081569 2020-05-01
WO 2019/089990
PCT/US2018/058792
[0032] FIG.
11D is a diagram illustrating a difference between an average number of
times 90 days past due for the 20% most economic sensitive and the 20% least
economic
sensitive consumers within a risk score band, in accordance with aspects
described herein;
[0033] FIG.
12A is a diagram illustrating a difference between an average number of
months since the oldest trade line opened for the 20% most balance change
sensitive and the
20% least balance change sensitive consumers within a risk score band, in
accordance with
aspects described herein;
[0034] FIG.
12B is a diagram illustrating a difference between an average total
revolving trade line balance for the 20% most balance change sensitive and the
20% least
balance change sensitive consumers within a risk score band, in accordance
with aspects
described herein;
[0035] FIG.
12C is a diagram illustrating a difference between an average number of
months since the most recent trade line for the 20% most balance change
sensitive and the
20% least balance change sensitive consumers within a risk score band, in
accordance with
aspects described herein;
[0036] FIG.
12D is a diagram illustrating a difference between an average amount
paid down on installment loans for the 20% most balance change sensitive and
the 20% least
balance change sensitive consumers within a risk score band, in accordance
with aspects
described herein;
[0037] FIG.
12E is a diagram illustrating a difference between an average number of
times 90 days past due for the 20% most balance change sensitive and the 20%
least
economic sensitive consumers within a risk score band, in accordance with
aspects described
herein;
CA 03081569 2020-05-01
WO 2019/089990
PCT/US2018/058792
[0038] FIG. 13
is a diagram illustrating schematically the interplay of predictions,
disruptions, and future entity behavior, in accordance with aspects described
herein;
[0039] FIG. 14
depicts a block diagram illustrating a computing system, in
accordance with aspects described herein; and
[0040] FIG. 15
is a flowchart of a method for segmenting a population based on
sensitivities and a calculating risk score based on the segmented
sensitivities, in accordance
with aspects described herein.
[0041] When
practical, similar reference numbers denote similar structures, features,
or elements.
DETAILED DESCRIPTION
[0042] This
document describes a system and method to analyze entities and segment
them based on their sensitivities to certain conditions. Using the sensitivity
segments, a risk
scoring system can better detect high default risk entities and more
accurately predict entity
future behavior. Further, the systems and methods described herein provide a
mechanism for
calculating sensitivity index values for entities.
[0043]
Traditional risk scores predict future payment performance of entities
(accounts, borrowers, consumers, small and medium sized enterprises) on their
payment
obligations. The scores are used by lenders and investors to group portfolios
consisting of
heterogeneous entities into score bands such that entities in any given band
are homogeneous
in expected future payment performance, and such that default odds vary
substantially
between score bands. The score bands are then managed and priced
differentially according
to their predicted default odds. For example a lender may entice the highest
score bands
(those with lowest predicted default odds) with low interest rates and high
credit limits,
11
CA 03081569 2020-05-01
WO 2019/089990
PCT/US2018/058792
charge higher interest rates and offer smaller limits to medium score bands,
and deny credit
for low risk score bands.
[0044] Risk
scores are based on borrower attributes observed at scoring date and are
developed with the objective to rank-order borrowers' expected future payment
performances. The scores are also calibrated to predict borrowers' odds of
default.
[0045] In some
aspects, future substantial changes, or disruptions, to borrowers'
situations following scoring date can have a substantial impact on payment
performance that
is not predicted by risk scores. As one consequence, such disruptions can lead
to substantial
discrepancies between predicted and actual future default odds. As another
consequence,
such changes can also reduce the rank ordering performance of the scores.
[0046] For
example, for a given economic disruption, analysis of the resulting
economic impact may indicate that actual default odds for a group of consumers
in a
homogeneous risk score band were substantially higher for a sub-group exposed
after a
scoring date to a recessionary economy, than for another sub-group exposed
after the scoring
date to a stable economy.
[0047] In
another example, for a given disruption in financial obligations, analysis of
the resulting economic impact may indicate that actual default odds for a
group of consumers
in a homogeneous risk score band were substantially higher for a sub-group who
after a
scoring date increased their credit card balances by substantial amounts
(thereby increasing
their financial obligations), than for another sub-group who after the scoring
date did not
increase their card balances by a substantial amount.
[0048] In some
aspects, it may be desirable for lenders to identify those who are not
in a financially robust situation if they face an unexpected, unavoidable cost
for an expensive
medical procedure, or another unexpected expense. There are many sources and
types of
12
CA 03081569 2020-05-01
WO 2019/089990
PCT/US2018/058792
disruptions that might have an impact on entities' loan repayment behavior,
including, but not
limited to: interest rate shocks, changes to income or employment status,
changes to
individuals' social relationships, property loss, accidents, injuries and
illnesses, etc. In
general it can be difficult, costly, and often quite impractical, to try to
predict future
disruptions with a high degree of confidence. Accordingly, it may be
beneficial for a scoring
system to account for future disruptions that are undetermined and unpredicted
at a scoring
date.
[0049] FIG. 1
is a diagram 100 illustrating schematically the interplay of predictions,
disruptions, and future payment performance. A risk score inputs an entity's
observable
attributes 104 at a scoring date to predict the entity's future payment
performance 110. The
entity can include an individual, a group of individuals, a business entity,
or other entity. A
disruption 102 can impact the entity's future payment performance. The
disruption 102 can
include a recession, substantial new debt incurred, an interest rate shock, a
new vehicle
purchase, an accident/injury, loss of job, a promotion, a marriage, a divorce,
a new child, or
any other condition that may cause an impact on the entities financial or
payment
performance 110. As a consequence the risk score's prediction might
misestimate future
payment performance if a disruption occurs.
[0050]
Disruption examples discussed herein relate to unfavorable changes to
situations (e.g., tough economy, growing balances, medical expenses etc.),
also referred to as
"financial stress factors." The disruptions and financial stress factors can
apply equally to
both positive or favorable disruptions (e.g. job promotion, inheritance,
lottery win) as to
negative or unfavorable disruptions. Typically an entity's payment performance
is expected
to worsen if an unfavorable disruption occurs, and the opposite might be
expected when a
favorable disruption occurs. However, it is possible that if an unfavorable
disruption occurs,
some entities' payment performance may not worsen and some may actually
improve. For
13
CA 03081569 2020-05-01
WO 2019/089990
PCT/US2018/058792
example, certain financially astute consumers might redouble their efforts to
repay their debt
when the economy worsens, or certain investors may derive gains from a
recession. Similar,
if a favorable disruption occurs, some entities' payment performance may not
improve and
some may actually worsen. For example, a lottery win may seduce certain
individuals' to live
above their means and eventually go bankrupt as a consequence.
[0051] Through
improved modeling and analysis it is possible to gain insight into the
variety of possible responses of entities to disruptions, without making any
assumptions
neither on the directional impact nor the magnitude of the effect of
disruptions on individual
entities' payment performances. Accordingly, the entity segmentation for
analysis of
economic sensitivity discussed herein may beneficially add flexibility and
improved accuracy
to current risk scoring models not previously available. The benefit occurs in
at least
segmenting heterogeneous entities into "sensitivity segments" based on a
sensitivity to a
disruption/condition to more accurately predict future payment performance.
The entities in
any given sensitivity segment can be similarly impacted by a certain type, or
definition of, a
disruption/condition.
[0052]
Substantially worsening economic conditions, as exemplified by the Great
Recession, and amassing debt, as exemplified by rapidly growing credit card
balances, can be
referred to as economic and financial stress factors. A consumer may or may
not be exposed
to a certain stress factor. Exposure to a stress factor may drive certain
consumers to renege on
their future credit obligations, whereas other consumers exposed to the same
stress factor
may hardly be affected. It may be beneficial to measure this effect to more
accurately predict
future payment performance and reflect that prediction in a risk score. In
some
implementations, a processor can implement a scoring system and create an
ordinal scale of
consumer sensitivities for each type, or definition, of a disruption or a
stress factor. In some
aspects, consumers can be ranked and segmented according to their
sensitivities.
14
CA 03081569 2020-05-01
WO 2019/089990
PCT/US2018/058792
[0053] FIG. 2
is a diagram illustrating how different consumers may react to different
stress factors. The left-hand side of the diagram represents consumers
resilient and resistant
to stress factors (e.g., low sensitivity) and the right-hand side of the
diagram represents
consumers vulnerable to stress factors (e.g., high sensitivity). Consumers can
be located
along the continuum between the two sides to indicate their relative response
to stress factors.
Consumers more to the left of the continuum can be less vulnerable and
affected than
consumers to the right of the continuum. As shown in FIG. 2, a consumer can be
located at
position 205 along the continuum slightly to the left of the halfway point
between the two
sides. Accordingly, the consumer located at position 205 may have a lower
sensitivity than
the medium or mean of consumers measured.
[0054] In some
aspects, a scoring system may implement sensitivity scales (e.g.,
ordinal scales) to group consumers into sensitivity segments. For example, all
US consumers
with access to credit can be arranged into 3 economic sensitivity segments
labeled "Low",
"Medium" and "High", each segment containing 33% of the population. The
economic
sensitivity segments can be allocated by rank ordering the consumers from the
lowest ordinal
economic sensitivity to the highest, then designating the first 33.33% to the
"Low" segment,
the next 33.33% to the "Medium" segment, and the final 33.33% to the "High"
segment. In
an analogous manner, credit card balance change sensitivity segments, or
segments pertaining
to other types of disruptions, can be constructed.
[0055] While
three economic sensitivity segments based on distribution terciles are
described herein, any number of segments can be generated as desired with
lesser or finer
granularities and possibly non-equal segment proportions. Segmentations with
finer
granularities can also be constructed by incorporating other variables into
the segment
definitions. For example the sub-population grouped within the FICO Score
band from 678
to 682 (or any other sub-population score band of interest) could be further
sub-segmented
CA 03081569 2020-05-01
WO 2019/089990
PCT/US2018/058792
into sensitivity quintiles obtained from the distribution of sensitivities
within the particular
score band of interest.
[0056] Having
constructed stress-sensitivity segments for various types of
disruptions, entities (e.g., consumers) can be more deeply and more easily
understood and
managed in terms of the risks they pose to lenders, by not only taking into
account their risk
scores such as the FICO score, but in addition, also calling out the extra
risks due to
impacts of possible future disruptions. These extra risks increase for
consumers who are more
sensitive to disruptions.
[0057] FIG. 3
is a diagram of a table 300 illustrating economic sensitivity and balance
change sensitivity. As shown, consumer economic sensitivity and consumer
balance change
sensitivity are segmented into three segments (High, Medium, and Low). In some
aspects,
economic sensitivity measures consumer sensitivity (e.g., payment performance)
to economic
stress factors such as a recession, depression, high inflation, or the like.
In some aspects,
consumer balance change sensitivity measures consumer sensitivity to credit
balance
changes. For example, consumers who increase their likelihood of defaulting in
response to a
substantial credit card balance increase may be allocated to the High credit
card balance
sensitivity segment.
[0058]
Knowledge of consumer sensitivities can enable lenders to take mitigating
actions in order to reduce total risk, which arises in part is due to
unpredicted disruptions. As
an example, a lender worried about the next recession might reduce exposure to
consumers
with high economic sensitivities and increase exposure to consumers with low
economic
sensitivities. The lender might consider combinations of FICO Score values
(or other risk
score values) and economic sensitivity segments to create preference rankings
whereby a
consumer with a marginally lower FICO Score yet a favorably low economic
sensitivity
might be preferred over a consumer with slightly higher FICO score yet an
unfavorably
16
CA 03081569 2020-05-01
WO 2019/089990
PCT/US2018/058792
high economic sensitivity. Preferences might be expressed through marketing
targeting,
through accepting or rejecting a credit line request, through settings of loan
limits, through
pricing, etc.
[0059] FIG. 4
is a diagram of a table 400 illustrating risk scores and economic
sensitivity for a plurality of consumers. As shown in FIG. 4, consumer #1 has
a risk score of
674 and a Low economic sensitivity index (ESI). Consumer #2 has a risk score
of 682 and a
High ESI. In some aspects, while consumer #1 has a lower risk score than
consumer #2, a
lender may prefer consumer #1 over consumer #2 because consumer #1 has a Low
ESI and
may be more resilient and less sensitive to negative economic stress factors
and/or
disruptions. In some implementations, a processor may display an icon, button,
alert, or other
indication on a user interface to indicate that the consumer has a favorable
or unfavorable
ESI As shown in FIG. 4, consumers with a Low ESI are indicated by a green
"thumbs up"
icon while consumers with a High ESI are indicated by a red "thumbs down"
icon.
[0060] In some
implementations, lenders can use the consumer risk score (e.g.,
FICO Score), along with other attributes, as inputs to custom models which
produce point
estimates of repayment odds for particular products, such as a mortgages,
instalment loans,
auto loans or credit cards.
[0061] FIG. 5
is a diagram of a scoring system 500 utilizing a custom model 510
predicting point estimates 520 of repayment odds based on a risk score 502 and
other
attribute values 504. In some aspects, the other attribute values 504 can
include delinquency
history, current income, length of employment, or other information about the
consumer
obtained by the lender to help make a lending decision.
[0062] These
lenders can expand the use of their custom models to not only produce
point estimates of odds but also to generate stressed scenario estimates of
odds. This can be
17
CA 03081569 2020-05-01
WO 2019/089990
PCT/US2018/058792
achieved by switching the "normal" risk score 502 (e.g., FICO Score) input to
a
"Recessionary Risk Score" (e.g., Recessionary FICO Score).
[0063] FIG. 6
is a diagram of a scoring system 600 utilizing the custom model 510
predicting point estimates 620 of repayment odds based on a recessionary risk
score 602 and
other attribute values 504. The recessionary risk score 602 (e.g.,
Recessionary FICO Score)
is a recalibrated version of the "normal" risk score 502 that is adjusted to a
recession in a
manner that is highly individualized to consumers' economic stress
sensitivities. The
recessionary risk score 602 can further be adjusted according to an assumed
severity of a
recession.
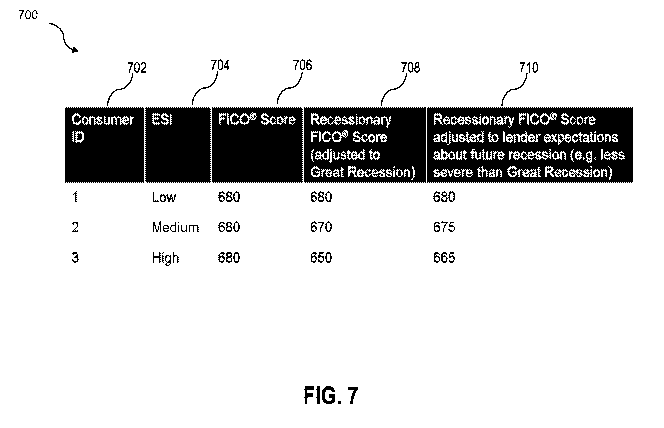
[0064] FIG. 7
is a diagram of a table 700 illustrating different consumers associated
with different risk scores based on their economic sensitivity index (ESI)
values. Column 702
comprises consumer identifiers, column 704 comprising ESI values for the
consumers,
column 706 comprises "normal" risk scores (e.g., FICO scores), column 708
comprises a
first recessionary risk score (e.g., first recessionary FICO score), and
column 710 comprises
a second recessionary risk score (e.g., second recessionary FICO score. As
shown in FIG.
7, consumer 1 can be associated with a FICO Score of 680 and with a Low
economic
sensitivity index (ESI) value. Through the use of a risk scoring model, the
consumer can be
assigned first and second recessionary FICO Scores of 680 (e.g., recession
has no impact
on a consumer with Low economic sensitivity) based on the Low ESI value and
the normal
risk score of 680. However, consumer 3 can also be associated with a FICO
Score of 680
but with a High ESI value. The risk scoring model can assign a first
recessionary FICO
Score of 650 based on the High ESI value. In this example, the first
recessionary FICO
Scores in column 708 were calibrated to the last US recession (the so-called
Great
Recession.) A lender may have different expectations about a future recession,
for example
that it will be less severe than the Great Recession, and calculate the second
recessionary
18
CA 03081569 2020-05-01
WO 2019/089990
PCT/US2018/058792
FICO Scores in column 710. As shown in FIG. 7, consumer 3 can be assigned a
second
recessionary FICO Score of 665 accordingly to deviate less from the FICO
Score 680
than the scenario for the first recessionary FICO Score of 650 (e.g., for the
Great
Re cessi on).
[0065] In
other implementations, a credit card lender worried about affordability of
future card balances might extend more conservative limits to (or seek to
decrease limits for)
consumers in high balance change sensitivity segments while extending more
aggressive
limits to consumers with low balance change sensitivity. The lender might
consider
combinations of risk score (e.g., FICO Score) values and balance change
sensitivity
segments to create new swap sets whereby a consumer with a marginally lower
risk score but
a favorable low balance change sensitivity might be preferred over a consumer
with slightly
higher risk score but unfavorable high balance change sensitivity.
[0066] FIG. 8A
is a diagram of a table 800 illustrating different consumers associated
with different risk scores and different balance change sensitivity values.
Column 802
comprises consumer identifiers, column 804 comprises risk scores (e.g., FICO
scores),
column 806 comprises balance change sensitivity values. As shown in FIG. 8A,
consumer #5
has a risk score of 732 and a Low balance change sensitivity rating. Consumer
#6 has a risk
score of 746 and a High balance change sensitivity rating. In some aspects,
while consumer
#5 has a lower risk score than consumer #6, a lender may prefer consumer #5
over consumer
#6 because consumer #5 has a Low balance change sensitivity rating and may be
more
resilient and less sensitive to negative economic stress factors and/or
disruptions.
[0067] In some
aspects, a lender can combine different sensitivity segments and apply
them in a customized model in order to better predict future performance or
target certain
consumers. For example, a credit card lender worried about both a possible
future recession
and the affordability of additional credit card balances, might create
combinations of
19
CA 03081569 2020-05-01
WO 2019/089990
PCT/US2018/058792
associated sensitivity segments, and design different card limit treatments
for each segment
combination. For example, Table 1 below illustrates different treatments the
lender may
apply to consumers associated with different combinations of economic
sensitivity values and
balance change sensitivity values. As shown in Table 1, a consumer with a
"Low" economic
sensitivity and balance change sensitivity values may receive a large credit
limit increase
while a consumer with both "High" economic sensitivity and balance change
sensitivity
values may receive a decrease in their credit limit.
Table 1
Segment combination Treatment
Economic Sensitivity = 'Low' and Balance Change Sensitivity = 'Low' Large
increase
Economic Sensitivity = 'Low' and Balance Change Sensitivity = Medium
'Medium' increase
Economic Sensitivity = 'Low' and Balance Change Sensitivity = 'High' Small
increase
Economic Sensitivity = 'Medium' and Balance Change Sensitivity = Small
increase
'Low'
Economic Sensitivity = 'Medium' and Balance Change Sensitivity = No
increase
'Medium'
Economic Sensitivity = 'Medium' and Balance Change Sensitivity = Seek
decrease
'High'
Economic Sensitivity = 'High' and Balance Change Sensitivity = 'Low' No
increase
Economic Sensitivity = 'High' and Balance Change Sensitivity = Seek
decrease
'Medium'
Economic Sensitivity = 'High' and Balance Change Sensitivity = 'High' Seek
decrease
[0068]
Sensitivity segments might also be used in conjunction with risk scores and
may be further refined based on other attributes and scores, such as
delinquency history and
customer revenue scores, to further differentiate and treatments between
different types of
consumers. Lenders using decision tree technology to map entities' attribute
values 504 and
risk scores (e.g., risk scores 502 and/or 602) to treatments can enhance their
set of decision
keys by the new sensitivity segments (e.g., economic sensitivity and/or
balance change
sensitivity segments) in order to capitalize on them when designing improved
treatment
strategies.
CA 03081569 2020-05-01
WO 2019/089990
PCT/US2018/058792
[0069] FIG. 8B
is a diagram 850 illustrating an exemplary decision tree lenders may
use to incorporate sensitivities to make a credit card limit strategy, in
accordance with aspects
described herein. Lenders can use these decision trees as "strategies" or
"policies" to map
value ranges of risk scores and/or other attributes to segments of entities
that will receive
different treatments. These decision rules and mappings from risk scores and
attributes to
treatments, can be refined by adding sensitivity indices as additional inputs
into the strategies.
As shown in FIG. 8B, a credit card balance change sensitivity index (BC SI)
can be included
an additional layer to make a credit card limit strategy (represented as a
decision tree here)
more robust. The lender's current strategy 860 may consider the FICO Score
and a card
utilization to assign limit increases. For example, as shown at node 880, a
customer with a
high FICO Score and high utilization may receive a $10,000 increase with the
current
strategy 860. With the additional input of a consumer's BCSI, the lender can
refine the
strategy with an addition layer 870. For example, the lender can alter limit
decisions by
considering balance change sensitivity. For example, consumers with high FICO
Score, high
utilization, and a High balance change sensitivity, can receive only a $8,000
increase (node
884), whereas consumers with high FICO Score, high utilization, and a Low
balance change
sensitivity, can receive a $12,000 increase (node 882).
[0070] In some
implementations, population and portfolio distributions of risk scores
such as the FICO Score are tracked and used by regulators and investors to
assess the
relative vulnerability of populations of entities such as loan portfolios and
securitized assets
over the economic cycle. Similarly, tracking distributions of sensitivities to
financial stress
factors or other disruptions can inform regulators and investors about extra
risks due to
possible future disruptions that risk scores may not capture. These
sensitivities can
beneficially provide a way to monitor and assess the relative vulnerability of
loan portfolios
21
CA 03081569 2020-05-01
WO 2019/089990
PCT/US2018/058792
and securitized assets due to the economic cycle and/or due to balance growth,
and could
form an input into portfolio "stress testing."
[0071] For
sensitivity monitoring, either the proportions of a population or portfolio
across sensitivity segments defined based on ordinal sensitivity scale break
points can be
tracked, or ordinal sensitivity estimates can be used to calculate summary
statistics (means
and variances) of ordinal sensitivity segments across portfolios.
[0072] In some
aspects, it is possible to define an entity's sensitivity to a disruption or
stress factor in the framework of the Rubin causal model, as the difference
between potential
payment performances for the entity when subjected to alternative situations
or conditions,
namely a "normal" condition and a "stressed" condition. As such, an entity's
sensitivity is an
individual-level causal effect of a binary condition on future payment
performance. In this
framework, normal and stressed conditions appear as two arms of a thought
experiment. In
reality an entity can only travel along one arm of the experiment for which
the entity's
performance is then observed. Performance for the untraveled arm cannot be
observed.
[0073] FIG. 9
is a diagram 900 of an individual's sensitivity under two different
conditions (e.g., a normal and stressed condition). As shown, in FIG. 9, the
individual, XJ0e
902, can have can have certain attribute values at the outset of an
experiment, also referred to
as the "scoring date." The experiment attempts to predict Joe's payment under
two different
conditions, a normal condition and a stressed (e.g., economic recession or
downturn)
condition. At the end of the experiment, the individual's (Joe's) potential
payment
performance under normal conditions is represented as Y1 904 and Joe's
potential payment
performance under stressed conditions is represented as Y2 906. Joe's
sensitivity to the
stressed condition (e.g., disruption or stress factor) can be defined based on
the difference
between Y1 904 and Y2 906
22
CA 03081569 2020-05-01
WO 2019/089990
PCT/US2018/058792
[0074]
Expanding from the example of FIG. 9, in some aspects, if certain statistical
and econometric conditions hold on a sample of development data consisting of
entities'
attributes at a scoring date and of the experimental conditions subject to
which entities'
performances were observed, then it is possible to estimate individual-
specific causal effects
on ordinal scales. In some implementations, estimating sensitivities to
financial stress factors
or other disruptions as individual-specific causal effects, can leverage
natural experiments in
a transparent and fail-safe manner.
[0075] For
example, a method of estimating individual economic sensitivities can
include a first step of determining if there are a sufficient number of
entities that share the
same or similar attribute values at scoring date yet subsequently travel
through different arms
of the experiment. For example, if a large number of entities share one or
more attribute
values or similar attribute values (e.g., income, payment history, outstanding
balances,
number of inquiries, etc.), and those entities also experience different
disruptions or stress
factors (e.g., half undergo normal conditions and half undergo stressed
condition). In some
aspects, determining which entities share the same or similar attribute values
can be based on
a propensity score. In some implementations the propensity score can be
calculated using any
propensity score matching technique. For example, a propensity score can be
calculated using
a technique described in the publication "The Central Role of the Propensity
Score in
Observational Studies for Causal Effects" Biometrika 70 (1): 41-55, (1983) by
Paul
Rosenbaum and Donald Rubin.
[0076] If the
answer is 'no' then sensitivity estimation cannot be accomplished with
confidence (fail-safe). If the answer is 'yes', then a sensitivity estimating
system may, in a
second step, create a matched sample of entities where a first sub-population
of entities
travels along the normal condition arm and a second sub-population of other
entities travels
23
CA 03081569 2020-05-01
WO 2019/089990
PCT/US2018/058792
along the stressed condition arm, such that the two sub-populations are
similar in their
attribute distributions at the scoring date.
[0077] Next,
in a third step, the sensitivity estimating system can define predictors
comprised of the matched entities' attributes at the scoring date and a binary
(0/1 for
"normarrstressed") indicator variable. The sensitivity estimating system can
use supervised
machine learning techniques to regress the entities' observed performances
based on these
predictors. In a fourth step, for each matched entity, the sensitivity
estimating system can
predict expected entities' performances under normal and under stressed
conditions, by
varying the value of the binary indicator variable (e.g., predictors defined
in the third step)
from 0 to 1, while keeping the entity's attributes fixed. Compute sensitivity
value (e.g., Low,
Medium, High) of each matched entity by differencing normal and stressed
predictions.
[0078] In a
fifth step, the sensitivity estimating system can use supervised machine
learning techniques to regress the entities' sensitivity values based on the
entities' observable
attributes at the scoring date. For example, the regression may indicate that
entities in at a
certain income group have a higher sensitivity than entities in a different
income group. In a
sixth step, the sensitivity estimating system can use the regression model
from the fifth step
to predict the sensitivities of any entities of interest. The entities of
interest referred to the
sixth step can be new entities, such as new customers, or they can be existing
entities whose
attribute values may change over time, thus allowing sensitivities of
entities, which need not
to remain constant over time, to be regularly updated based on the latest data
available on the
entities. For example, a new customer can have certain attribute values that
match with, or are
similar to, other entities used in the sensitivity estimating system that had
a Low economic
sensitivity index (ESI). Accordingly, the new customer may also be assigned a
Low ESI.
[0079] In some
implementations, a proof-of-concept model for economic sensitivity
described herein can be based on US credit bureau data collected during two
starkly
24
CA 03081569 2020-05-01
WO 2019/089990
PCT/US2018/058792
contrasting phases of the recent US economic cycle. Payment performance for a
stable
economy ("normal condition") can be collected during the 2-year window
starting with
scoring date October 2013 and ending October 2015. Payment performance for a
recessionary economy ("stressed condition") can be collected during the 2-year
window
starting with scoring date October 2007 and ending October 2009 which falls
into the time of
the Great Recession. The binary ("normal"/"stressed") indicator was
accordingly defined as:
'0' for a first group of consumers whose attributes were collected in Oct.
2013 and who
subsequently performed under normal conditions; and 1' for a second group of
consumers
whose attributes were collected in Oct. 2007 and who subsequently performed
under stressed
conditions.
[0080] In some
aspects, a proof-of-concept model for credit card balance change
sensitivity described herein can be based on US credit bureau data collected
and combined
from multiple scoring dates across a recent economic cycle, including both
stable and
recessionary performance periods. In this way, the balance change sensitivity
model is not
tied to a specific economic condition but captures averaged behaviors from
across various
economic conditions. Payment performance for "non-increasers" ("normal
condition") was
collected for consumers who didn't increase their card balances by more than
$100, or
decreased their card balances, over a "balance change window" of 6 months
following a
scoring date. Payment performance for "increasers" ("stressed condition") was
collected for
consumers who increased their card balances by more than $2,000 over the
balance change
window. In all cases, payment performance was collected over a 2-year window
following
the balance change window.
[0081] FIG. 10
is a time diagram 1000 that illustrates this longitudinal study design.
The binary ("normal"/"stressed") indicator was accordingly defined as '0' for
a first group of
consumers who didn't increase their card balances by more than $100, or
decreased their card
CA 03081569 2020-05-01
WO 2019/089990
PCT/US2018/058792
balances, over the balance change window, with their performances observed
under these
"normal" conditions; and '1' for a second group of consumers who increased
their card
balances by more than $2,000 over the balance change window, with their
performances
observed under these "stressed" conditions. As shown in FIG. 10, month 0 is
the scoring date
which begins the experiment. The two groups are represented as two lines, the
first group is
the top line 1010 and the second group is represented by the bottom line 1020.
At month 6,
the study can measure the credit balance change for all participants and
define the two groups
(e.g., define the two lines 1010 and 1020). During months 6-30 ("performance
period"), the
study can measure the performance of the two groups over time. At month 30,
the study can
perform an analysis of the two groups over the performance period and generate
payment
performance statistics based on the analysis
[0082] During
both model developments (e.g., economic sensitivity and balance
change sensitivity) the study found sufficient numbers of entities that shared
similar attribute
values at the scoring date (month 0) and subsequently traveled through
different arms of their
experiments, (i.e. performed under "normal" and under "stressed" conditions).
The study then
used supervised machine learning techniques to regress the entities and
calculated the
economic sensitivities and the balance change sensitivities based on the
entities' observable
attributes at the scoring date for a large and representative sample of US
consumers who
regularly access consumer credit.
[0083] From
the regression analysis performed at the end of the performance period it
is possible to gain deep and valuable insights from understanding the
calculated sensitivities.
After determining the entities' economic sensitivities and balance change
sensitivities, it can
be beneficial to generate and profile a few exemplary sensitivity segments. In
some aspects, it
is possible to create sensitivity segments for an illustrative sub-population
of consumers
within a risk score (e.g., FICO score) band. For example, FIGs. 7A-7C and
FIGs. 8A-8D,
26
CA 03081569 2020-05-01
WO 2019/089990
PCT/US2018/058792
illustrate considerable heterogeneity of consumers and their behaviors found
even within a
narrow risk score band which would traditionally be regarded as a homogeneous
risk score
pool. It may be beneficial for lenders to exploit this heterogeneity to create
sensitivity sub-
segments within homogeneous risk score pools that differ with respect to their
sensitivities to
disruptions. By segmenting consumers with similar risk scores based on their
sensitivities,
lenders and models can beneficially capture wider aspects of risk that are not
captured by
typical risk scores.
[0084] In a
non-limiting example, it is possible to analyze entities that fall within a
given risk score band (e.g., the FICO Score band from 678 to 682). A model
can further
sub-segment the entities into economic sensitivity quintiles based on the
distribution of
economic sensitivities within this FICO Score band In the illustrative
example, the risk
score band (FICO Score band from 678 to 682) is relatively narrow, such that
from the
traditional risk scoring perspective, this sub-population of entities would be
regarded as a
homogeneous risk pool. However, as illustrated below, the lowest and the
highest economic
sensitivity quintile segments can differ substantially in their attribute
distributions.
[0085] FIG.
11A is a diagram illustrating a difference between an average number of
inquiries for the 20% most economic sensitive and the 20% least economic
sensitive
consumers within the risk score band of 678 to 682. FIG. 11B is a diagram
illustrating a
difference between an average total trade line balance for the 20% most
economic sensitive
and the 20% least economic sensitive consumers within the risk score band of
678 to 682.
FIG. 11C is a diagram illustrating a difference between an average number of
months since
the most recent trade line for the 20% most economic sensitive and the 20%
least economic
sensitive consumers within the risk score band of 678 to 682. FIG. 11D is a
diagram
illustrating a difference between an average number of times 90 days past due
for the 20%
27
CA 03081569 2020-05-01
WO 2019/089990
PCT/US2018/058792
most economic sensitive and the 20% least economic sensitive consumers within
a risk score
band, in accordance with aspects described herein.
[0086] As
shown in FIGs. 11A-D, having more credit inquiries, having higher trade
line balances, having more recently a new trade line opened, and having lower
average
number of times 90 days past due, are all associated with having higher
economic sensitivity.
[0087]
Empirically, data analysis can find that the default rate more than doubles
during the stressed economic period versus the normal economic period for the
20% most
sensitives in a given score band, whereas the default rate may hardly vary
across economic
conditions for the 20% least sensitives in this score band. Such information
can be useful to
companies deciding between consumers with similar risk scores but different
economic
sensitivity scores.
[0088]
Similarly, the sub-population within the FICO Score band from 678 to 682
may be further sub-segmented, or alternatively sub-segmented, into balance
change
sensitivity quintiles based on the distribution of economic sensitivities
within this FICO
Score band. In the illustrative example, the risk score band (FICO Score band
from 678 to
682) is relatively narrow, such that from the traditional risk scoring
perspective, this sub-
population of entities would be regarded as a homogeneous risk pool. However,
as illustrated
below, the lowest and the highest balance change sensitivity quintile segments
differ
substantially in their attribute distributions.
[0089] FIG.
12A is a diagram illustrating a difference between an average number of
months since the oldest trade line opened for the 20% most balance change
sensitive and the
20% least balance change sensitive consumers within the risk score band of 678
to 682. FIG.
12B is a diagram illustrating a difference between an average total revolving
trade line
balance for the 20% most balance change sensitive and the 20% least balance
change
sensitive consumers within the risk score band of 678 to 682. FIG. 12C is a
diagram
28
CA 03081569 2020-05-01
WO 2019/089990
PCT/US2018/058792
illustrating a difference between an average number of months since the most
recent trade
line for the 20% most balance change sensitive and the 20% least balance
change sensitive
consumers within the risk score band of 678 to 682. FIG. 12D is a diagram
illustrating a
difference between an average amount paid down on installment loans for the
20% most
balance change sensitive and the 20% least balance change sensitive consumers
within the
risk score band of 678 to 682. FIG. 12E is a diagram illustrating a difference
between an
average number of times 90 days past due for the 20% most balance change
sensitive and the
20% least balance change sensitive consumers within the risk score band of 678
to 682.
[0090] As
shown in FIGs. 12A-E, having less maturation time of oldest credit line,
having higher revolving balances, having more recently a new trade line
opened, having
made lower down payments on installment loans, and having lower average number
of times
90 days past due, are all associated with having higher balance change
sensitivity.
[0091]
Empirically, data analysis can find that the default rate varies considerably
more across balance stress conditions for the 20% most balance change
sensitive consumers
than for the 20% least balance change sensitive consumers in a given score
band. Such
information can be useful to companies deciding between consumers with similar
risk scores
but different balance change sensitivity scores.
[0092] While
economic and balance change sensitivities are described herein, it is
possible to calculate other consumer sensitivities. For example, sensitivity
scores can reflect
the interplay between predictions of any kinds of behaviors of entities (not
necessarily their
future payment performance, and predictions not necessarily based on credit
bureau data),
disruptions of any kind (as long as data on the disruptions are collected),
and entities' actual
future behaviors. In some aspects, consumers could be segmented into groups
that differ in
terms of impact of health insurance loss on future investment decisions, or
groups that differ
in terms of impact of adopting a cholesterol-lowering medication on future
levels thereof, or
29
CA 03081569 2020-05-01
WO 2019/089990
PCT/US2018/058792
groups that differ in terms of impact of enrollment in a driver education
program on future
driving skills, etc.
[0093] FIG. 13
is a diagram 1300 illustrating schematically the interplay of
predictions, disruptions, and future entity behavior. As illustrated in FIG.
13, a predictive
model may base its prediction 1310 of an entity's future behavior on a variety
of data sources
and data attributes 1304 associated with the entity at a certain time. The
model may also
consider sensitivities to a variety of disruptions 1302 to determine an effect
of a given
disruption to the entity that would otherwise be unaccounted for by the
predictive model.
[0094] FIG. 14
depicts a block diagram illustrating a computing system 1400, in
accordance with some example embodiments.
[0095] As
shown in FIG. 14, the computing system 1400 can include a processor
1410, a memory 1420, a storage device 1430, and input/output devices 1440. The
processor
1410, the memory 1420, the storage device 1430, and the input/output devices
1440 can be
interconnected via a system bus 1450. The processor 1410 is capable of
processing
instructions for execution within the computing system 1400. Such executed
instructions can
implement one or more components of, for example, the decision management
platform 110.
In some implementations of the current subject matter, the processor 1410 can
be a single-
threaded processor. Alternately, the processor 1410 can be a multi-threaded
processor. The
processor 1410 is capable of processing instructions stored in the memory 1420
and/or on the
storage device 1430 to display graphical information for a user interface
provided via the
input/output device 1440.
[0096] The
memory 1420 is a computer readable medium such as volatile or non-
volatile random-access memory (RAM) that stores information within the
computing system
1400. The memory 1420 can store data structures representing configuration
object
databases, for example. The storage device 1430 is capable of providing
persistent storage
CA 03081569 2020-05-01
WO 2019/089990
PCT/US2018/058792
for the computing system 1400. The storage device 1430 can be a floppy disk
device, a hard
disk device, an optical disk device, or a tape device, or other suitable
persistent storage
means. The input/output device 1440 provides input/output operations for the
computing
system 1400. In some implementations of the current subject matter, the
input/output device
1440 includes a keyboard and/or pointing device. In various implementations,
the
input/output device 1440 includes a display unit for displaying graphical user
interfaces.
[0097]
According to some implementations of the current subject matter, the
input/output device 1440 can provide input/output operations for a network
device. For
example, the input/output device 1440 can include Ethernet ports or other
networking ports to
communicate with one or more wired and/or wireless networks (e.g., a local
area network
(LAN), a wide area network (WAN), the Internet).
[0098] In some
implementations of the current subject matter, the computing system
1400 can be used to execute various interactive computer software applications
that can be
used for organization, analysis and/or storage of data in various (e.g.,
tabular) format (e.g.,
Microsoft Excel , and/or any other type of software). Alternatively, the
computing system
1400 can be used to execute any type of software applications. These
applications can be
used to perform various functionalities, e.g., planning functionalities (e.g.,
generating,
managing, editing of spreadsheet documents, word processing documents, and/or
any other
objects, etc.), computing functionalities, communications functionalities,
etc. The
applications can include various add-in functionalities or can be standalone
computing
products and/or functionalities. Upon activation within the applications, the
functionalities
can be used to generate the user interface provided via the input/output
device 1440. The
user interface can be generated and presented to a user by the computing
system 1400 (e.g.,
on a computer screen monitor, etc.).
31
CA 03081569 2020-05-01
WO 2019/089990
PCT/US2018/058792
[0099] FIG. 15
is a flowchart of a method 1500 for segmenting a population based on
sensitivities and a calculating risk score based on the segmented
sensitivities. In various
implementations, the method 1500 (or at least a portion thereof) may be
performed by the
computing system 1400, other related apparatuses, and/or some portion thereof.
In some
aspects, the computing system 1400 may be regarded as a server and/or a
computer.
[00100] Method 1500 can start at operational block 1510 where the computing
system
1400, for example, can receive one or more attributes associated with a first
entity. Method
1500 can proceed to operational block 1520 where the computing system 1400,
for example,
can calculate a sensitivity index for the first entity based on the one or
more attributes. In
some implementations, calculating a sensitivity index can additionally or
alternatively
involve the computing system 1400, for example, creating a matched sample of
entities, the
entities sharing at least one attribute value of the one or more attributes,
the matched sample
of entities comprising a first sub-population of the entities experiencing a
first condition and a
second sub-population of the entities experiencing a second condition, the
first sub-
population different from the second sub-population. In some implementations,
calculating a
sensitivity index can additionally or alternatively involve the computing
system 1400, for
example, calculating, for each entity of the matched sample of entities, a
sensitivity value
associated with the entity, the calculating comprising subtracting an expected
performance
under the first condition with an expected performance under the second
condition. In some
implementations, calculating a sensitivity index can additionally or
alternatively involve the
computing system 1400, for example, segmenting, by the computer processor, any
sample of
entities into two or more segments based on the sensitivity value of each
entity, the sensitivity
index comprising one of the two or more segments.
[00101] Method 1500 can proceed to operational block 1530 where the computing
system 1400, for example, can calculate a second risk score for the first
entity based on the
32
CA 03081569 2020-05-01
WO 2019/089990
PCT/US2018/058792
sensitivity index and the first risk score of the entity. Method 1500 can
proceed to operational
block 1530 where the computing system 1400, for example, can output the second
risk score
to a user interface. While the operational blocks of method 1500 are
illustrated and described
in a particular order, each of the operation blocks can be performed in any
order.
[00102] Performance of the method 1500 and/or a portion thereof can allow for
improved accuracy of risk scores and additional flexibility to current risk
scoring models not
previously available. The benefit occurs in at least segmenting heterogeneous
entities into
"sensitivity segments" based on a sensitivity to a disruption/condition to
more accurately
predict future payment performance. The entities in any given sensitivity
segment can be
similarly impacted by a certain type, or definition of, a disruption/condition
and that impact
can be beneficially added to risk scoring models to output enhanced risk
scores.
[00103] In some aspects, the risk scores described herein may refer to a
credit score or
other score to indicate a consumer's creditworthiness.
[00104] One or more aspects or features of the subject matter described herein
can be
realized in digital electronic circuitry, integrated circuitry, specially
designed application
specific integrated circuits (ASICs), field programmable gate arrays (FPGAs)
computer
hardware, firmware, software, and/or combinations thereof. These various
aspects or features
can include implementation in one or more computer programs that are
executable and/or
interpretable on a programmable system including at least one programmable
processor,
which can be special or general purpose, coupled to receive data and
instructions from, and to
transmit data and instructions to, a storage system, at least one input
device, and at least one
output device. The programmable system or computing system may include clients
and
servers. A client and server are generally remote from each other and
typically interact
through a communication network. The relationship of client and server arises
by virtue of
33
CA 03081569 2020-05-01
WO 2019/089990
PCT/US2018/058792
computer programs running on the respective computers and having a client-
server
relationship to each other.
[00105] These computer programs, which can also be referred to as programs,
software, software applications, applications, components, or code, include
machine
instructions for a programmable processor, and can be implemented in a high-
level
procedural and/or object-oriented programming language, and/or in
assembly/machine
language. As used herein, the term "machine-readable medium" refers to any
computer
program product, apparatus and/or device, such as for example magnetic discs,
optical disks,
memory, and Programmable Logic Devices (PLDs), used to provide machine
instructions
and/or data to a programmable processor, including a machine-readable medium
that receives
machine instructions as a machine-readable signal. The term "machine-readable
signal"
refers to any signal used to provide machine instructions and/or data to a
programmable
processor. The machine-readable medium can store such machine instructions non-
transitorily, such as for example as would a non-transient solid-state memory
or a magnetic
hard drive or any equivalent storage medium. The machine-readable medium can
alternatively or additionally store such machine instructions in a transient
manner, such as for
example as would a processor cache or other random access memory associated
with one or
more physical processor cores.
[00106] To provide for interaction with a user, one or more aspects or
features of the
subject matter described herein can be implemented on a computer having a
display device,
such as for example a cathode ray tube (CRT), a liquid crystal display (LCD)
or a light
emitting diode (LED) monitor for displaying information to the user and a
keyboard and a
pointing device, such as for example a mouse or a trackball, by which the user
may provide
input to the computer. Other kinds of devices can be used to provide for
interaction with a
user as well. For example, feedback provided to the user can be any form of
sensory
34
CA 03081569 2020-05-01
WO 2019/089990
PCT/US2018/058792
feedback, such as for example visual feedback, auditory feedback, or tactile
feedback; and
input from the user may be received in any form, including, but not limited
to, acoustic,
speech, or tactile input. Other possible input devices include, but are not
limited to, touch
screens or other touch-sensitive devices such as single or multi-point
resistive or capacitive
trackpads, voice recognition hardware and software, optical scanners, optical
pointers, digital
image capture devices and associated interpretation software, and the like.
[00107] The subject matter described herein can be embodied in systems,
apparatus,
methods, and/or articles depending on the desired configuration. The
implementations set
forth in the foregoing description do not represent all implementations
consistent with the
subject matter described herein. Instead, they are merely some examples
consistent with
aspects related to the described subject matter. Although a few variations
have been
described in detail above, other modifications or additions are possible. In
particular, further
features and/or variations can be provided in addition to those set forth
herein. For example,
the implementations described above can be directed to various combinations
and
subcombinations of the disclosed features and/or combinations and
subcombinations of
several further features disclosed above. In addition, the logic flows
depicted in the
accompanying figures and/or described herein do not necessarily require the
particular order
shown, or sequential order, to achieve desirable results. Other
implementations may be
within the scope of the following claims.