Note : Les descriptions sont présentées dans la langue officielle dans laquelle elles ont été soumises.
1 SYSTEM AND METHOD FOR AUTOMATED VIDEO SEGMENTATION OF AN INPUT VIDEO
2 SIGNAL CAPTURING A TEAM SPORTING EVENT
3 TECHNICAL FIELD
4 [0001] The following relates generally to video processing technology;
and more particularly, to
systems and methods for automated video segmentation of an input video signal
capturing a team
6 sporting event.
7 BACKGROUND
8 [0002] Most team sports games, such as hockey, involve periods of active
play interleaved with
9 breaks in play. When watching a game remotely, many fans would prefer an
abbreviated game
showing only periods of active play. Automation of sports videography has the
potential to provide
11 professional-level viewing experiences at a cost that is affordable for
amateur sport. Autonomous
12 camera planning systems have been proposed, however, these systems
deliver continuous video
13 over the entire game. Typical amateur ice hockey games feature between
40 and 60 minutes of
14 actual game play. However, these games are played over the course of 60
to 110 minutes, with
downtime due to the warm-up before the start of a period and the breaks
between plays when the
16 referee collects the puck and the players set up for the ensuing face-
off. Also, there is a 15-minute
17 break between periods for ice re-surfacing. Abbreviation of the video
would allow removal of these
18 breaks.
19 SUMMARY
[0003] In an aspect, there is provided a computer-implemented method for
automated video
21 segmentation of an input video signal, the input video signal capturing
a playing surface of a team
22 sporting event, the method comprising: receiving the input video signal;
determining player
23 position masks from the input video signal; determining optic flow maps
from the input video
24 signal; determining visual cues using the optic flow maps and the player
position masks;
classifying temporal portions of the input video signal for game state using a
trained hidden
26 Markov model, the game state comprising either game in play or game not
in play, the hidden
27 Markov model receiving the visual cues as input features, the hidden
Markov model trained using
28 training data comprising a plurality of visual cues for previously
recorded video signals each with
29 labelled play states; and outputting the classified temporal portions.
1
Date Recue/Date Received 2022-06-23
1 [0004] In a particular case of the method, the method further comprising
excising temporal
2 periods classified as game not in play from the input video signal, and
wherein outputting the
3 classified temporal portions comprises outputting the excised video
signal.
4 [0005] In another case of the method, the optic flow maps comprise
horizontal and vertical optic
flow maps.
6 [0006] In yet another case of the method, the hidden Markov model outputs
a state transition
7 probability matrix and a maximum likelihood estimate to determine a
sequence of states for each
8 of the temporal portions.
9 [0007] In yet another case of the method, the maximum likelihood estimate
is determined by
determining a state sequence that maximizes posterior marginals.
11 [0008] In yet another case of the method, the hidden Markov model
comprises Gaussian Mixture
12 Models.
13 [0009] In yet another case of the method, the hidden Markov model
comprises Kernel Density
14 Estimation.
[0010] In yet another case of the method, the hidden Markov model uses a Baum-
Welch
16 algorithm for unsupervised learning of parameters.
17 [0011] In yet another case of the method, the visual cues comprises
maximum flow vector
18 magnitudes within detected player bounding boxes, the detected player
bounding boxes
19 determined from the player position masks.
[0012] In yet another case of the method, the visual cues are outputted by an
artificial neural
21 network, the artificial neural network receiving a multi-channel spatial
map as input, the multi-
22 channel spatial map comprising the horizontal and vertical optic flow
maps, the player position
23 masks, and the input video signal, the outputted visual clues comprise
conditional probabilities of
24 the logit layers of the artificial neural network, the artificial neural
network trained using previously
recorded video signals each with labelled play states.
26 [0013] In another aspect, there is provided a system for automated video
segmentation of an
27 input video signal, the input video signal capturing a playing surface
of a team sporting event, the
28 system comprising one or more processors in communication with data
storage, using instructions
2
Date Recue/Date Received 2022-06-23
1 stored on the data storage, the one or more processors are configured to
execute: an input
2 module to receive the input video signal; a preprocessing module to
determine player position
3 masks from the input video signal, to determine optic flow maps from the
input video signal, and
4 to determine visual cues using the optic flow maps and the player
position masks; a machine
learning module to classify temporal portions of the input video signal for
game state using a
6 trained hidden Markov model, the game state comprising either game in
play or game not in play,
7 the hidden Markov model receiving the visual cues as input features, the
hidden Markov model
8 trained using training data comprising a plurality of visual cues for
previously recorded video
9 signals each with labelled play states; and an output module to output
the classified temporal
portions.
11 [0014] In a particular case of the system, the output module further
excises temporal periods
12 classified as game not in play from the input video signal, and wherein
outputting the classified
13 temporal portions comprises outputting the excised video signal.
14 [0015] In another case of the system, the optic flow maps comprise
horizontal and vertical optic
flow maps.
16 [0016] In yet another case of the system, the hidden Markov model
outputs a state transition
17 probability matrix and a maximum likelihood estimate to determine a
sequence of states for each
18 of the temporal portions.
19 [0017] In yet another case of the system, the maximum likelihood
estimate is determined by
determining a state sequence that maximizes posterior marginals.
21 [0018] In yet another case of the system, the hidden Markov model
comprises Gaussian Mixture
22 Models.
23 [0019] In yet another case of the system, the hidden Markov model
comprises Kernel Density
24 Estimation.
[0020] In yet another case of the system, the hidden Markov model uses a Baum-
Welch algorithm
26 for unsupervised learning of parameters.
27 [0021] In yet another case of the system, the visual cues comprises
maximum flow vector
28 magnitudes within detected player bounding boxes, the detected player
bounding boxes
29 determined from the player position masks.
3
Date Recue/Date Received 2022-06-23
1 [0022] In yet another case of the system, the visual cues are outputted
by an artificial neural
2 network, the artificial neural network receiving a multi-channel spatial
map as input, the multi-
3 channel spatial map comprising the horizontal and vertical optic flow
maps, the player position
4 masks, and the input video signal, the outputted visual clues comprise
conditional probabilities of
the logit layers of the artificial neural network, the artificial neural
network trained using previously
6 recorded video signals each with labelled play states.
7 [0023] These and other aspects are contemplated and described herein. It
will be appreciated
8 that the foregoing summary sets out representative aspects of the system
and method to assist
9 skilled readers in understanding the following detailed description.
BRIEF DESCRIPTION OF THE DRAWINGS
11 [0024] A greater understanding of the embodiments will be had with
reference to the figures, in
12 which:
13 [0025] FIG. 1 illustrates a block diagram of a system for automated
video segmentation of an
14 input video signal capturing a team sporting event, according to an
embodiment;
[0026] FIG. 2 illustrates a flow diagram of a method for automated video
segmentation of an input
16 video signal capturing a team sporting event, according to an
embodiment;
17 [0027] FIG. 3A illustrates an example frame of a playing surface from a
first camera;
18 [0028] FIG. 3B illustrates an example frame of a playing surface from a
second camera;
19 [0029] FIG. 3C illustrates an example frame of a playing surface from a
third camera;
[0030] FIG. 4 illustrates images of a playing surface from two different
cameras to be stitched
21 together;
22 [0031] FIG. 5A illustrates a template image of the playing surface of
FIG. 4;
23 [0032] FIG. 5B illustrates a stitched image of the playing surface of
FIG. 4;
24 [0033] FIG. 6 illustrates an example optic flow field within bounding
boxes of detected players;
[0034] FIG. 7 illustrates a chart of error rate as a function of an LP
exponent used to aggregate
26 the optic flow field of FIG. 6;
4
Date Recue/Date Received 2022-06-23
1 [0035] FIG. 8A illustrates an RGB image as an input feature map;
2 [0036] FIG. 8B illustrates a horizontal and vertical optical flow map as
an input feature map;
3 [0037] FIG. 8C illustrates a binary player mask as an input feature map;
4 [0038] FIG. 9 is a diagram of a convolutional neural network (CNN) in
accordance with the system
of FIG. 1;
6 [0039] FIG. 10A illustrates spectral analysis of whistle and non-whistle
intervals for a first game;
7 [0040] FIG. 10B illustrates spectral analysis of whistle and non-whistle
intervals for a second
8 game;
9 [0041] FIG. 10C illustrates spectral analysis of whistle and non-whistle
intervals for a third game;
[0042] FIG. 11 illustrates visual and auditory cues for an example video
segment;
11 [0043] FIG. 12A is a diagram of a state transition graph for 2-states;
12 [0044] FIG. 12B is a diagram of a state transition graph for 4-states;
13 [0045] FIG. 13A illustrates charts for conditional probability densities
for a maximum optic flow
14 and deep network probability of play visual cues from a first camera;
[0046] FIG. 13B illustrates charts for conditional probability densities for a
maximum optic flow
16 and deep network probability of play visual cues from a second camera;
17 [0047] FIG. 13C illustrates charts for conditional probability densities
for a maximum optic flow
18 and deep network probability of play visual cues from a third camera;
19 [0048] FIG. 14A illustrates a chart of conditional densities for a
Wiener filter whistle detector on
a first game;
21 [0049] FIG. 14B illustrates a chart of conditional densities for a
Wiener filter whistle detector on
22 a second game;
23 [0050] FIG. 14C illustrates a chart of conditional densities for a
Wiener filter whistle detector on
24 a third game; and
5
Date Recue/Date Received 2022-06-23
1 [0051] FIG. 15A illustrates charts of hidden Markov model performance for
a first camera;
2 [0052] FIG. 15B illustrates charts of hidden Markov model performance for
a second camera;
3 [0053] FIG. 15C illustrates charts of hidden Markov model performance for
a third camera;
4 [0054] FIG. 16A illustrates charts of performance of deep visual cues for
a first camera;
[0055] FIG. 16B illustrates charts of performance of deep visual cues for a
second camera;
6 [0056] FIG. 16C illustrates charts of performance of deep visual cues for
a third camera;
7 [0057] FIG. 17 illustrates conditional probability densities for maximum
optic flow visual cue on
8 all games across all three cameras;
9 [0058] FIG. 18 illustrates conditional probability densities for the deep
visual cue on all games
across all three cameras;
11 [0059] FIG. 19 shows conditional densities for the auditory cue of
Wiener filter 3 detector on
12 games from the third camera;
13 [0060] FIG. 20 shows an example of how the visual cue of maximum optic
flow and auditory cue
14 of Wiener filter 3 detector varies over time within each game state, for
a 160-second sample video
from Game 1 recorded using the third camera;
16 [0061] FIG. 21 shows an example of within-camera performance of a 2-
state hidden Markov
17 model (HMM) with visual cue only;
18 [0062] FIG. 22 shows an example of between-cameras performance compared
to within-camera
19 performance on all three cameras;
[0063] FIG. 23 illustrates an example of performance of the 2-state HMM and 4-
state HMM on
21 the third camera;
22 [0064] FIG. 24 illustrates an example of unconditional densities of the
deep visual cue learned
23 from the training data shown on the test data histogram for each game
recorded using the third
24 camera;
6
Date Recue/Date Received 2022-06-23
1 [0065] FIG. 25 illustrates an example of unconditional densities of the
auditory cue learned from
2 the training data shown on the test data histogram for each game recorded
using the third camera;
3 and
4 [0066] FIG. 26 illustrates an example of performance of the 2-state HMM
before and after domain
adaptation on all games from the first and second cameras.
6 DETAILED DESCRIPTION
7 [0067] Embodiments will now be described with reference to the figures.
For simplicity and clarity
8 of illustration, where considered appropriate, reference numerals may be
repeated among the
9 Figures to indicate corresponding or analogous elements. In addition,
numerous specific details
are set forth in order to provide a thorough understanding of the embodiments
described herein.
11 However, it will be understood by those of ordinary skill in the art
that the embodiments described
12 herein may be practiced without these specific details. In other
instances, well-known methods,
13 procedures, and components have not been described in detail so as not
to obscure the
14 embodiments described herein. Also, the description is not to be
considered as limiting the scope
of the embodiments described herein.
16 [0068] Various terms used throughout the present description may be read
and understood as
17 follows, unless the context indicates otherwise: "or" as used throughout
is inclusive, as though
18 written "and/or"; singular articles and pronouns as used throughout
include their plural forms, and
19 vice versa; similarly, gendered pronouns include their counterpart
pronouns so that pronouns
should not be understood as limiting anything described herein to use,
implementation,
21 performance, etc. by a single gender; "exemplary" should be understood
as "illustrative" or
22 "exemplifying" and not necessarily as "preferred" over other
embodiments. Further definitions for
23 terms may be set out herein; these may apply to prior and subsequent
instances of those terms,
24 as will be understood from a reading of the present description.
[0069] Any module, unit, component, server, computer, terminal, engine, or
device exemplified
26 herein that executes instructions may include or otherwise have access
to computer-readable
27 media such as storage media, computer storage media, or data storage
devices (removable
28 and/or non-removable) such as, for example, magnetic disks, optical
disks, or tape. Computer
29 storage media may include volatile and non-volatile, removable and non-
removable media
implemented in any method or technology for storage of information, such as
computer-readable
31 instructions, data structures, program modules, or other data. Examples
of computer storage
7
Date Recue/Date Received 2022-06-23
1 media include RAM, ROM, EEPROM, flash memory or other memory technology,
CD-ROM,
2 digital versatile disks (DVD) or other optical storage, magnetic
cassettes, magnetic tape, magnetic
3 disk storage or other magnetic storage devices, or any other medium which
can be used to store
4 the desired information, and which can be accessed by an application,
module, or both. Any such
computer storage media may be part of the device or accessible or connectable
thereto. Further,
6 unless the context clearly indicates otherwise, any processor or
controller set out herein may be
7 implemented as a singular processor or as a plurality of processors. The
plurality of processors
8 may be arrayed or distributed, and any processing function referred to
herein may be carried out
9 by one or by a plurality of processors, even though a single processor
may be exemplified. Any
method, application, or module herein described may be implemented using
computer
11 readable/executable instructions that may be stored or otherwise held by
such computer-readable
12 media and executed by the one or more processors.
13 [0070] Embodiments of the present disclosure can advantageously provide
a system that uses
14 visual cues from a single wide-field camera, and in some cases auditory
cues, to automatically
segment a video of a sports game. For the purposes of this disclosure, the
game considered will
16 be hockey; however, the principles and techniques described herein can
be applied to any
17 suitable team sport with audible breakages in active play.
18 [0071] Some approaches have applied computer vision to sports using
semantic analysis. For
19 example, using ball detections and player tracking data, meaningful
insights about individual
players and teams can be potentially extracted. These insights can be used to
understand the
21 actions of a single player or a group of players and detect events in
the game. Another form of
22 semantic analysis is video summarization. Some approaches have analyzed
broadcast video
23 clips to stitch together a short video of highlights. However, this
summarized video is short for
24 consumption and cannot be used for tagging of in-game events, analysis
of team tactics, and the
like, because the summary video does not retain all the active periods of
play. Sports such as
26 soccer, ice hockey and basketball have many stoppages during the game.
Thus, the present
27 embodiments advantageously divide the captured game into segments of
active play and no-play,
28 known as play-break segmentation.
29 [0072] Some approaches to determine play-break segmentation can use play-
break
segmentation for automatic highlight generation or event detection, or can use
event detection to
31 guide play-break segmentation. Most of such approaches use rule-based
approaches that
32 combine text graphics on a broadcast feed with audio cues from the crowd
and commentator or
8
Date Recue/Date Received 2022-06-23
1 the type of broadcast camera shot. These approaches generally use
broadcast cues (camera
2 shot type) or production cues (graphics and commentary) for play-break
segmentation, and thus
3 are not directly relevant to unedited amateur sport video recorded
automatically with fixed
4 cameras.
[0073] While unedited videos can be used in some approaches to detect in-game
events (such
6 as face-off, line change, and play in ice hockey) and then use the rules
of the sport to determine
7 segments of play and no-play. In such approaches, an support-vector-
machine (SVM) was trained
8 on Bag-of-Words features to detect in-game events in video snippets. At
inference, an event was
9 predicted for each video snippet and it was classified as play or no-play
segments using the rules
of the sport. However, this approach requires training and evaluating on
disjoint intervals of a
11 single game recorded by two different cameras.
12 [0074] The present embodiments provide significant advantages over the
other approaches by,
13 for example, classifying frames as play and no-play without requiring
the detection of finer-grain
14 events like line changes. Additionally, temporal dependencies between
states can be captured
and integrated with probabilistic cues within a hidden Markov model (HMM)
framework that allows
16 maximum a-posteriori (MAP) or minimum-loss solutions to be computed in
linear time. Further,
17 the present embodiments allow for handling auditory domain shift that is
critical for integration
18 with visual cues. Further, the present embodiments are generalizable
across games, rinks, and
19 viewing parameters.
[0075] In the present disclosure, two different visual cues are described. The
first visual clue is
21 based on the optic flow; players tend to move faster during play than
breaks. However, in some
22 cases, motion on the ice can sometimes be substantial during breaks and
sometimes quite limited
23 during periods of play. In this way, the present embodiments use a more
complex deep visual
24 classifier that takes not only the optic flow as input but also an RGB
image and detected player
positions as input.
26 [0076] In some cases of the present disclosure, utility of auditory
cues, such as the referee whistle
27 that starts and stops play, can be used. While not directly informative
of the current state, the
28 whistle does serve to identify the timing of state transitions, and thus
can potentially contribute to
29 performance of the automation.
[0077] In some cases, to take into account temporal dependencies, a hidden
Markov model
31 (HMM) can be used, which, while advantageously simplifying modeling
through conditional
9
Date Recue/Date Received 2022-06-23
1 independence approximations, allows (1) optimal probabilistic integration
of noisy cues and (2)
2 an account of temporal dependencies captured through a state transition
matrix. In some cases,
3 a technique for unsupervised domain adaptation of the HMM can be used;
iteratively updating
4 emission and/or transition probability distributions at inference, using
the predicted state
sequence. This is particularly useful for benefitting from auditory cues as
input.
6 [0078] Turning to FIG. 1, a system for automated video segmentation of an
input video signal
7 capturing a team sporting event 150 is shown, according to an embodiment.
In this embodiment,
8 the system 150 is run on a local computing device (for example, a
personal computer). In further
9 embodiments, the system 150 can be run on any other computing device; for
example, a server,
a dedicated piece of hardware, a laptop computer, or the like. In some
embodiments, the
11 components of the system 150 are stored by and executed on a single
computing device. In other
12 embodiments, the components of the system 150 are distributed among two
or more computer
13 systems that may be locally or remotely distributed; for example, using
cloud-computing
14 resources.
[0079] FIG. 1 shows various physical and logical components of an embodiment
of the system
16 150. As shown, the system 150 has a number of physical and logical
components, including a
17 central processing unit ("CPU") 152 (comprising one or more processors),
random access
18 memory ("RAM") 154, a user interface 156, a video interface 158, a
network interface 160, non-
19 volatile storage 162, and a local bus 164 enabling CPU 152 to
communicate with the other
components. CPU 152 executes an operating system, and various conceptual
modules, as
21 described below in greater detail. RAM 154 provides relatively
responsive volatile storage to CPU
22 152. The user interface 156 enables an administrator or user to provide
input via an input device,
23 for example a mouse or a touchscreen. The user interface 156 can also
output information to
24 output devices, such as a display or speakers. In some cases, the user
interface 156 can have
the input device and the output device be the same device (for example, via a
touchscreen). The
26 video interface 158 can communicate with one or more video recording
devices 190, for example
27 high-definition video cameras, to capture a video of a sporting event.
In further embodiments, the
28 video interface 158 can retrieve already recorded videos from the local
database 166 or a remote
29 database via the network interface 160.
[0080] The network interface 160 permits communication with other systems,
such as other
31 computing devices and servers remotely located from the system 150, such
as for a typical cloud-
32 computing model. Non-volatile storage 162 stores the operating system
and programs, including
Date Recue/Date Received 2022-06-23
1 computer-executable instructions for implementing the operating system
and modules, as well as
2 any data used by these services. Additional stored data can be stored in
a database 166. During
3 operation of the system 150, the operating system, the modules, and the
related data may be
4 retrieved from the non-volatile storage 162 and placed in RAM 154 to
facilitate execution.
[0081] In an embodiment, the system 150 further includes a number of modules
to be executed
6 on the one or more processors 152, including an input module 170, a
preprocessing module 172,
7 a machine learning module 174, and an output module 176.
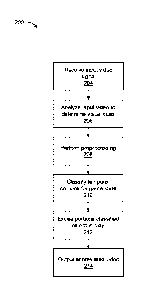
8 [0082] FIG. 2 illustrates a method 200 for automated video segmentation
of an input video signal
9 capturing a team sporting event, in accordance with an embodiment. At
block 204, the input
module 170 receives an input video signal capturing a team sporting event; for
example, a hockey
11 game. The input video signal capturing a playing surface, or at least a
substantial portion of the
12 playing surface, of the team sporting event.
13 [0083] At block 206, the input video signal is analyzed by the
preprocessing module 172 for visual
14 cues. In an example, the visual cues can be determined from, for
example, maximizing optical
flow maps or an artificial neural network using one or more contextual feature
maps as input. In
16 an embodiment, the contextual feature maps can include one or more of
(1) raw color imagery,
17 (2) optic flow map, and (3) binary player position masks. In some cases,
a full input representation
18 includes a 6-channel feature map of a combination of the previously
listed three types of feature
19 maps.
[0084] In an example, the raw color imagery can be encoded in three channels:
red, green, and
21 blue (RGB). These three channels are present in the original RGB
channels of the captured
22 image.
23 [0085] In an example, the binary player position masks can have each
player represented as a
24 rectangle of is on a background of Os. The binary player masks can be
generated using a Faster
RCNN object detector (Ren, S., He, K., Girshick, R., and Sun, J. Faster R-CNN:
Towards real-
26 time object detection with region proposal networks. In Advances in
Neural Information
27 Processing Systems (2015), pp. 91-99). However, any suitable person
detecting technique could
28 be used.
29 [0086] In an example, the optic flow can be coded in two channels
representing x and y
components (i.e., horizontal and vertical) of flow field vectors. These optic
flow vectors can be
11
Date Recue/Date Received 2022-06-23
1 computed using Farneback's dense optical flow algorithm (Two-frame motion
estimation based
2 on polynomial expansion. In Scandinavian Conference on Image analysis,
pages 363-370,2003).
3 In further cases, any optic flow technique could be used. In some cases,
the optic flow can be
4 limited to portions of the imagery identified to have players by the
binary player masks.
[0087]
6 [0088] It is appreciated that in further examples, other suitable coding
schemes can be used
7 based on the particular contextual feature maps.
8 [0089] At block 208, in some embodiments, the preprocessing module 172
performs
9 preprocessing on the coded contextual feature map data. In some cases,
the preprocessing
module 174 processes the feature maps by, for example, normalization to have
zero mean and
11 unit variance, resizing (for example, to 150 x 60 pixels), and then
stacking to form the 6-channel
12 input.
13 [0090] In some cases, the preprocessing module 172 can augment training
data by left-right
14 mirroring. Team labels can be automatically or manually assigned such
that a first channel of a
player mask represents a left team' and a second channel of the player mask
represents a 'right
16 team.'
17 [0091] At block 210, the machine learning module 178, using a trained
machine learning model,
18 such as a hidden Markov model, to classify temporal portions of the
input video signal for game
19 state. The game state comprising either game in play or game not in
play. The hidden Markov
model receiving the visual cues as input features. The hidden Markov model
trained using training
21 data comprising a plurality of previously recorded video signals each
with manually identified play
22 states. In further cases, other suitable models can be used, such as a
long-short-term memory
23 model (LSTM) model could be used instead.
24 [0092] At block 212, the output module 180 can excise the temporal
portions classified as game
not in play; resulting in an abbreviated video with only the temporal portions
classified as game in
26 play.
27 [0093] At block 214, the output module 184 outputs the abbreviated
video. The output module
28 184 outputs to at least one of the user interface 156, the database 166,
the non-volatile storage
29 162, and the network interface 160.
12
Date Recue/Date Received 2022-06-23
1 [0094] Visual cues can be used by the system 150 for classifying video
frames individually as
2 play/no-play and auditory cues can be used by the system 150 for
detecting auditory changes of
3 the play state (such as whistles). In order to put these cues together
and reliably excise periods
4 of non-play, the machine learning model should capture statistical
dependencies over time. For
example, employing the aforementioned hidden Markov model (HMM). A Markov
chain is a model
6 of a stochastic dynamical system that evolves in discrete time over a
finite state space, and that
7 follows the Markov property or assumption. The Markov property states
that when conditioned on
8 the state at time t, the state at time t + 1 is independent of all other
past states. Thus, when
9 predicting the future, the past does not matter, only the present is
taken into consideration.
Consider a sequence of observations 0 = [01,02, ...,OT) and a state sequence Q
= fch,
11 The Markov property is mathematically represented as:
12 P(chIch, ch-i) = P(chIch-i)
(1)
13 [0095] The Markov chain is specified by two components: 1) initial
probability distribution over
14 the states and 2) state transition probabilities.
[0096] HMM is a model that is built upon Markov chains. A Markov chain is
useful when the
16 probability for a sequence of observable states is to be computed.
However, sometimes the states
17 of interest are hidden, such as play and no-play states in videos of
sporting events. An HMM is a
18 model that consists of a Markov chain whose state at any given time is
not observable; however,
19 at each instant, a symbol is emitted whose distribution depends on the
state. Hence, the model
is useful for capturing distribution of the hidden states in terms of
observable quantities known as
21 symbols/observations. In addition to the Markov property given by
Equation (1), the HMM has an
22 extra assumption that given the state at that instant, the probability
of the emitted
23 symbol/observation is independent of any other states and any other
observations. This is
24 mathematically represented as:
P(oi I ch, P(oiich) (2)
26 [0097] An HMM is specified by the following parameters:
27 = Initial probability distribution over states, n-i , such that nv_i n-i
= 1.
28
= State transition probability matrix A, where each element aij represents the
probability of
29 moving from state i to
state], such that E,Li aij = 1Vi.
13
Date Recue/Date Received 2022-06-23
1 =
Emission probabilities B = bi(ot), which indicates the probability of an
observation ot
2 being generated from state i.
3 [0098] An HMM is characterized by three learning problems:
4 =
Likelihood: Given an HMM A = (A, B) and an observation sequence 0, determine
the
likelihood of P (0 IA).
6 =
Decoding: Given an HMM A = (A, B) and an observation sequence 0, what is the
best
7 sequence of hidden states Q.
8 =
Learning: Given an observation sequence 0 and the set of possible states in
the HMM,
9 learn the HMM parameters A and B.
[0099] The system 150 uses HMM to determine if a given frame belongs to a play
segment or a
11
no-play segment, and the observations emitted are the visual cue, and in some
cases, the auditory
12
cue. After learning the model, given the sequence of visual and optional
auditory observations, it
13 is used to estimate whether each frame belongs to play or no-play
states.
14
[0100] Since the training data includes a labelled sequence of states, the HMM
can be used to
estimate the state transition probability matrix and determine a maximum
likelihood estimate for
16
a given state. Similarly, the observation likelihoods can be modelled from the
training data. The
17
present disclosure provides two different approaches to model the likelihoods:
(1) Gaussian
18
Mixture Models (GMMs) and (2) Kernel Density Estimation (KDE); however, any
suitable
19 approach can be used.
[0101] A Gaussian Mixture Model (GMM) is a probabilistic model that fits a
finite number of
21
Gaussian distributions with unknown parameters to a set of data points. The
GMM is
22
parameterized by the means and variances of the components and the mixture
coefficients. For
23
a GMM with K components, the ith component has a mean variance o-i2 and
component weight
24 of cp. The probability density function, f (x), of a such a GMM is given
as:
exp(¨ (xit202)
f (x) = 1 -
0,
(3)
2
14
Date Recue/Date Received 2022-06-23
1
The mixing/component weights Oi satisfy the constraint Efc_i = 1. If the
number of components
2 in the GMM is known, the model parameters can be estimated using the
Expectation Maximization
3 (EM).
4 [0102] An alternative non-parametric approach to modelling the
likelihoods is Kernel Density
Estimation (KDE). Gaussian KDE approximates the probability density at a point
as the average
6 of Gaussian kernels centered at observed values. The probability density
function, f (x), for
7 Gaussian KDE is given as:
1 N 1
(x-x1)2
8 f (x) = E 1=1Nhn-o-2 2o-2 ) exp(¨
(4)
N
9 where N is the total number of data points.
[0103] Although KDE is expressed as a Gaussian mixture, there are two major
differences to the
11 GMM density in Equation (3). First, the number of Gaussian components in
Equation (4) is N (the
12 number of data points), which is typically significantly more than the M
components in a GMM
13 (Equation (3)). Second, the variance, 0-2, is the same for all
components in Equation (4). The only
14 parameter to be estimated for KDE is the variance, 0-2. It can be
estimated using Silverman's rule.
[0104] The learned state transition matrix and the emission probabilities can
be used at inference
16 to estimate the sequence of states. In an example, an approach to
determine the optimal
17 sequence of hidden states is the Viterbi algorithm. It determines the
maximum a posteriori
18 sequence of hidden states, i.e., the most probable state sequence. As a
result, it is difficult to tune
19 to control type 1 and type 2 errors. Instead, the marginal posteriors
are estimated at each time
instant. A threshold can then be adjusted to achieve the desired balance of
type 1 and type 2
21 errors.
22
[0105] Let 0 = [01,02, ..., oT) be the sequence of observations and Q = fch,
, ciT) be a
23 sequence of hidden states. qt E [1,2, ...,N), where N is the number of
states; N = 2 can be used
24 in the present embodiments. T is the number frames in the video. The
maximum posterior of
marginals (MPM) returns the state sequence Q, where:
26 Q = far g max qi13 , OT), , arg maxqTP , OT))
(5)
27 [0106] Let A = (A, B) be an HMM model with state transition matrix A and
emission probabilities
28 B. The posterior probability of being in state] at time t is given as:
Date Recue/Date Received 2022-06-23
P(qt=j,01A)
1 Yt(j) = P(cit = =
(6)
p(oiA)
2 [0107] The forward probability, at(j), is defined as the probability of
being in state] after seeing
3 the first t observations, given the HMM A. The value of at(j) is computed
by summing over the
4 probabilities of all paths that could lead to the state] at time t. It is
expressed as:
at(j) = P(o1,o2, ...,ot,qt = jIA) = at_1(0aubj(ot)
(7)
6 where aij is the state transition probability from previous state qt_1 =
i to current state qt =].
7 at_i(i) is the forward probability of being in state i at time t ¨ 1, and
it can be recursively
8 computed.
9 [0108] The backward probability, f3t(j), can be defined as the
probability of seeing the
observations from time t + 1 to T, given that it is in state] at time t and
given the HMM A. It can
11 be expressed as:
12 fit = P(ot i, ot 2, lat =
=Eliv=1 ajibj(ot+i)fit+i(i) (8)
13 where f+1(i) is the backward probability being in state i at time t + 1,
and can be computed
14 recursively.
[0109] Putting the forward probability (at(j)) and backward probability
(f3t(j)) in Equation (6), the
16 posterior probability yt(fl is given as:
17
rt (i) = a(j)f3(j)(9)
Eli'1=iat(i)flt(i)
18 [0110] The state sequence maximizing the posterior marginals (MPM) is
computed as:
19 Q = farg maxjyi (j),arg max1y2(j), ...,arg maxjyT (pi
(10)
[0111] In the present embodiments, mislabeling a play state as a no-play state
might be more
21 serious than mislabeling a no-play state as a play state, as the former
could lead to the viewer
22 missing a key part of the game, whereas the latter would just waste a
portion of time. Thus, rather
23 than selecting the MPM solution, the threshold on the posterior can be
adjusted to achieve a
24 desired trade-off between the above.
16
Date Recue/Date Received 2022-06-23
1
[0112] Using an example of the present embodiments, the present inventors
experimentally
2
verified at least some of the advantages of the present embodiments. A dataset
for the example
3
experiments consisted of 12 amateur hockey games recorded using three
different high-resolution
4
30 frames-per-second (fps) camera systems, placed in the stands, roughly
aligned with the center
line on the ice rink and about 10m from the closest point on the ice.
6 =
Camera 1: Four games were recorded using a 4K Axis P1368-E camera (as
illustrated in
7 FIG. 3A).
8 =
Camera 2: Five games were recorded using two 4K IP cameras with inter-camera
rotation
9
of 75 deg (as illustrated in FIG. 3B). Nonlinear distortions were removed and
a template
of the ice rink was employed (as illustrated in FIG. 5A) to manually identify
homographies
11
between the two sensor planes (as illustrated in FIG. 4) and the ice surface.
These
12
homographies were used to reproject both cameras to a virtual cyclopean camera
13
bisecting the two cameras, where the two images were stitched using a linear
blending
14 function (as illustrated in FIG. 5B).
= Camera 3: Three games were recorded using a 4K wide-FOV GoPro 5 camera (as
16 illustrated in FIG. 3C), which also recorded synchronized audio at
48kHz.
17
[0113] Camera 1 and Camera 2 were placed roughly 8 meters and Camera 3 roughly
7 meters
18
above the ice surface. The substantial radial distortion in all the videos was
corrected using
19
calibration. To assess generalization over camera parameters, the roll and
tilt of Camera 3 was
varied by roughly +5 deg between games and periods.
21
[0114] The 12 recorded games in the example experiments were ground-truthed by
marking the
22
start and end of play intervals. For Cameras 1 and 2, the start of play was
indicated as the time
23
instant when the referee dropped the puck during a face-off and the end of
play by when the
24
referee was seen to blow the whistle. Since there was audio for Camera 3,
state changes were
identified by the auditory whistle cue, marking both the beginning and end of
whistle intervals,
26 which were found to average 0.73 sec in duration.
27
[0115] While the example experiments were generally trained and evaluated
within camera
28
systems, the experiments show that our deep visual cues generalize well across
different camera
29
systems as well as modest variations in extrinsic camera parameters. For all
three camera
17
Date Recue/Date Received 2022-06-23
1 systems, training and evaluation was performed on different games, using
leave-one-game-out
2 k-fold cross-validation.
3 [0116] An OpenCV implementation of Farneback's dense optic flow algorithm
was used and the
4 flow fields lying within bounding boxes of players were detected using a
Faster-RCNN detector,
fine-tuned on three games recorded using Camera 2 that were not part of this
dataset; this
6 implementation is illustrated in FIG. 6. Motion energy is generally
higher during periods of play
7 than during breaks, but given the sparse nature of the flow it is not
immediately obvious how to
8 optimally aggregate the flow signal to create the strongest classifier.
The example experiments
9 assessed a range of LP norms over the optic flow vector magnitudes for
Game 1 recorded using
Camera 3, measuring classification error for distinguishing play from no-play
states (illustrated in
11 FIG. 7). It was determined that error rate was lowest for very high
exponents, which leads to a
12 very simple and computationally efficient visual cue: the L norm of
the optic flow, i.e., the
13 maximum flow vector magnitude within detected player boxes.
14 [0117] In some cases, the maximum optic flow visual cue can be
problematic where motion on
the playing surface can sometimes be substantial during breaks and sometimes
quite limited
16 during periods of play.
17 [0118] A small deep classifier, an artificial neural network, can be
used to allow end-to-end
18 training for play/no-play classification using a multi-channel feature
map as input and outputting
19 the probability distruction at the logit layers. (For Camera 3, whistle
frames were included in the
play intervals). The 6 channels of input consisted of a) the RGB image as
illustrated in FIG. 8A,
21 b) horizontal and vertical optic flow maps as illustrated in FIG. 8B,
and c) binary player position
22 mask as illustrated in FIG. 8C. The feature maps were normalized to have
zero mean and unit
23 variance, resized to 150 x 60 pixels, and then stacked to form a 6-
channel input. The training
24 dataset was augmented by left-right mirroring. In a particular case, the
artificial neural network
can be a convolutional neural network that is trained to classify each frame
as belonging to play
26 or no-play classes; however, any suitable artificial neural network can
be used.
27 [0119] The artificial neural network consisted of two cony-pool modules
followed by two fully
28 connected layers; as illustrated in the diagram of FIG. 9. A max pooling
layer followed each
29 convolution layer and dropout was used between every fully connected
layer. The output from the
network was the softmax probability of the frame belonging to play or no-play
classes. Cross-
31 entropy loss between the predicted class and ground truth class was
minimized using a stochastic
18
Date Recue/Date Received 2022-06-23
1 gradient descent (SGD) optimizer. The model was trained for 20 epochs
with an initial learning
2 rate of 0.01 and weight decay of 0.01. The learning rate was decreased by
50% every 5 epochs.
3 [0120] The pre-softmax (logit) layer output difference of the trained
model can be used as the
4 visual cue. A separate model was trained for each camera. For Cameras 1
and 2, one game was
used for validation and one for test, and the remaining games used for
training. For Camera 3,
6 one game was used for test, one period from one of the other games was
used for validation, and
7 the remaining data were used for training.
8 [0121] To determine the visual cues, the present inventors evaluated the
performance of four
9 visual classifiers in classifying each frame as belonging to play and no-
play. The performance of
the classifier was measured in terms of the Area Under Curve (AUC) score. The
AUC score
11 measures the area under the Receiver Operating Characteristic (ROC)
curve. The ROC curve
12 plots the true positive rate (TPR) against the false positive rate (FPR)
for different thresholds. It
13 measures the ability of a classifier to distinguish between classes at a
given threshold. The AUC
14 score summarizes the performance of a classifier across all thresholds.
AUC score takes values
in [0,1], with 0 indicating a classifier that classifies all positive examples
as negative and all
16 negative examples as positive, and 1 indicating a classifier that
correctly classifies all positive and
17 negative samples.
18 [0122] For each camera, the AUC score was measured through leave-one-out
cross validation,
19 and was averaged across all cross-validation folds. The results are
shown in TABLE 1. The AUC
scores of all four visual classifiers are good across all cameras, indicating
that these
21 cues/classifiers are good at differentiating play and no-play frames.
Across all cameras, the
22 performance of the baseline classifier with a deep network (ResNet18 +
FC) was better than that
23 of the baseline classifier with SVM (ResNet18 + SVM). The performance of
all classifiers are
24 worse on Camera 3 than Cameras 1 and 2. This was because the roll and
tilt varied across
different games recorded using Camera 3, while Cameras 1 and 2 were fixed
stationary cameras.
26 [0123] The performance of the maximum optic flow visual cue is worse
than the baselines on
27 Cameras 1 and 2. However, on Camera 3, the AUC score is significantly
better. Since the camera
28 roll is varied across different games, maximum optic flow cue is less
affected by these changes
29 than the ResNet18 model whose input is the RGB image. Across all cameras,
the best
performance was obtained using our deep visual cue.
19
Date Recue/Date Received 2022-06-23
1 [0124] The present inventors compared our two visual classifiers against
two baseline deep
2 classifiers trained to use as input the 512-dimensional output from the
final fully connected layer
3 of the ImageNet-trained ResNet18 network. The first classifier consisted
of two fully connected
4 layers of dimensions 128 and 64, followed by a play/no-play softmax
layer. The learning rate for
this network was 0.001, weight decay was 0.01 and it was trained for 10
epochs. The second
6 classifier was an SVM using an RBF kernel. TABLE 1 shows performance of
the four visual
7 classifiers. Across all cameras, the best performance was obtained using
the end-to-end trained
8 deep visual classifier of the present embodiments.
9 TABLE 1
AU C scores
Camera 1 Camera 2 Camera 3
Resnet18 + FC 0.923 +
0.018 0.907 + 0.052 0.598 + 0.03
Resnet18 + SVM 0.884 +
0.009 0.844 + 0.014 0.545 + 0.01
Maximum optic flow 0.885 +
0.011 0.818 + 0.0080.799 + 0.028
End-to-end deep classifier 0.977 + 0.004 0.966 + 0.005 0.819 + 0.053
11 [0125] In ice hockey, referees blow their whistles to start and stop
play. Therefore, the present
12 inventors explored the utility of auditory cues for classifying play and
no-play frames. While not
13 directly informative of the current state, the whistle can serve as an
indicator of transitions
14 between the play state and no-play state. For Camera 3, the audio signal
was partitioned into 33
msec intervals, temporally aligned with the video frames. Since the audio was
sampled at 48 kHz,
16 each interval consisted of 1,600 samples. The audio samples in each
interval were normalized to
17 have zero-mean and the power spectrum density (PSD) for each interval
was determined as
18 P(f)= S(f)S*(f); where S(f) and S*(f) are the Fourier Transform and
conjugate Fourier
19 Transform of an interval of audio samples at the frequency f. FIGS. 10A
to 10C show the power
spectral density (PSD) averaged over whistle and non-whistle intervals for the
three games
21 recorded using Camera 3 (FIG. 10A shows Game 1; FIG. 10A shows Game 2;
and FIG. 10C
22 shows Game 3). These plots reveal several important facts. First, the
overall volume of sound
23 varies widely from game to game: While Game 1 is relatively quiet, Games
2 and 3 are quite
24 noisy, with a lot of power in the low frequencies. Second, most of the
whistle power lies in the 2-
Date Recue/Date Received 2022-06-23
1
3 kHz range, however that power is not distributed evenly and the power of
that signal and hence
2 the signal-to-noise ratio varies widely from game to game.
3
[0126] To form a decision variable for each interval, the example experiments
considered two
4 candidate detectors:
= Band
pass filter. The integral of the power spectral density (PSD) over the 2-3 kHz
band
6
was determined. This is probabilistically optimal if both the signal and noise
are additive,
7 stationary, white Gaussian processes and the PSDs are identical outside
this band.
8 =
Wiener filter. FIGS. 10A to 10C show that in fact the signal and noise are not
white.
9
Relaxing the condition that the PSDs be white and identical outside the 2-3
kHz band, for
longer intervals (many samples), it can be shown that probabilistically near-
optimal
11
detection is achieved by taking the inner product of the stimulus PSDs with
the Wiener
12 filter:
13 H(f) = P(f)
(11)
P(f)+P(f)
14
where P(f) and P(f) are the PSD of the signal (whistle) and noise,
respectively, as a function
of frequency f .
16
[0127] In the present case, there is not direct knowledge of the whistle and
noise PSDs and so
17 they must be estimated from the training data:
18 P(f) "~" Pw(f) ¨ PNw(f)
(12)
19 P(f) "~" PNw(f)
(13)
where Pw(f) and PNw(f) are the average PSDs over whistle and non-whistle
training intervals,
21 respectively. Thus:
22 H(f) ,,,_, Pw(f)-PNw(f)
(14)
Pw(f)
23 = 1 PNW(f)
(15)
Pw(f)
24
[0128] The right-side charts in FIGS. 10A to 10C show the resulting Weiner
filters H (f) estimated
for each of the three games recorded by Camera 3. The filter is largely
positive in the 2-3 kHz
21
Date Recue/Date Received 2022-06-23
1
range but can become negative outside this range. This suggests that in fact
the signals are not
2
exactly stationary and/or additive. Two possibilities are that some acoustic
signals are more likely
3
to occur in non-whistle than in whistle intervals, and that, when the whistle
is blown, auto-gain
4
circuitry in the camera attenuates energy outside the whistle band. To handle
these deviations
from assumptions, the example experiments evaluated three versions of the
Wiener filter:
6 =
Wiener filter 1. Take the inner product of the stimulus with the estimated
Wiener filter
7 over the entire frequency range, including negative values.
8 =
Wiener filter 2. Take the inner product of the stimulus with the rectified
Wiener filter
9 (negative values clipped to 0).
= Wiener filter 3. Take the inner product of the stimulus with the rectified
Wiener filter
11 (negative values clipped to 0), only over the 2-3 kHz range.
12
[0129] TABLE 2 shows average area under curve (AUC) scores for these four
detectors using
13
three-fold cross-validation on the three games recorded using Camera 3.
Overall, the Wiener filter
14
3 detector performed best. Its advantage over the bandpass filter presumably
derives from its
ability to weight the input by the non-uniform SNR within the 2-3 kHz band.
Its advantage over
16
the other two Wiener variants likely reflects the inconsistency in the PSD
across games outside
17 this band.
18 TABLE 2
AUC score
Bandpass filter 0.919 + 0.039
Wiener filter 1 0.779 + 0.105
Wiener filter 2 0.809 + 0.093
Wiener filter 3 0.943 + 0.028
19
[0130] Visual cues are seen to be useful for classifying video frames
individually as play/no-play
21
and auditory cues are useful for detecting the whistle. In order to put these
cues together and
22
reliably excise periods of non-play from the entire video, a model should
capture statistical
22
Date Recue/Date Received 2022-06-23
1 dependencies over time. FIG. 11 shows an example of how the visual
maximum optic flow and
2 auditory cues vary over time within each game state, for Camera 3 in Game
1.
3 [0131] To capture these statistical dependencies, some of the example
experiments employed a
4 hidden Markov model (HMM) of play state. For Cameras 1 and 2 (visual
only), the example
experiments employed a 2-state model (play/no-play) (as illustrated in FIG.
12A). For Camera 3
6 (with audio), the example experiments employed a 4-state model that
includes start and stop
7 whistle states (as illustrated in FIG. 12B). TABLE 3 shows the state mean
transition probabilities
8 learned from the labelled data.
9 TABLE 3
Camera Transition Probability
1 No-play¨*Play 0.00038
1 Play¨*No-play 0.00053
2 No-play¨*Play 0.00092
2 Play¨*No-play 0.00054
3 No-play¨*Start 0.00117
Whistle
3 Start 0.04973
Whistle¨*Play
3 Play¨*Stop 0.00050
Whistle
3 Stop 0.04709
Whistle¨>No-
play
11 [0132] In addition to the state transition probabilities, emission
distributions for the observed
12 visual and auditory cues are determined, which can be treated as
conditionally independent. In a
13 particular case, the densities were determined using Gaussian kernel
density estimation with
14 bandwidth selected by Silverman's rule. FIGS. 13A to 13C show these
conditional distributions
for one game from Camera 1, Camera 2, and Camera 3, respectively; and for two
visual cues:
16 the maximum optic flow cue, normalized to have zero mean and unit
variance, and the softmax
23
Date Recue/Date Received 2022-06-23
1 confidence for the play state from our deep visual classifier. Each left-
side chart shows conditional
2 probability densities for the maximum optic flow and each right-side
chart shows the deep network
3 P(play) visual cues on Game 1. For Camera 3, four conditional
distributions are shown, including
4 the distributions for start and stop whistles, to use in the 4-state HMM.
Note the superior
discriminative power of the deep visual cue. FIGS. 14 to 14C show the
conditional densities for
6 the auditory cue of Camera 3 (log of the Weiner filter 3 response,
normalized to have zero mean
7 and unit variance) for Game 1, Game 2, and Game 3, respectively.
8 [0133] In some cases, the state transition probabilities and emission
distributions used in the
9 HMMs may vary slightly with each fold of the k-fold cross-validation.
[0134] The example experiments employed a Viterbi algorithm to efficiently
determine the
11 maximum a posteriori sequence of hidden states given the observations.
One limitation of this
12 approach is that it treats all errors equally, whereas one might expect
that mislabeling a play state
13 as a no-play state might be more serious than mislabeling a no-play
state as a play state, as the
14 former could lead to the viewer missing a key part of the game, whereas
the latter would just
waste a little time. To handle this issue, a play bias parameter a > 1 was
used that modifies the
16 transition matrix to upweight the probability of transitions to the play
state, down-weighting other
17 transitions so that each row still sums to 1. Varying this parameter
allows the system to sweep
18 out a precision-recall curve for each camera. To compress the videos,
any frames estimated to
19 be play frames were retained and any frames estimated to be no-play
frames were excised.
[0135] The example experiments were evaluated using precision-recall for
retaining play frames
21 (Cameras 1 and 2) and retaining play and whistle frames (Camera 3):
# play & whistle frames retained
22 Precision =
(16)
# frames retained
# play SZ whistle frames retained
23 Recall =
(17)
# play & whistle frames in video
24 The percent (%) compression at each rate of recall was also determined.
[0136] FIGS. 15A to 15C show results, averaged over all leave-one-game-out
folds, for Camera
26 1, Camera 2, and Camera 3, respectively. FIGS. 15A to 15C show HMM cross-
validated
27 performance; where OF: Optical flow, DV: Deep visual feature, DA: Domain
adaptation. For
28 Camera 3, the example experiments evaluated using a 2-state HMM with
only visual cues as well
29 as a 4-state HMM with both visual and audio cues. For reference, shown
is a lower bound of the
24
Date Recue/Date Received 2022-06-23
1 performance of a baseline that excises random frames, and as an upper
bound the compression-
2 recall attained by an ideal model that first excises all non-play frames
before beginning to excise
3 play frames.
4 [0137] The deep visual cue clearly outperforms the optic flow cue for all
cameras. Interestingly,
while the optic flow cue clearly benefits from integration with the audio cue,
the deep visual cue
6 seems to be strong enough on its own, and no sensory integration benefit
is necessarily observed.
7 FIGS. 16A to 16C show performance of deep visual cues for Camera 1,
Camera 2, and Camera
8 3, respectively; where the left charts are precision-recall curves, and
the right charts are
9 compression-recall curves. FIGS. 16A to 16C show that these deep visual
cues generalize well
across the three camera systems.
11 [0138] As described, the visual cues and the auditory cues can be used
as observations inputted
12 to the HMM. In the example experiments, since Cameras 1 and 2 did not
record audio, only the
13 visual cue were available. Hence, the 2-state model (play/no-play) of
FIG. 12A was used. As
14 Camera 3 recorded audio, the 4-state model of FIG. 12B was used. The
initial state probabilities
were determined from the training data as the percentage of frames belonging
to either a Play or
16 No-play state across all games for each camera. In another example
experiment, such results are
17 seen in Table 4 that shows mean initial state probabilities for each
camera.
18 TABLE 4
Initial probabilities (it)
Camera
Play No-play
1 0.629 0.371
2 0.656 0.344
3 0.699 0.301
19
[0139] Similarly, the probability of transitioning between states can be
computed from the training
21 data as the proportion of frames where the desired transition happens.
For example, the transition
22 probability of going from No-play state to Play state can be computed as
the fraction of No-play
23 frames where the next state was Play. Example results are illustrated in
Table 5 that shows mean
24 state transition probabilities for each camera.
Date Recue/Date Received 2022-06-23
1 Table 5
Camera Transition Probability
1 No-play¨*Play 0.00100
1 Play¨*No-play 0.00053
2 No-play¨*Play 0.00092
2 Play¨*No-play 0.00054
3 No-play¨*Start 0.00117
Whistle
3 Start 0.04973
Whistle¨*Play
3 Play¨*Stop 0.00050
Whistle
3 Stop 0.04709
Whistle¨>No-
play
2
3 [0140] The auditory and visual cues were normalized to have zero-mean and
unit-variance. The
4 two features were assumed to be conditionally independent. Hence, in this
example experiment,
the observation likelihoods were modelled separately. In order to model the
auditory and visual
6 cues using a GMM, an optimal number of components was determined. The number
of
7 components were varied and an AUC score for classifying play and no-play
frames was
8 determined. The GMM model was trained using training data comprising
captured and labelled
9 games. Given a test game, the ratio of the likelihoods of play and no-
play states was used to
compute the AUC score for that game. The AUC score was averaged across all
games for each
11 camera through leave-one-out cross validation. The results are shown in
Table 6, showing
12 illustrating cross-validated AUC scores as a function of the number of
GMM components (where
13 OF is maximum optic flow cue and DV is deep visual cue).
14 TABLE 6
2-state HMM 4-state HMM
26
Date Recue/Date Received 2022-06-23
# of GMM
OF DV OR-Audio DV+Audio
corn ponents
1 0.8394 0.9149 0.7366 0.7337
2 0.8398 0.9150 0.7378 0.7349
3 0.8399 0.9152 0.7433 0.7454
4 0.8374 0.9151 0.7369 0.7346
0.8387 0.9150 0.7378 0.7363
7 0.8387 0.9143 0.737 0.7362
0.8379 0.9145 0.7374 0.7368
1
2 [0141] The example experiments found that the discriminative power of the
deep visual cue was
3 superior to that of the maximum optic flow cue. The 3-component GMM
achieved the best results
4 for both 2-state and 4-state HMM using either visual cue. For the 4-state
model, the likelihoods of
5 the whistle states were added to the likelihood of the play state.
6 [0142] Since the KDE models a Gaussian for each data point, it can get
computationally
7 expensive for long sequences/videos. In the example experiments, the
present inventors
8 computed the histogram of the visual and auditory cues for a specified
number of bins and then
9 modelled the histogram of the observations using a Gaussian KDE. In a
similar manner to the
10 analysis for the optimal number of GMM components, the AUC score was
used to determine the
11 optimal number of histogram bins. The results are illustrated in Table
7, which shows that
12 histogram of the visual and auditory cues were computed for the
specified number of bins and
13 modelled using a Gaussian KDE; where the AUC score for classifying play
and no-play frames
14 was computed. The discriminative power of the deep visual cue was
superior to that of the
maximum optic flow cue. The best results were obtained when the observation
was a 32-bin
16 histogram.
17 TABLE 7
# histogram 2-state HMM 4-state HMM
bins OF DV OR-Audio DV+Audio
27
Date Recue/Date Received 2022-06-23
8 0.8221 0.8984 0.6704 0.6661
16 0.8345 0.9099 0.6967 0.6952
32 0.8376 0.9143 0.6986 0.7008
64 0.8376 0.9142 0.6904 0.6881
128 0.8373 0.9141 0.675 0.6747
256 0.8372 0.9136 0.6598 0.6603
512 0.8367 0.9133 0.6442 0.6471
1024 0.8360 0.9126 0.629 0.6338
1
2 [0143] As seen in Table 6 and Table 7, the AUC score was better when
modelling the likelihoods
3 using a GMM rather than KDE. Hence, modelling the likelihoods using a 3-
component Gaussian
4 Mixture Model (GMM) provides substantial advantages.
[0144] FIG. 17 illustrates conditional probability densities for the maximum
optic flow visual cue
6 on all games across all three cameras. FIG. 18 illustrates conditional
probability densities for the
7 deep visual cue on all games across all three cameras. The conditional
densities for the auditory
8 cue of Wiener filter 3 detector on games from Camera 3 are shown in FIG.
19; where only Camera
9 3 was recorded with audio. Hence, four conditional densities are shown
for Camera 3, including
the distributions for start and stop whistles. The two whistle states are
considered to be a part of
11 play when reducing the 4-state HMM to a 2-state HMM.
12 [0145] A fundamental part of machine learning is the problem of
generalization, that is, how to
13 make sure that a trained model performs well on unseen data. If the
unseen data has a different
14 distribution, i.e., a domain shift exists, the problem is significantly
more difficult. The system 150
learns emission probabilities by modelling the observation likelihoods using,
in some cases, a 3-
16 component GMM on the training data. If the observation distribution is
different between the
17 captured games in the training and test data, then there is a risk that
the emission probabilities
18 on the test data are wrong; and this will affect the estimated state
sequence. In some cases, the
19 emission probabilities of the HMM at inference can be adapted to
accommodate these domain
shifts.
28
Date Recue/Date Received 2022-06-23
1 [0146] Unsupervised HMM parameter learning can be performed using the
Baum-Welch
2 algorithm, which is a special case of the EM algorithm. The Baum-Welch
algorithm allows learning
3 both the state transition probabilities A and the emission probabilities
B. This is the third problem
4 (learning) that is characterized by using an HMM. Forward and backward
probabilities can be
used to learn the state transition and emission probabilities.
6 [0147] Let 0 = [01,02, ..., oT) be a sequence of observations and Q =
[q1, q2, , chl be a
7 sequence of hidden states. Let at(j) be the probability of being in
state] after seeing the first t
8 observations. Let f3(/) be the probability of seeing the observations
from time t + 1 to T, given
9 that the system is in state] at time t. Let yt(j) be the probability of
being in state] at time t, given
all observations. The state transition probabilities A can be determined by
defining eii; as:
expected number of transitions from state i to state j
11 = ________________________________________________________
(18)
expected number of transitions from state i
12 [0148] The probability of being in state i at time t and state] at time
t + 1, given the observation
13 sequence 0 and HMM A = (A, B), is given as:
14 = P (cit = cit+i = = P(qt=i,qt+1=j,01A) =
at(Octijbj(ot+t)flt+t(i)
(19)
p(oiA) E7c=1at(k)flt(k)
[0149] The expected number of transitions from state i to state] can be
obtained by summing
16 Mi,j) over all frames t. Using Equation (19), Equation (18) can be
rewritten as:
17 = E'rz G(ii)
vT-1 vN
(20)
,k,lst(i,k)
18 [0150] The observation likelihoods can be modelled using a 3-component
GMM. Thus, the
19 probability of seeing observation ot in state] is given as:
b1(o) = OkiN(ot; cr4i) (21)
21 where Oki, itkj and 0-4/ are the weight, mean and variance of the kth
component of the GMM of
22 state], and N is the Gaussian distribution with mean itki and variance
az.i.
23 [0151] Knowing the state for each observation sample, then estimating
the emission probabilities
24 B can be performed. The posterior probability yt(j) gives the
probability that observation ot came
29
Date Recue/Date Received 2022-06-23
1
from state j. The Baum-Welch algorithm updates the weights, means and
variances of the GMM
2 as:
P j(kiot,c13)Yt(i)
3 'I kj = ET=tYtU)
(22)
I=iotPj(kIot,)yt(J)
4 = ET=i vt(i)
(23)
õ^2 (ot-itio2P;(klot,o)vt(i)
k j = vt(i)
(24)
6
where (13. represents the current set of GMM parameters. Pj(k lot, (13) is the
probability that the
7 observation ot was from the kth component of the GMM of state]. It is
given as:
k(I) jN (0t; !Lk pcq
8 P./ (k I ot, (13) = ,,,õ
(25)
Lni=i 0171jAr( 611171PC:rm2 j)
9
[0152] Thus, the state transition probabilities A can be estimated using
Equation (20), and the
emission probabilities B using Equations (22), (23) and (24). The iterative
Baum-Welch algorithm
11 can be performed as follows:
12 = Initialize the state transition probabilities A and emission
probabilities B.
13
= Use Equation (16) to estimate n(j) given the state transition matrix A and
emission
14 probabilities B.
= Use n(j) to update the state transition probabilities A and emission
probabilities B
16
= Repeat iteratively until the difference in the log-likelihood between five
successive
17 iterations is less than a given threshold (e.g., 0.1).
18
[0153] FIG. 20 shows an example of how the visual cue of maximum optic flow
and auditory cue
19
of Wiener filter 3 detector varies over time within each game state, for a 160-
second sample video
from Game 1 recorded using Camera 3. It is observed that Wiener filter 3 has a
sharp response
21
during whistle periods. Thus, players moving faster during play than breaks
(no-play) is evidenced
22
by the large values of the maximum optic flow cue during play frames and lower
values during
23 no-play frames.
Date Recue/Date Received 2022-06-23
1 [0154] Using the forward-backward approach, the probability of being in
state] at time t, yt(j),
2 for each state across all frames of the video. To temporally compress the
video, frames were cut
3 if P(no-play) exceeds a threshold no. In this case, precision, recall and
compression can be
4 defined as:
#play&whistleframesretained
Precision = (26)
#framesretained
#play&whistleframe sretained
6 Recall =
(27)
#play&whi s deframe si nvi de o
#frame sretained
7 Compression = 1
(28)
#framesinvideo
8 [0155] Varying no sweeps out a precision-recall curve. Since no audio was
available for Cameras
9 1 and 2, the precision and recall were evaluated for retaining play
frames only. For Camera 3, as
audio was available, the precision and recall were evaluated for retaining
both play and whistle
11 frames.
12 [0156] The example experiments evaluated the generalization of the
system across different
13 games for each camera by measuring the within-camera performance through
leave-one-out
14 cross validation. For each camera, the precision, recall and compression
were measured through
leave-one out cross validation across all games. These were then averaged
across all three
16 cameras. The within-camera performance of the 2-state HMM (using visual
cue only) is shown in
17 FIG. 21. It was compared against two baselines: 1) Random: the lower
bound baseline that
18 randomly removes frames, and 2) Ideal: the upper bound of an ideal model
that accurately
19 removes all no-play frames, before beginning to remove play frames. The
within-camera
performance was determined using both the maximum optic flow cue and deep
visual cue. Both
21 cues were found to be significantly better than lower bound baseline
(Random). The performance
22 of the deep visual cue was significantly better than the maximum optic
flow cue.
23 [0157] The generalization of the system 150 across different cameras was
determined by
24 measuring the between-camera performance. The 2-state HMM was trained on
all games from
two cameras and then evaluated on the games from the third camera. For
example, a model was
26 trained on all games from Cameras 1 and 2 and then evaluated on all
games from Camera 3. The
27 between-camera performance was compared to the within-camera performance on
the third
28 camera, as shown in FIG. 22.
31
Date Recue/Date Received 2022-06-23
1 [0158] It was determined that between-camera performance was very similar
to the within-
2 camera performance across all cameras. Thus, the model is able to
generalize to different games,
3 rinks and lighting conditions. The performance was worse on Camera 3 as
compared to Cameras
4 1 and 2. Since Camera 3 was positioned closer to the ice surface as
compared to Cameras 1 and
2, the fans are more visible and cause more occlusions in the video recording.
Hence, the
6 performance of the player detector could have been poorer on Camera 3,
leading to less
7 discriminative deep visual cues. In addition to occlusions, if the fans
were moving during periods
8 of no-play, this would also make the deep visual cue less discriminative.
9 [0159] The performance of the 4-state HMM that combines visual and
auditory cues was also
evaluated. Three games were recorded with audio using Camera 3. The
performance of the 4-
11 state HMM on these three games was evaluated through leave-one-out cross
validation. The
12 precision, recall and compression were averaged across all three games.
FIG. 23 illustrates
13 performance of the 2-state HMM and 4-state HMM on Camera 3. The 4-state
HMM combined
14 visual and auditory cues, while the 2-state HMM used only the visual
cues. Combining auditory
cues with the maximum optic flow cue significantly improved performance.
However, no benefit
16 was observed upon integration of the deep visual cue with the auditory
cue.
17 [0160] The example experiments failed to observe any benefit of
integrating the visual and
18 auditory cues for Camera 3 once the strong deep visual cue was used.
While the deep visual
19 cues generalized well across cameras, the emission distributions of the
auditory cues for Camera
3 seem to vary substantially across games. This could indicate a domain shift
between the training
21 and test data for the auditory cues. This domain shift was examined by
analysing the fit of the
22 unconditional emission distribution learned from the training data on
the test data. The
23 unconditional emission distribution was determined as:
24 f (x) = f1(x)P(i)
(29)
where f1(x) and P(i) are the emission distribution and prior for state i,
respectively. N is the
26 number of states; N = 2 or N = 4 in this example.
27 [0161] FIGS. 24 and 25 visualize the unconditional densities learned
from the training data on
28 the histogram of the test data. A slight domain shift in the emission
distribution for the deep visual
29 cue was observed on Game 3. For the auditory cue, a substantial domain
shift for Games 1 and
2 was observed. FIG. 24 illustrates unconditional densities of the deep visual
cue learned from
31 the training data shown on the test data histogram for each game
recorded using Camera 3;
32
Date Recue/Date Received 2022-06-23
1 where left side is before adaptation and right side is after adaptation.
FIG. 25 illustrates
2 unconditional densities of the auditory cue learned from the training
data shown on the test data
3 histogram for each game recorded using Camera 3; where left side is
before adaptation and right
4 side is after adaptation.
[0162] Domain shift can be overcome by adapting the HMM to the test data at
inference. The
6 Baum-Welch algorithm can be used for unsupervised HMM parameter learning.
As described
7 herein, both the emission probabilities and the state transition
probabilities can be updated. The
8 percent change in the values of the state transition matrix A, between
the training and test games
9 for Camera 3, can be determined. The change across all three cross-
validations folds can be
averaged.
11 [0163] It was found that the average is to be 4.48%. This is a small
change that will not generally
12 influence the model performance. Empirically, it was found that updating
the transition
13 probabilities did not make any difference in the model performance.
Hence, only the emission
14 probabilities needed to be updated. There was a dramatic improvement in
the performance of 4-
state HMM (visual and auditory cue) after domain adaptation. In a similar
manner, the
16 performance of the 2-state HMM (visual cue only) before and after domain
adaptation on Cameras
17 1 and 2 was determined. The unconditional densities before and after
domain adaptation are
18 shown in FIGS. 24 and 25 for Camera 1 and Camera 2, respectively. It was
found that the
19 emission distributions for the deep visual cue learned on the training
data, modelled the test data
distributions well. Hence, there was no benefit found with domain adaptation,
as seen in the
21 precision-recall performance plots in FIG. 26.
22 [0164] As evidenced in the example experiments, the present embodiments
provide an effective
23 approach for automatic play-break segmentation for recorded sports
games, such as hockey. It
24 can be used to abbreviate game videos while maintaining high recall for
periods of active play.
With a modest dataset, it is possible to train a small visual deep network to
produce visual cues
26 for play/no-play classification that are much more reliable than a
simple optic flow cue.
27 Incorporation of an HMM framework accommodates statistical dependencies
overtime, allowing
28 effective play/break segmentation and temporal video compression.
Integration of auditory
29 (whistle) cues could boost segmentation performance by incorporating
unsupervised adaptation
of emission distribution models to accommodate domain shift. Embodiments of
the present
31 disclosure were found to achieve temporal compression rates of 20-50% at
a recall of 96%.
33
Date Recue/Date Received 2022-06-23
1 [0165] Although the foregoing has been described with reference to
certain specific
2 embodiments, various modifications thereto will be apparent to those
skilled in the art without
3 departing from the spirit and scope of the invention as outlined in the
appended claims. The entire
4 disclosures of all references recited above are incorporated herein by
reference.
34
Date Recue/Date Received 2022-06-23