Sélection de la langue

Search

Sommaire du brevet 2557690 

Énoncé de désistement de responsabilité concernant l'information provenant de tiers

Une partie des informations de ce site Web a été fournie par des sources externes. Le gouvernement du Canada n'assume aucune responsabilité concernant la précision, l'actualité ou la fiabilité des informations fournies par les sources externes. Les utilisateurs qui désirent employer cette information devraient consulter directement la source des informations. Le contenu fourni par les sources externes n'est pas assujetti aux exigences sur les langues officielles, la protection des renseignements personnels et l'accessibilité.

Disponibilité de l'Abrégé et des Revendications

L'apparition de différences dans le texte et l'image des Revendications et de l'Abrégé dépend du moment auquel le document est publié. Les textes des Revendications et de l'Abrégé sont affichés :

  • lorsque la demande peut être examinée par le public;
  • lorsque le brevet est émis (délivrance).
(12) Brevet: (11) CA 2557690
(54) Titre français: PROCEDE ET APPAREIL DE MISE EN OEUVRE DE FONCTIONS DE CORRECTION BASEES SUR UN SEUIL POUR BIOCAPTEURS
(54) Titre anglais: METHOD AND APPARATUS FOR IMPLEMENTING THRESHOLD BASED CORRECTION FUNCTIONS FOR BIOSENSORS
Statut: Octroyé
Données bibliographiques
(51) Classification internationale des brevets (CIB):
  • G01N 33/487 (2006.01)
  • C12Q 1/00 (2006.01)
  • G01N 27/416 (2006.01)
(72) Inventeurs :
  • MECKLENBURG, GEORGE A. (Etats-Unis d'Amérique)
(73) Titulaires :
  • ASCENSIA DIABETES CARE HOLDINGS AG (Suisse)
(71) Demandeurs :
  • BAYER HEALTHCARE LLC (Etats-Unis d'Amérique)
(74) Agent: OSLER, HOSKIN & HARCOURT LLP
(74) Co-agent:
(45) Délivré: 2022-04-12
(86) Date de dépôt PCT: 2005-03-31
(87) Mise à la disponibilité du public: 2005-10-20
Requête d'examen: 2010-03-05
Licence disponible: S.O.
(25) Langue des documents déposés: Anglais

Traité de coopération en matière de brevets (PCT): Oui
(86) Numéro de la demande PCT: PCT/US2005/011077
(87) Numéro de publication internationale PCT: WO2005/098424
(85) Entrée nationale: 2006-08-28

(30) Données de priorité de la demande:
Numéro de la demande Pays / territoire Date
60/557,907 Etats-Unis d'Amérique 2004-03-31
60/609,570 Etats-Unis d'Amérique 2004-09-13

Abrégés

Abrégé français

L'invention concerne un système de biocapteurs, un procédé et un appareil destinés à mettre en oeuvre des fonctions de correction basées sur un seuil pour les biocapteurs. Une mesure primaire d'une valeur d'analyte est obtenue. Une mesure secondaire d'un effet secondaire est obtenue et comparée à une valeur de seuil. Une fonction de correction est identifiée comme résultat de la comparaison des valeurs. La fonction de correction est appliquée à la mesure primaire de la valeur d'analyte pour produire une valeur d'analyte corrigée. Le procédé de correction utilise des courbes de correction fournies pour corriger un effet d'interférence. Les courbes de correction peuvent être linéaires ou non linéaires. Le procédé de correction présente différentes fonctions de correction au-dessus et au-dessous de la valeur de seuil. Les fonctions de correction peuvent être tributaires ou indépendantes de la mesure primaire faisant l'objet de la correction. Les fonctions de correction peuvent être linéaires ou non linéaires.


Abrégé anglais


A biosensor system, method and apparatus are provided for implementing
threshold based correction functions for biosensors. A primary measurement of
an analyte value is obtained. A secondary measurement of a secondary effect is
obtained and is compared with a threshold value. A correction function is
identified responsive to the compared values. The correction function is
applied to the primary measurement of the analyte value to provide a corrected
analyte value. The correction method uses correction curves that are provided
to correct for an interference effect. The correction curves can be linear or
non-linear. The corrction method provides different correction functions above
and below the threshold value. The correction functions may be dependent or
independent of the primary measurement that is being corrected. The correction
functions may be either linear or nonlinear.

Revendications

Note : Les revendications sont présentées dans la langue officielle dans laquelle elles ont été soumises.


-11-
The embodiments of the present invention for which an exclusive property or
privilege is claimed are defined as follows:
1. A method for implementing threshold based correction functions for a
biosensor comprising the steps of:
applying a sample to the biosensor and obtaining a primary
measurement of an analyte value;
obtaining a secondary measurement of a secondary effect;
comparing, using a processor, said secondary measurement of the
secondary effect with a threshold value;
responsive to said compared values, identifying, using the processor, a
correction function from a plurality of potential correction functions based
on
said compared values; and
applying said identified correction function to said primary
measurement to provide a corrected analyte value.
2. The method for implementing threshold based correction functions for
a biosensor as recited in claim 1 wherein the step responsive to said compared

values, of identifying a correction function includes the steps of identifying
said
secondary measurement of the secondary effect less than or equal to said
threshold
value, identifying a first coefficient A, said first coefficient A to control
magnitude of
said correction function.
3. The method for implementing threshold based correction functions for
a biosensor as recited in claim 2 further includes the steps of calculating
said
correction function represented by
C n = F *T + A * (T c - T) + H,
where T represents said secondary measurement of the secondary effect, T c
represents said threshold value; and F, H are predefined coefficients.
4. The method for implementing threshold based correction functions for
a biosensor as recited in claim 3 wherein the step of applying said identified

correction function to said primary measurement to provide a corrected analyte
value

-12-
further includes the steps of calculating said corrected analyte value
represented by
Gc = Gn/Cn,
where Gn represent said primary measurement of said analyte value.
5. The method for implementing threshold based correction functions for
a biosensor as recited in claim 1 wherein the step responsive to said compared

values, of identifying a correction function includes the steps of identifying
said
secondary measurement of the secondary effect greater than said threshold
value,
identifying a coefficient l, said coefficient l being used to control
magnitude of said
correction function.
6. The method for implementing threshold based correction functions for
a biosensor as recited in claim 5 further includes the steps of calculating
said
correction function represented by
Cn = F * T + l * (T -Tc) + H,
where T represents said secondary measurement of the secondary effect, Tc
represents said threshold value; and F, H are predefined coefficients.
7. The method for implementing threshold based correction functions for
a biosensor as recited in claim 6 wherein the step of applying said identified

correction function to said primary measurement to provide a corrected analyte
value
further includes the steps of calculating said corrected analyte value
represented by
Gc = Gn/Cn,
where Gn represent said primary measurement of said analyte value.
8. The method for implementing threshold based correction functions for
a biosensor as recited in claim 1 wherein the step of responsive to said
compared
values, identifying a correction function includes the steps of storing
predefined
correction curves; said predefined correction curves being provided to correct
for an
interference effect.
9. The method for implementing threshold based correction functions for
a biosensor as recited in claim 1 wherein the step of responsive to said
compared

-13-
values, identifying a correction function includes the steps responsive to
said
secondary measurement of the secondary effect being less than or equal to said

threshold value of identifying a first coefficient A and identifying said
correction
function responsive to said identified first coefficient A.
10. The method for implementing threshold based correction functions for
a biosensor as recited in claim 9 wherein the step of responsive to said
compared
values, identifying a correction function includes the steps responsive to
said
secondary measurement of the secondary effect being greater than said
threshold
value of identifying a second coefficient l and identifying said correction
function
responsive to said identified second coefficient l.
11. The method for implementing threshold based correction functions for
a biosensor as recited in claim 10 wherein the steps of identifying said first

coefficient A and identifying a second coefficient l include the steps of
providing
stored correction curves; said correction curves representing characteristics
of said
secondary measurement of the secondary effect.
12. The method for implementing threshold based correction functions for
a biosensor as recited in claim 10 wherein the steps of identifying said
correction
function responsive to said identified second coefficient A and identifying
said
correction function responsive to said identified second coefficient l
includes the
steps of identifying a linear function for said correction function.
13. The method for implementing threshold based correction functions for
a biosensor as recited in claim 10 wherein the steps of identifying said
correction
function responsive to said identified first coefficient A and identifying
said correction
function responsive to said identified second coefficient l includes the steps
of
identifying a nonlinear function for said correction function.
14. The method for implementing threshold based correction functions for
a biosensor as recited in claim 1 wherein the steps of identifying said
correction
function includes the steps of identifying said correction function using at
least one

-14-
coefficient value; said at least one coefficient value being dependent upon
said
primary measurement of said analyte value.
15. The method for implementing threshold based correction functions for
a biosensor as recited in claim 1 wherein the steps of identifying said
correction
function includes the steps of identifying said correction function using at
least one
coefficient value; said at least one coefficient value being a predefined
value
independent of said primary measurement of said analyte value.
16. The method for implementing threshold based correction functions for
a biosensor as recited in claim 1 wherein the step of obtaining a secondary
measurement of a secondary effect include the step of obtaining a temperature
measurement.
17. The method for implementing threshold based correction functions for
a biosensor as recited in claim 1 wherein the analyte is glucose and wherein
the step
of obtaining a secondary measurement of a secondary effect includes the step
of
obtaining a hemoglobin measurement.
18. The method for implementing threshold based correction functions for
a biosensor as recited in claim 1 wherein the analyte is glucose and wherein
the step
of obtaining a secondary measurement of a secondary effect includes the step
of
obtaining a measurement indicating a concentration of hematocrit.
19. The method for implementing threshold based correction functions for
a biosensor as recited in claim 1 wherein the analyte is glucose and wherein
the step
of obtaining a secondary measurement of a secondary effect includes the steps
of
obtaining a measurement indicating a concentration of hematocrit and obtaining
a
temperature measurement.
20. An apparatus for implementing threshold based correction functions
comprising:
a biosensor for receiving a sample;

-15-
a processor coupled to said biosensor;
said processor responsive to said biosensor for receiving the sample
for obtaining a primary measurement of an analyte value;
said processor for obtaining a secondary measurement of a secondary
effect;
said processor for comparing said secondary measurement of the
secondary effect with a threshold value;
said processor responsive to said compared values, for identifying a
correction function from a plurality of potential correction functions based
on
said compared values; and
said processor for applying said identified correction function to said
primary measurement to provide a corrected analyte value.
21. The apparatus for implementing threshold based correction functions
as recited in claim 20 includes stored correction curves used by said
processor for
identifying said correction function; said correction curves representing
characteristics of said secondary measurement of the secondary effect.
22. The apparatus for implementing threshold based correction functions
as recited in claim 20 wherein said processor is responsive to identifying
said
secondary measurement of the secondary effect less than or equal to said
threshold
value, for identifying a first coefficient A, said first coefficient A being
used to control
magnitude of said correction function.
23. The apparatus for implementing threshold based correction functions
as recited in claim 22 wherein said processor is responsive to identifying
said
secondary measurement of the secondary effect greater than said threshold
value,
for identifying a second coefficient l, said second coefficient l being used
to control
magnitude of said correction function.
24. An apparatus for implementing threshold based correction functions
comprising:
a biosensor for receiving a sample;

-16-
a processor coupled to said biosensor, said processor responsive to
said biosensor for receiving the sample for obtaining a primary measurement
of an analyte value;
said processor for obtaining a secondary measurement of a secondary
effect;
said processor for comparing said secondary measurement of the
secondary effect with a threshold value;
said processor responsive to said compared values, for selecting a
correction function from a plurality of potential correction functions based
on
said compared values, said selected correction function using at least one
coefficient value, said at least one coefficient value being dependent upon
said primary measurement of said analyte value; and
said processor for applying said identified correction function to said
primary measurement to provide a corrected analyte value.
25. The method of claim 1, wherein a first correction function is
identified in
response to the secondary measurement being above the threshold value and a
second correction function is identified in response to the secondary
measurement
being below the threshold value, the first correction function being different
from the
second correction function.
26. The method of claim 25, wherein the first correction and the second
correction function include predetermined coefficients, the first function
having
different predetermined coefficients than the second correction function.
27. The method of claim 1, wherein the primary measurement of the
analyte value is obtained via a plurality of electrodes of the biosensor.
28. The method of claim 1, wherein the primary measurement of the
analyte value is obtained via one or more optical components of the biosensor.
29. The method of claim 1, further comprising displaying, via a display
device, a test result based on the corrected analyte value.

-17-
30. The method of claim 1, wherein the step of obtaining a secondary
measurement of a secondary effect includes obtaining a temperature measurement

via a temperature sensor.
31. The method of claim 30, wherein the temperature sensor is a
thermistor.
32. The method of claim 1, wherein the step of obtaining a secondary
measurement of a secondary effect includes obtaining a resistance measurement
of
a sample fluid via a meter.
33. The apparatus of claim 20, wherein the biosensor includes a plurality
of
electrodes for determining the primary measurement of the analyte value.
34. The apparatus of claim 20, wherein the biosensor includes one or more
optical components for determining the primary measurement of the analyte
value.
35. The apparatus of claim 20, further comprising a display device for
displaying a test result based on the corrected analyte value.
36. The apparatus of claim 20, further comprising a temperature sensor
configured to measure a temperature, the temperature being the secondary
effect,
the temperature sensor being coupled to the processor such that the processor
obtains the secondary measurement of the secondary effect from the temperature

sensor.
37. The apparatus of claim 36, wherein the temperature sensor is a
thermistor.
38. The apparatus of claim 24, wherein the biosensor includes a plurality
of
electrodes for determining the primary measurement of the analyte value.

-18-
39. The apparatus of claim 24, wherein the biosensor includes one or more
optical components for determining the primary measurement of the analyte
value.
40. The apparatus of claim 24, further comprising a display device for
displaying a test result based on the corrected analyte value.
41. The apparatus of claim 24, further comprising a temperature sensor
configured to measure a temperature, the temperature being the secondary
effect,
the temperature sensor being communicatively coupled to the processor such
that
the processor obtains the secondary measurement of the secondary effect from
the
temperature sensor.
42. The apparatus of claim 41, wherein the temperature sensor is a
thermistor.
43. An apparatus for determining an analyte concentration, comprising:
a biosensor configured to receive a fluid sample, the biosensor
including a plurality of electrodes for measuring a primary measurement of an
analyte value in the fluid sample;
a sensor for measuring a secondary measurement of a secondary
effect;
a processor coupled to said biosensor,
a memory storing program data, which when executed by the
processor, cause the processor to:
obtain the primary measurement of the analyte value in the fluid
sample;
obtain the secondary measurement of the secondary effect;
compare said secondary measurement of the secondary effect with a
threshold value;
select a correction function from a plurality of potential correction
functions based on said compared values; and
apply said identified correction function to said primary measurement to
determine a corrected analyte value.

-19-
44. The apparatus of claim 43, further comprising a display device, wherein

the processor, executing the program data, further causes the display device
to
display a test result based on the determined corrected analyte value.
45. The apparatus of claim 43, wherein the sensor is configured to
measure a temperature effect.
46. The apparatus of claim 43, wherein the sensor is configured to
measure a hematocrit effect.
47. The apparatus of claim 43, wherein the sensor is configured to
measure a Hemoglobin effect.
48. The apparatus of claim 43, wherein said selected correction function
includes at least one coefficient value dependent upon said primary
measurement of
said analyte value.
49. The apparatus of claim 43, wherein the processor selects the
correction function by identifying said secondary measurement of the secondary

effect less than or equal to said threshold value, identifying a first
coefficient A, said
first coefficient A to control magnitude of said correction function.
50. The apparatus of claim 49 further wherein the program data, when
executed by the processor, further causes the processor to calculate said
correction
function represented by
Cn = F *T + A * (Tc - T) + H,
where T represents said secondary measurement of the secondary effect, Tc
represents said threshold value; and F, H are predefined coefficients.
51. The apparatus of claim 50, wherein the processor applies said
identified correction function to said primary measurement to provide a
corrected
analyte value by calculating said corrected analyte value represented by

-20-
Gc = Gn/Cn,
where Gn represent said primary measurement of said analyte value.
52. The apparatus of claim 43, wherein the processor selects the
correction function by identifying said secondary measurement of the secondary

effect greater than said threshold value, identifying a coefficient l, said
coefficient l
being used to control magnitude of said correction function.
53. The apparatus of claim 52, wherein the program data, when executed
by the processor, further causes the processor to calculate said correction
function
represented by
Cn = F * T + l * (T -Tc) + H,
where T represents said secondary measurement of the secondary effect, Tc
represents said threshold value; and F, H are predefined coefficients.
54. The apparatus of claim 53, wherein the processor applies said
identified correction function to said primary measurement to provide a
corrected
analyte value further by calculating said corrected analyte value represented
by
Gc = Gn/Cn,
where Gn represent said primary measurement of said analyte value.
55. The apparatus of claim 43, wherein the step of responsive to said
memory stores a plurality of predefined correction curves for correcting for
an
interference effect, the processor being programmed to select the correction
function
by selecting one of the plurality of predefined correction curves.

Description

Note : Les descriptions sont présentées dans la langue officielle dans laquelle elles ont été soumises.


CA 02557690 2006-08-28
WO 2005/098424
PCT/US2005/011077
-1-
METHOD AND APPARATUS FOR IMPLEMENTING THRESHOLD BASED
CORRECTION FUNCTIONS FOR BIOSENSORS
Field of the Invention
The present invention relates generally to biosensors, and more
particularly, relates to a method and apparatus for implementing threshold
based correction functions for biosensors.
Description of the Related Art
The quantitative determination of analytes in body fluids is of great
importance in the diagnoses and maintenance of certain physiological
abnormalities. For example lactate, cholesterol and bilirubin should be
monitored in certain individuals. In particular, the determination of glucose
in
body fluids is of great importance to diabetic individuals who must frequently
check the level of glucose in their body fluids as a means of regulating the
glucose intake in their diets. While the remainder of the disclosure herein
will
be directed towards the determination of glucose, it is to be understood that
the procedure and apparatus of this invention can be used for the
determination of other analytes upon selection of the appropriate enzyme.
The ideal diagnostic device for the detection of glucose in fluids must be
simple, so as not to require a high degree of technical skill on the part of
the
technician administering the test. In many cases, these tests are
administered by the patient which lends further emphasis to the need for a
test which is easy to carry out. Additionally, such a device should be based
upon elements which are sufficiently stable to meet situations of prolonged
storage.
Methods for determining analyte concentration in fluids can be based
on the electrochemical reaction between an enzyme and the analyte specific
to the enzyme and a mediator which maintains the enzyme in its initial
oxidation state. Suitable redox enzymes include oxidases, dehydrogenases,
catalase and peroxidase. For example, in the case where glucose is the

CA 02557690 2006-08-28
WO 2005/098424
PCT/US2005/011077
-2-
analyte, the reaction with glucose oxidase and oxygen is represented by
equation (A).
cilUcose oxidase (GO)
glucose + 02 > gluconolactone + F1202
(A)
In a colorimetric assay, the released hydrogen peroxide, in the
presence of a peroxidase, causes a color change in a redox indicator which
color change is proportional to the level of glucose in the test fluid. While
colorimetric tests can be made semi-quantitative by the use of color charts
for
comparison of the color change of the redox indicator with the color change
obtained using test fluids of known glucose concentration, and can be
rendered more highly quantitative by reading the result with a
spectrophotometric instrument, the results are generally not as accurate nc.r
are they obtained as quickly as those obtained using an electrochemical
biosensor. As used herein, the term biosensor system refer to an analytical
device that responds selectively to analytes in an appropriate sample and
converts their concentration into an electrical signal via a combination of a
biological recognition signal and a physico-chemical transducer.
H202 ______________________________ >02 + 2H+ + 2e"
(B)
The electron flow is then converted to the electrical signal which directly
correlates to the glucose concentration.
In the initial step of the reaction represented by equation (A), glucose
present in the test sample converts the oxidized flavin adenine dinucleotide
(FAD) center of the enzyme into its reduced form, (FADH2). Because these
redox centers are essentially electrically insulated within the enzyme
molecule, direct electron transfer to the surface of a conventional electrode
does not occur to any measurable degree in the absence of an unacceptably
high overvoltage. An improvement to this system involves the use of a
nonphysiological redox coupling between the electrode and the enzyme to
shuttle electrons between the (FADH2) and the electrode. This is represented

CA 02557690 2006-08-28
WO 2005/098424
PCT/US2005/011077
-3-
by the following scheme in which the redox coupler, typically referred to as a
mediator, is represented by M:
Glucose + GO(FAD) ¨> gluconolactone + GO(FADH2)
GO(FADH2) + 2Mox _______________ > GO(FAD) + 2Mred + 2H+
2Mred __ > 2Mox + 2e- (at the electrode)
In this scheme, GO(FAD) represents the oxidized form of glucose
oxidase and GO(FADH2) indicates its reduced form. The mediating species
Mred shuttles electrons from the reduced enzyme to the electrode thereby
oxidizing the enzyme causing its regeneration in situ which, of course, is
desirable for reasons of economy. The main purpose for using a mediator is
to reduce the working potential of the sensor. An ideal mediator would be re-
oxidized at the electrode at a low potential under which impurity in the
chemical layer and interfering substances in the sample would not be
oxidized thereby minimizing interference.
Many compounds are useful as mediators due to their ability to accept
electrons from the reduced enzyme and transfer them to the electrode.
Among the mediators known to be useful as electron transfer agents in
analytical determinations are the substituted benzo- and naphthoquinones
disclosed in U.S. Patent 4,746,607; the N-oxides, nitroso compounds,
hydroxylamines and oxines specifically disclosed in EP 0 354 441; the flavins,
phenazines, phenothiazines, indophenols, substituted 1,4-benzoquinones and
indamins disclosed in EP 0 330 517 and the phenaziniuni/phenoxazinium
salts described in U.S. Patent 3,791,988. A comprehensive review of
electrochemical mediators of biological redox systems can be found in
AnaMica Clinica Acta. 140 (1982), Pp 1-18.
Among the more venerable mediators is hexacyanoferrate, also known
as ferricyanide, which is discussed by Schlapfer et al in Clinica Chimica
Acta.,
57 (1974), Pp. 283-289. In U.S. Patent 4,929,545 there is disclosed the use
of a soluble ferricyanide compound in combination with a soluble ferric
compound in a composition for enzymatically determining an analyte in a
sample. Substituting the iron salt of ferricyanide for oxygen in equation (A)
provides:

CA 02557690 2006-08-28
WO 2005/098424
PCT/US2005/011077
-4-
Glucose + Fe+++(CN)6 GO > gluconolactone + Fe(ON)6
since the ferricyanide is reduced to ferrocyanide by its acceptance of
electrons from the glucose oxidase enzyme.
Another way of expressing this reaction is by use of the following
equation (C):
Glucose + G0x(ox) ________________ > Gluconalactone + G0x(red)
G0x(red) + 2 Fe(CN3) 3-6 -> GOX(0x) + 2 Fe(CN)4- + 2e
(C)
The electrons released are directly equivalent to the amount of glucose in the
test fluid and can be related thereto by measurement of the current which is
produced through the fluid upon the application of a potential thereto.
Oxidation of the ferrocyanide at the anode renews the cycle.
U.S. patent 6,391,645 to Huang et al., issued May 21, 2002 and
assigned to the present assignee, discloses a method and apparatus for
correcting ambient temperature effect in biosensors. An ambient temperature
value is measured. A sample is applied to the biosensors, then a current
generated in the test sample is measured. An observed analyte concentration
value is calculated from the current through a standard response curve. The
observed analyte concentration is then modified utilizing the measured
ambient temperature value to thereby increase the accuracy of the analyte
determination. The analyte concentration value can be calculated by solving
the following equation:
G2=(G1-(T22-242)*12-(T2-24)*11)/
((T22-242)*S2+(T2-24)*S1+1)
where G1 is said observed analyte concentration value, T2 is said measured
ambient temperature value and 11, 12, S1, and S2 are predetermined
parameters.

CA 02557690 2006-08-28
WO 2005/098424
PCT/US2005/011077
-5-
While the method and apparatus disclosed by U.S. patent 6,391,645
provided improvements in the accuracy of the analyte determination, a need
exists for an improved correction mechanism and that can be applied to any
system that measures an analyte concentration.
As used in the following specification and claims, the term biosensor
means an electrochemical sensor strip or sensor element of an analytical
device or biosensor system that responds selectively to an analyte in an
appropriate sample and converts their concentration into an electrical signal.

The biosensor generates an electrical signal directly, facilitating a simple
instrument design. Also, a biosensor offers the advantage of low material
cost since a thin layer of chemicals is deposited on the electrodes and little

material is wasted.
The term sample is defined as a composition containing an unknown
amount of the analyte of interest. Typically, a sample for electrochemical
analysis is in liquid form, and preferably the sample is an aqueous mixture. A
sample may be a biological sample, such as blood, urine or saliva. A sample
may be a derivative of a biological sample, such as an extract, a dilution, a
filtrate, or a reconstituted precipitate.
The term analyte is defined as a substance in a sample, the presence
or amount of which is to be determined. An analyte interacts with the
oxidoreductase enzyme present during the analysis, and can be a substrate
for the oxidoreductase, a coenzyme, or another substance that affects the
interaction between the oxidoreductase and its substrate.
Summary of the Invention
Important aspects of the present invention are to provide a new and
improved biosensor system for determining the presence or amount of a
substance in a sample including a method and apparatus for implementing
threshold based correction functions for biosensors.
In brief, a method and apparatus are provided for implementing
threshold based correction functions for biosensors. A sample is applied to
the biosensor and a primary measurement of an analyte value is obtained. A

CA 02557690 2006-08-28
WO 2005/098424
PCT/US2005/011077
-6-
secondary measurement of a secondary effect is obtained and is compared
with a threshold value. A correction function is identified responsive to the
compared values. The correction function is applied to the primary
measurement of the analyte value to provide a corrected analyte value.
In accordance with features of the invention, the correction method
uses correction curves that are provided to correct for an interference
effect.
The correction curves can be linear or non-linear. The correction method
provides different correction functions above and below the threshold value.
The correction functions may be dependent or independent of the primary
measurement that is being corrected. The correction functions may be either
linear or nonlinear.
In accordance with features of the invention, the secondary
measurement of a secondary effect includes a plurality of effects that are use

separately or together in combination to identify the correction function. For
example, the secondary effects include temperature, Hemoglobin, and the
concentration of hematocrit of a blood sample that are identified and used to
minimize the interference of the secondary effects on the accuracy of the
reported results.
Brief Description of the Drawing
The present invention together with the above and other objects and
advantages may best be understood from the following detailed description of
the preferred embodiments of the invention illustrated in the drawings,
wherein:
FIG. 1 is a block diagram representation of biosensor system in
.. accordance with the present invention;
FIG. 2 is a flow chart illustrating exemplary logical steps performed in
accordance with the present invention of the method for implementing
threshold based correction of secondary effects, such as correcting ambient
temperature effect, in the biosensor system of FIG. 1; and

CA 02557690 2006-08-28
WO 2005/098424
PCT/US2005/011077
-7-
FIGS. 3 and 4 are graphs of exemplary stored correction curves
illustrating corrections characteristics in accordance with the present
invention.
Detailed Description of the Preferred Embodiments
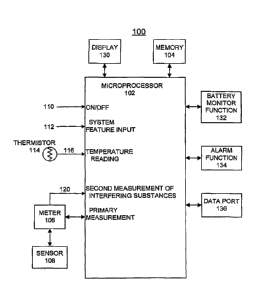
Having reference now to the drawings, in FIG. 1 there is shown a block
diagram representation of biosensor system designated as a whole by the
reference character 100 and arranged in accordance with principles of the
present invention. Biosensor system 100 includes a microprocessor 102
together with an associated memory 104 for storing program and user data
and correction curves for implementing threshold based correction of
secondary effects in accordance with the present invention. A meter function
106 coupled to a biosensor 108 is operatively controlled by the
microprocessor 102 for recording test values, such as blood glucose test
values. An ON/OFF input at a line 110 responsive to the user ON/OFF input
operation is coupled to the microprocessor 102 for performing the blood test
sequence mode of biosensor system 100. A system features input at a line
112 responsive to a user input operation is coupled to the microprocessor 102
for selectively performing the system features mode of biosensor 100. A
thermistor 114 provides a temperature signal input indicated at a line 116 is
coupled to the microprocessor 102 for detecting interfering effects, for
example, the temperature information for the sensor 108 in accordance with
the invention. A signal input indicated at a line 120 is coupled to the
microprocessor 102 for a second measure of interfering substances, for
example, Hemoglobin, optionally provided by the meter function 106.
A display 130 is coupled to the microprocessor 102 for displaying
information to the user including test results. A battery monitor function 132
is
coupled to the microprocessor 102 for detecting a low or dead battery
condition. An alarm function 134 is coupled to the microprocessor 102 for
detecting predefined system conditions and for generating alarm indications
for the user of biosensor system 100. A data port or communications
interface 136 is provided for coupling data to and from a connected computer
(not shown). Microprocessor 102 contains suitable programming to perform
the methods of the invention as illustrated in FIG. 2.

CA 02557690 2006-08-28
WO 2005/098424
PCT/US2005/011077
-8-
Biosensor system 100 is shown in simplified form sufficient for
understanding the present invention. The illustrated biosensor system 100 is
not intended to imply architectural or functional limitations. The present
invention can be used with various hardware implementations and systems.
In accordance with the invention, biosensor system 100 performs a
correction method of the preferred embodiment, for example, to reduce the
temperature bias having a general form as shown in the following TABLE 1
and as illustrated and described with respect to FIG. 2. This invention
provides an algorithmic correction method that advantageously improves the
accuracy of diagnostic chemistry tests by correcting for secondary effects,
such as interfering substances or temperature effects.
It should be understood that the present invention can be applied to
any system, electrochemical or optical, that measures an analyte
concentration as a primary measurement and then uses a second measure of
interfering substances, for example, Hemoglobin, or interfering effects for
example, temperature, to compensate for the secondary effect and improve
the accuracy of the reported result.
It is also desirable to minimize the interference from hematocrit or
volume fraction of erythrocytes on the accuracy of the reported results. The
conductivity or impedance of whole blood is dependent on the concentration
of hematocrit. Meter function 120 can be used to measure the resistance of
the sample fluid at signal input line 120 and the measured value
advantageously used to correct for the effect of hematocrit on the reported
result. For example, the measured resistance advantageously is used to
estimate the concentration of hematocrit of a blood sample and then to
correct the measurement for hematocrit effect for determining the
concentration of a substance of interest in blood. This invention provides an
algorithmic correction method that advantageously improves the accuracy of
diagnostic chemistry tests by correcting for secondary effects including
interference from hematocrit and temperature effects.
In accordance with the invention, the algorithmic correction method
uses correction curves, for example, as illustrated and described with respect

to FIGS. 3 and 4, that can be tailored to correct for any well-defined

CA 02557690 2006-08-28
WO 2005/098424
PCT/US2005/011077
-9-
interference effect. The correction curves can be linear or non-linear. The
algorithmic correction method has characteristics that can be modified by
changing only the equation coefficients as follows. First, different
correction
functions can be provided above and below a threshold. Second, the
correction functions may be dependent or independent of the primary
measurement that is being corrected. Third, functions used for correction
may be either linear or nonlinear.
TABLE 1: General Correction Algorithm Form
Step 1. Obtain primary measurement (Gn).
Step 2. Obtain secondary measurement used to correct Gn(T)
Step3A If Tc then:
1. A = f(Gn)
2. Cn = F * T + A * (Tc - T) + H
Step 3B If T > Tc then:
3. I = f2(GN)
4. Cn = F*T + I*(T-Tc) + H
5. Gc = (GN Cn)
Where:
Gn = Uncorrected measurement of analyte concentration;
T = Secondary measurement used to correct primary measurement;
Tc = Decision point or threshold, secondary measurements greater of less
than threshold advantageously can use different correction functions;
Gc = Final corrected result; and
A, I, F, H, are coefficients that control magnitude of correction lines or
define
correction curves.
Referring now to FIG. 2, there are shown exemplary logical steps
performed in accordance with the present invention of the method for
implementing threshold based correction of secondary effects, such as
correcting ambient temperature effect, in the biosensor system 100. A strip is
inserted as indicated in a block 200 and then waiting for a sample to be
applied is performed as indicated in a block 202. A primary measurement Gn
is obtained as indicated in a block 204. Then a secondary measurement T to
be used for correction Gn(T) is obtained as indicated in a block 206. The

CA 02557690 2012-08-01
-10-
secondary measurement T is compared with the threshold value To as
indicated in a decision block 208, If the secondary measurement T is less
than or equal to the threshold value Tc, then a coefficient A to control
magnitude of the correction is identified as indicated in a block 210, where
A = f(Gn). Then a correction Cn is calculated as indicated in a block 210,
where Cn = F * T + A* (Tc - T) H. Otherwise If the secondary
measurement T is greater than the threshold value To, then a coefficient I to
control magnitude of the correction is identified as indicated in a block 214,

where I = f2(Gn). Then a correction Cn is calculated as indicated in a block
.. 216, where Cn = F*T I*(T-Tc) + H. A final corrected result Go is calculated
as indicated in a block 218, where Go = Gn/Cn to complete the correction
algorithm as indicated in a block 220.
Referring now to FIGS. 3 and 4, there are shown respective first and
second examples generally designated by reference characters 300 and 400
illustrating exemplary theoretical lines of correction. In FIGS. 3 and 4, a
percentage (%) correction is illustrated relative to a vertical axis and a
secondary measurement T is illustrated relative to a horizontal axis. A
threshold value To is indicated by a line labeled To.
FIG. 3 illustrates isometric correction lines at different primary
measurement concentrations Gn where the correction is dependent on the
primary measurement concentrations Gn. As shown in the example 300 in
FIG. 3, the magnitude of the correction Cn changes with analyte
concentration Gn when the secondary measurement T is above or below the
threshold Tc. FIG. 4 illustrates isometric correction lines at different
primary
measurement concentrations Gn where the correction is dependent on the
primary measurement concentrations Gn above the threshold value Tc and is
constant and independent of the primary measurement concentrations Gn
below and equal to the threshold value Tc.
The scope of the claims should not be limited by the preferred
embodiments, but should be given the broadest interpretation consistent
with the Description as a whole.

Dessin représentatif
Une figure unique qui représente un dessin illustrant l'invention.
États administratifs

Pour une meilleure compréhension de l'état de la demande ou brevet qui figure sur cette page, la rubrique Mise en garde , et les descriptions de Brevet , États administratifs , Taxes périodiques et Historique des paiements devraient être consultées.

États administratifs

Titre Date
Date de délivrance prévu 2022-04-12
(86) Date de dépôt PCT 2005-03-31
(87) Date de publication PCT 2005-10-20
(85) Entrée nationale 2006-08-28
Requête d'examen 2010-03-05
(45) Délivré 2022-04-12

Historique d'abandonnement

Il n'y a pas d'historique d'abandonnement

Taxes périodiques

Dernier paiement au montant de 473,65 $ a été reçu le 2023-03-24


 Montants des taxes pour le maintien en état à venir

Description Date Montant
Prochain paiement si taxe applicable aux petites entités 2024-04-02 253,00 $
Prochain paiement si taxe générale 2024-04-02 624,00 $

Avis : Si le paiement en totalité n'a pas été reçu au plus tard à la date indiquée, une taxe supplémentaire peut être imposée, soit une des taxes suivantes :

  • taxe de rétablissement ;
  • taxe pour paiement en souffrance ; ou
  • taxe additionnelle pour le renversement d'une péremption réputée.

Les taxes sur les brevets sont ajustées au 1er janvier de chaque année. Les montants ci-dessus sont les montants actuels s'ils sont reçus au plus tard le 31 décembre de l'année en cours.
Veuillez vous référer à la page web des taxes sur les brevets de l'OPIC pour voir tous les montants actuels des taxes.

Historique des paiements

Type de taxes Anniversaire Échéance Montant payé Date payée
Le dépôt d'une demande de brevet 400,00 $ 2006-08-28
Taxe de maintien en état - Demande - nouvelle loi 2 2007-04-02 100,00 $ 2007-04-02
Taxe de maintien en état - Demande - nouvelle loi 3 2008-03-31 100,00 $ 2008-03-06
Taxe de maintien en état - Demande - nouvelle loi 4 2009-03-31 100,00 $ 2009-03-26
Requête d'examen 800,00 $ 2010-03-05
Taxe de maintien en état - Demande - nouvelle loi 5 2010-03-31 200,00 $ 2010-03-08
Taxe de maintien en état - Demande - nouvelle loi 6 2011-03-31 200,00 $ 2011-03-11
Taxe de maintien en état - Demande - nouvelle loi 7 2012-04-02 200,00 $ 2012-03-16
Taxe de maintien en état - Demande - nouvelle loi 8 2013-04-02 200,00 $ 2013-03-11
Taxe de maintien en état - Demande - nouvelle loi 9 2014-03-31 200,00 $ 2014-03-28
Taxe de maintien en état - Demande - nouvelle loi 10 2015-03-31 250,00 $ 2015-03-04
Taxe de maintien en état - Demande - nouvelle loi 11 2016-03-31 250,00 $ 2016-03-04
Enregistrement de documents 100,00 $ 2017-02-28
Taxe de maintien en état - Demande - nouvelle loi 12 2017-03-31 250,00 $ 2017-03-20
Taxe de maintien en état - Demande - nouvelle loi 13 2018-04-03 250,00 $ 2018-03-06
Taxe de maintien en état - Demande - nouvelle loi 14 2019-04-01 250,00 $ 2019-03-12
Taxe de maintien en état - Demande - nouvelle loi 15 2020-03-31 450,00 $ 2020-04-01
Taxe de maintien en état - Demande - nouvelle loi 16 2021-03-31 459,00 $ 2021-05-21
Surtaxe pour omission de payer taxe de maintien en état pour demande 2021-05-21 150,00 $ 2021-05-21
Taxe finale 2022-05-12 305,39 $ 2022-01-28
Taxe de maintien en état - Demande - nouvelle loi 17 2022-03-31 458,08 $ 2022-03-25
Taxe de maintien en état - brevet - nouvelle loi 18 2023-03-31 473,65 $ 2023-03-24
Titulaires au dossier

Les titulaires actuels et antérieures au dossier sont affichés en ordre alphabétique.

Titulaires actuels au dossier
ASCENSIA DIABETES CARE HOLDINGS AG
Titulaires antérieures au dossier
BAYER HEALTHCARE LLC
MECKLENBURG, GEORGE A.
Les propriétaires antérieurs qui ne figurent pas dans la liste des « Propriétaires au dossier » apparaîtront dans d'autres documents au dossier.
Documents

Pour visionner les fichiers sélectionnés, entrer le code reCAPTCHA :


Pour visualiser une image, cliquer sur un lien dans la colonne description du document. Pour télécharger l'image (les images), cliquer l'une ou plusieurs cases à cocher dans la première colonne et ensuite cliquer sur le bouton "Télécharger sélection en format PDF (archive Zip)" ou le bouton "Télécharger sélection (en un fichier PDF fusionné)".

Liste des documents de brevet publiés et non publiés sur la BDBC .

Si vous avez des difficultés à accéder au contenu, veuillez communiquer avec le Centre de services à la clientèle au 1-866-997-1936, ou envoyer un courriel au Centre de service à la clientèle de l'OPIC.


Description du
Document 
Date
(yyyy-mm-dd) 
Nombre de pages   Taille de l'image (Ko) 
Demande d'examen 2021-03-12 3 157
Modification 2021-07-09 25 927
Revendications 2021-07-09 10 389
Taxe finale 2022-01-28 4 101
Dessins représentatifs 2022-03-11 1 7
Page couverture 2022-03-11 1 46
Certificat électronique d'octroi 2022-04-12 1 2 527
Abrégé 2006-08-28 2 78
Revendications 2006-08-28 5 226
Dessins 2006-08-28 4 59
Description 2006-08-28 10 503
Dessins représentatifs 2006-10-24 1 8
Page couverture 2006-10-26 1 46
Description 2012-08-01 10 506
Revendications 2012-08-01 6 253
Revendications 2014-11-10 9 382
Poursuite-Amendment 2010-03-05 2 64
PCT 2006-08-28 3 123
Cession 2006-08-28 3 92
Correspondance 2006-10-20 1 28
Correspondance 2006-11-21 1 44
Taxes 2007-04-02 2 85
Correspondance 2007-11-20 2 35
Correspondance 2007-11-13 3 76
Taxes 2009-03-26 1 45
Poursuite-Amendment 2012-02-06 2 71
Poursuite-Amendment 2012-08-01 12 493
Poursuite-Amendment 2014-11-10 14 602
Poursuite-Amendment 2014-05-09 2 111